
Development of a Modified QuEChERS Method Coupled with LC-MS/MS for Determination of Spinetoram Residue in Soybean (Glycine max) and Cotton (Gossypium hirsutum)

Abstract
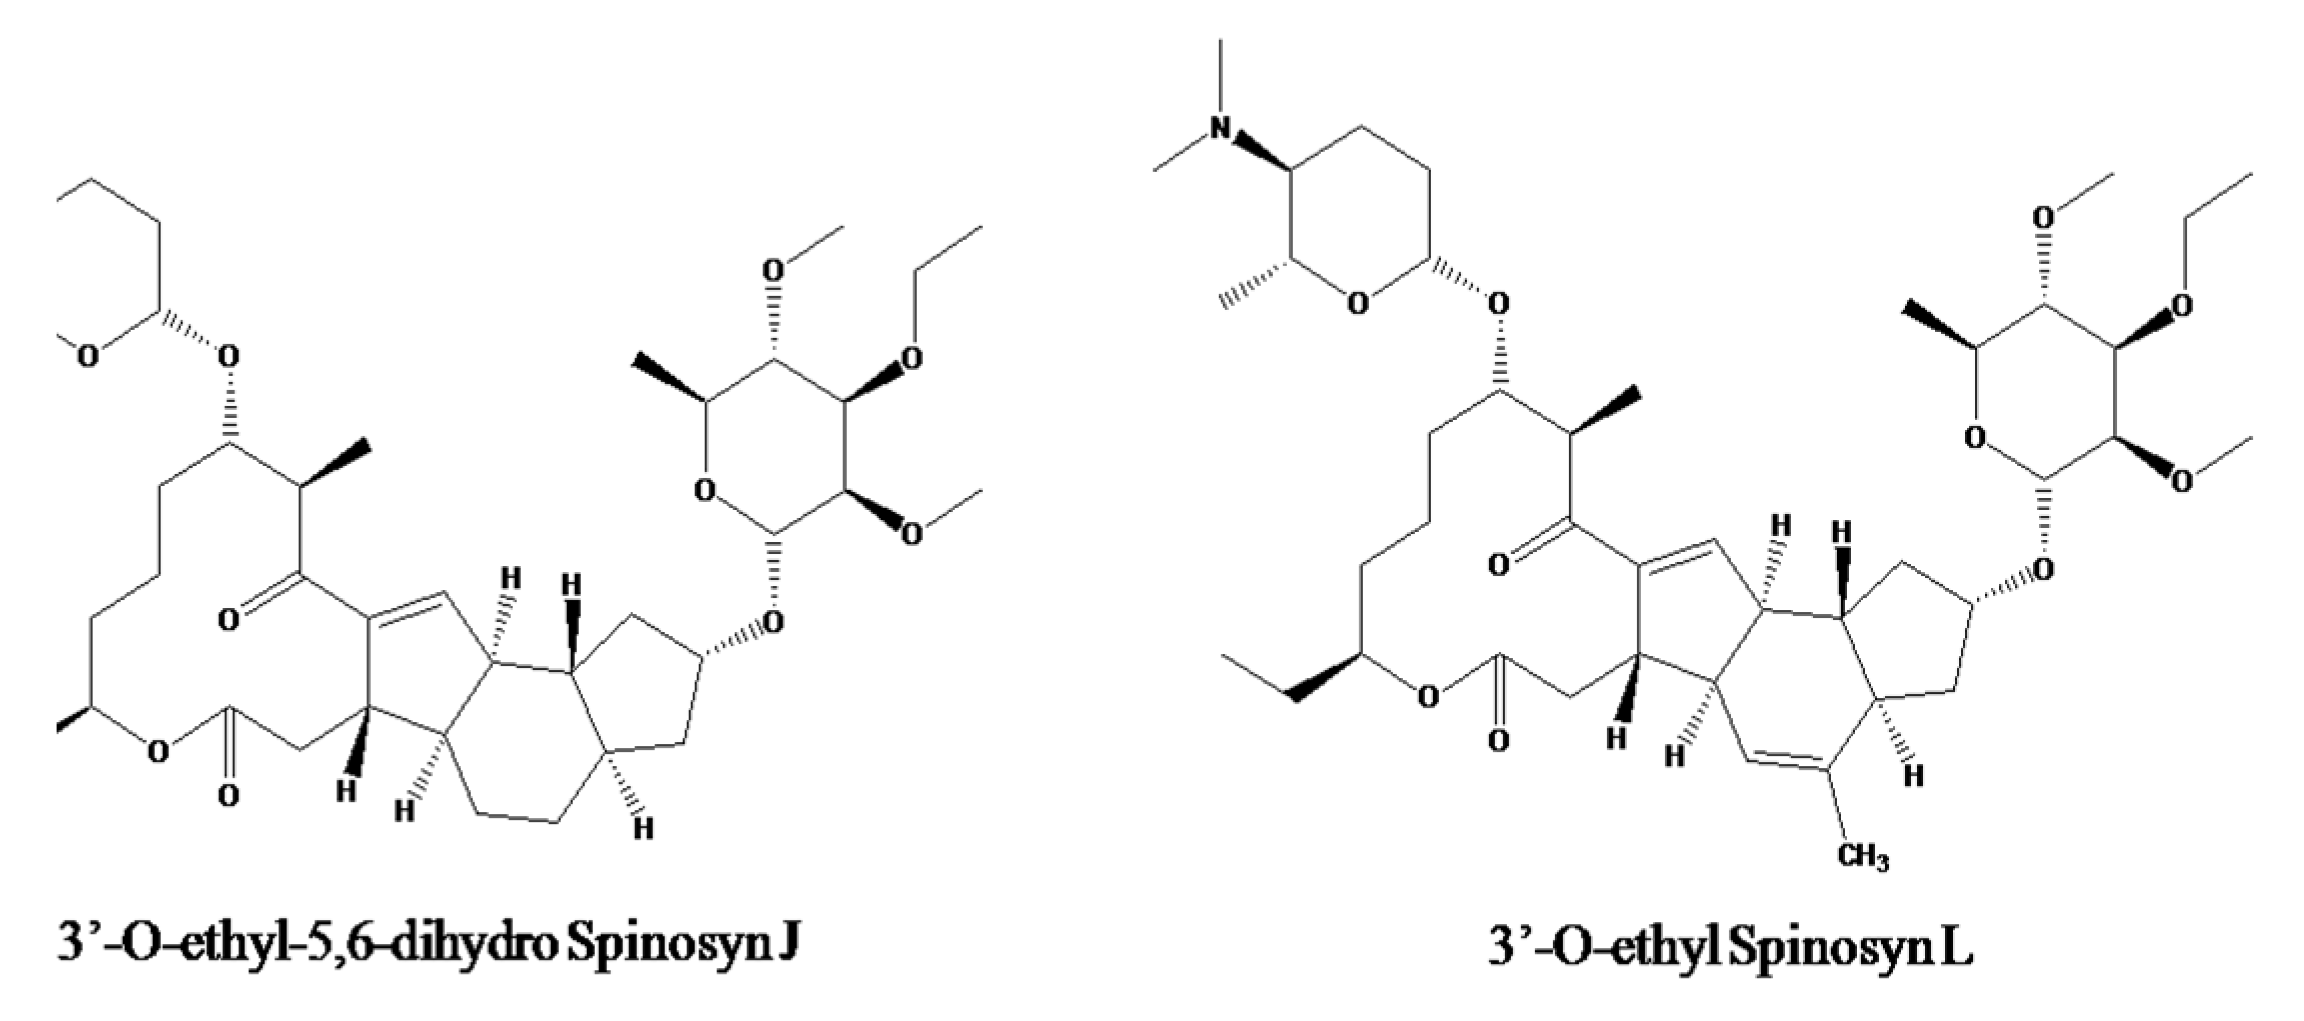
:1. Introduction
2. Materials and Methods
2.1. Apparatus
2.2. Reagents
2.3. Preparation of Standard Solution
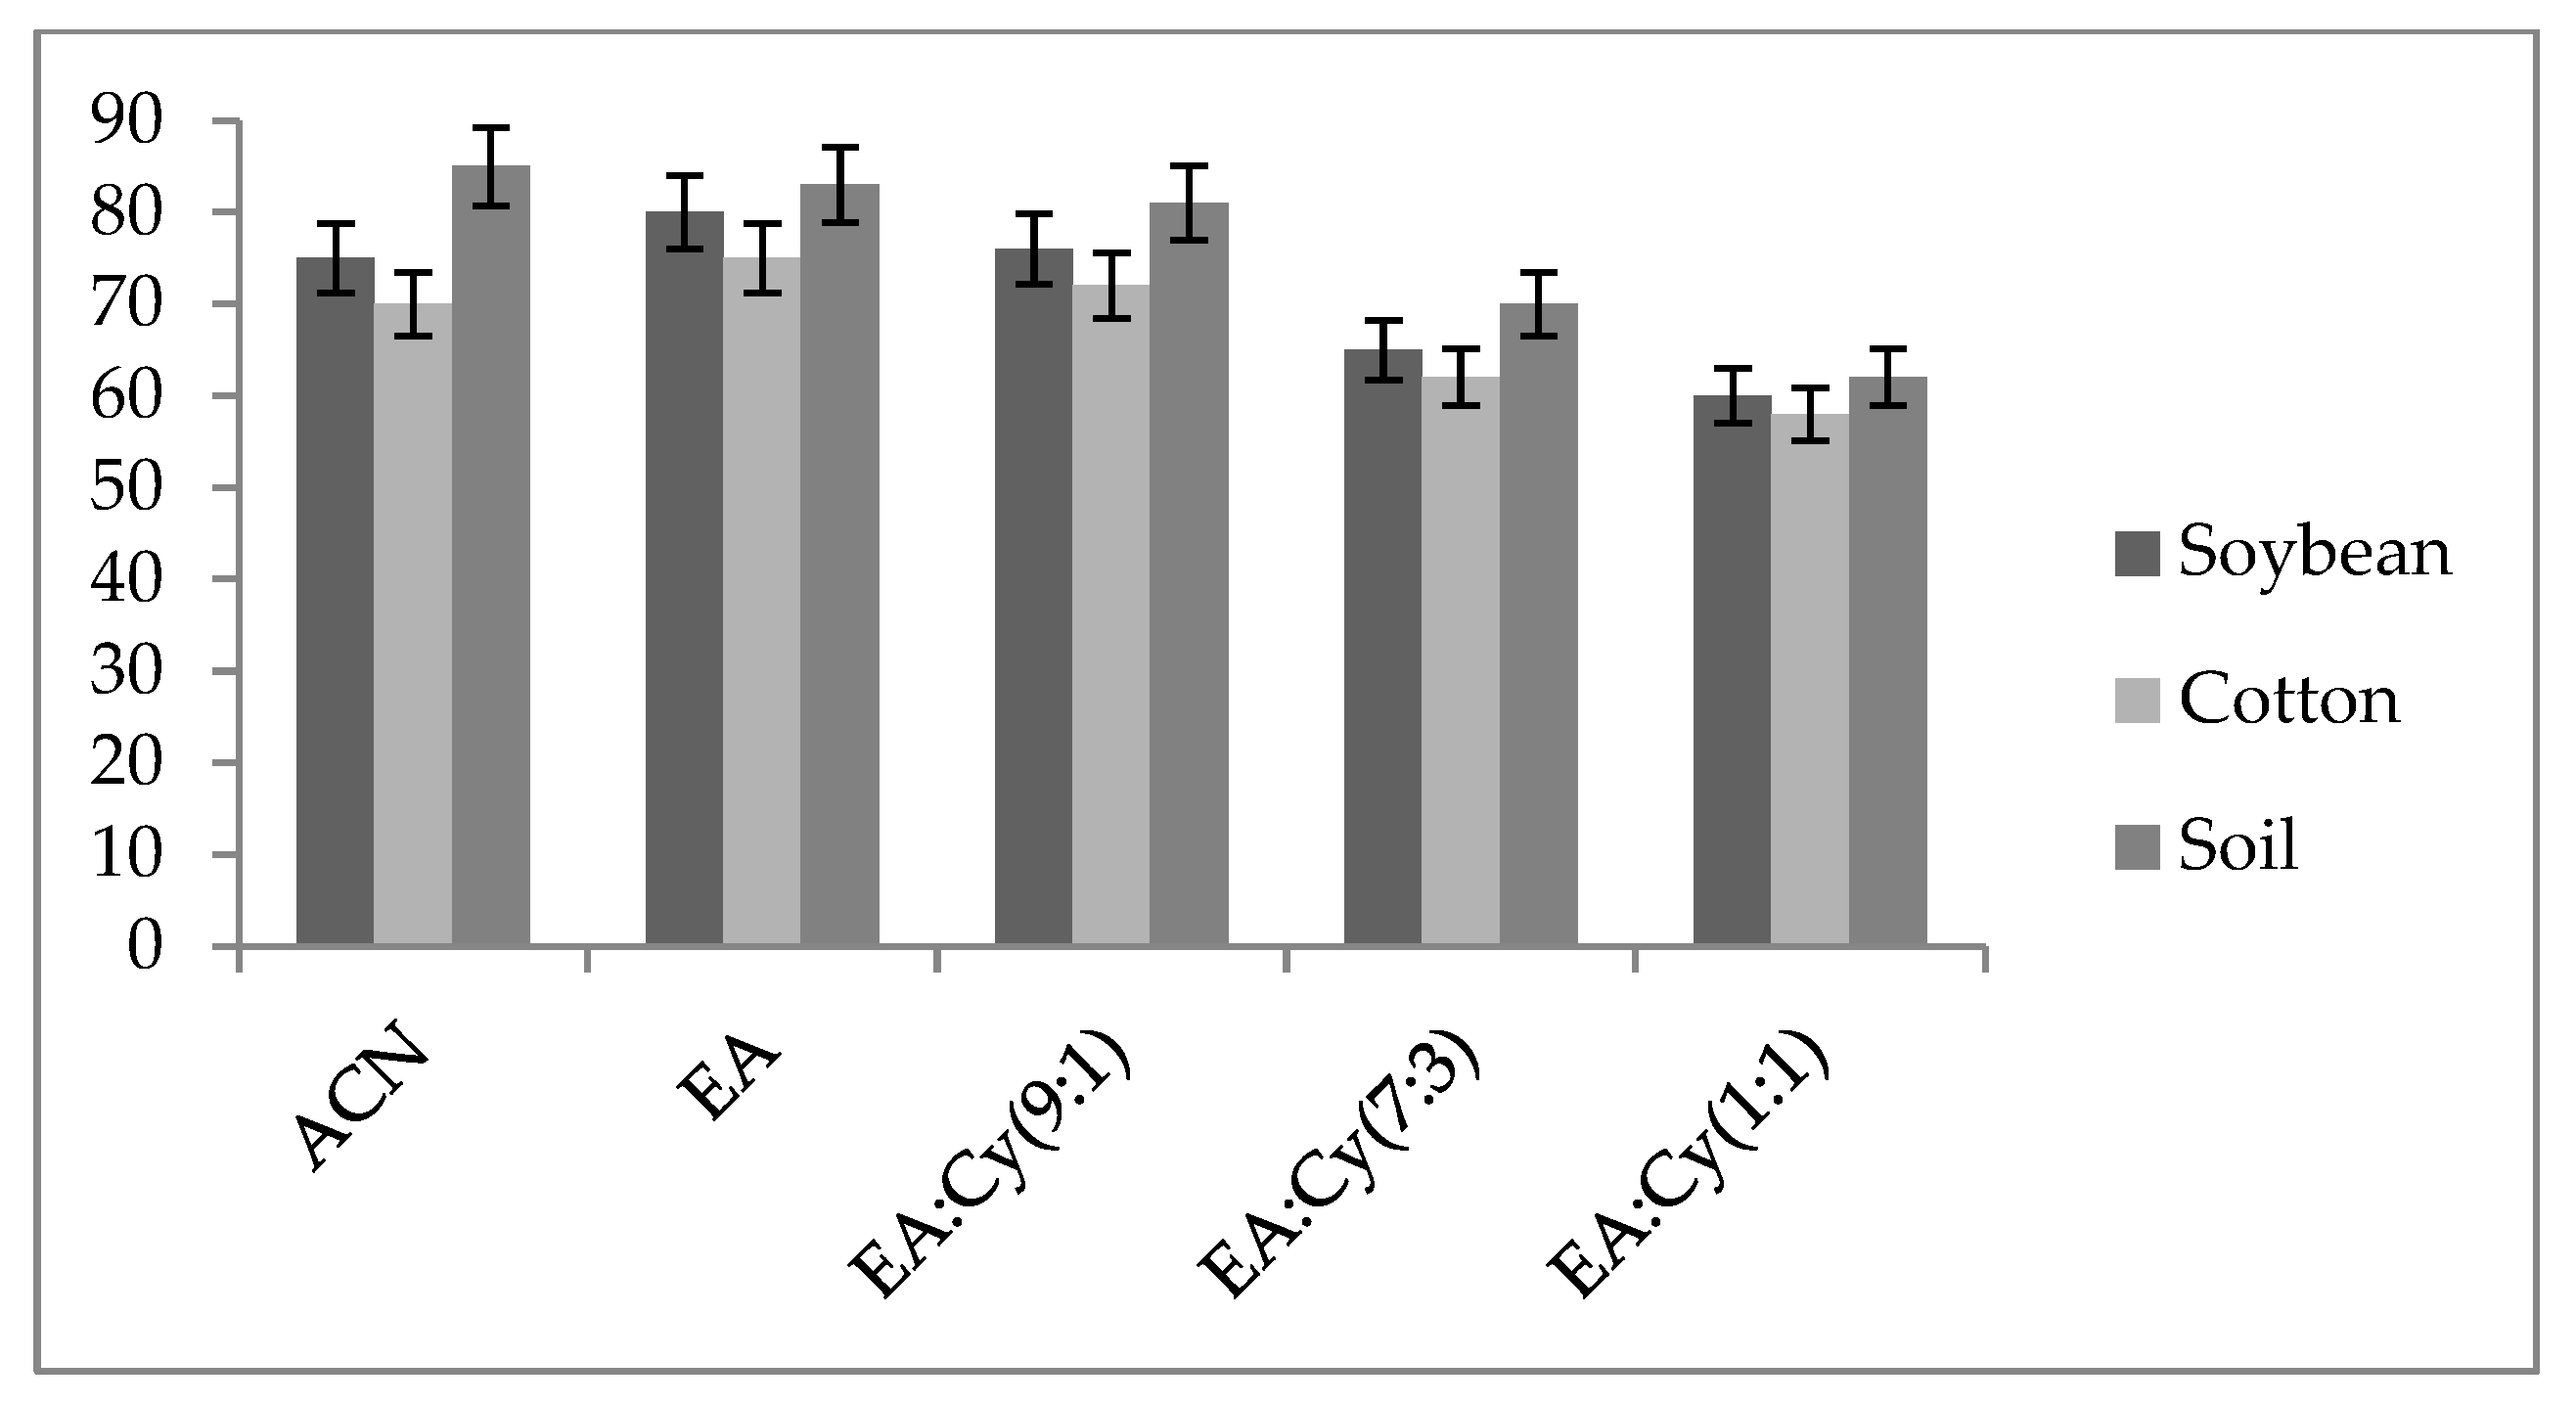
2.4. Screening of Extracting Solvents and Adsorbents
2.5. Field Experiment
2.5.1. Soybean
2.5.2. Cotton
2.6. Sample Extraction and Clean-Up Procedure
2.6.1. Soybean, Cotton Plant and Soil
2.6.2. Soybean and Cotton Oil
2.6.3. Soybean and Cotton De-Oil Cake
2.6.4. Cotton Lint
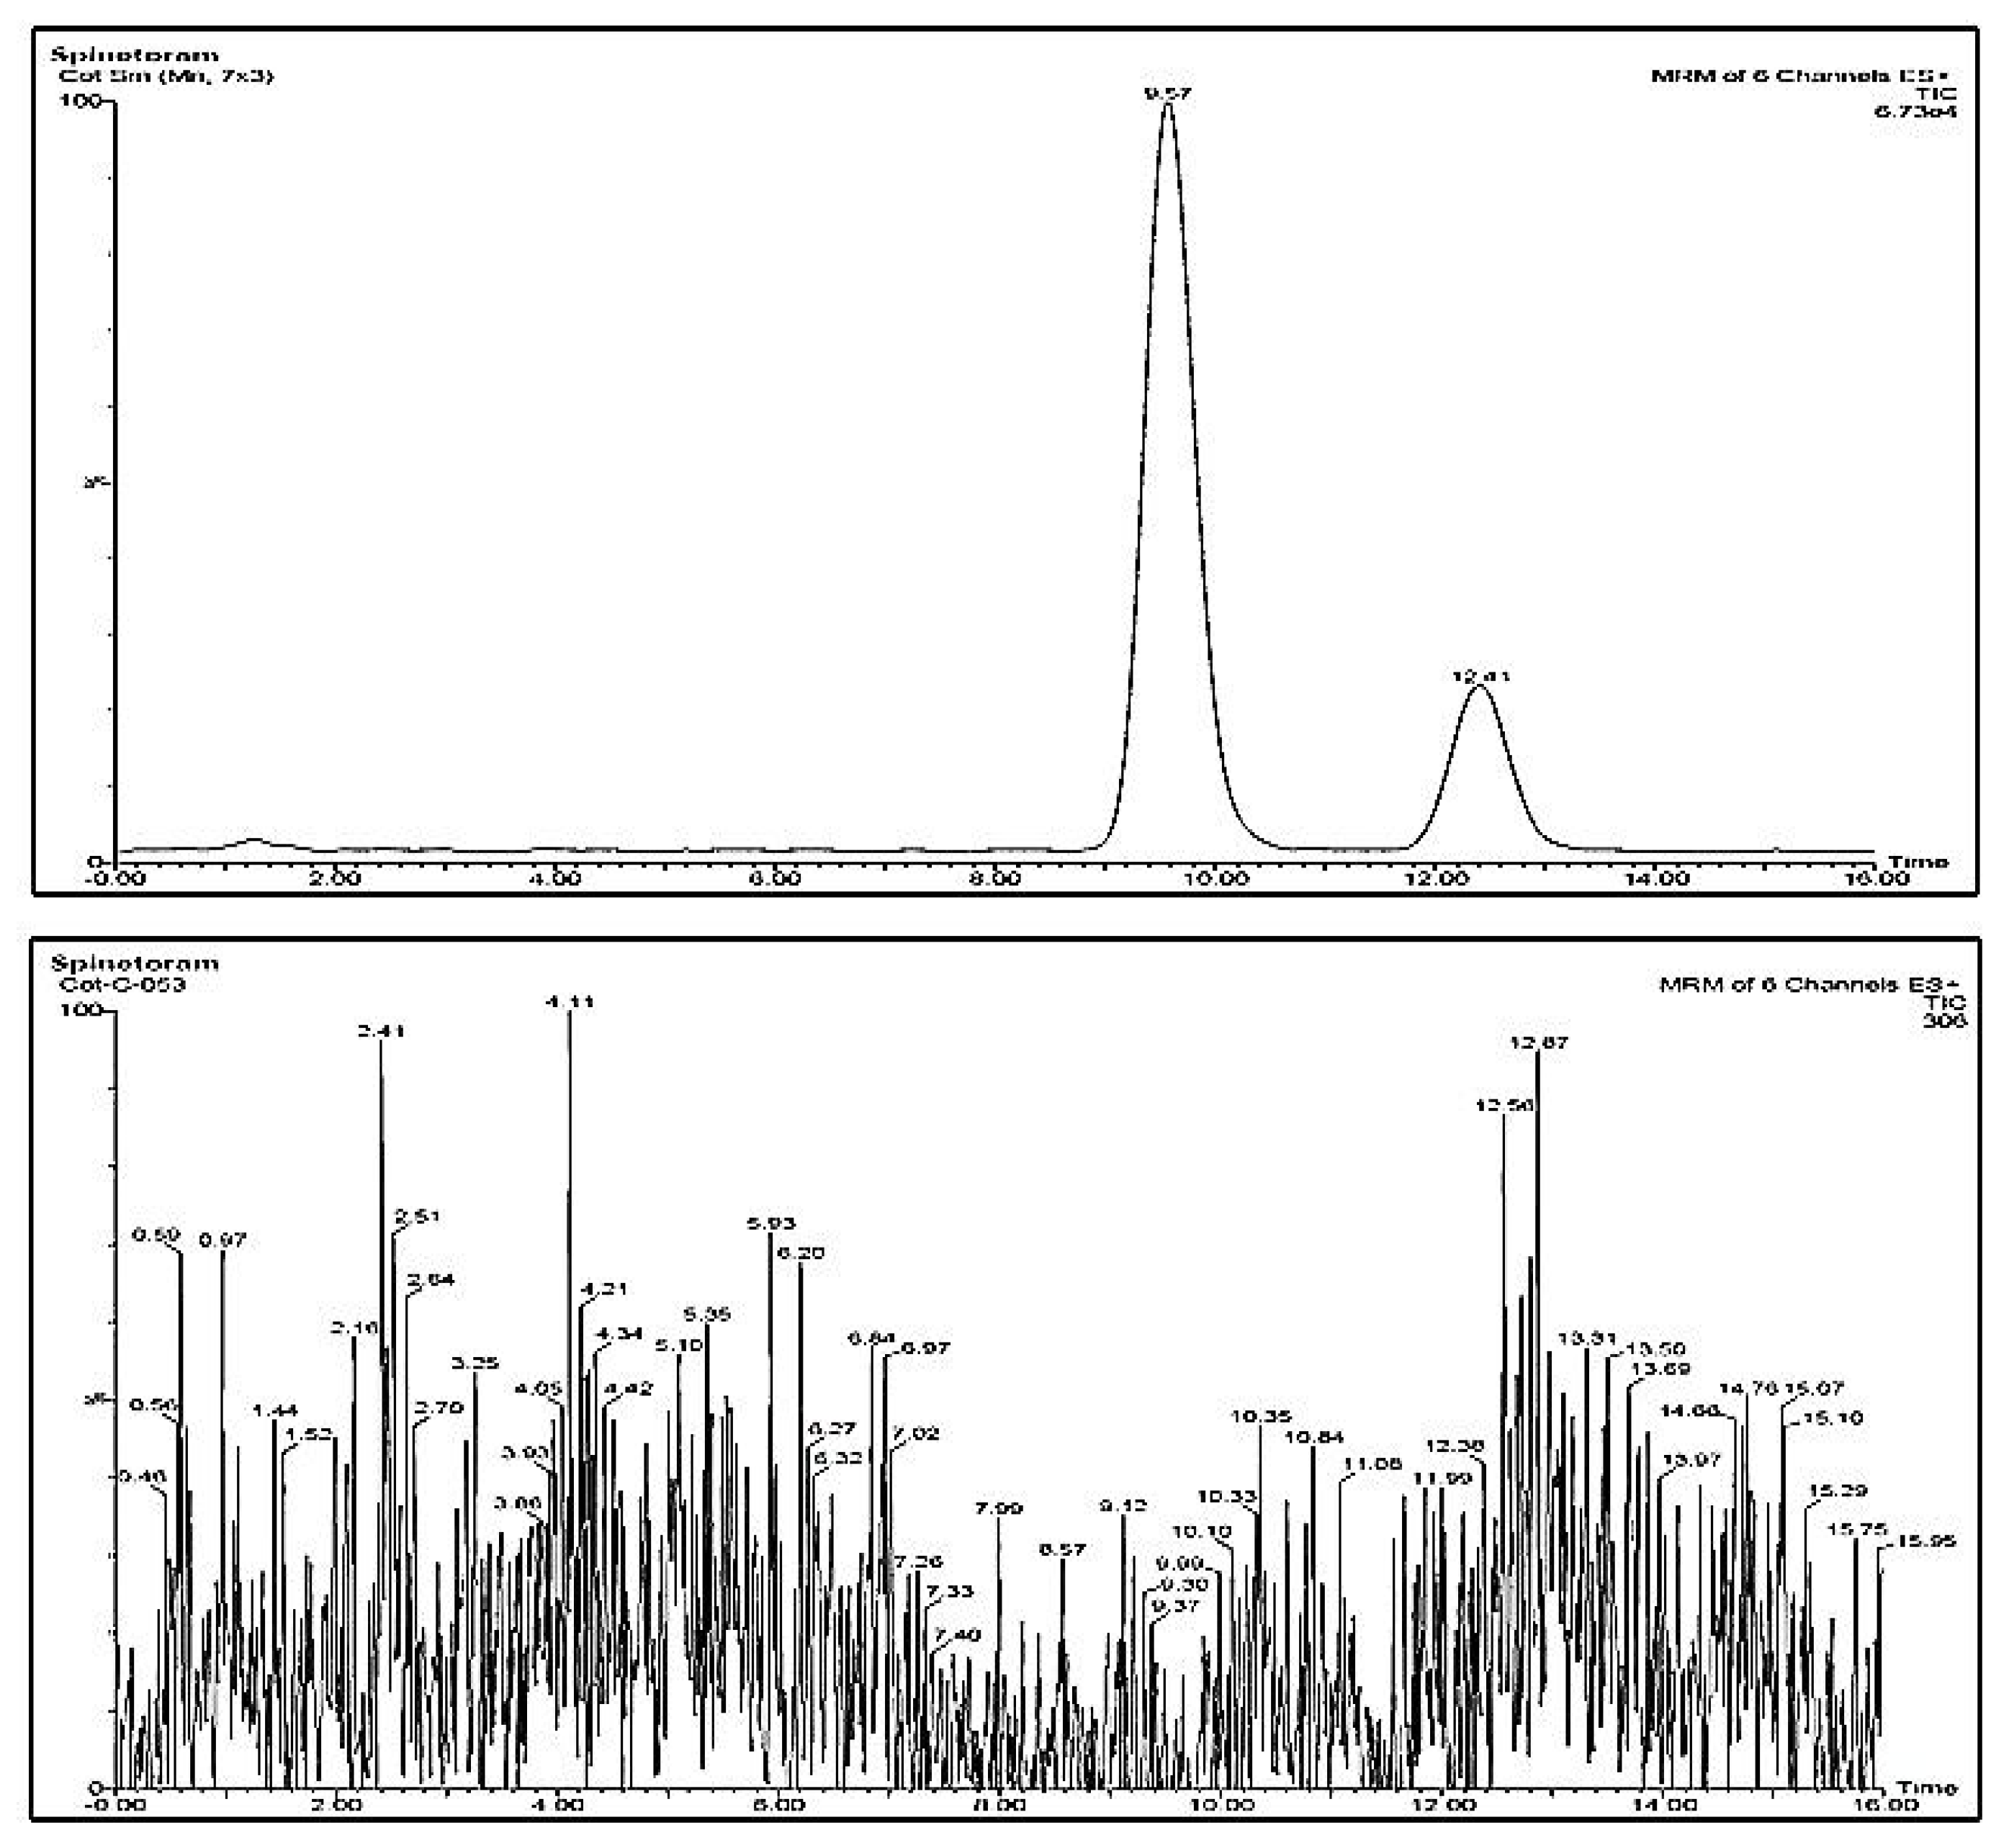
2.7. LC-MS/MS Analysis
2.8. Preparation of Matrix-Matched Calibration Standards
2.9. Method Validation
2.9.1. Precision
2.9.2. Recovery Experiments
2.9.3. Matrix Effect
2.10. Pre-Harvest Interval (PHI)
2.11. Calculation of Uncertainty
3. Results
3.1. Selection of the Extracting Solvent
3.2. Comparison of Shaking versus Blending versus Vortexing
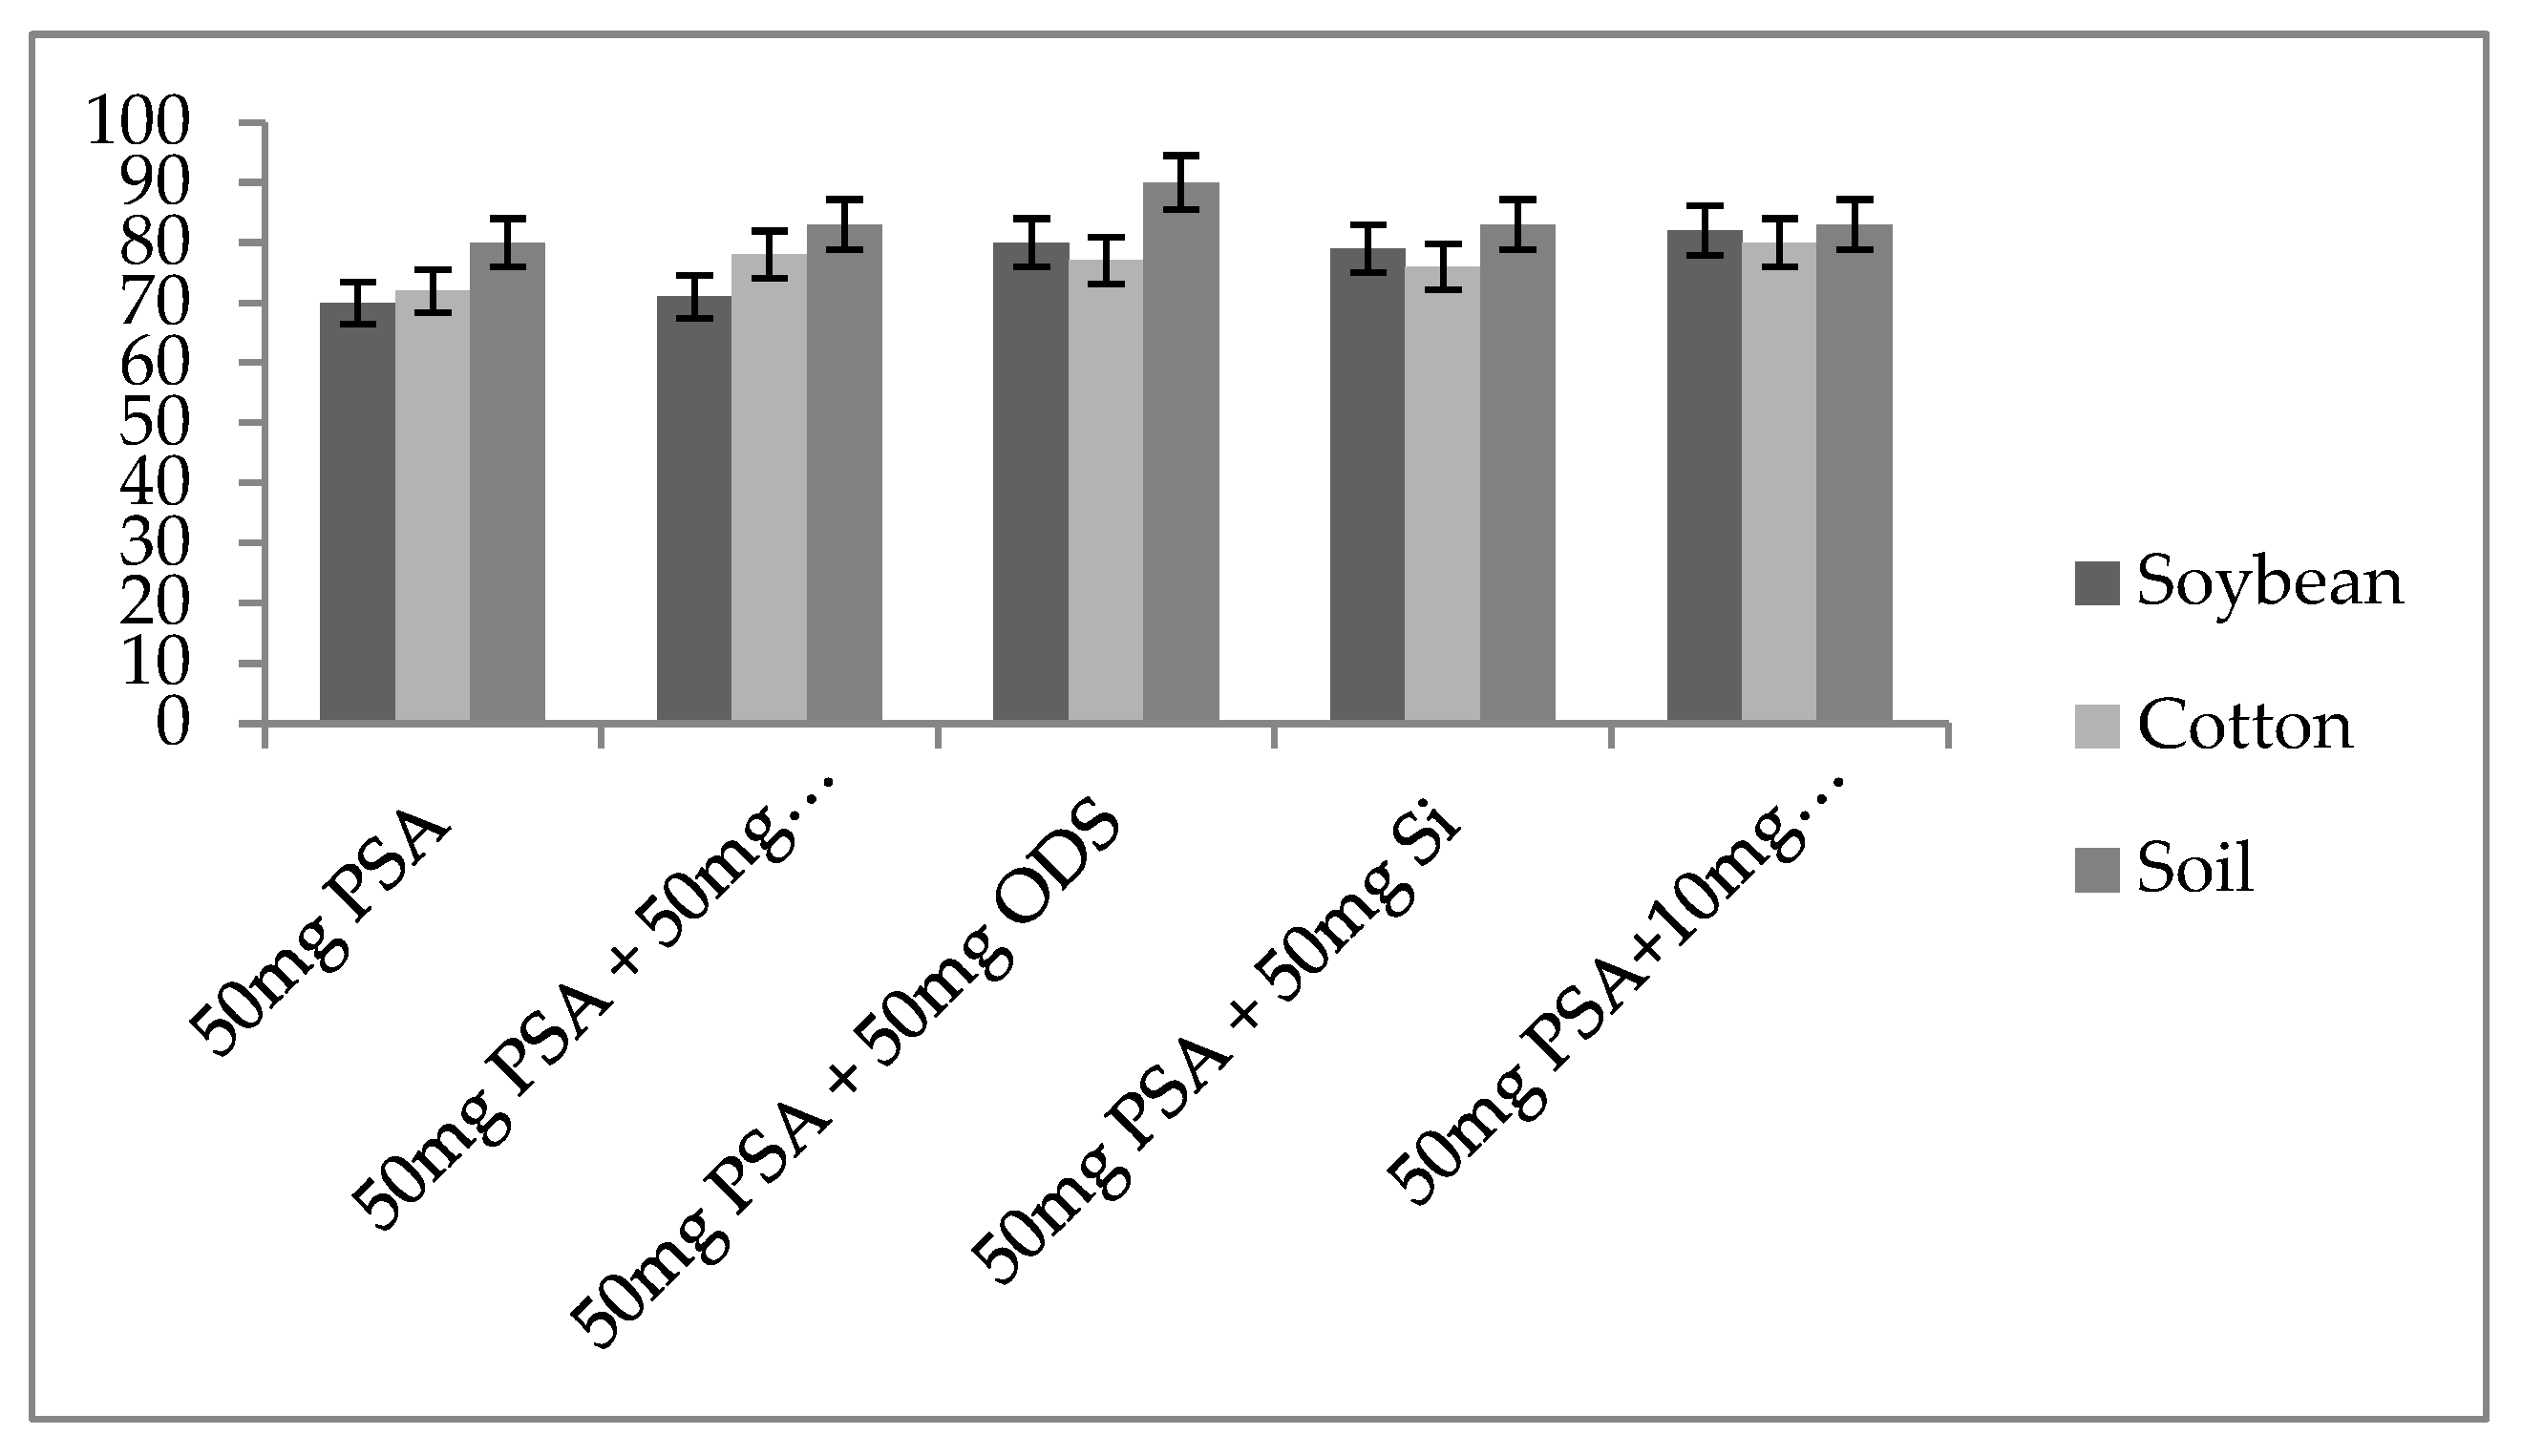
3.3. Comparison of Different SPE Sorbents by LC–MS/MS Analysis
3.4. Result of Field Study
3.5. PHI of Spinetoram
3.6. Estimation of Uncertainty
4. Discussion
5. Conclusions
Author Contributions
Funding
Institutional Review Board Statement
Informed Consent Statement
Data Availability Statement
Acknowledgments
Conflicts of Interest
References
- Central Insecticide Boards and Registration Committee. Major Uses of Pesticides; Directorate of Plant Protection, Quarantine and Storage, Department of Agriculture, Cooperation and Farmers Welfare, Ministry of Agriculture and Farmers Welfare, Government of India: Faridabad, India, 2019. Available online: http://ppqs.gov.in/divisions/cib-rc/major-uses-of-pesticides (accessed on 12 October 2022).
- Yee, W.L. Spinosad versus spinetoram effects on kill and oviposition of Rhagoletis indifferens (Diptera: Tephritidae) at differing fly ages and temperatures. J. Insect Sci. 2018, 18, 15. [Google Scholar] [CrossRef] [PubMed] [Green Version]
- Zhang, K.; Li, J.; Liu, H.; Wang, H.; Lamusi, A. Semi-synthesis and insecticidal activity of spinetoram J and its D-forosamine replacement analogues. Beilstein J. Org. Chem. 2018, 14, 2321–2330. [Google Scholar] [CrossRef] [PubMed]
- Dripps, J.; Olson, B.; Sparks, T.; Crouse, G. Spinetoram: How artificial intelligence combined natural fermentation with synthetic chemistry to produce a new spinosyn insecticide. Plant Health Progress. 2008. Available online: http://www.plantmanagementnetwork.org/pub/php/perspective/2008/spinetoram/ (accessed on 12 August 2022).
- Watson, G.B. Actions of insecticidal spinosyns on caminobutyric acid responses from small-diameter cockroach neurons. Pestic. Biochem. Physiol. 2001, 71, 20–28. [Google Scholar] [CrossRef]
- Orr, N.; Shaffner, A.J.; Richey, K.; Crouse, G.D. Novel mode of action of spinosad: Receptor binding studies demonstrating lack of interaction with known insecticidal target sites. Pestic. Biochem. Physiol. 2009, 95, 1–5. [Google Scholar] [CrossRef]
- Watson, G.B.; Chouinard, S.W.; Cook, K.R.; Geng, C.; Gifford, J.M.; Gustafson, G.D.; Hasler, J.M.; Larrinua, I.M.; Letherer, T.J.; Mitchell, J.C.; et al. A spinosyn-sensitive Drosophila melanogaster nicotinic acetylcholine receptor identified through chemically induced target site resistance, resistance gene identification, and heterologous expression. Insect Biochem. Mol. Biol. 2010, 40, 376–384. [Google Scholar] [CrossRef]
- Sparks, T.C.; Crouse, G.D.; Dripps, J.E.; Anzeveno, P.; Martynow, J.; DeAmicis, C.V.; Gifford, J. Neural network-based QSAR and insecticide discovery: Spinetoram. J. Comput.-Aided Mol. Des. 2008, 22, 393–401. [Google Scholar] [CrossRef]
- Wei, J.; Zhang, L.; Yang, S.; Xie, B.; An, S.; Liang, G. Assessment of the lethal and sublethal effects by spinetoram on cotton bollworm. PLoS ONE 2018, 13, e0204154. [Google Scholar] [CrossRef]
- Acquavia, M.A.; Pascale, R.; Pappalardo, I.; Santarsiero, A.; Martelli, G.; Bianco, G. Characterization of quercetin derivatives in crossing combination of habanero white and Capsicum annuum peppers and of anti-inflammatory and cytotoxic activity. Separations 2021, 8, 90. [Google Scholar] [CrossRef]
- Acquavia, M.A.; Pascale, R.; Foti, L.; Carlucci, G.; Scrano, L.; Martelli, G.; Brienza, M.; Coviello, D.; Bianco, G.; Lelario, F. Analytical methods for extraction and identification of primary and secondary metabolites of apple (Malus domestica) fruits: A review. Separations 2021, 8, 91. [Google Scholar] [CrossRef]
- Anastassiades, M.; Lehotay, S.J.; Stajnbaher, D.; Schenck, F.J. Fast and easy multiresidue method employing acetonitrile extraction/ partitioning and “dispersive solid-phase extraction” for the determination of pesticide residues in produce. J. AOAC Int. 2003, 86, 412–431. [Google Scholar] [CrossRef]
- Analytical quality control and method validation procedures for pesticide residues analysis in food and feed. Sante. 2021, p. 11312. Available online: https://food.ec.europa.eu/system/files/2022-02/pesticides_mrl_guidelines_wrkdoc_2021-11312.pdf (accessed on 12 October 2022).
- Horwitz, W.; Albert, R. The Horwitz Ratio (HorRat): A useful index of method performance with respect to precision. J. AOAC Int. 2006, 89, 1095–1109. [Google Scholar] [CrossRef]
- Horwitz, W.; Kamps, L.R.; Boyer, K.W. Quality assurance in the analysis of foods and trace constituents. J. Assoc. Off. Anal. Chem. 1980, 63, 1344–1354. [Google Scholar] [CrossRef]
- Zhao, L.; Chen, G.; Zhao, J.; Zhang, Y.; Zhu, Y.; Yang, T.; Wu, Y.L. Degradation kinetics of the insecticide spinetoram in a rice field ecosystem. Chemosphere 2015, 119, 1185–1191. [Google Scholar] [CrossRef]
- European Food Safety Authority (EFSA); Anastassiadou, M.; Bernasconi, G.; Brancato, A.; Carrasco Cabrera, L.; Greco, L.; Jarrah, S.; Kazocina, A.; Leuschner, R.; Magrans, J.O.; et al. Review of the existing maximum residue levels for fluopyram according to Article 12 of Regulation (EC) No 396/2005. EFSA J. 2020, 18, e06059. [Google Scholar]
- Ellison, S.L.R.; Williams, A. Quantifying Uncertainty in Analytical Measurement, 3rd ed.; Eurachem/CITAC: Teddington, UK, 2012; ISBN 978-0-948926-30-3. Available online: http://www.eurchem.org (accessed on 18 November 2022).
- Banerjee, K.; Oulkar, D.P.; Dasgupta, S.; Patil, S.B.; Patil, S.H.; Savant, R.; Adsule, P.G. Validation and uncertainty analysis of a multi-residue method for pesticide in grapes using ethyl acetate extraction and liquid chromatography—Tandem mass spectrometry. J. Chromatogr. A 2007, 1173, 98–109. [Google Scholar] [CrossRef]
- Kanrar, B.; Mandal, S.; Bhattacharyya, A. Validation and uncertainty analysis of a multiresidue method for 67 pesticides in made tea, tea infusion, and spent leaves using ethyl acetate extraction and gas chromatography/mass spectrometry. J. AOAC Int. 2010, 93, 411–424. [Google Scholar] [CrossRef] [Green Version]
- Mol, H.G.J.; Rooseboom, A.; VanDam, R.; Roding, M.; Arondeus, K.; Sunarto, S. Modification and re-validation of the ethyl acetate-based multi-residue method for pesticides in produce. Anal. Bioanal. Chem. 2007, 389, 1715–1754. [Google Scholar] [CrossRef] [Green Version]
- Pihlstrom, T.; Blomkvist, G.; Friman, P.; Pagard, U.; Osterdahl, B.G. Analysis of pesticide residues in fruit and vegetables with ethyl acetate extraction using gas and liquid chromatography with tandem mass spectrometric detection. Anal. Bioanal. Chem. 2007, 389, 1773–1789. [Google Scholar] [CrossRef]
- Banerjee, K.; Oulkar, D.P.; Patil, S.B.; Jadhav, M.R.; Dasgupta, S.; Patil, S.H.; Bal, S.; Adsule, P.G. Multiresidue determination and uncertainty analysis of 87 pesticides in mango by liquid chromatography-tandem mass spectrometry. J. Agric. Food Chem. 2009, 57, 4068–4078. [Google Scholar] [CrossRef]
- Casanova, J.A. Use of solid phase extraction disks for analysis of moderately polar and nonpolar pesticide in high moisture food. J. AOAC Int. 1996, 79, 936–940. [Google Scholar] [CrossRef] [Green Version]
- Fillion, J.; Hindle, R.; Lacroix, M.; Selwyn, J. Multiresidue determination of pesticides in fruits and vegetables by gas chromatography-mass selective detection and liquid chromatography with fluorescence detection. J. AOAC Int. 1995, 78, 1352–1366. [Google Scholar] [CrossRef]
- Sheridan, R.S.; Meola, J.R. Analysis of pesticide residues in fruits, vegetables and milk by gas chromatography/tandem mass spectrometry. J. AOAC Int. 1999, 82, 982–990. [Google Scholar] [CrossRef] [PubMed] [Green Version]
- Cook, J.; Beckett, M.P.; Reliford, B.; Hammock, W.; Engel, M. Multiresidue analysis of fresh fruits and vegetables using procedures developed by the Florida Department of Agriculture and Consumer Services. J. AOAC Int. 1999, 82, 1419–1435. [Google Scholar] [CrossRef] [Green Version]
- Food Safety and Standards (Contaminants, Toxins and Residues) Regulations. 2011. Available online: https://www.fssai.gov.in/upload/uploadfiles/files/Compendium_Contaminants_Regulations_20_08_2020.pdf (accessed on 12 October 2022).
- Ganguly, P.; Mandal, J.; Mandal, N.; Rakshit, R.; Patra, S. Benzophenyl urea insecticides–useful and ecofriendly options for insect pest control. J. Environ. Biol. 2020, 41, 527–538. [Google Scholar] [CrossRef]
- Goon, A.; Bhattacharyya, A.; Ghosh, B.; Rakshit, R.; Das, A.; Choudury, S.R.; Kundu, C.; Ganguly, P.; Hossain, A. Photodegradation of flucetosulfuron, a sulfonylurea-based herbicide in the aqueous media is influenced by ultraviolet irradiation. J. Xenobiot. 2021, 11, 142–154. [Google Scholar] [CrossRef]
- Patra, S.; Das, A.; Rakshit, R.; Choudhury, S.R.; Roy, S.; Mondal, T.; Samanta, A.; Ganguly, P.; Alsuhaibani, A.M.; Gaber, A.; et al. Persistence and exposure assessment of insecticide indoxacarb residues in vegetables. Front. Nutr. 2022, 9, 1–10. [Google Scholar] [CrossRef]
- Bhattacharyya, A.; Ganguly, P.; Barik, S.R.; Kundu, C. Studies on the persistence of diclosulam in soybean crop. In Proceedings of the 23rd Asian-Pacific Weed Science Society Conference, The Sebel Cairns, Australia, 26–29 September 2011; p. 34. [Google Scholar]
- Tang, H.; Ma, L.; Huang, J.; Li, Y.; Liu, Z.; Meng, D.; Wen, G.; Dong, M.; Wang, W.; Zhao, L. Residue behavior and dietary risk assessment of six pesticides in pak choi using QuEChERS method coupled with UPLC-MS/MS. Ecotox. Environ. Saf. 2021, 213, 112022. [Google Scholar] [CrossRef]
- US EPA—Pesticides—Fact Sheet for Spinetoram. Available online: https://www3.epa.gov/pesticides/chem_search/reg_actions/registration/fs_G-4674_01-Oct-09.pdf (accessed on 12 October 2022).
- Australian Pesticides and Veterinary Medicines Authority. Evaluation of the new active spinetoram in the product delegate insecticide. APVMA, Natl. Regist. Auth. Agric. Vet. Chem. 2008, 1–61. Available online: https://apvma.gov.au/sites/default/files/publication/14006-prs-spinetoram.pdf (accessed on 12 August 2022).
- Li, H.; Zhong, Q.; Luo, F.; Wang, X.; Zhou, L.; Chen, Z.; Zhang, X. Residue degradation and metabolism of spinetoram in tea: A growing, processing and brewing risk assessment. Food Control 2021, 125, 107955. [Google Scholar] [CrossRef]
- Tengfei, X.; Nanda, S.; Fengliang, J.; Qingsheng, L.; Xia, F. Control efficiency and mechanism of spinetoram seed-pelleting against the striped flea beetle Phyllotreta striolata. Sci. Rep. 2022, 12, 9524. [Google Scholar] [CrossRef]
- Wang, T.; Lin, M.; Yao, Z.; Wang, P.; Ping, X.; Fang, H. Dissipation characteristics and safety evaluation of spinetoram in red bayberry and soil. J. Zhejiang Univ. Sci. (Agric. Life Sci.) 2021, 47, 43–51. [Google Scholar]
- Ali, A.M.; Mohamed, A.M.; Ryad, L. Dissipation and persistence of spinetoram residue in pepper and cabbage by using lc-ms/ms and QuEChERS method. Middle East J. Appl. Sci. 2018, 8, 508–514. [Google Scholar]
- Šunjka, D.; Lazić, S.; Vuković, S.; Alavanja, A.; Nađ, Đ.; Mitrić, S. Residue and dissipation dynamic of spinetoram insecticide in pear fruits. Plant Prot. Sci. 2021, 57, 326–332. [Google Scholar]
- Malhat, F.M. Simultaneous determination of spinetoram residues in tomato by high performance liquid chromatography combined with QuEChERS method. Bull. Environ. Contam. Toxicol. 2013, 90, 222–226. [Google Scholar] [CrossRef]
- Lin, H.; Liu, L.; Zhang, Y.; Shao, H.; Li, H.; Li, N.; Zou, P.; Lu, N.; Guo, Y. Residue behavior and dietary risk assessment of spinetoram (XDE-175-J/L) and its two metabolites in cauliflower using QuEChERS method coupled with UPLC-MS/MS. Ecotox. Environ. Saf. 2020, 202, 110942. [Google Scholar] [CrossRef]
- Hwang, E.J.; Park, J.E.; Do, J.A.; Chung, H.W.; Chang, H.R. Residual dissipation based on crop commodities classification of boscalid and spinetoram on crown daisy and sweet pepper under green houses. Korean J. Environ. Agric. 2017, 36, 184–192. [Google Scholar] [CrossRef]
- Hafez, A.A.; Halawa, S.M.; Gameel, S.M.M.; Mahmoud, M.S. Determination of spinetoram residues degradation in tomato fruits using high performance liquid chromatography (HPLC) and QuECHERS method. Egy. Sci. J. Pestic. 2016, 2, 8–12. [Google Scholar]
- Haviland, D.R.; Beers, E.H. Chemical control programs for Drosophila suzukii that comply with international limitations on pesticide residues for exported sweet cherries. J. Integ. Pest Manag. 2012, 3, 1–6. [Google Scholar] [CrossRef]


| Pesticide | RT (min) | Q | Q1 | CV (V) | CE (V) | Q2 | CV (V) | CE (V) | Ion Ratio (%) (Mean ± RSD) |
|---|---|---|---|---|---|---|---|---|---|
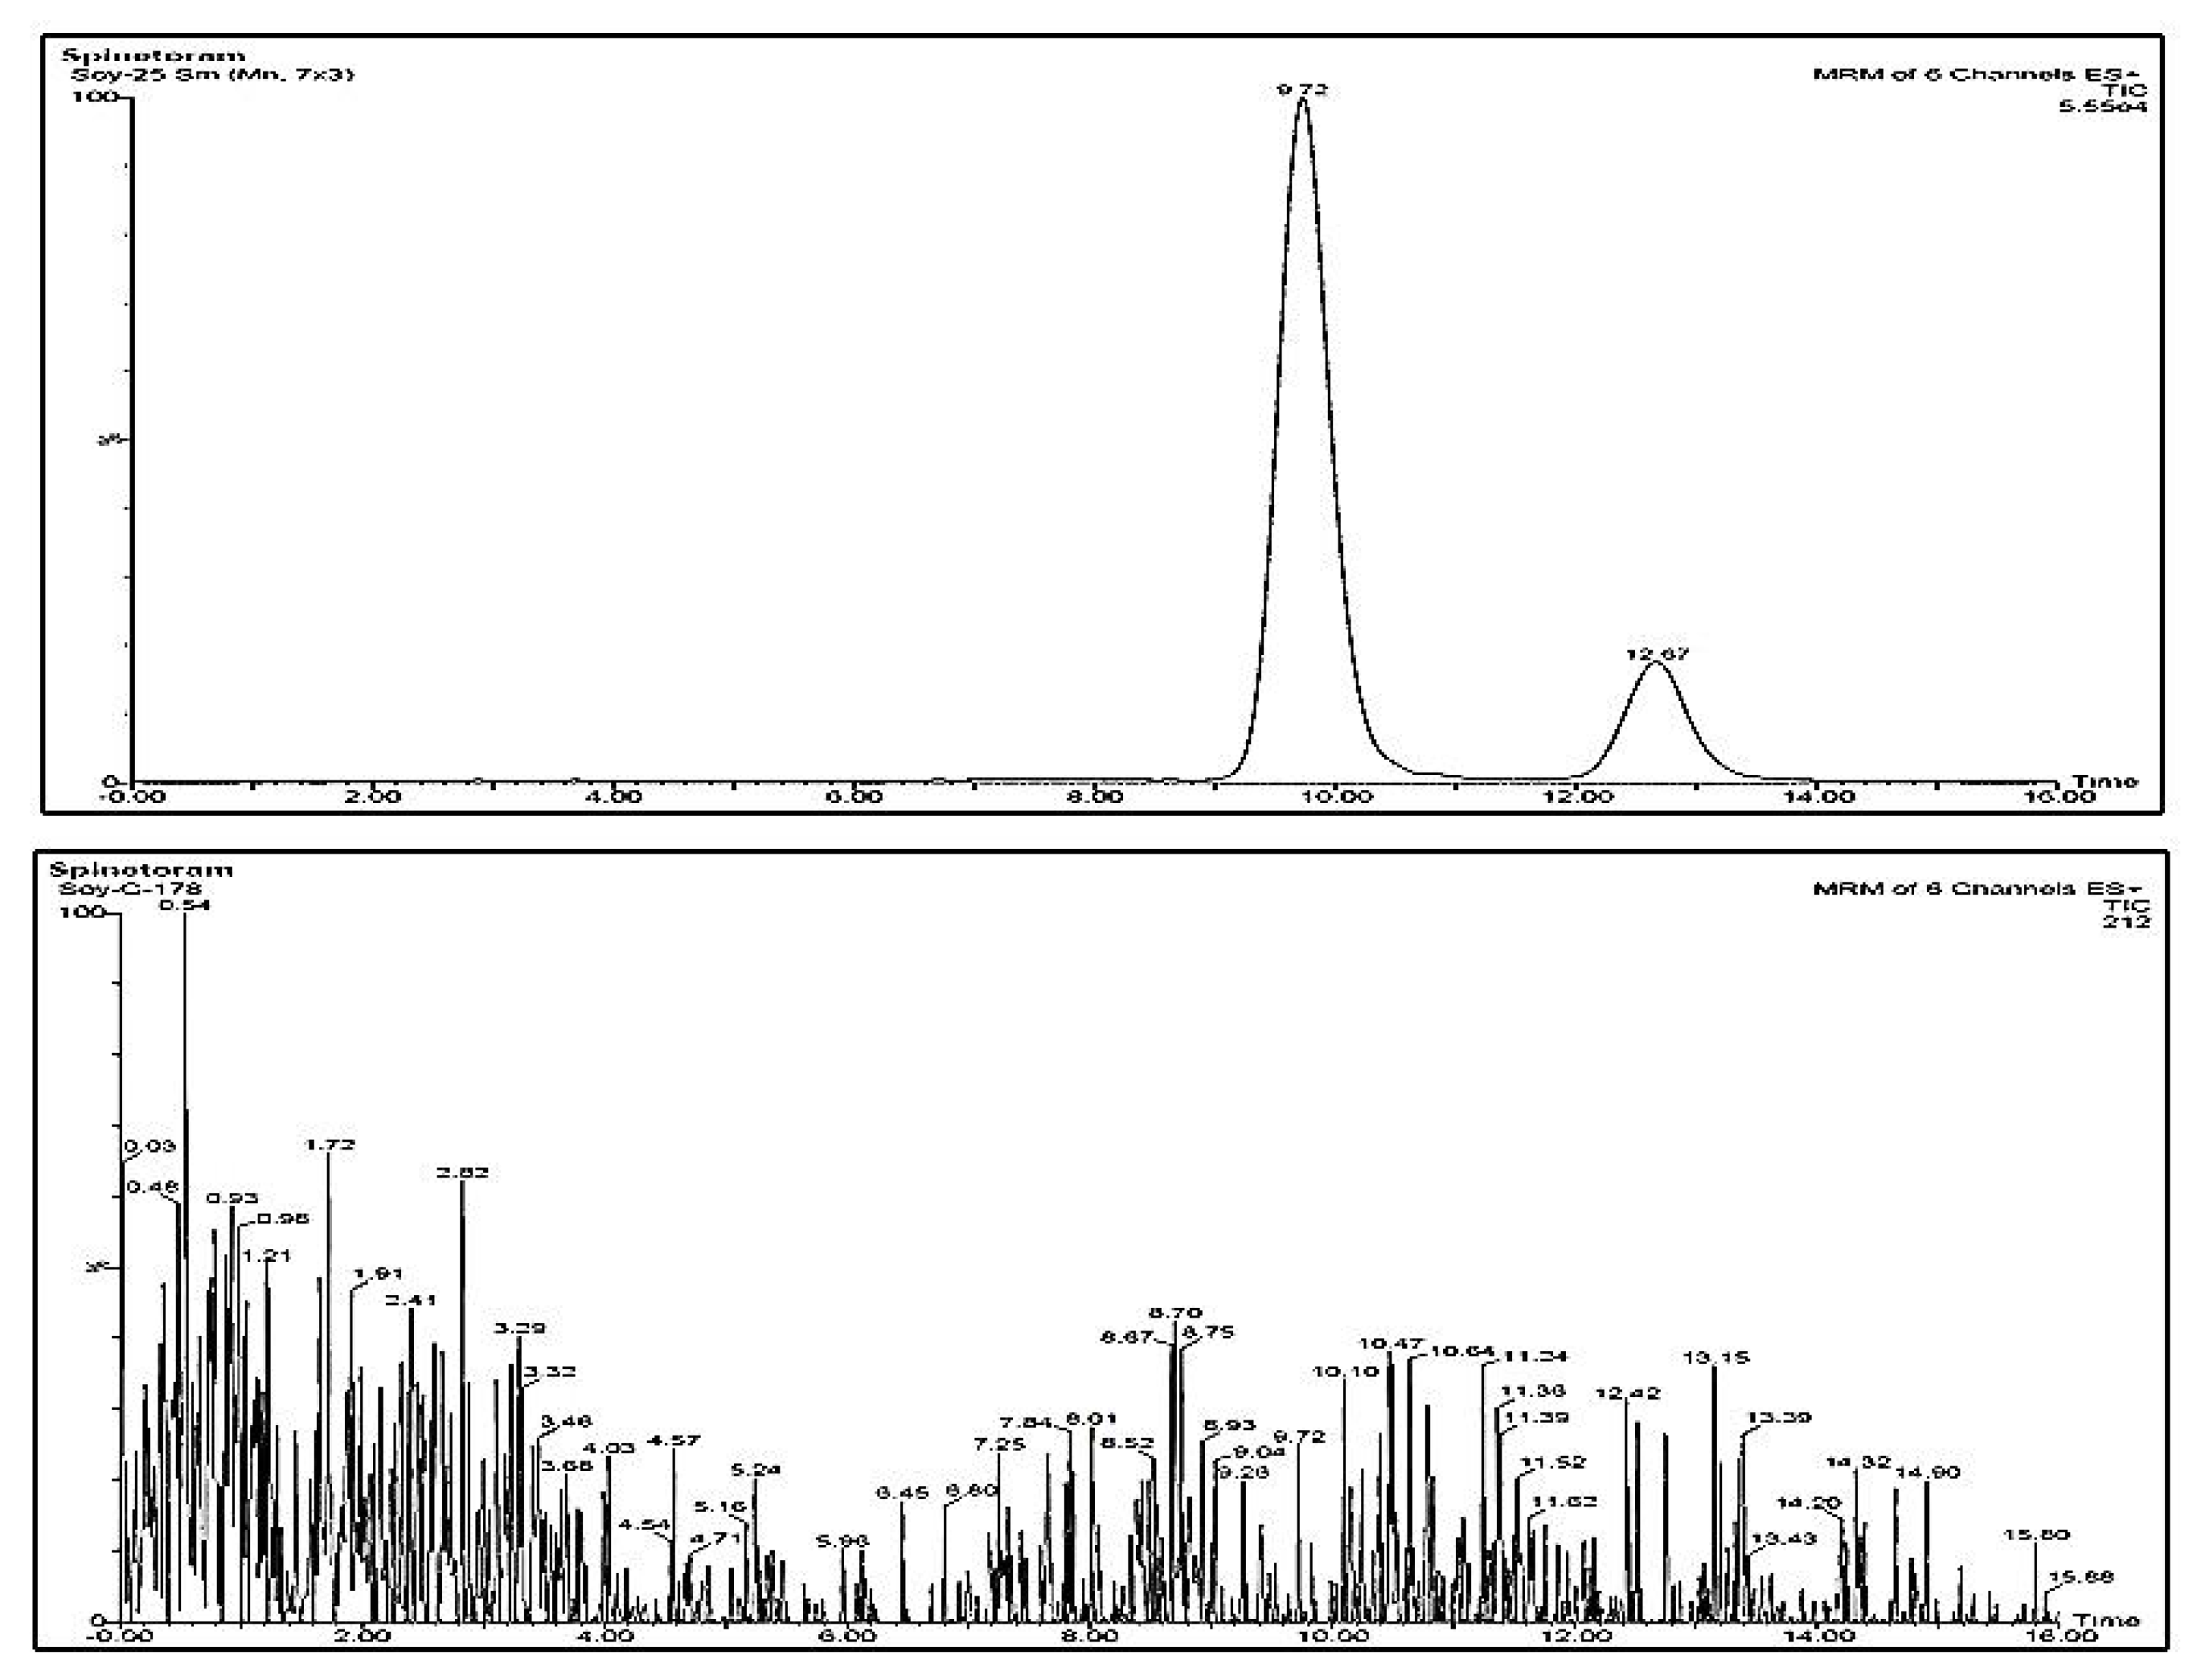
| Spinosyn-J | 9.53 | 748.87 | 142.1 | 44 | 29 | 97.9 | 44 | 60 | 17 ± 8 |
| Spinosyn-L | 12.28 | 760.83 | 142.1 | 44 | 28 | 95.7 | 44 | 65 | 1 ± 9 |
| Substrate | Level of Fortification (ng g−1) | |||||||||
|---|---|---|---|---|---|---|---|---|---|---|
| Spinosyn-J | Spinosyn-L | |||||||||
| 25 | 50 | 100 | HorRat b | ME (%) c | 25 | 50 | 100 | HorRat b | ME (%) c | |
| Soybean plant | 86 (11) [7.86] | 89 (10) | 88 (7) | 0.41 | −59 | 85 (10) [7.45] | 87 (9) | 87 (6) | 0.35 | −48 |
| Soybean oil | 81 (11) [6.19] | 85 (8) | 88 (10) | 0.40 | −37 | 82 (9) [5.35] | 86 (7) | 90 (6) | 0.33 | −34 |
| De-oil cake | 86 (12) [6.03] | 90 (7) | 87 (9) | 0.43 | −44 | 85 (12) [6.54] | 91 (8) | 87 (7) | 0.42 | −38 |
| Cotton plant | 86 (11) [7.02] | 90 (9) | 89 (8) | 0.40 | −49 | 85 (11) [6.11] | 89 (7) | 90 (6) | 0.40 | −40 |
| Cotton oil | 83 (7) [6.86] | 86 (8) | 88 (6) | 0.25 | −51 | 90 (10) [6.54] | 86 (8) | 92 (8) | 0.34 | −46 |
| De-oil cake | 87 (8) [5.98] | 85 (7) | 92 (6) | 0.28 | −32 | 85 (8) [7.31] | 88 (9) | 93 (6) | 0.28 | −41 |
| Cotton lint | 89 (9) [7.37] | 95 (10) | 92 (7) | 0.33 | −11 | 89 (7) [7.41] | 95 (9) | 91 (5) | 0.26 | −18 |
| Soil | 89 (12) [6.08] | 93 (7) | 94 (6) | 0.42 | −16 | 88 (7) [3.22] | 91 (4) | 91 (6) | 0.25 | −26 |
| Days after Application | Treatment | Residues of Spinetoram (mg kg−1) (Mean ± SD) (Dissipation %) | |||
|---|---|---|---|---|---|
| Soybean | Cotton | ||||
| Spinosyn J | Spinosyn L | Spinosyn J | Spinosyn L | ||
| 0 | T1 | 0.249 ± 0.007 (-) | 0.114 ± 0.010 (-) | 0.232 ± 0.007 (-) | 0.104 ± 0.007 (-) |
| T2 | 0.572 ± 0.008 (-) | 0.194 ± 0.007 (-) | 0.504 ± 0.007 (-) | 0.165 ± 0.005 (-) | |
| 1 | T1 | 0.186 ± 0.008 (25.3%) | 0.066 ± 0.007 (42.10%) | 0.153 ± 0.006 (34.05%) | 0.048 ± 0.003 (53.84%) |
| T2 | 0.435 ± 0.010 (23.95%) | 0.130 ± 0.007 (32.98%) | 0.404 ± 0.006 (19.84%) | 0.104 ± 0.006 (36.96%) | |
| 3 | T1 | 0.068 ± 0.007 (72.69%) | 0.019 ± 0.003 (83.33%) | 0.055 ± 0.004 (76.29%) | 0.015 ± 0.002 (85.57%) |
| T2 | 0.212 ± 0.008 (62.93%) | 0.073 ± 0.007 (62.37%) | 0.194 ± 0.007 (61.50%) | 0.042 ± 0.003 (74.54%) | |
| 7 | T1 | BDL | BDL | BDL | BDL |
| T2 | 0.050 ± 0.008 (91.26%) | 0.009 ± 0.002 (95.36%) | 0.042 ± 0.003 (91.66%) | 0.006 ± 0.001 (96.36%) | |
| 10 | T1 | BDL | BDL | BDL | BDL |
| T2 | BDL | BDL | BDL | BDL | |
| Regression equation (R2) | T1 | Y = 5.575 − 0.440X (0.986) | Y = 4.753 − 0.593X (0.999) | Y = 5.474 − 0.486X (0.997) | Y = 4.595 − 0.645X (0.995) |
| T2 | Y = 6.391 − 0.352X (0.999) | Y = 5.355 − 0.433X (0.987) | Y = 6.302 − 0.362X (0.996) | Y = 5.044 − 0.452X (0.997) | |
| Half-life (T1/2) (d) | T1 | 1.58 | 1.17 | 1.43 | 1.07 |
| T2 | 1.97 | 1.60 | 1.91 | 1.53 | |
Disclaimer/Publisher’s Note: The statements, opinions and data contained in all publications are solely those of the individual author(s) and contributor(s) and not of MDPI and/or the editor(s). MDPI and/or the editor(s) disclaim responsibility for any injury to people or property resulting from any ideas, methods, instructions or products referred to in the content. |
© 2022 by the authors. Licensee MDPI, Basel, Switzerland. This article is an open access article distributed under the terms and conditions of the Creative Commons Attribution (CC BY) license (https://creativecommons.org/licenses/by/4.0/).
Share and Cite
Goon, A.; Kundu, C.; Ganguly, P. Development of a Modified QuEChERS Method Coupled with LC-MS/MS for Determination of Spinetoram Residue in Soybean (Glycine max) and Cotton (Gossypium hirsutum). J. Xenobiot. 2023, 13, 2-15. https://doi.org/10.3390/jox13010002
Goon A, Kundu C, Ganguly P. Development of a Modified QuEChERS Method Coupled with LC-MS/MS for Determination of Spinetoram Residue in Soybean (Glycine max) and Cotton (Gossypium hirsutum). Journal of Xenobiotics. 2023; 13(1):2-15. https://doi.org/10.3390/jox13010002
Chicago/Turabian StyleGoon, Arnab, Chiranjit Kundu, and Pritam Ganguly. 2023. "Development of a Modified QuEChERS Method Coupled with LC-MS/MS for Determination of Spinetoram Residue in Soybean (Glycine max) and Cotton (Gossypium hirsutum)" Journal of Xenobiotics 13, no. 1: 2-15. https://doi.org/10.3390/jox13010002