Article

Impact of Genetic Polymorphisms in Modifier Genes in Determining Fetal Hemoglobin Levels in Beta-Thalassemia

1
Department of Genetics, Sanjay Gandhi Post Graduate Institute of Medical Sciences (Sgpgims), Lucknow 226014, Uttar Pradesh, India
2
Department of Hematology, Sanjay Gandhi Post Graduate Institute of Medical Sciences (Sgpgims), Lucknow 226014, Uttar Pradesh, India
3
Department of Biomedical Informatics Center, Sanjay Gandhi Postgraduate Institute of Medical Sciences, Lucknow 226014, Uttar Pradesh, India
*
Author to whom correspondence should be addressed.
Thalass. Rep. 2023, 13(1), 85-112; https://doi.org/10.3390/thalassrep13010009
Submission received: 1 February 2023 / Revised: 9 March 2023 / Accepted: 10 March 2023 / Published: 16 March 2023
(This article belongs to the Section Innovative Treatment of Thalassemia)

Abstract

:
Genetic polymorphisms in Quantitative Trait Loci (QTL) genes such as BCL11A, HBS1L-MYB and KLF1 have been reported to influence fetal hemoglobin (HbF) levels. This prospective study was planned to evaluate the role of genetic polymorphisms in QTL genes as determinant of HbF levels in beta thalassemia major patients. The study was carried out on 100 thalassemia major patients. Blood samples were collected in EDTA and plain vials for biochemical and molecular evaluation. The BCL11A, HBS1L-MYB and KLF1 genotypes were determined using a polymerase chain reaction (PCR)-based method. Red Blood Cell (RBC) indices and HbF levels were assessed. In silico analysis was assessed using loss-of-function tool (Lof Tool). Statistical difference and genetic comparisons between groups were evaluated by using SPSS for Windows, version 16.0 (SPSS Inc., Chicago, IL, USA). Comparisons between quantitative variables were carried out after data explored for normality using Kolmogorov–Smirnov test of normality. Logistic regression was used for computation of ORs and 95% CIs (Confidence Interval). We observed association of HbF levels in thalassemia major patients with the polymorphisms in BCL11A (rs11886868 rs7557939; rs1427407 and rs766432) and HBS1L-MYB (rs9399137) gene. The results of this study indicated that the presence of polymorphisms on modifier genes are strongly associated with an increase in HbF levels in thalassemia major patients. Further research with a larger sample size and with other genes of modifier genes is required.

1. Introduction

β-thalassemia is a hereditary blood disorder caused by mutations in the beta globin gene that leads to reduced or absent synthesis of beta globin chains essential for hemoglobin (Hb) biosynthesis [1]. β-thalassemia phenotypes are quite heterogenous, ranging from the severe transfusion-dependent thalassemia major to non-transfusion-dependent thalassemia intermedia. Various factors have been found to modulate the beta-thalassemia phenotype [2,3]. The primary genetic determinants of β-thalassemia are mostly different types of mutations of beta globin genes (β0/β+/β++) that lead to decreased/absent production of β globin chains of Hb molecule; secondary loci can either ameliorate the disease phenotype by increased synthesis of ϒ-globin and hemoglobin F or worsen the clinical phenotype by co-inheritance of excess α globin genes. Tertiary loci are not involved in globin production but that might modify the complications of the disease in many different ways. The latter group includes the many different polymorphisms that have been co-selected with the thalassemias and that might further modify their phenotype.
Fetal hemoglobin (HBF) is one of the most important modifiers of the disease severity in individuals with β-TM disorder. Since beta chains are either absent or reduced in beta thalassemia, the γ-globin chains bind with the excess α-chains thereby decreasing the deleterious effect of intracellular precipitation of unbound β-chains [4,5,6,7]. This reduces ineffective erythropoiesis and increases production of some functional HbF, which on the other hand facilitates longer duration survival of RBC in the circulation.
Previous studies have identified three major QTLs for HbF including: B-cell lymphoma/leukemia (BCL11A) gene, the HBS1L-MYB intergenic region and Krüppel-like factor 1 (KLF).
B-cell lymphoma/leukemia (BCL11A) gene encodes a C2H2 type, which is a zinc finger protein, involved in the generation of B-cell progenitor [7]. BCL11A is highly expressed in several hematopoietic cell lineages, and play an important role in the switch from γ to β-globin expression during the fetal to adult erythropoiesis transition phase. It is also expressed in the brain, B-lymphocytes and the adult erythroid lineage [8]. Downregulation of BCL11A expression in adult human erythroid precursors results in induction of HbF [9,10,11].
Researchers have shown that long-range interactions between BCL11A and multiple regions throughout the β-globin gene locus mediate the silencing of the γ-globin genes [4]. A total of 5788 single-nucleotide polymorphisms (SNPs) in BCL11A gene were reported in the National Centre for Biotechnology Information (NCBI) database [12].
A study demonstrated that an intronic SNP in BCL11A, rs11886868 strongly co-relates with HbF levels in a large cohort of Sickle Cell Anemia (SCA) patients [13]. This indicates that BCL11A variants act as an important ameliorating factor of the SCA by modulating HbF levels. Genotyping of two other SNPs, rs4671393 and rs7557939 in the Brazil Sickle cell disease cohorts, have shown that these SNPs were more strongly associated with HbF level variation than rs11886868 [11,14].
The HBS1L-MYB intergenic region located on chromosome 6q23, near the oncogene MYB, was first detected through linkage in a large South Asian family [15] that regulates erythroid cell proliferation, maturation and fetal hemoglobin expression [16]. MYB encodes cMYB, an important transcriptional regulator of hematopoiesis [17]. There are multiple sub-loci situated in the intergenic interval between HBS1L, such as translational GTPase and MYB [8]. A significant effect of these sub-loci, mainly HMIP-2 (HBS1L-MYB intergenic polymorphism, block 2) and HBS1L-MYB, was demonstrated in patients with SCD [17,18].
In a study of polymorphism associated with the variability of HbF expression in non-anemic humans, variants in the intergenic region between the HBSL1 and MYB genes were identified in MYB expressing primary human erythroid cells [19,20,21]. The HBS11L-MYB SNPs especially rs9399137 had an effect on HbF production and the variation of hematological parameters in homozygous HbE subjects [22].
A recent study by Qadah et al. in 2020 confirms the strong relationship among HBS1LMYB rs9399137 and rs28384513 genotypes. However, the contributions of different SNPs of HBS1L-MYB are found to be highly variable in different populations and the association varies in different hemoglobinopathies, so it is important to study the status of these polymorphisms to understand their influence on fetal hemoglobin expression in thalassemia cases of north India.
Krüppel-like factor (KLF1) is an essential erythroid transcription factor that was first identified by Miller and Bieker in 1993 [23]. KLF1 functions in two ways: first it binds to the locus control region of the β-globin gene and regulates its expression; second, as it is a positive regulator of BCL11A, it activates the BCL11A expression which in turn silences the gamma globin gene and maintains the level of HbF [24,25,26,27]. So, KLF1 (the erythroid-specific transcription factor) is a crucial regulator of the γ to β-globin, the developmental switching between fetal and adult hemoglobin.
Genetic variations in KLF1 have been found to have an indirect role in causing high HbF levels in HPFH and Thalassemia Intermedia (TI) [28]. Therefore, it may be possible that by attenuating the activity of KLF1, HbF level can be induced which has the possibility of becoming a central approach in reducing the severity of thalassemia phenotype [29,30].
We focused to study key regulators of HbF production to demonstrate the benefit of modern human genetics in understanding clinical heterogeneity in monogenic disorder. Thus, in the second part of thesis, we have investigated the role of genetic variants present in QTLs such as BCL11A, HBS1L-MYB and KLF1 genes which ameliorate the disease severity in patients with β-thalassemia major.

2. Materials and Methods

A total of 100 beta thalassemia major patients aged less than 5 years from the Department of Hematology and Medical Genetics of Sanjay Gandhi Postgraduate Institute of Medical Sciences, Lucknow were enrolled in the study after obtaining written informed consent from the patient and their parents. We included only patients who received less than 3 transfusions for our study.
Peripheral blood was collected from each individual in an EDTA vial (2 mL). About 1 mL EDTA blood sample was used for estimation of hematological investigations. The remaining 1 mL was used for DNA isolation by phenol chloroform method. The quality and quantity of DNA was checked on agarose gel electrophoresis and then the quantity and quality were determined by measuring optical density (O.D) on Nano Drop (ND-1000).

2.1. Hematological Investigation

Complete Blood Count: Hematological parameters were obtained by using automated hematology cell counter SYSMEX KX-21.
Quantification of Hemoglobin Variant: CE-HPLC was performed with each blood sample on BIO-RAD Variant II using beta thalassemia short program pack consisting of elution buffer 1 (sodium phosphate), elution buffer 2 (sodium phosphate), whole blood primer (lyophilized human red blood cell hemolysate with preservative, HbA2/F, Calibrator (Diluent set), Analytical Cartridge sample vial and wash solution (with deionized water). The Variant II BIO-RAD is a fully automated HPLC system used to separate and determine the area percentage for hemoglobin A2 and F to provide a qualitative determination of abnormal hemoglobin. The different Hb is separated based on their ionic interaction with cartridge material (a buffer gradient of increasing ionic strength on cartridge. The separated Hb passed through two different filter photometers of absorbance at 415 nm and secondary wavelength at 690 nm to reduce the background absorbance. Different hemoglobin has a characteristic retention time with different peak in defined windows, displayed in a chromatogram of percentage absorbance versus time. The HbA2 levels ranging between 4 and 9% and between HbF 1 and 5% were diagnosed as beta thalassemia.

2.2. Molecular Analysis

2.2.1. Genotype Analysis of Genetic Markers

Genotype studies for 11 SNPs of genetic modifier genes BCL11A, HBS1L-MYB and KLF1 were carried out by PCR-RFLP and Amplification Refractory Mutation System (ARMS PCR) (Table 1).

2.2.2. Statistical Analysis

Statistical difference and genetic comparisons between groups were evaluated by using SPSS for Windows, version 16.0 (SPSS Inc., Chicago, IL, USA). Data were presented as mean ± standard deviation for continuous variables and number and percentages for discrete variables. Comparisons between quantitative variables were carried out after data were explored for normality using the Kolmogorov–Smirnov test of normality. Logistic regression was used for the computation of ORs and 95% CIs (Confidence Interval). Genotype and allele frequency distributions of the polymorphisms in the BCL11A, HBS1L-MYB and KLF1 gene were compared between patients with high (>40%) and low (<40%) HbF levels, and was analyzed by multiple linear regression to evaluate the contribution of each of the SNPs to the HbF% variation, with age and sex included as covariates. The demographic data were expressed as mean ± standard deviation (SD). The hematological parameters and HbF levels were presented as mean and standard deviation (SD). Data were found nonparametric for hematological parameters, the Mann–Whitney U test was used to see the difference of median between two groups with high (>40%) and low (<40%) HbF levels. Clinical data (hepatomegaly and transfusion therapy) from groups of patients with different HbF levels (>40% and <40%) were compared using the chi square test for categorical variables and t-test for continuous variables. Multiple linear regression was used to test for association of genetic markers with hematological parameters and HbF, considering age and sex as covariate. One-way ANOVA was used to compare the history of splenomegaly in groups of patients with high and low HbF levels. The p-values were considered to be significant at <0.05.

2.2.3. In Silico Analysis

The biological significance or functional impacts of the 4 noncoding single nucleotide variants (ncSNVs) of oxidative stress (genetic marker) were determined by using in silico tools (CADD phred and FATHMM pred) for variant effect prediction. For the CADD* C-Score, a cut-off value >10 indicated potential pathogenic variants. However, in FATHMM predictions were given as p-values in the range [0, 1]: values above 0.5 were predicted to be deleterious, while those below 0.5 were predicted to be neutral or benign. A p-value close to the extremes (0 or 1) was the highest confidence prediction that yielded the highest accuracy.

3. Results

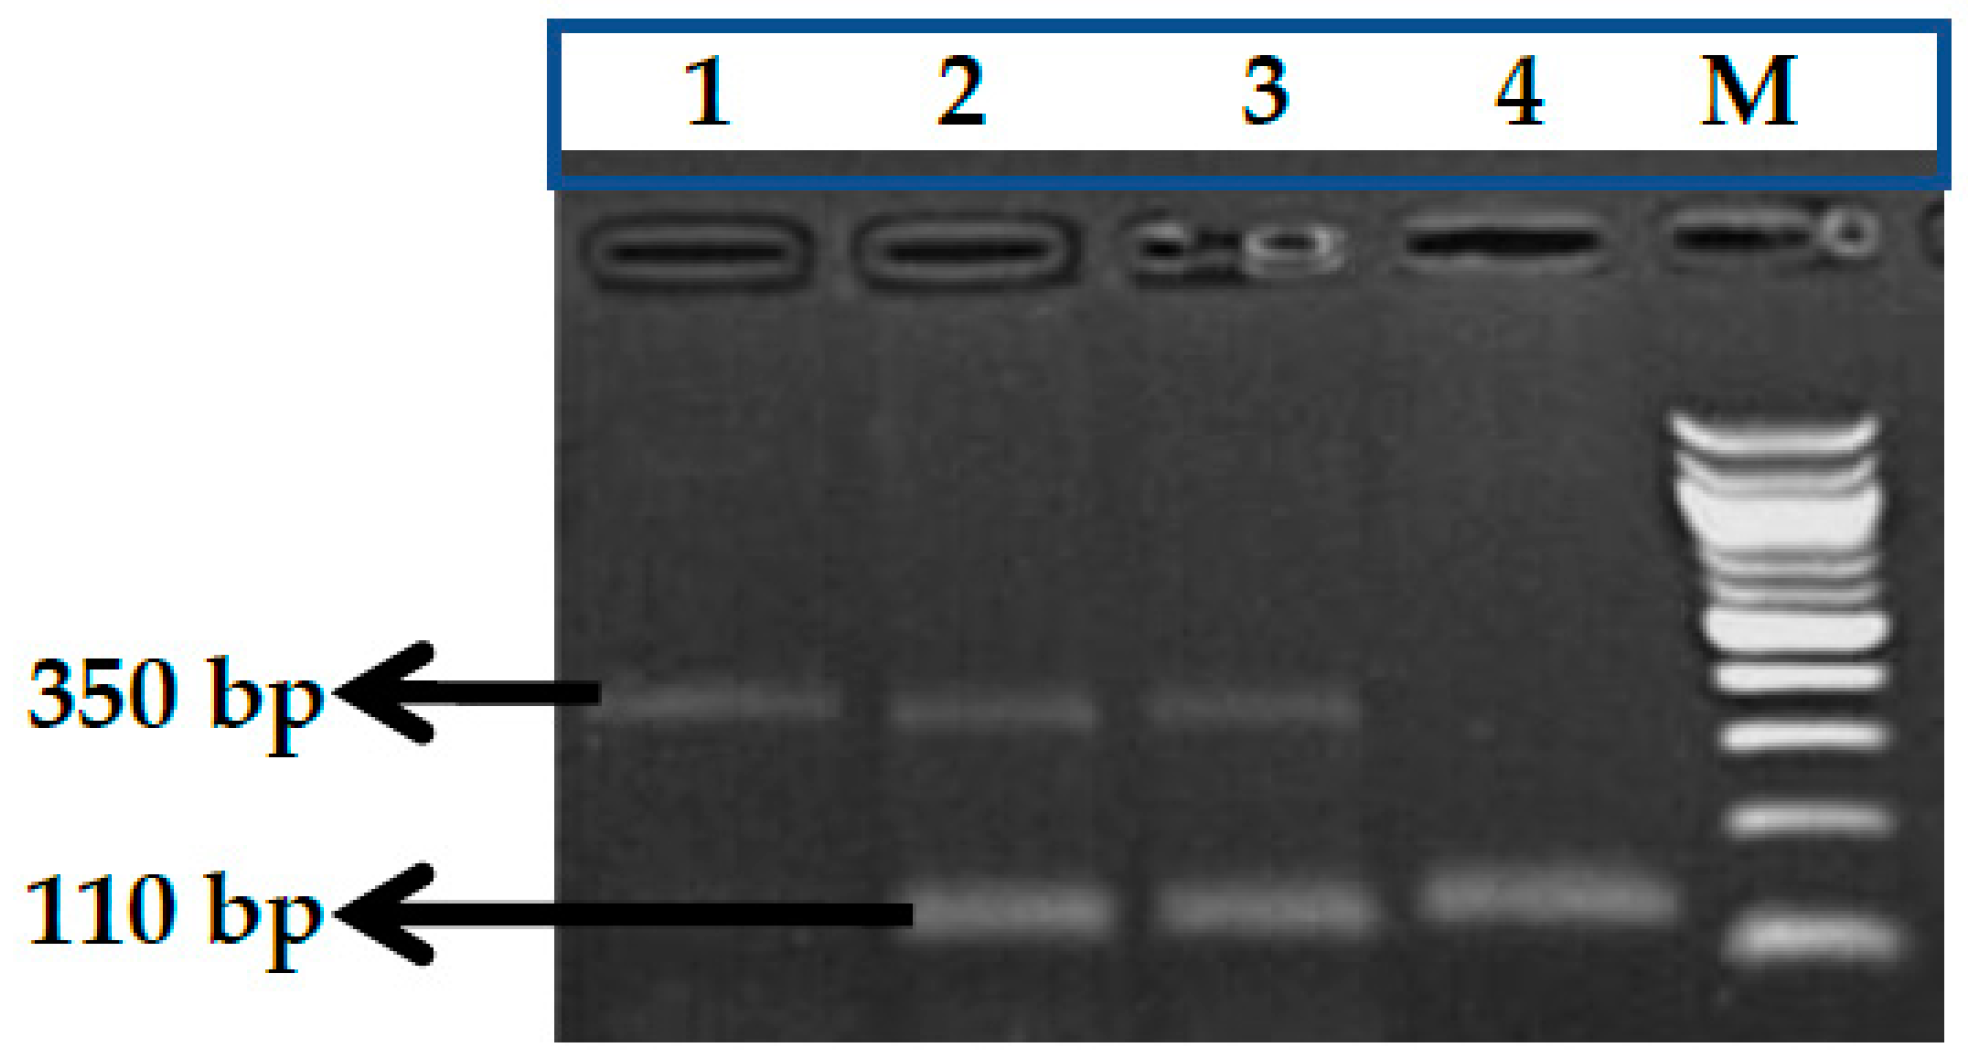
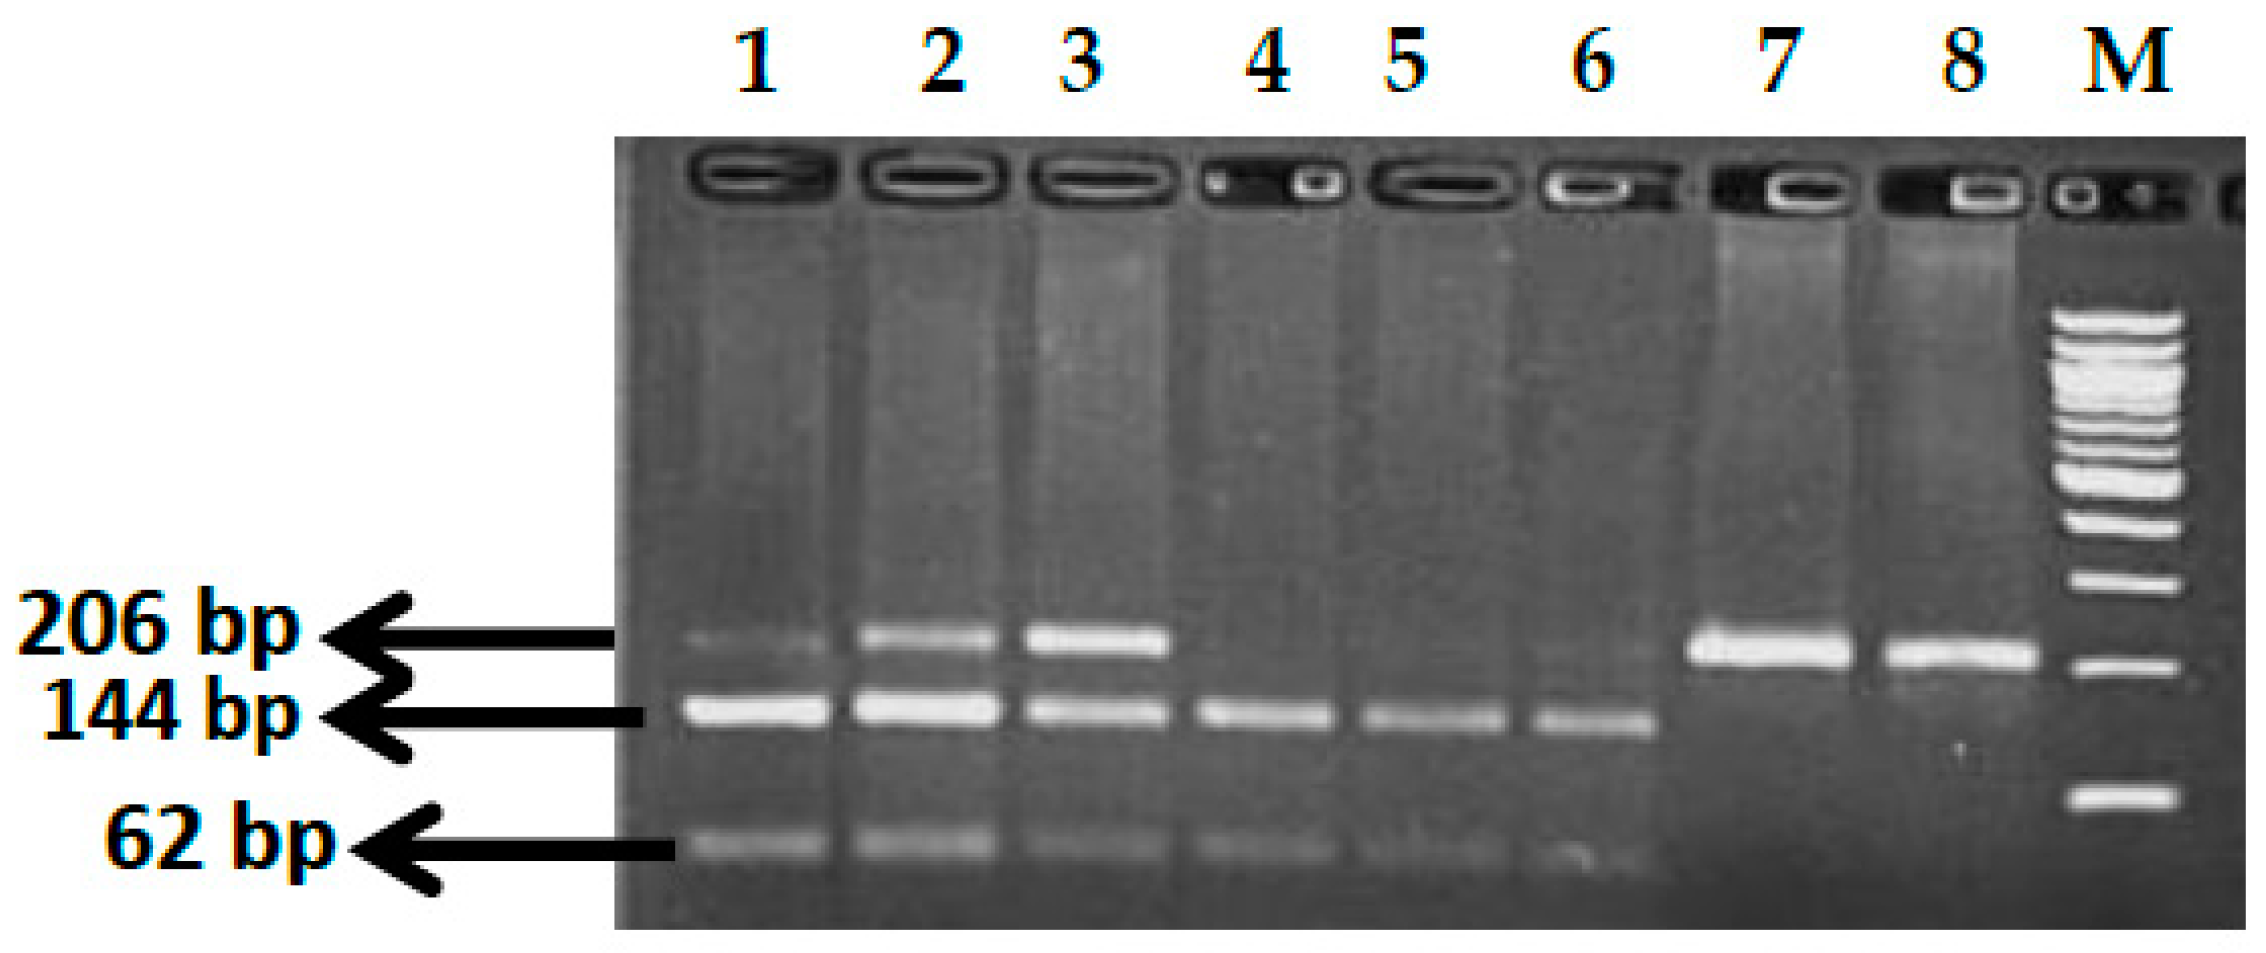
3.1. BCL11A rs1427407 (G>T) Polymorphism

The genotype frequencies of BCL11A rs1427407 (G>T) polymorphism in a group of patients with low HbF (<40%) and in a group of patients with high HbF (>40%) (Table 2). We found a significant difference in genotype distributions of BCL11A gene, (rs1427407) for the heterozygous genotype (GT) with p-value = 0.034, OR = 0.321, 95% CI = 0.113 to 0.916) and homozygous mutant genotype TT with p-value = 0.039, OR = 0.329, 95% CI = 0.114 to 0.944) between patients’ groups.
Figure 1 shows the gel pictures of wild type, heterozygous mutant and homozygous mutant genotypes for BCL11A gene, rs1427407 (G>T) polymorphisms. Sanger sequencing was performed to validate the results (Figure 2).

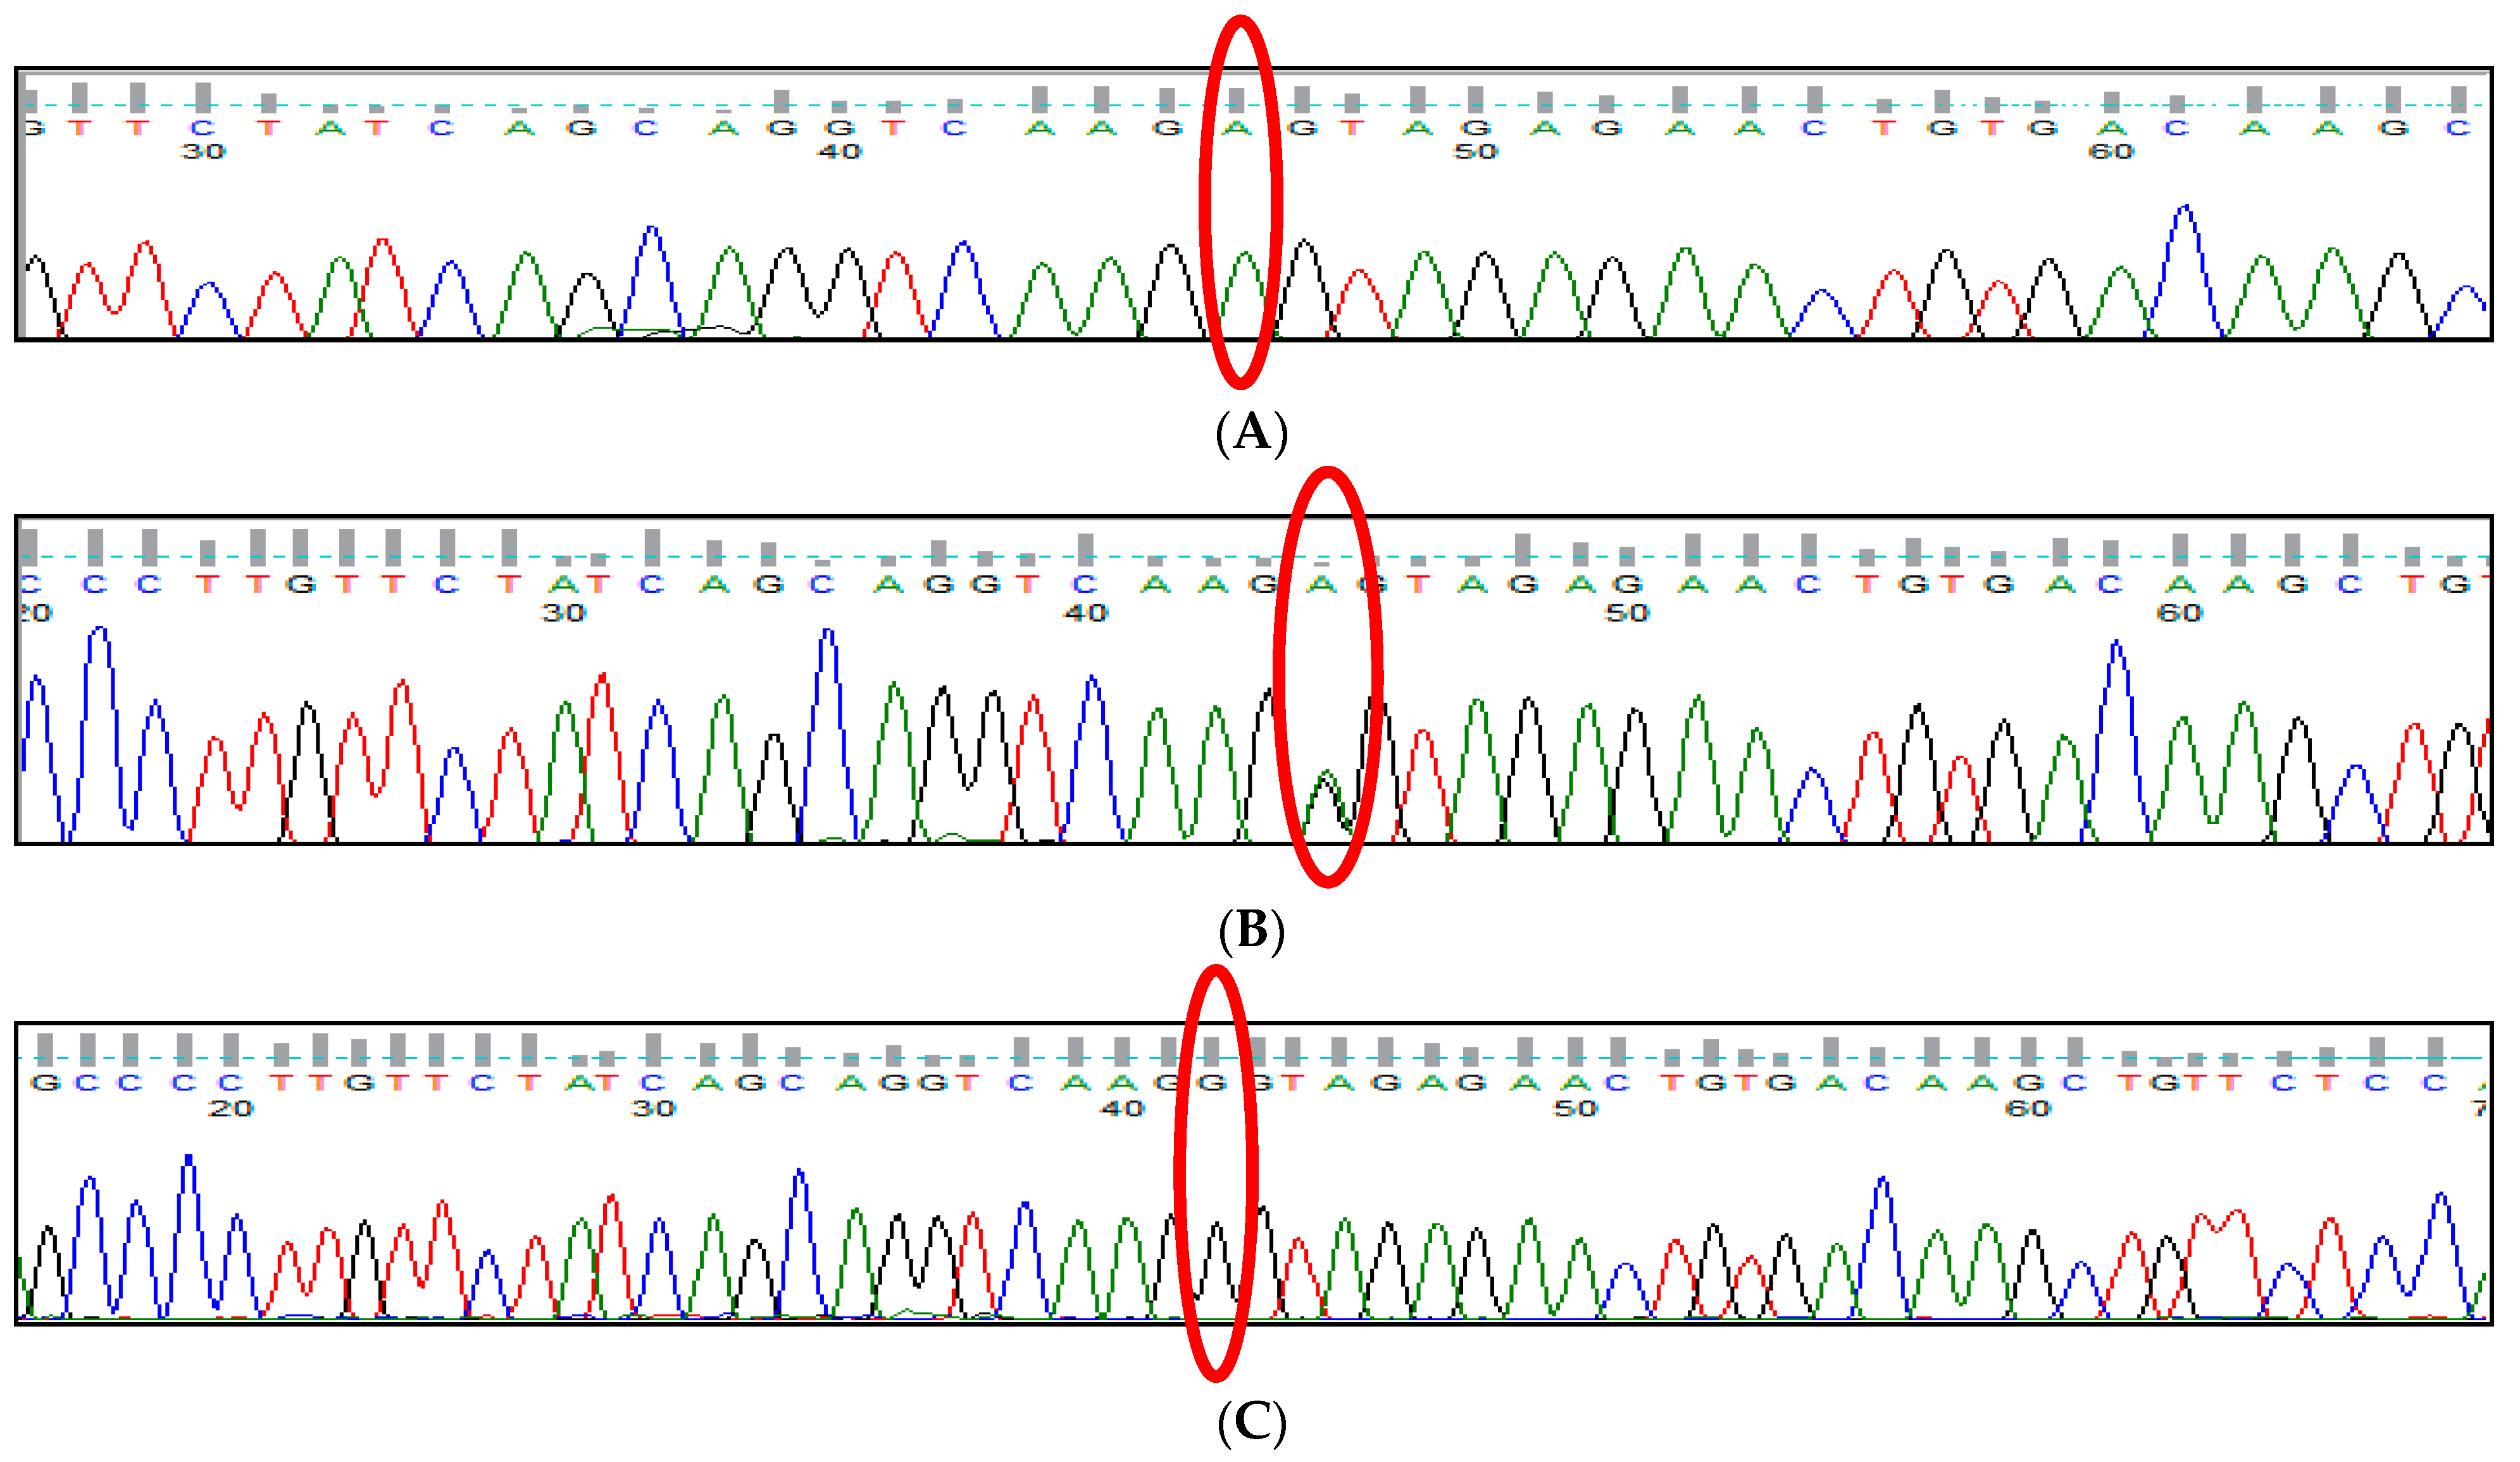
3.2. BCL11A rs766432 (A>C) Polymorphism

The genotype and allele frequencies of rs766432 (A>C) polymorphism present on BCL11A gene is shown in Table 2. A gel picture of BCL11A rs766432 (A>C) polymorphism is shown in Figure 3. Sanger sequencing was performed for the validation of the RFLP result (Figure 4).

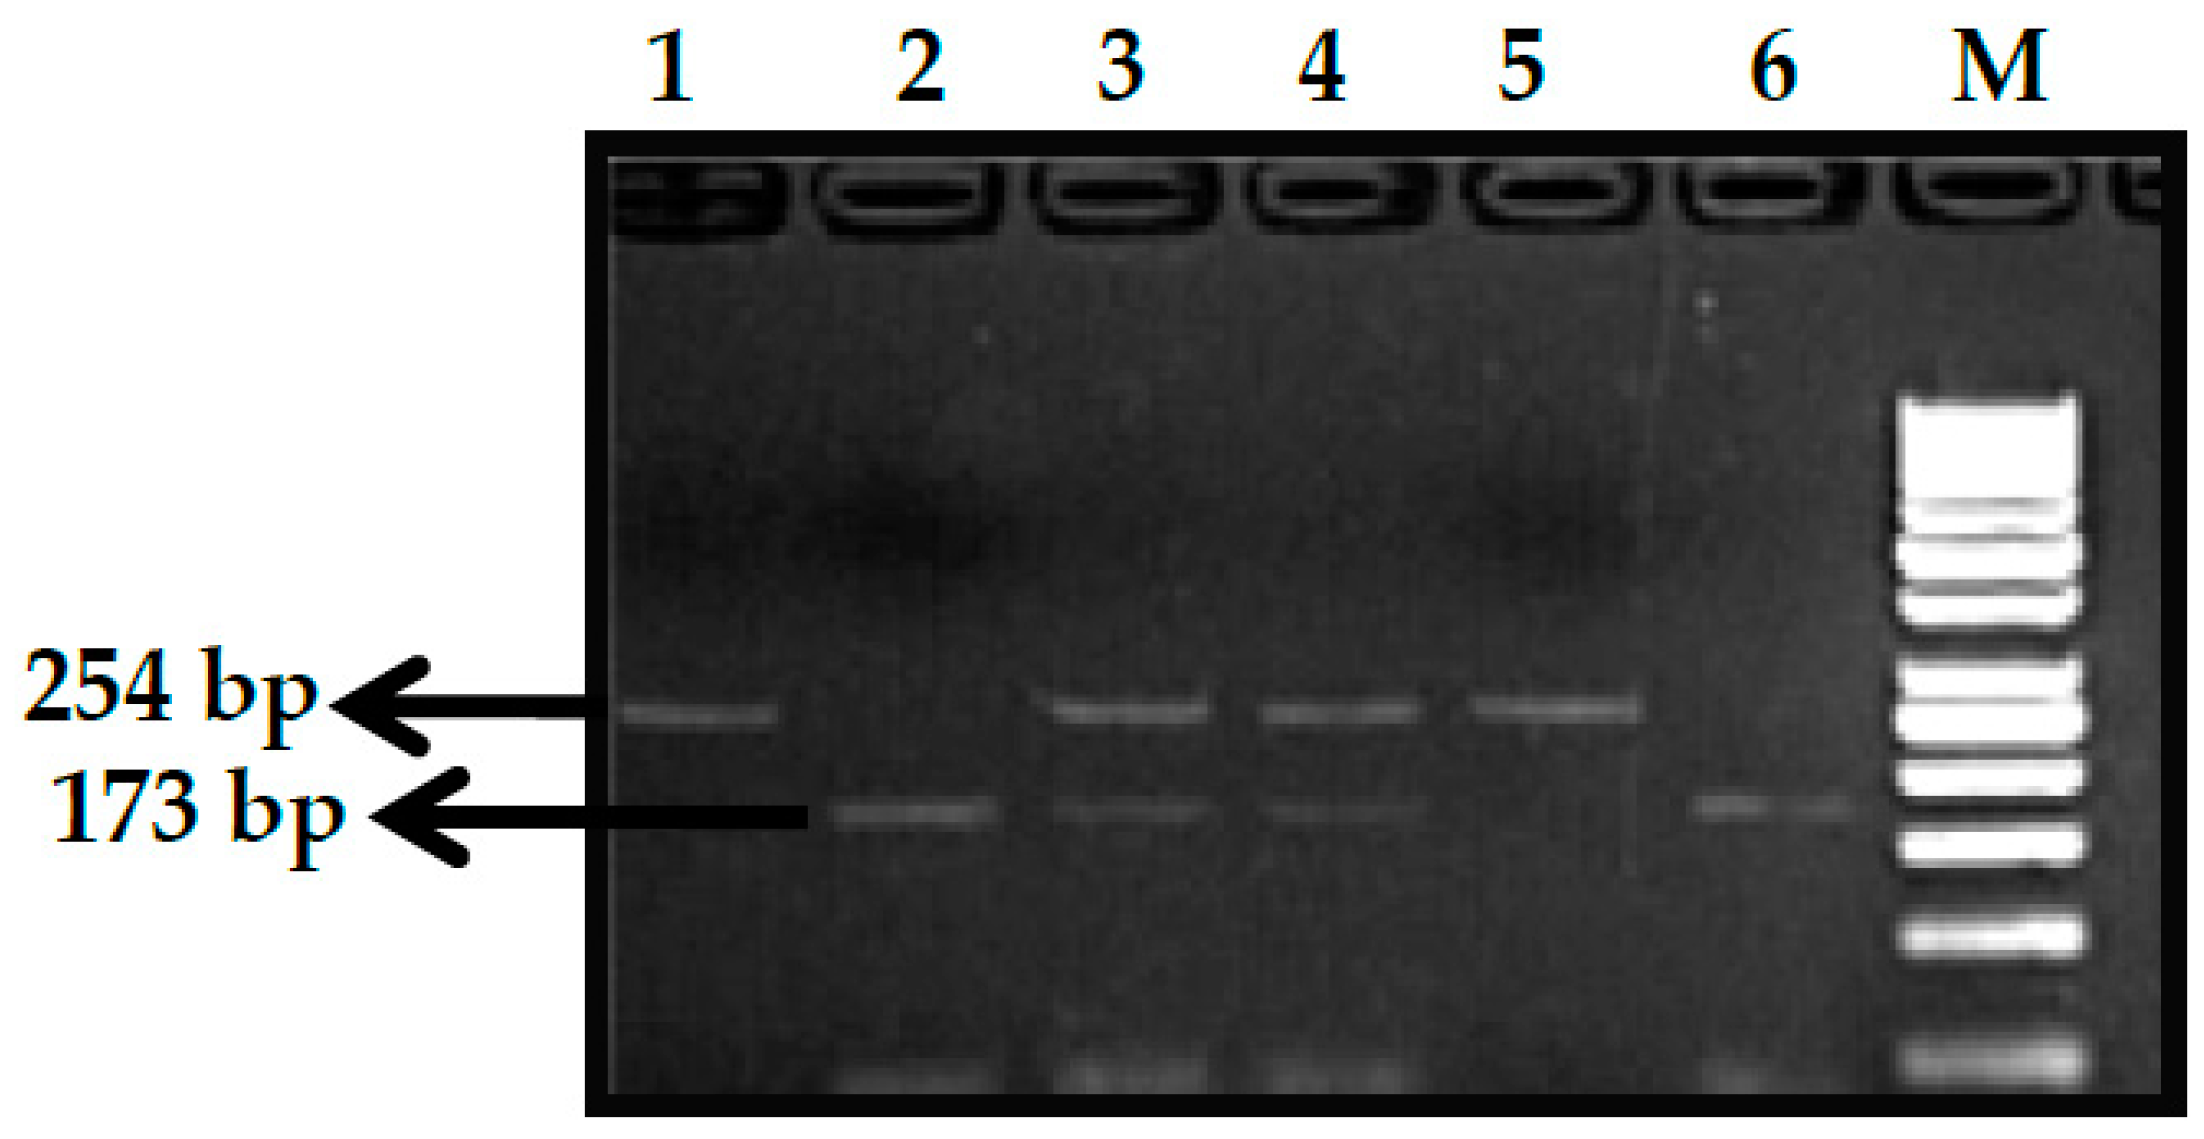
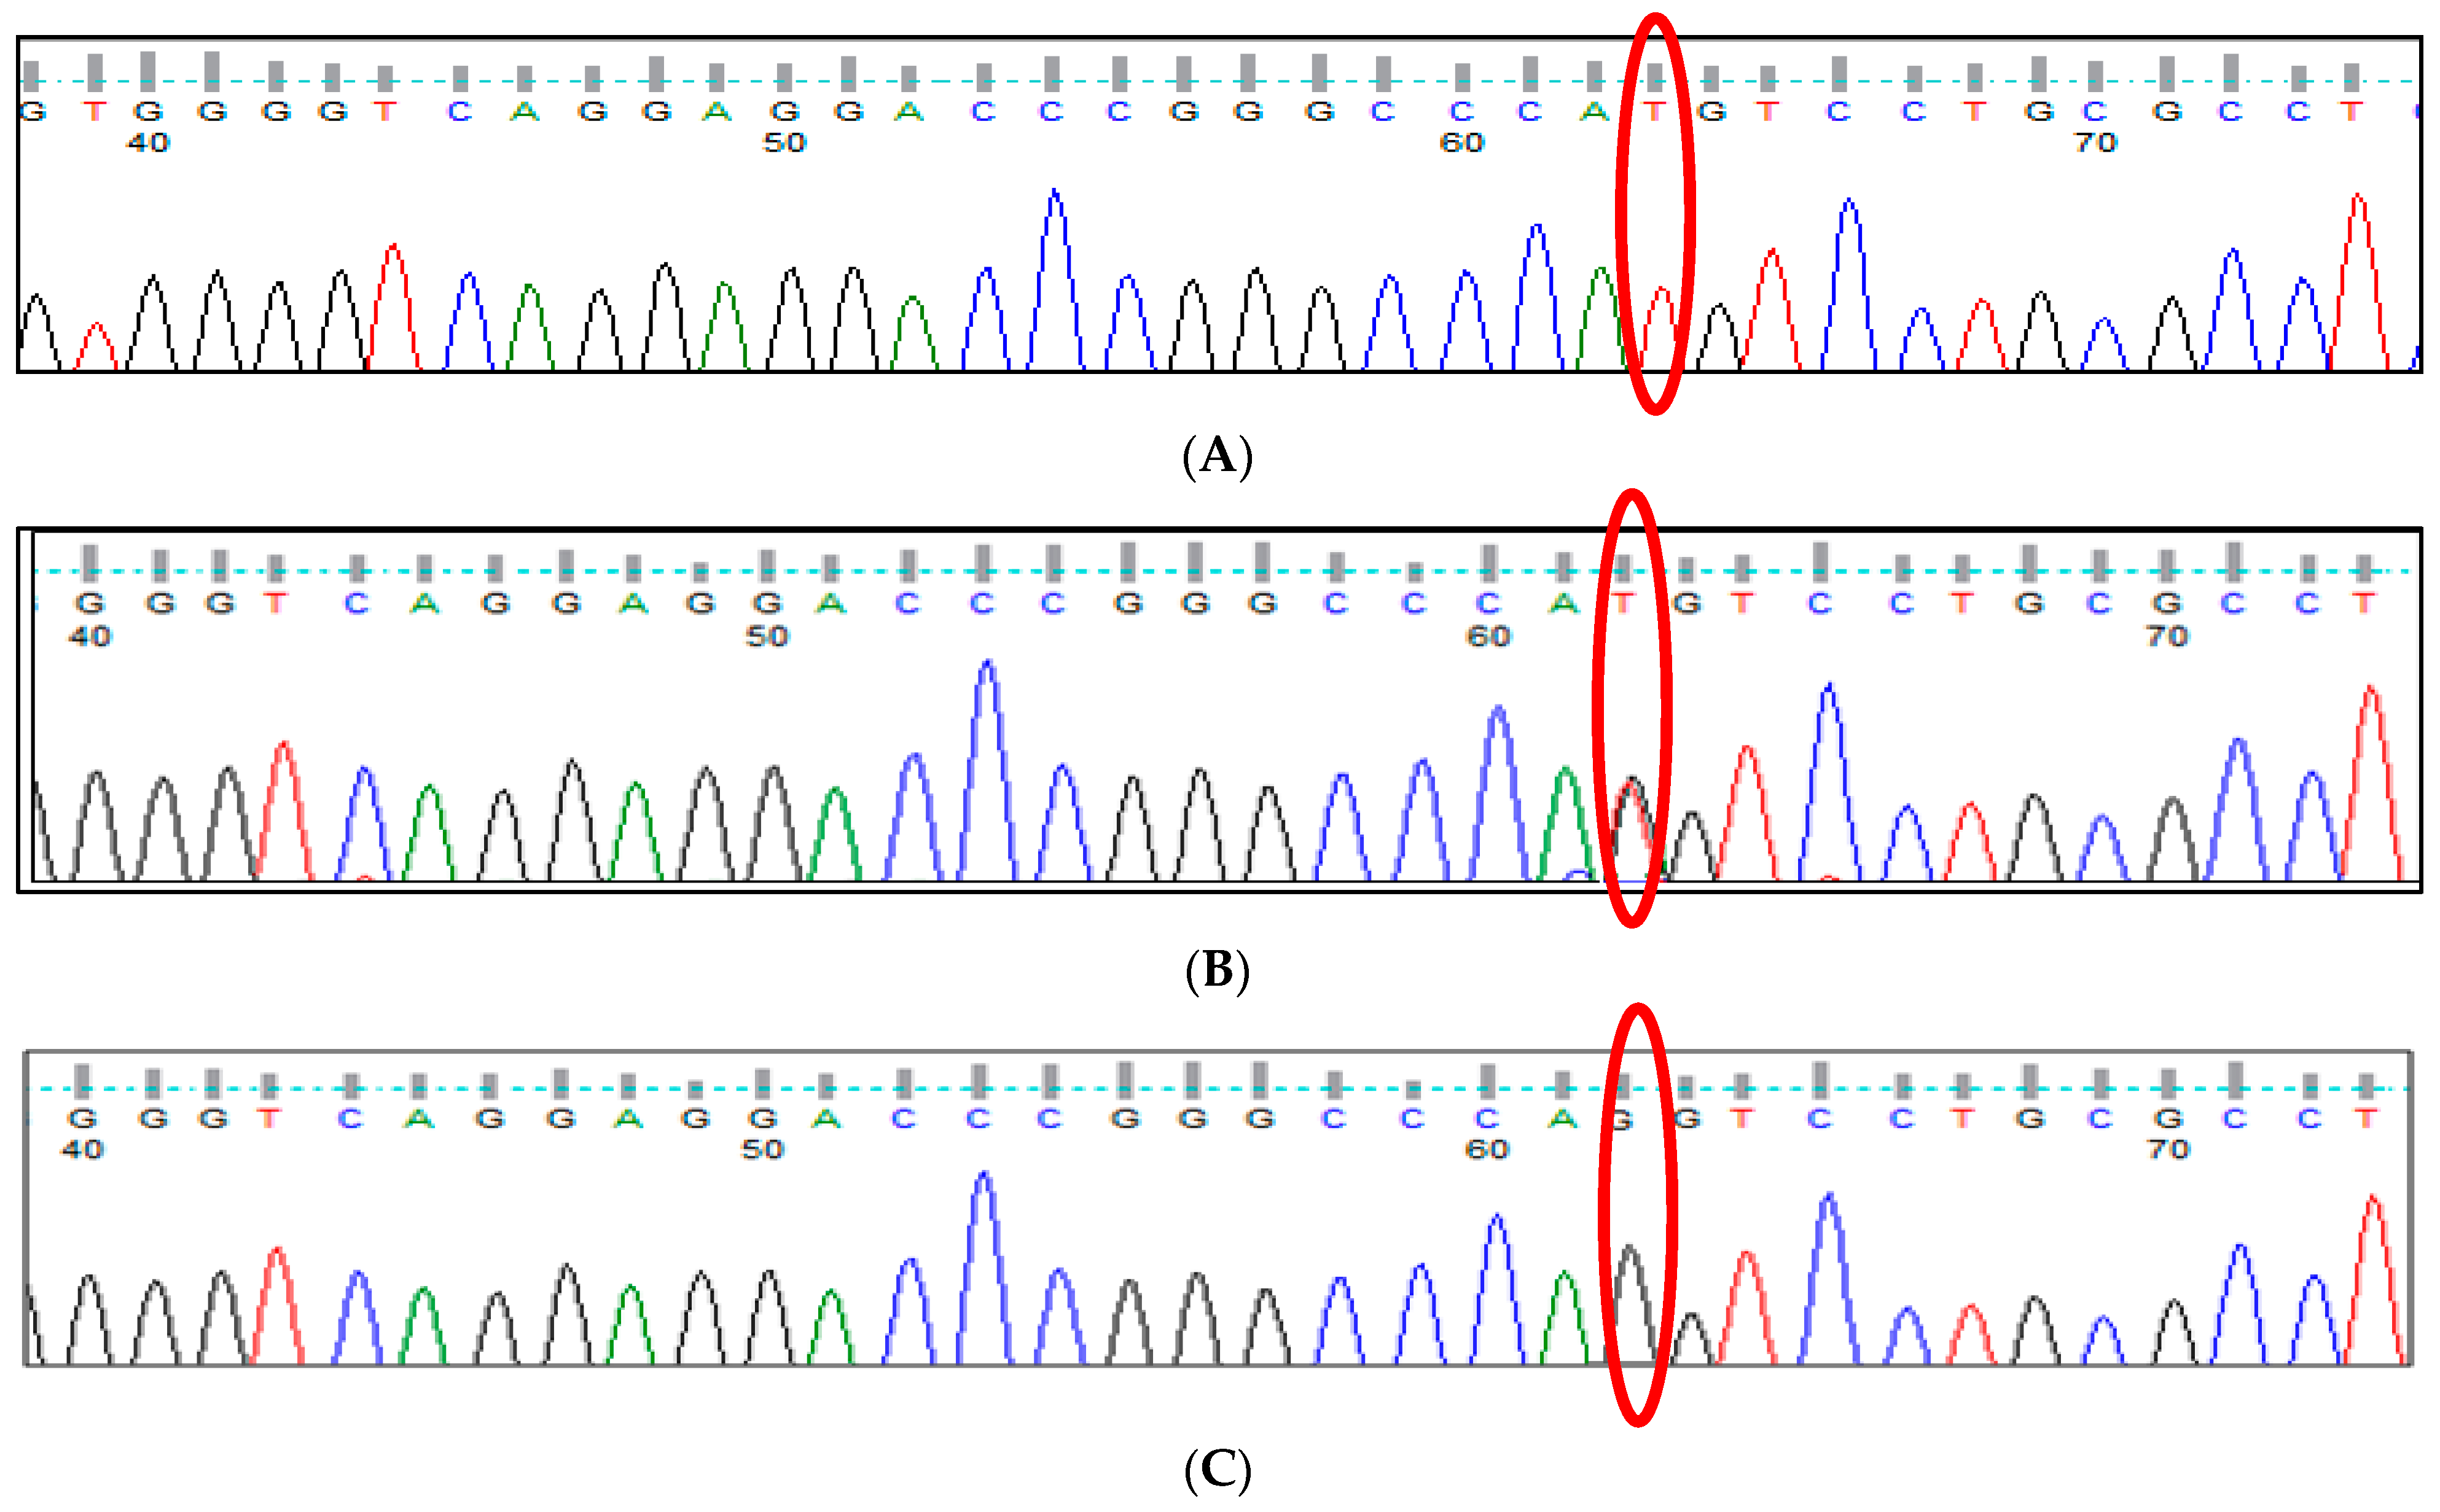
3.3. BCL11A rs11886868 (C>T) Polymorphism

The genotype and allele frequencies of the rs11886868 (C>T) polymorphism present on the BCL11A gene is mentioned in Table 2. A gel picture of the PCR product of BCL11A rs10189857 (A>G) polymorphisms run on 2% agarose gel is shown in Figure 5. The Sanger sequencing performed for the validation of results is shown in Figure 6.

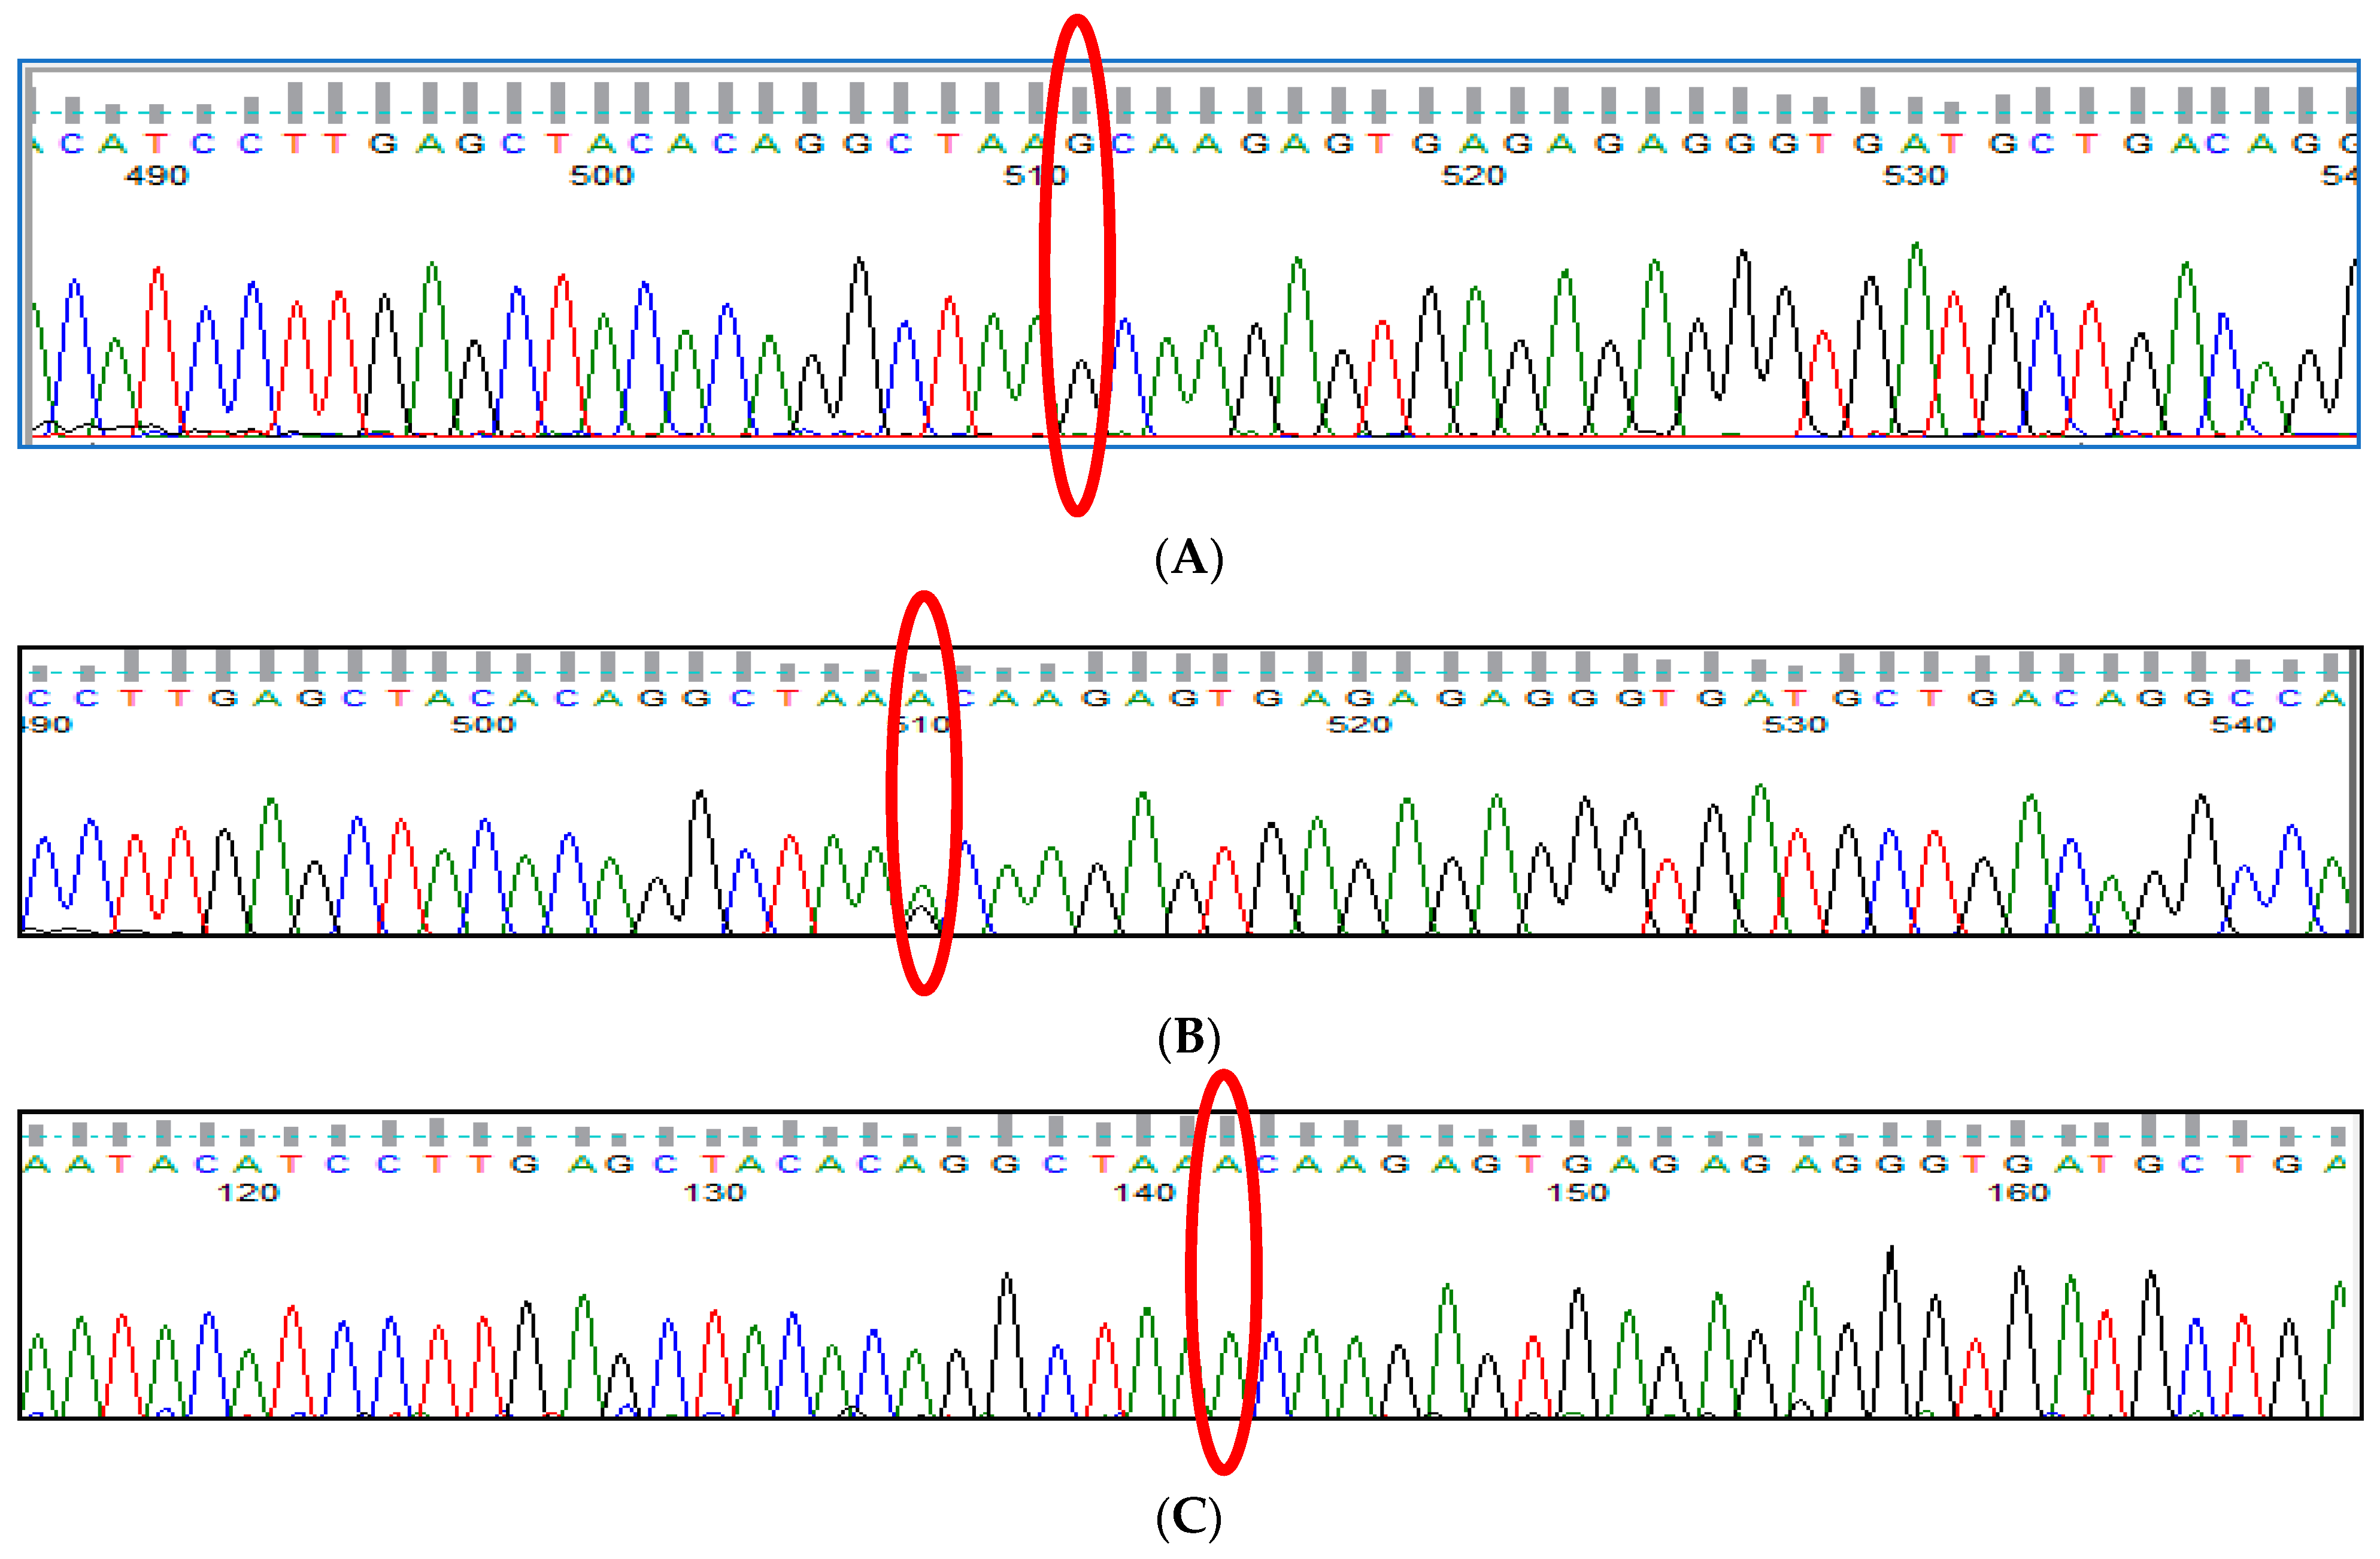
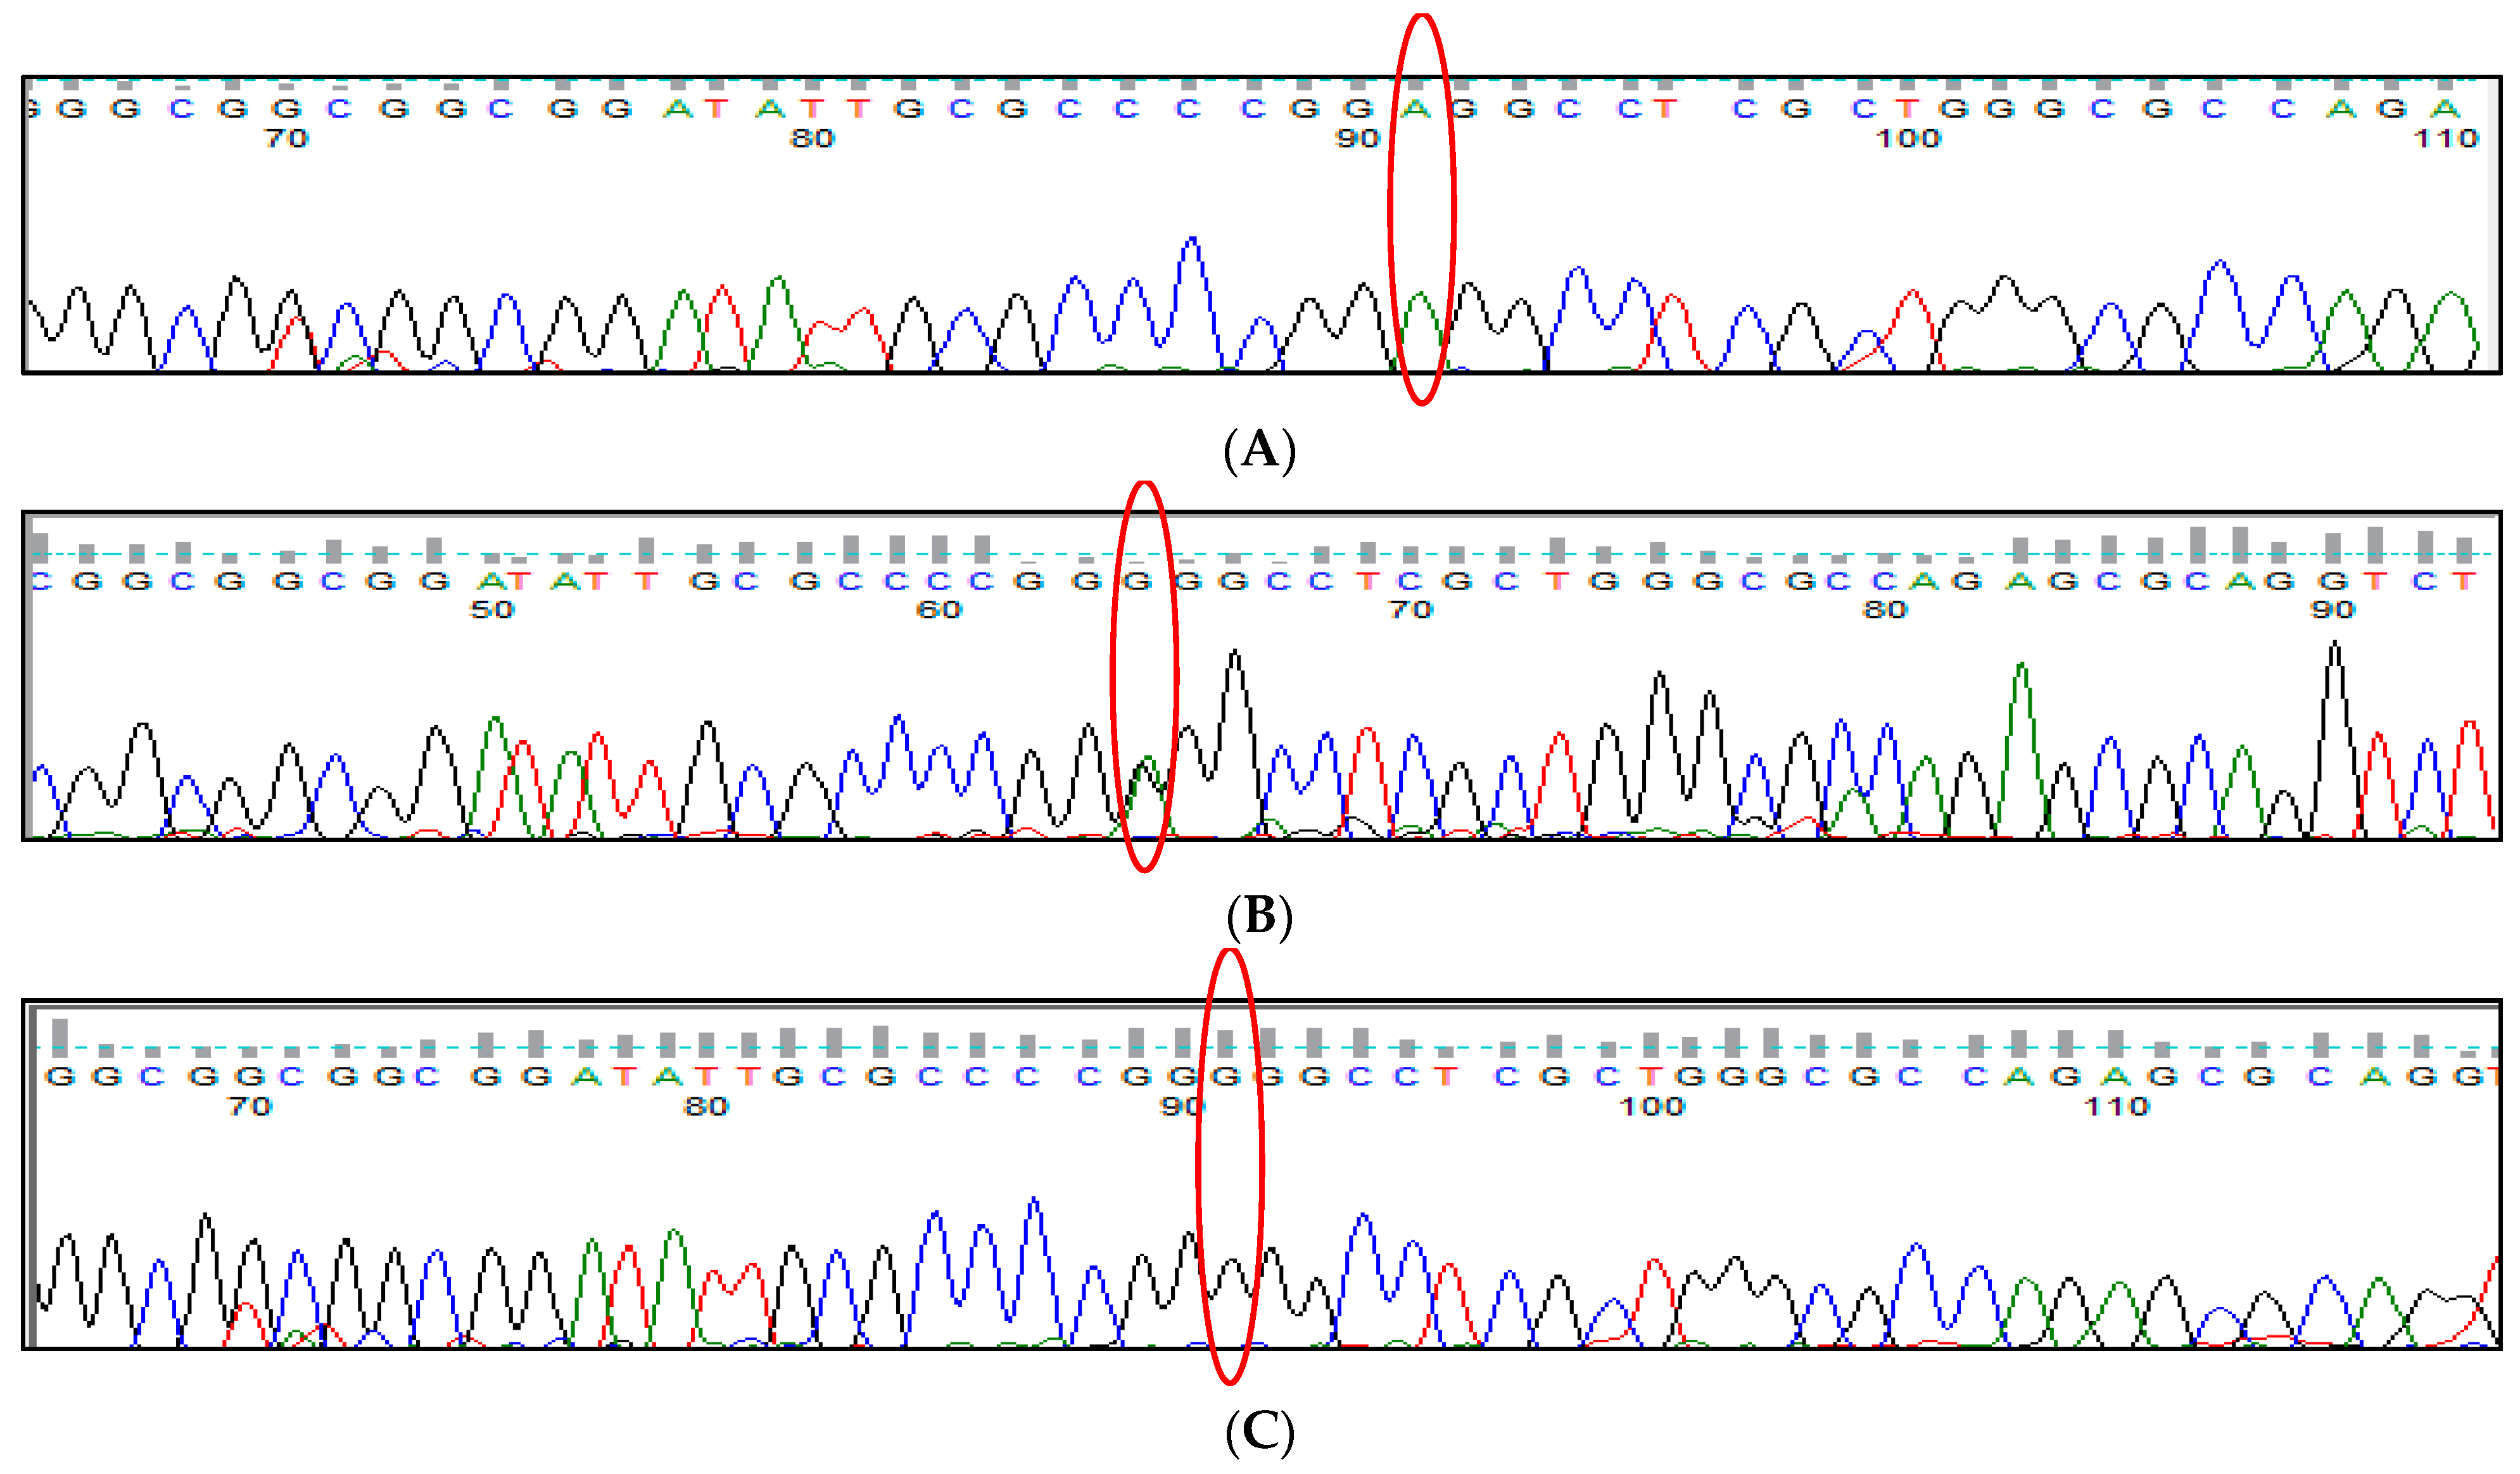
3.4. BCL11A rs4671393 (A>G) Polymorphism

The comparison of the distribution of the genotype and allele frequencies between the two groups with high and low HbF levels indicated that the genotypes AG (heterozygous) and GG (homozygous mutant) of the BCL11A gene, rs4671393 (A>G) polymorphism had no significant difference in the distribution of this variant between the two groups as p value is >0.05 (Table 2). A gel picture of the PCR product of BCL11A rs10189857 (A>G) polymorphisms run on 2% agarose gel is shown in Figure 7. The Sanger sequencing performed for validation of results is shown in Figure 8.

3.5. BCL11A rs10189857 (A>G) Polymorphism

The genotype frequency distribution of the rs10189857 (A>G) BCL11A gene variant compared between patients with low and high levels of HbF (Table 2). A gel picture of the PCR product of BCL11A rs10189857 (A>G) polymorphisms run on 2% agarose gel is shown in Figure 9. The Sanger sequencing performed for validation of results is shown in Figure 10.

3.6. BCL11A rs7557939 (G>A) Polymorphism

We investigated the impact of the BCL11A rs7557939 (G>A) variant in patients with low and high HbF levels (Table 2). A gel picture of PCR product of BCL11A rs7557939 (G>A) polymorphisms run on 2% agarose gel is shown in Figure 11. Sanger sequencing performed for validation of results is shown in Figure 12.

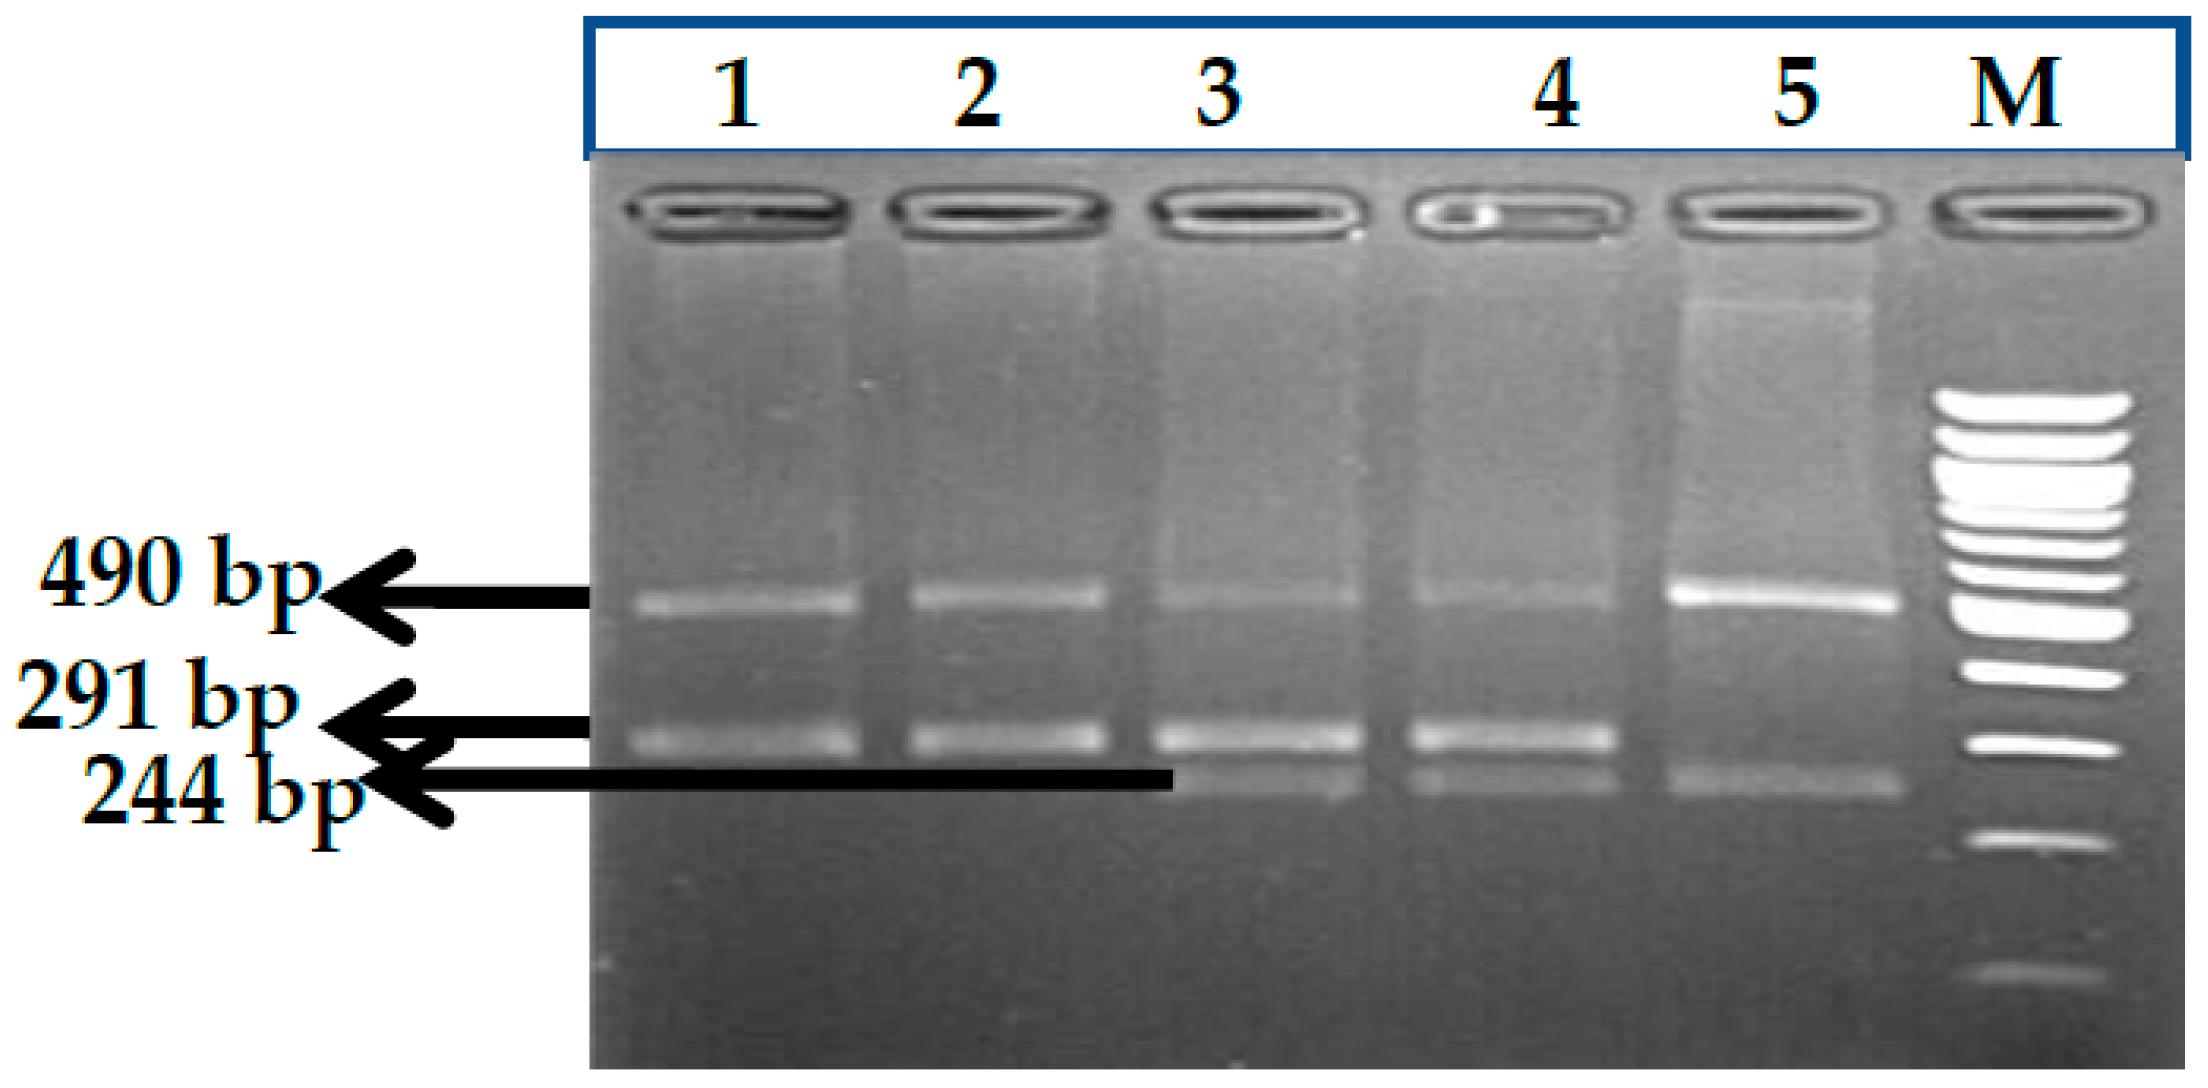
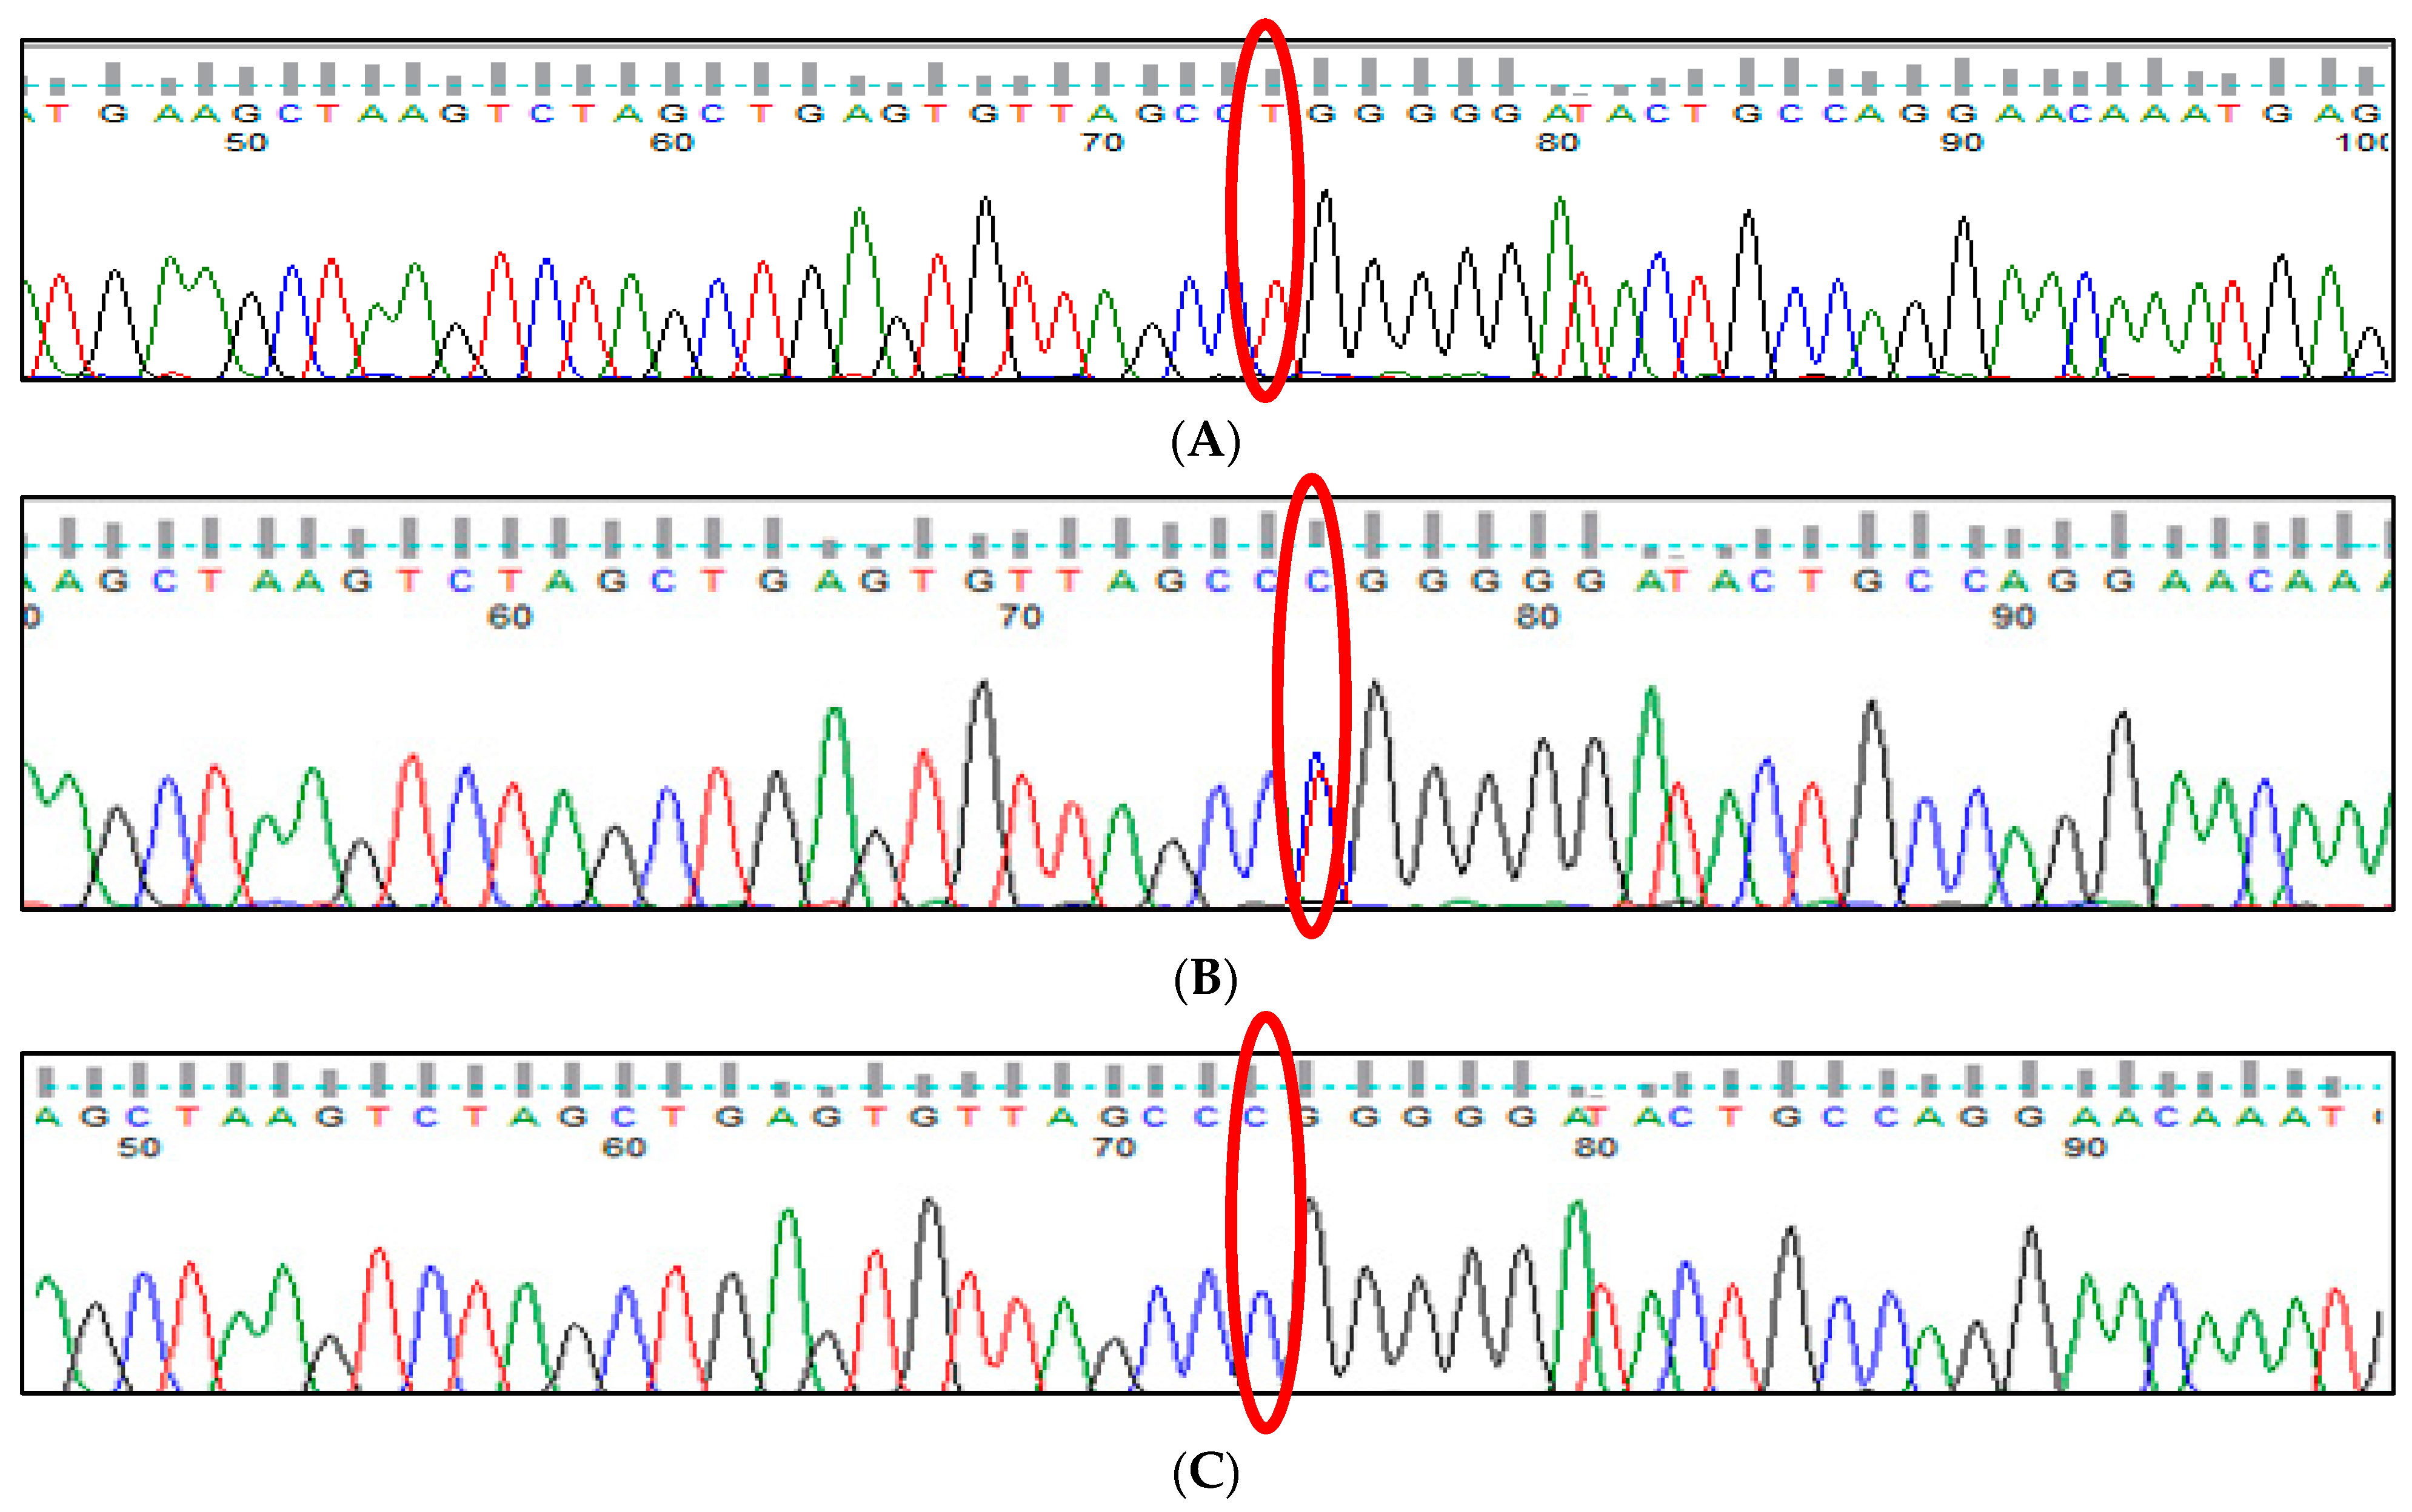
3.7. HBS1L-MYB rs9399137 (T>C) Polymorphism

The comparison of the distribution frequencies of genotype and allele between the two groups (Table 2). A gel picture of PCR product of HBS1L-MYB rs9399137 (T>C) polymorphisms run on 2% agarose gel is shown in Figure 13.

3.8. HBS1L-MYB rs9376090 (T>C) Polymorphism

The genotype frequencies of HBS1L-MYB rs9376090 (T>C) polymorphism in the group with low HbF levels and in the group with high HbF (Table 2). On comparing the genotypes and allele frequencies between two groups, we observed no significant difference for the HBS1L-MYB rs9376090 (T>C) variant with a p > 0.05. A gel picture of PCR product run on 2% agarose gel is shown in Figure 14. The Sanger sequencing performed for validation of results is shown in Figure 15.

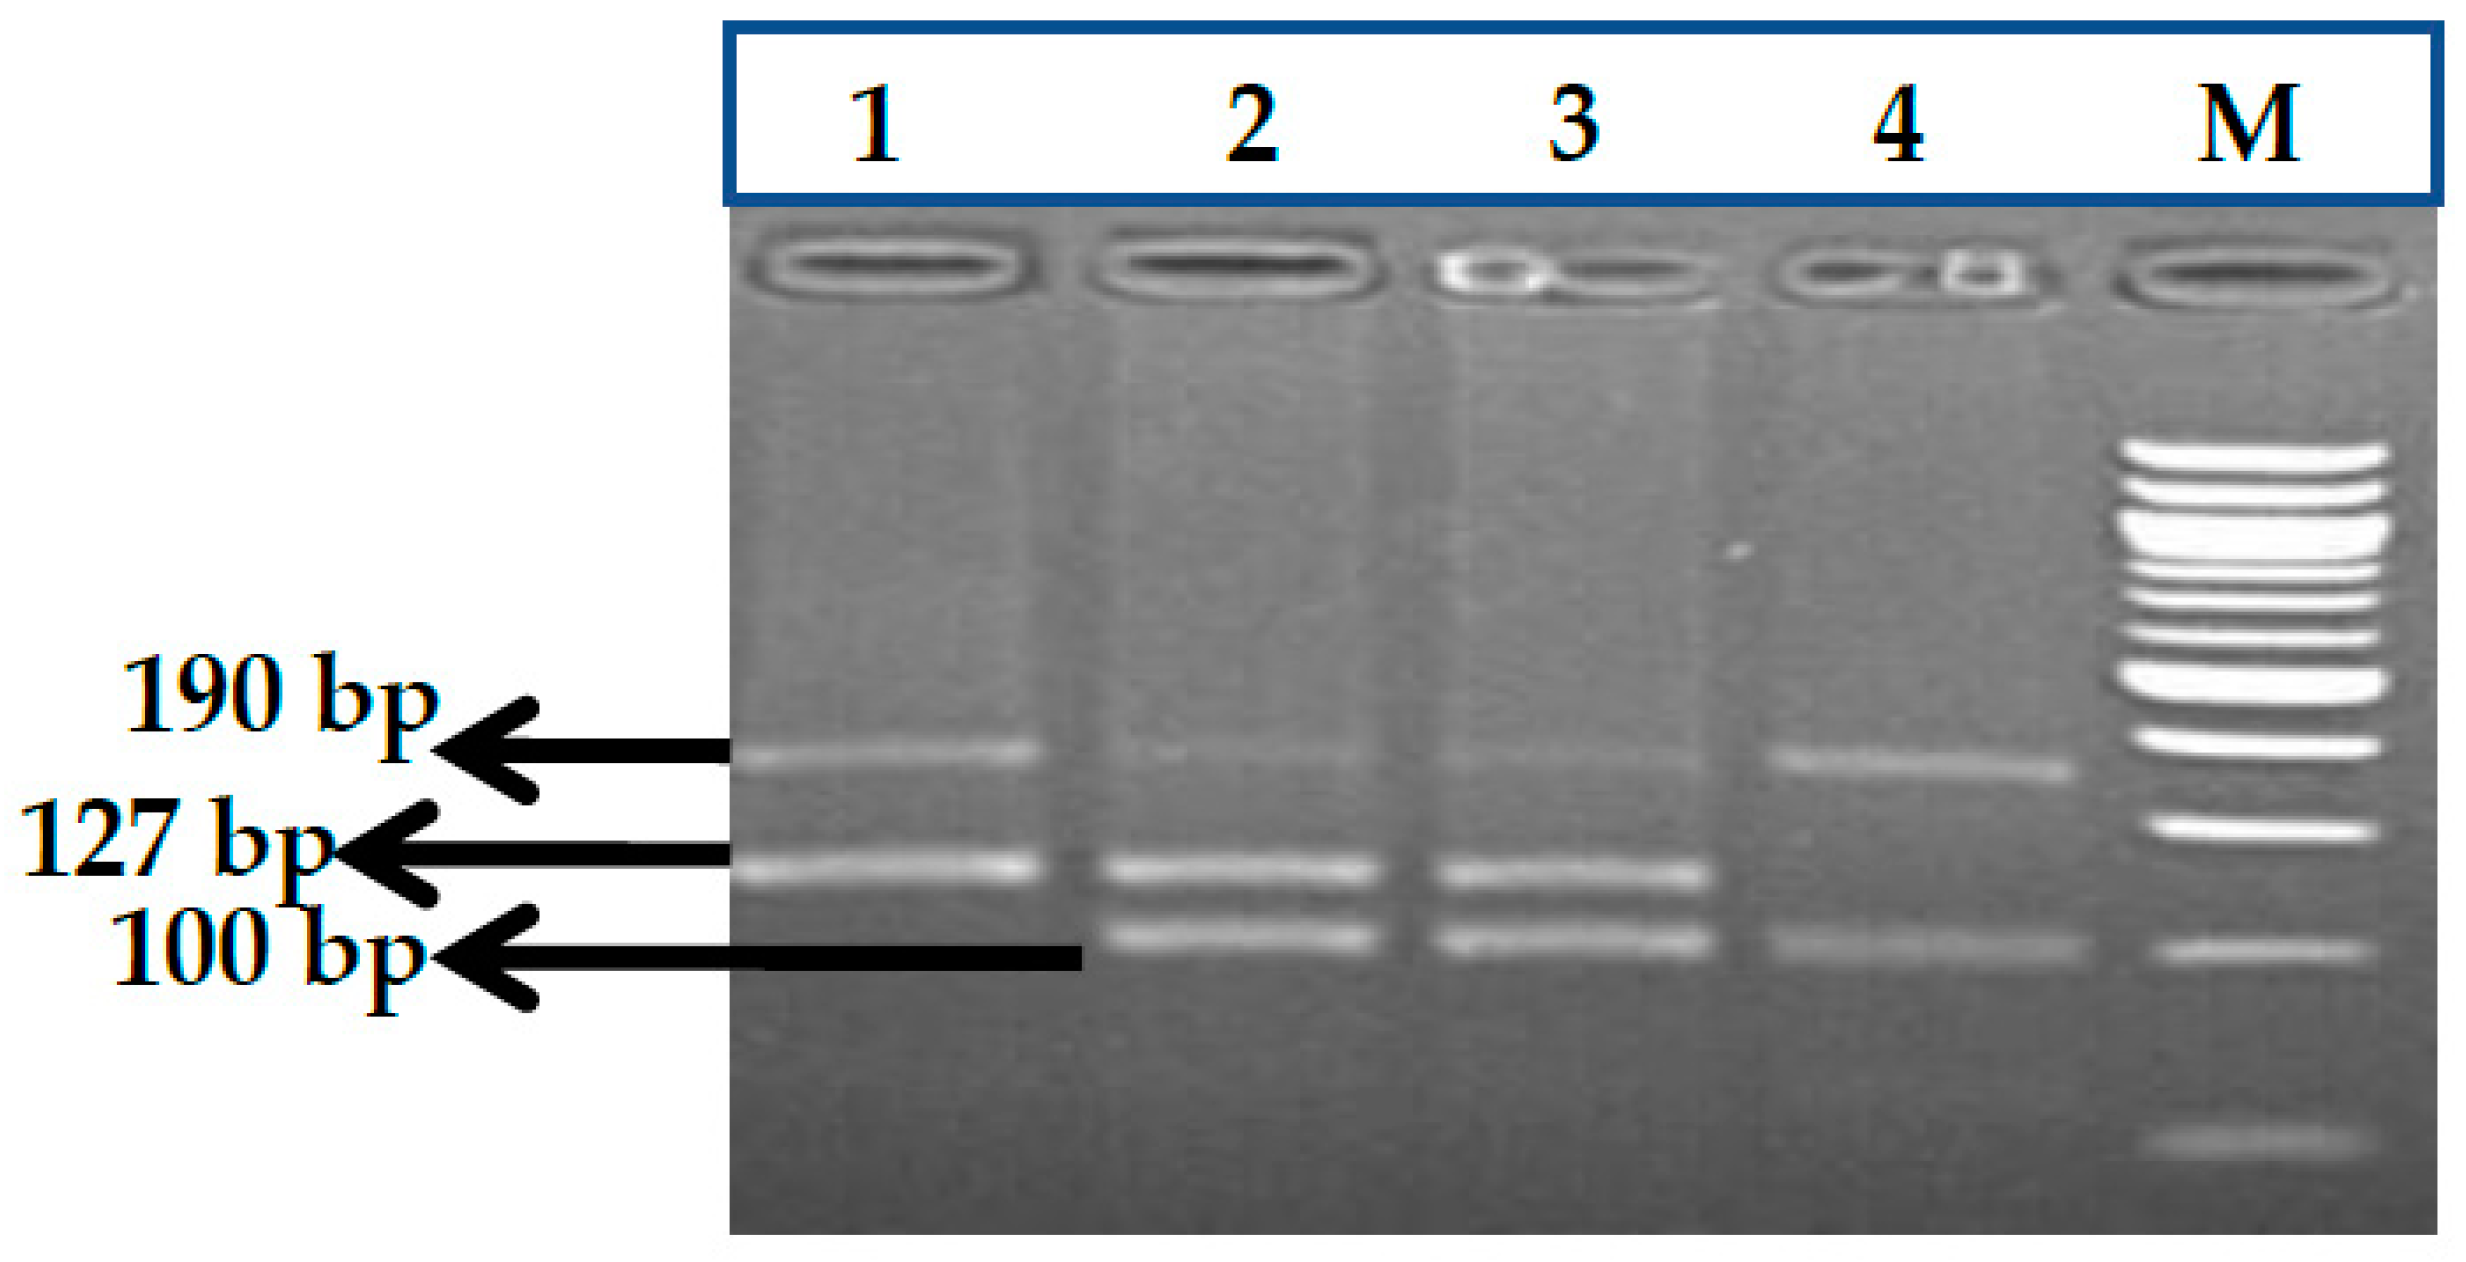
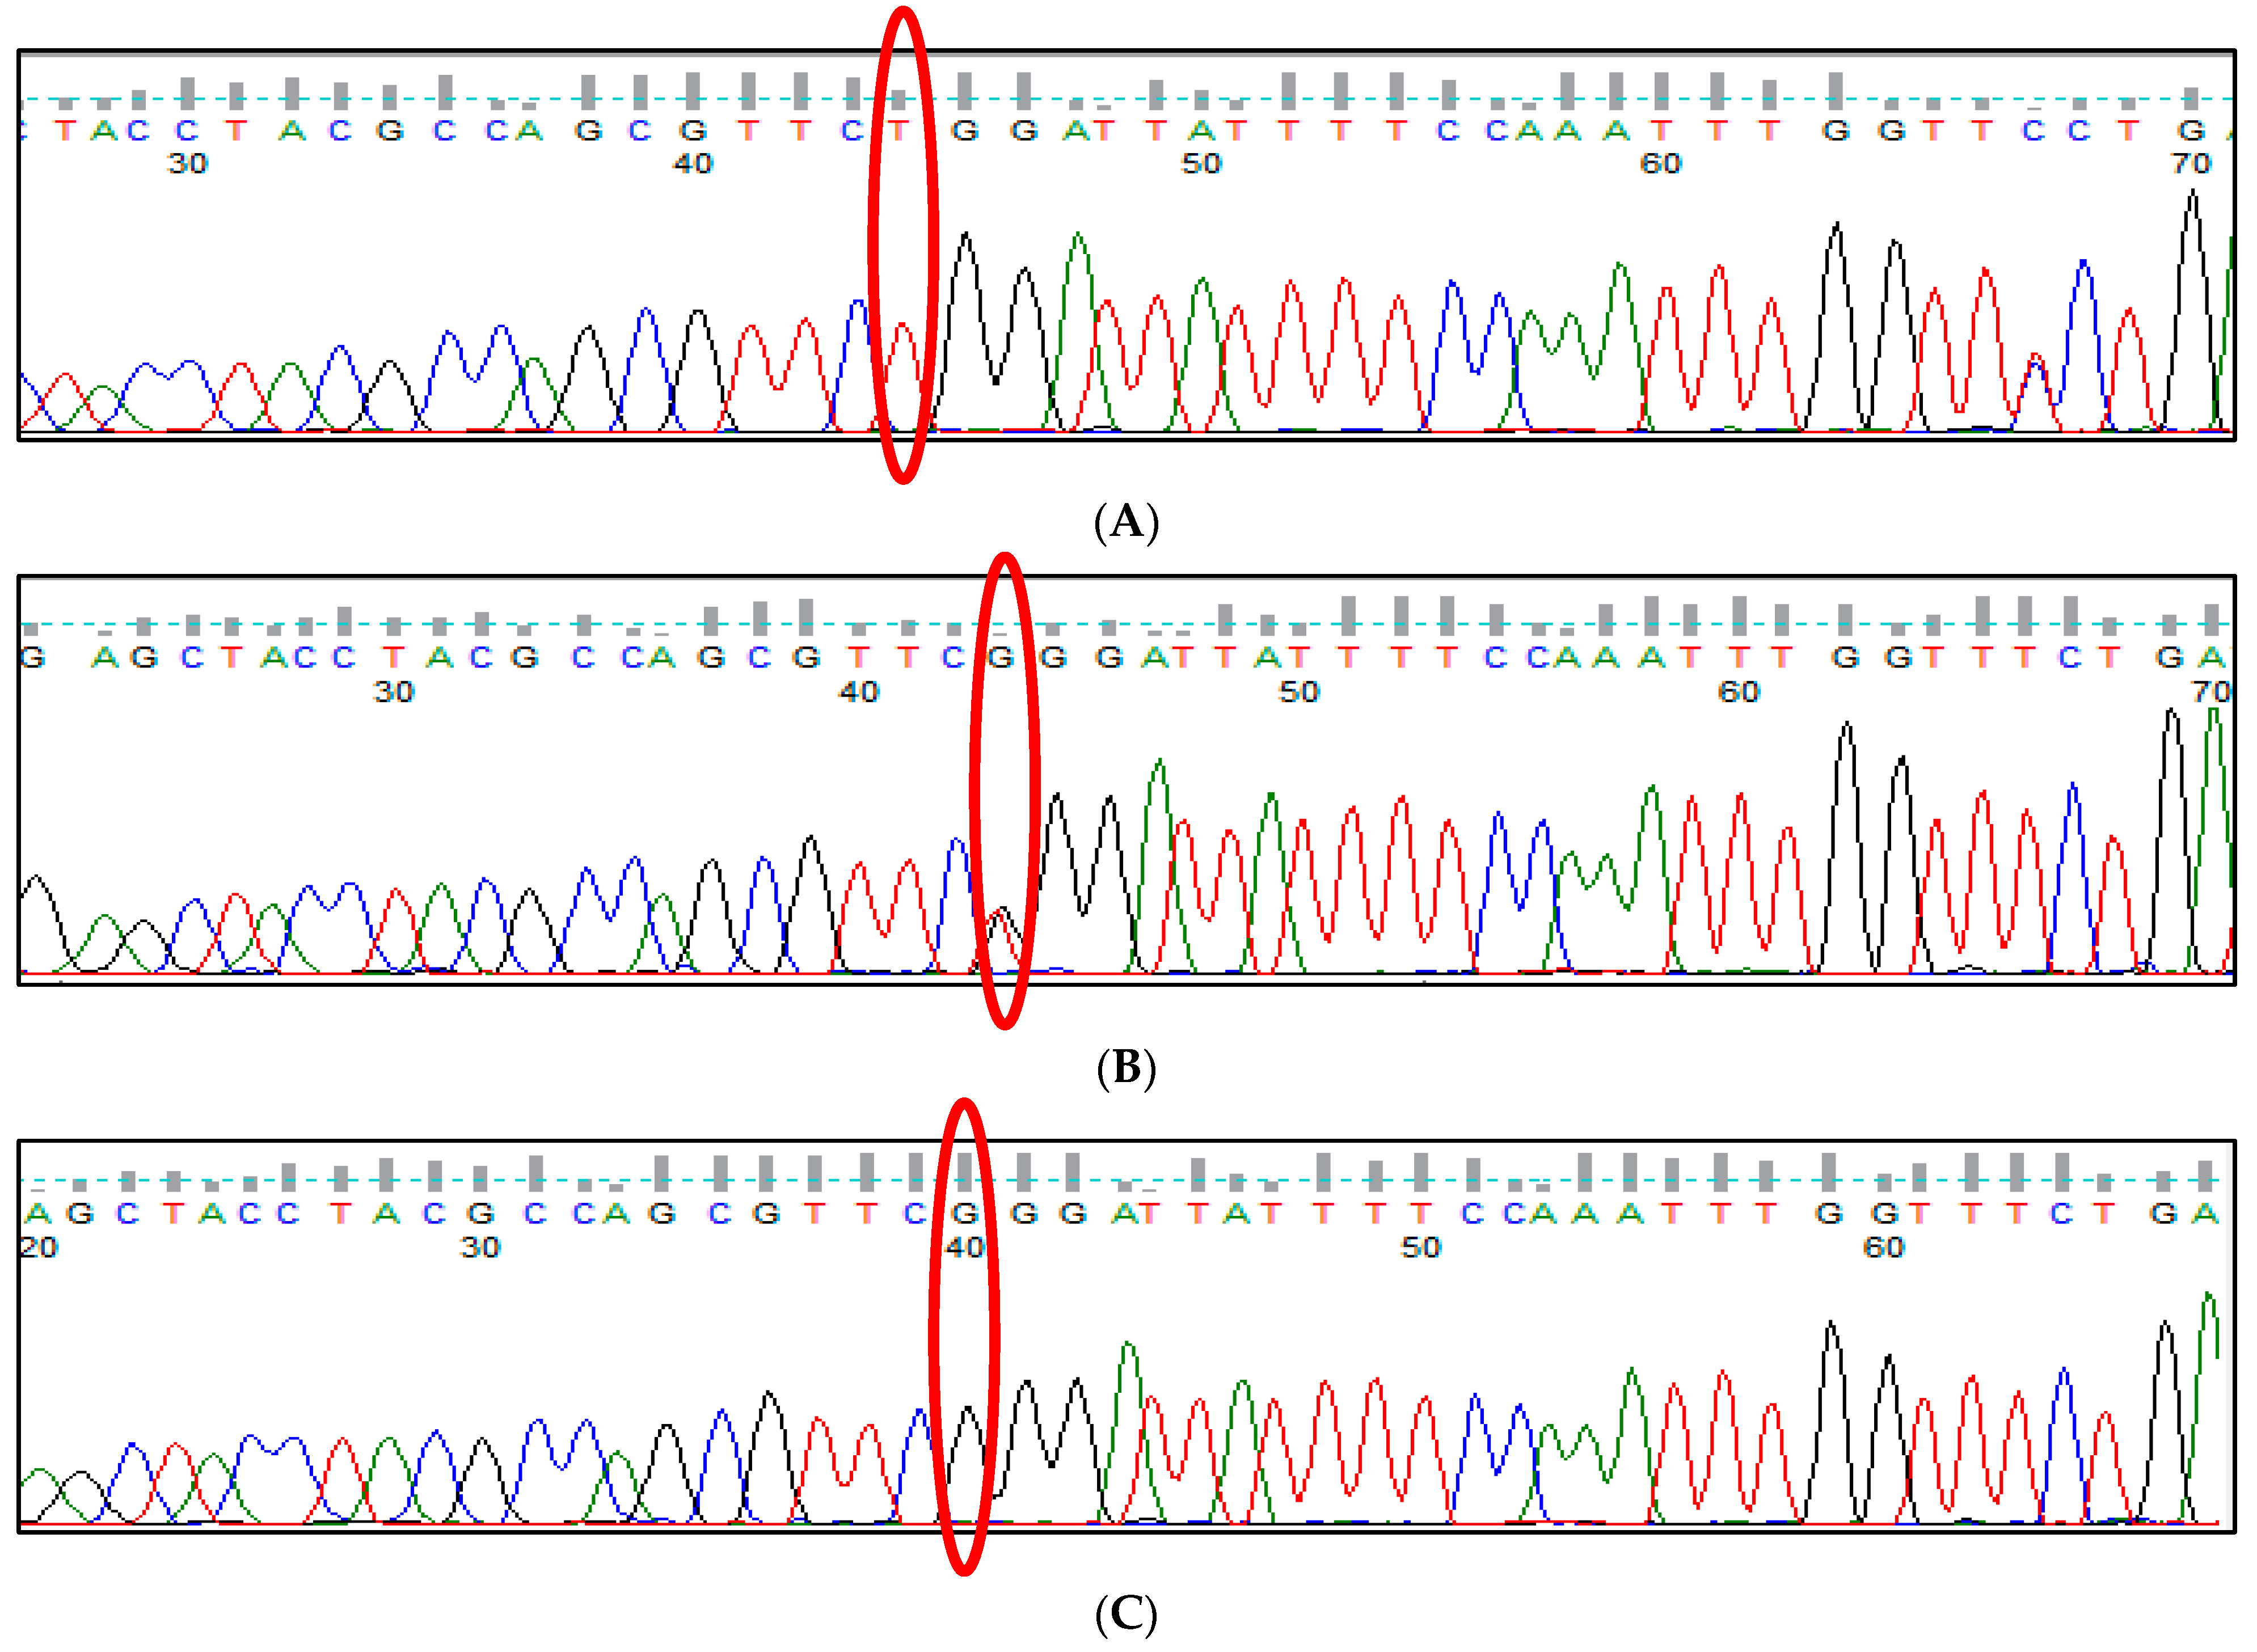
3.9. HBS1L-MYB rs28384513 (A>C) Polymorphism

The genotype frequency distribution of HBS1L-MYB rs28384513 (A>C) polymorphism between high and low HbF groups. The statistical analysis shows that genotypes (AA, AC, CC) and allele C are not associated with fluctuations in HbF level (Table 2). A gel picture of the PCR product run on 2% agarose gel is shown in Figure 16. The Sanger sequencing performed for validation of results is shown in Figure 17.

3.10. KLF1 rs2072597 (A>G) Polymorphism

Genotype frequency distributions for KLF1 rs2072597 (A>G) polymorphism in patients with two groups, low and high HbF levels, are presented in Table 2. The representative gel picture of KLF1 rs2072597 (A>G) polymorphism showing three genotypes is presented in Figure 18. The Sanger sequencing was performed to validate the results is shown in Figure 19.

3.11. KLF1 rs112631212 (T>G) Polymorphism

The genotype and allele frequencies of rs112631212 (T>G) polymorphism, present on KLF1 gene is shown in Table 2. The representative gel picture and Sanger sequencing results are shown in Figure 20 and Figure 21, respectively.
Evaluation of hematological parameters in two groups of TM patients with low and high HbF levels.
The hematological data of individuals in the two groups are summarized in Table 3. All patients were treated with Deferasirox (Asunra 400 mg), an orally administered iron chelation agent. There was no significant difference in Hb, mean corpuscular volume (MCV), mean corpuscular hemoglobin (MCH), mean corpuscular hemoglobin concentration (MCHC) and HbA2 level except the HbF level between the two groups with high and low HbF levels. The mean of hemoglobin, MCV, MCH, MCHC, HbA2 and the ferritin level of the 100 β-thalassemia major patients were 6.9 ± 1.3, 67.7 ± 5.1, 22.6 ± 3.8, 28.6 ± 3.6 and 546.1 ± 379.2, respectively. The range of HbF in patients was 3.1–95.0%. Only twenty patients were found to have an HbF level below 10%. All other patients in the low HbF group had a value of HbF between 3.1 and 40.1%. From the total patient group, the HbF pretransfusion level was >40% in 62 patients and <40% in 38 patients. We found a significant variation for HbF and HbA levels between two groups with p-value < 0.05.

3.12. Comparison of Clinical Parameter between Two Groups of TM Patients

Clinical parameters such as hepatomegaly, splenomegaly and transfusion history were compared between the groups of patients with high and low HbF levels (Table 4).
From the study groups, 14 patients had hepatomegaly and 86 patients had splenomegaly. There was no association of HbF levels with hepatomegaly p value = 0.849 and splenomegaly p value = 0.113 between TM major patients of two groups with low and high HbF levels.
We obtained the details of time intervals between two consecutive transfusions in the TM patients. In this study, we found that patients who have shown low HbF levels need transfusions at shorter intervals of time (i.e., at 3 weeks) than patients with high HbF levels (transfused at 4 weeks) and this relationship was statistically significant with a p-value = 0.013.

3.13. Influence of Genetic Modifier Variants on HbF and on Hematological Parameters

HbF levels were strongly influenced by two variants on the BCL11A gene, (rs11886868, rs1427407) out of eleven tested modifier gene variants. The HbF-promoting alleles at BCL11A (rs11886868, rs1427407) had the strongest effect on HbF levels with a Beta value-0.200, p value-0.038 and a Beta value-0.215, p value-0.028, respectively (Table 5). The HbF-promoting polymorphism of BCL11A gene (rs4671393) among all genotyped genetic markers of modifier genes for increased HbF was positively associated with increased Hb levels, but no change were observed in MCV, MCH and MCHC values (p > 0.05). However, another variant on the KLF1 gene, (rs2072597) had a significant effect on HbA levels (Beta value-0.266, p value-0.016). All the values for each hematological parameter were adjusted for HbF, and age and gender were included as covariates.

3.14. Age of Onset of the Disease and Age at First Blood Transfusion among TM Patients with Low and High HbF Levels

In the group of patients with low HbF levels (<40%) 16 (30.2%), patients were diagnosed at less than 1 year of age whereas 37 (69.8%) were diagnosed at an age of more than 1 year. However, 25 (53.2%) patients were diagnosed at the >1 year age in the group with high (>40%) HbF whereas 22 (46.8%) were those who were diagnosed at <1 year of age. On comparing the p-value for the age of diagnosis before and after 1 year between TM patients with high and low HbF levels we have not found a significant p-value 0.066. A total of 16 (32.0%) TM patients received their first blood transfusion before one year of age and 34 (68.0%) after one year of age in the low (<40%) HbF levels group. However, in 28 (56.0%) patients, transfusion was required after 1 year age whereas 22 (44.0%) were those who were transfused at <1 year of age in group among the high (>40%) HbF levels group. For the age at first transfusion the p value (0.151) was not found to be significant.
A correlation was also evaluated between patient groups who were diagnosed and first transfused before or after 1 year of age with selected genetic markers of modifier genes (Table 6 and Table 7) among TM patients with high and low HbF levels. Among the 11 selected genetic markers of the modifier gene, none of the polymorphism of the BCL11A, HBS1L-MYB, KLF1 gene, showed a significant p-value <0.05 among TM patients with high and low HbF levels group (Table 6 and Table 7). This shows that the presence of polymorphism on the modifiers’ gene is not associated with variation in age of onset and need for blood transfusions in TM patients.

3.15. In Silico Analysis for All Variants of Modifier Genes

The biological significance or functional impacts of the 10 noncoding single nucleotide variants (ncSNVs) and 1 missense variant of modifier genes (genetic marker) was determined using in silico tools (CADD phred and FATHMM pred) for variant effect prediction. For CADD C-Score, a Cut-off value >10 indicates potential pathogenic variants. However, in FATHMM, predictions are given as p-values in the range [0, 1]: values above 0.5 are predicted to be deleterious, while those below 0.5 are predicted to be neutral or benign. p-values close to the extremes (0 or 1) are the highest confidence predictions that yield the highest accuracy. We have found that out of 11 ncSNV, 1 ncSNV on BCL11A, 1 ncSNV on the HBS1L-MYB gene and 1 missense variant on the KLF1 gene, (rs112631212) were predicted to be pathogenic using the CADD and FATHMM tool (Table 8). Moreover, in the present study we found an association of BCL11A rs1427407 (G>T) polymorphism with increased HbF levels in beta thalassemia major patients. Thus, evaluation of the status of genetic marker of modifier genes and prediction of their pathogenic effect are useful in TM patients for better management of the disease.

4. Discussion

Beta-thalassemia is one of the most common hereditary disorders caused by a defective synthesis of β-globin chain or an imbalanced α/β chain ratio [31].
The clinical manifestations of β-thalassemia are extremely heterogeneous, ranging from the transfusion-dependent state to asymptomatic carrier condition [9]. It is now known that residual HbF synthesis in the adult stage is inheritable as a quantitative trait. Modifying factors that reduce the imbalance in α- vs. non α-hemoglobin chains are the genetic determinants of the clinical severity of β-thalassemia as well as SCA. The reduced globin chain imbalance allows the selective survival of the erythroid precursors and thereby reduces the unproductive erythropoiesis [32,33]. Moreover, the presence of genetic polymorphism in different modifier genes plays an important role in elucidating and ameliorating the pathogenesis of diseases. Thus, the present study was designed to evaluate the contribution of BCL11A, the HBS1L-MYB intergenic region and KLF1 gene polymorphisms on the variation in HBF levels in β-TM patients.
BCL11A gene that encodes zinc finger protein plays a central role in the silencing of HbF expression in humans, through binding the key regions in β-globin gene cluster and forming a HbF repressor complex (nucleosome remodeling and histone deacetylase, NuRD) to silence γ-globin gene expression [11,34,35].
It was previously reported that several polymorphisms within intron 2 of the BCL11A gene have been strongly associated with Hb F levels in different ethnic populations, reflecting the heterogeneity of the allele frequencies among different ethnic groups: rs766432, rs4671393, rs1427407 and rs11886868 [11,13].
The association of different polymorphisms present on the BCL11A gene, with variation in HbF levels, has been widely investigated, but interestingly, the conclusions reported in these studies varied significantly among different ethnic populations, as some authors have described the presence of associations for rs766432, rs4671393, rs1427407, rs11886868, rs10189857 and rs7557939 [11,22,36,37,38,39] variants and others have described the absence of associations for rs766432, rs4671393, rs1427407, rs11886868, rs10189857 [39,40] and rs7557939 [33,38] polymorphisms with variation in HbF levels in thalassemia major disease.
In this study, we examined the status of selected SNPs present on the BCL11A gene in β-thalassemia major patients to determine their association with variations in HbF levels. The selection of the SNPs was based on recently published studies in which these genetic variants were most strongly associated with increased HbF levels in TM patients [33,36,37,38,39,40]. We found that four (rs1427407, rs766432, rs11886868, rs7557939) out of the six selected SNP variants in the BCL11A gene showed a strong association with increased HBF levels in TM patients. On comparing individuals who have shown an absence of the above mentioned risk genotypes with those TM patients who carry risk genotypes of SNPs (rs11886868 rs7557939; rs1427407 and rs766432) on BCL11A gene have shown a gradual increase in HbF levels.
These findings were in concordance with the previous study reported by Rashiya et al., 2020; Chamouine et al., 2020 where the increase in HbF levels was observed for the BCL11A gene polymorphism with rs11886868 rs7557939; rs1427407 and rs766432 [38,39]. In contrast, they differed from the results of Bhanushali et al., 2016; who reported no association between the intronic region BCL11A gene polymorphism and variation in HbF levels [40]. Moreover, on in silico analysis by using CADD and FATHMM, only one (rs1427407) variant out of the six noncoding variants of the BCL11A gene was predicted to be pathogenic and deleterious in nature.
On comparing the hematological parameters among TM patients, we found a significant variation for HbF and HbA levels in group of patients with high HbF (p-value < 0.05). Moreover, an analysis of status of clinical parameters among TM patients with low and high HbF levels was performed and we found that patients who have high HbF levels need transfusion in a shorter duration of time (i.e., at 3 weeks) than patients with low HbF levels (transfused at 4 weeks) and this relationship was found to be statistically significant. Furthermore, the polymorphism of BCL11A gene (rs4671393) among all genotyped genetic markers of modifier genes was positively associated with increased Hb levels, but no change were observed in (red cell indices) MCV, MCH and MCHC values (p-value > 0.05). However, other variants on HB1L-MYB and KLF1 genes have not shown any significant effect on HbA levels. We believe that the significant effect of the modifier loci on general blood traits (Hb) shown represent a combination of both, disease amelioration through HbF modification and pleiotropic effects, and that the mechanisms underlying both phenomena are diverse and gene-specific.
Among the 11 selected genetic markers of modifier genes, none of the polymorphisms of the BCL11A, HBS1L-MYB, KLF1 gene, showed a significant p-value for age of onset of disease and age at first blood transfusion among TM patients in the two groups. This shows that the presence of polymorphism on the modifiers’ gene was not associated with factors such as age of onset and need for blood transfusions in TM patients. This has also been noted in other studies [41,42,43], which state that the age at diagnosis and age at first transfusion may vary according to the awareness of the family and economic status. Therefore, it is expected that there are some other genetic factors which also affect the clinical phenotype of thalassemia and the role of which needs to be studied further.
Thus, to conclude, some of BCL11A gene variants contribute to an increase in HbF levels by affecting BCL11A gene expression in TM patients. Hence, it was important to explore the therapeutic targets of BCL11A gene for reactivation of HbF in patients with β-hemoglobin disorders.
The next modifier of HbF levels is the HBS1L-MYB gene which is mainly expressed in the erythroid precursor cells [16]. Low levels of MYB are associated with reduced cell expansion and accelerated erythroid differentiation, suggesting that variation in the intrinsic levels of MYB might affect HbF by its effect on the cell cycle [6]. Polymorphisms in this region accounted for 17.6% variance in normal Europeans and 3 to 7% of the trait variance in African-American and Brazilian patients with sickle cell anemia [4,44].
In this study, we genotyped three SNPs (block 1; rs9399137, rs28384513, rs9376090), out of which only one SNP, i.e., rs9399137, was significantly associated with increased HbF levels in TM patients. For SNP HBS1L-MYB (rs9399137), our results showed that the frequency of CC (homozygous mutant) genotype was significantly higher than that of the genotype TT (wild type). Additionally, the C allele frequency of this SNP was significantly higher in group with high HbF levels when compared to the T allele. Our results are consistent with those reported by previous studies [11,26,40,45]. In addition, the frequency of HBS1L-MYB for the rs28384513 and rs9376090 polymorphism were not associated with variations in HbF level in TM patients and these findings are consistent with the observations reported by Muszlak et al., 2014; Adeyemo et al. 2018; Letter et al., 2017; Al-Allawi et al., 2019, and differ from observations reported by Rujito et al., 2015; Qadah et al., 2019. Moreover, on in silico analysis by using CADD and FATHMM, HBS1L-MYB (rs9399137) SNP was predicted to have a deleterious effect.
Thus, we conclude that the HBS1L-MYB gene variant (rs9399137) has a contribution in the increase in HbF levels in TM patients. Conversely. numerous studies confirmed the effect of rs9399137 on HbF levels; however, its role on molecular mechanisms regulating HbF levels is still not clear and needs to be explored.
KLF1 (formerly known as EKLF Erythroid Krüppel-like factor) is an erythroid-specific transcription factor critical for erythropoiesis and hemoglobin switching [46]. It was previously reported that reduced expression of KLF1 results in downregulation of BCL11A and an increased γ- to β-globin ratio [10,47]. Any polymorphisms in the KLF1 gene causing haploinsufficiency for the KLF1 gene is associated with increased HbF synthesis and the amelioration of severity of homozygous β0-thalassemia, hence manipulating KLF1 expression is possibly another approach for activating HbF in β-thalassemias [29,48,49].
In the Leiden Open Variation Database (LOVD), till the present date > 60 genomic variations in the KLF1 gene have been reported and depending on the location of the variation, distinct hematological phenotypes have been explained [49]. Moreover, the NCBI dbSNP database showed that the c.304T>C mutation corresponded to a previously reported SNP (rs2072597) and was unlikely pathogenic; this was consistent with Borg et al. who reported the identification of a defective KLF1 allele in a Maltese family which caused the persistence of high levels of fetal hemoglobin in adults—a benign and usually asymptomatic condition known to alleviate the severity of β-thalassemia and sickle cell disease [50]. In our study, SNP (rs2072597) was not associated with alteration in HBF levels and our results were consistent with previously published studies by Muszlak et al., 2014; and Hariharan et al., 2018 and differed from Ravindra et al. 2020.
On performing in silico analysis by using the CADD and FATHMM tool, the missense variant on KLF1 gene, (rs112631212) was predicted to be pathogenic. Thus, evaluation of the status of genetic marker of modifier genes and prediction of their pathogenic effect are useful in TM patients for better management of the disease. The detailed functional mechanism among these genetic markers of modifiers genes and HbF levels need be further identified and studied.

5. Conclusions

In β-thalassemia disease there is a clinical range from mildly affected such as non-transfusion dependent thalassemia (NTDT) to severely affected such as Cooley’s anemia. The heterogeneity of HbF levels in β-thalassemia is associated with the disease severity. So, induction of HbF synthesis can ameliorate the clinical severity of β-thalassemia by reducing the degree of imbalance in α- to non-α-globin chains. The level of HbF in β-thalassemias is controlled by genetic modifiers. Therefore, in our present study, we analyzed genetic association including 11 SNPs at 3 main loci (BCL11A, HBS1L-MYB and KLF1) affecting HbF levels and demonstrated that 5 SNPs were independently associated with higher HbF levels (rs1427407, rs766432, rs11886868, rs7557939 in BCL11A, and rs9399137 in HBS1L-MYB) with p-value <0.05. Our study demonstrates the importance of examining polymorphism in genetic determinants that play important roles in ameliorating the severity of clinical symptoms and complications of thalassemia by targeting genes involved in the upregulation of HbF. Stimulation of HbF production can be used as an option to treat thalassemia patients. The present study validates the relationship between HbF levels and SNPs in a BCL11A erythroid-specific enhancer, HBS1L-MYB and KLF1 among thalassemia patients.
More research in β-thalassemia is needed to understand the regulatory mechanisms underlying the variation in clinical outcomes, HbF production and response to HbF induction therapy to improve the management of patients. So, future studies should be designed to evaluate in vivo novel strategies with multitarget effects on erythropoiesis with the final goal to understand the status of anemia in beta-thalassemia major patients.

Author Contributions

Conceptualization, P.T.; S.A. contributed to the methodology and supervision; K.M. contributed to the formal analysis; A.G. contributed to the writing of the original draft; A.N.S. contributed to the review and editing of the document. All authors have read and agreed to the published version of the manuscript.

Funding

This research was funded by ICMR, New Delhi.

Institutional Review Board Statement

This study was conducted in accordance with the Declaration of SGPGIMS Lucknow and approved by the Institutional Ethics Committee of Sanjay Gandhi Postgraduate Institute of Medical Sciences Lucknow U.P (IEC-code: 2019-169-EMP-111).

Informed Consent Statement

Informed consent was obtained from all subjects involved in the study.

Acknowledgments

Authors are grateful to Sanjay Gandhi Post Graduate Institute of Medical Sciences Lucknow for providing infrastructure facilities and ICMR (Indian Council of Medical Research) New Delhi for financial support.

Conflicts of Interest

The authors declare no conflict of interest.

References

  1. Weatherall, D. 2003 William Allan Award address. The Thalassemias: The role of molecular genetics in an evolving global health problem. Am. J. Hum. Genet. 2004, 74, 385–392. [Google Scholar] [CrossRef] [Green Version]
  2. Cao, A.; Moi, P.; Galanello, R. Recent Advances in β-Thalassemias. Pediatr. Rep. 2011, 3, 65–78. [Google Scholar] [CrossRef] [Green Version]
  3. Nienhuis, A.W.; Nathan, D.G. Pathophysiology and Clinical Manifestations of the β- Thalassemias. Cold Spring Harb Perspect Med. 2012, 2, 011726. [Google Scholar] [CrossRef] [Green Version]
  4. Menzel, S.; Garner, C.; Gut, I.; Matsuda, F.; Yamaguchi, M.; Heath, S.; Foglio, M.; Zelenika, D.; Boland, A.; Rooks, H.; et al. A QTL influencing F cell production maps to a gene encoding a zinc-finger protein on chromosome 2p15. Nat. Genet. 2007, 39, 1197–1199. [Google Scholar] [CrossRef]
  5. Grosso, M.; Amendolara, M.; Rescigno, G.; Danise, P.; Todisco, N.; Izzo, P.; Amendola, G. Delayed decline of γ-globin expression in infant age associated with the presence of Gγ-158 (C→T) polymorphism. Int. J. Lab Hem. 2008, 30, 191–195. [Google Scholar] [CrossRef]
  6. Thein, S.L.; Menzel, S.; Lathrop, M.; Garner, C. Control of fetal hemoglobin: New insights emerging from genomics and clinical implications. Hum. Mol. Genet. 2009, 18, R216–R223. [Google Scholar] [CrossRef] [PubMed] [Green Version]
  7. Xu, X.S.; Hong, X.; Wang, G. Induction of endogenous γ-globin gene expression with decoy oligonucleotide targeting Oct-1 transcription factor consensus sequence. J. Hematol. Oncol. 2009, 2, 15. [Google Scholar] [CrossRef] [PubMed] [Green Version]
  8. Funnell, A.P.; Mak, K.S.; Twine, N.A.; Pelka, G.J.; Norton, L.J.; Radziewic, T.; Crossley, M. Generation of mice deficient in both KLF3/BKLF and KLF8 reveals a genetic interaction and a role for these factors in embryonic globin gene silencing. Mol. Cell Biol. 2013, 33, 2976–2987. [Google Scholar] [CrossRef] [Green Version]
  9. Sankaran, V.G.; Menne, T.F.; Xu, J.; Akie, T.E.; Lettre, G.; Van Handel, B.; Mikkola, H.K.A.; Hirschhorn, J.N.; Cantor, A.B.; Orkin, S.H. Human Fetal Hemoglobin Expression Is Regulated by the Developmental Stage-Specific Repressor BCL11A. Science 2008, 322, 1839–1842. [Google Scholar] [CrossRef] [Green Version]
  10. Kadoch, C.; Hargreaves, D.C.; Hodges, C.; Elias, L.; Ho, L.; Ranish, J.; Crabtree, G.R. Proteomic and bioinformatic analysis of mammalian SWI/SNF complexes identifies extensive roles in human malignancy. Nat. Genet. 2013, 45, 592–601. [Google Scholar] [CrossRef] [Green Version]
  11. Lettre, G.; Sankaran, V.G.; Bezerra, M.A.; Araújo, A.S.; Uda, M.; Sanna, S.; Cao, A.; Schlessinger, D.; Costa, F.F.; Hirschhorn, J.N.; et al. DNA polymorphisms at the BCL11A, HBS1L-MYB, and beta-globin loci associate with fetal hemoglobin levels and pain crises in sickle cell disease. Proc. Natl. Acad. Sci. USA 2008, 105, 11869–11874. [Google Scholar] [CrossRef] [PubMed] [Green Version]
  12. Sherry, S.T.; Ward, M.-H.; Kholodov, M.; Baker, J.; Phan, L.; Smigielski, E.M.; Sirotkin, K. dbSNP: The NCBI database of genetic variation. Nucleic Acids Res. 2001, 29, 308–311. [Google Scholar] [CrossRef] [Green Version]
  13. Bauer, D.E.; Kamran, S.C.; Lessard, S.; Xu, J.; Fujiwara, Y.; Lin, C.; Shao, Z.; Canver, M.C.; Smith, E.C.; Pinello, L.; et al. An Erythroid Enhancer of BCL11A Subject to Genetic Variation Determines Fetal Hemoglobin Level. Science 2013, 342, 253–257. [Google Scholar] [CrossRef] [PubMed] [Green Version]
  14. van Dijk, T.B.; Gillemans, N.; Pourfarzad, F.; van Lom, K.; von Lindern, M.; Grosveld, F.; Philipsen, S. Fetal globin expression is regulated by Friend of Prmt1. Blood 2010, 116, 4349–4352. [Google Scholar] [CrossRef] [PubMed] [Green Version]
  15. Craig, J.E.; Rochette, J.; Fisher, C.A.; Weatherall, D.J.; Marc, S.; Lathrop, G.M.; Demenais, F.; Thein, S. Dissecting the loci controlling fetal haemoglobin production on chromosomes 11p and 6q by the regressive approach. Nat. Genet. 1996, 12, 58–64. [Google Scholar] [CrossRef]
  16. Wahlberg, K.; Jiang, J.; Rooks, H.; Jawaid, K.; Matsuda, F.; Yamaguchi, M.; Lathrop, M.; Thein, S.L.; Best, S. The HBS1L-MYB intergenic interval associated with elevated HbF levels shows characteristics of a distal regulatory region in erythroid cells. Blood 2009, 114, 1254–1262. [Google Scholar] [CrossRef] [PubMed]
  17. Steinberg, M.H. Management of sickle cell disease. N. Engl. J. Med. 1999, 340, 1021–1030. [Google Scholar] [CrossRef]
  18. Nguyen, T.K.T.; Joly, P.; Bardel, C.; Moulsma, M.; Bonello-Palot, N.; Francina, A. The XmnI Gγ polymorphism influences hemoglobin F synthesis contrary to BCL11A and HBS1L-MYB SNPs in a cohort of 57 β-thalassemia intermedia patients. Blood Cells Mol. Dis. 2010, 45, 124–127. [Google Scholar] [CrossRef]
  19. Garner, C.; Silver, N.; Best, S.; Menzel, S.; Martin, C.; Spector, T.D.; Thein, S.L. Quantitative trait locus on chromosome 8q influences the switch from fetal to adult hemoglobin. Blood 2004, 104, 2184–2186. [Google Scholar] [CrossRef] [Green Version]
  20. Garner, C.P.; Tatu, T.; Best, S.; Creary, L.; Thein, S.L. Evidence of genetic interaction between the beta-globin complex and chromosome 8q in the expression of fetal hemoglobin. Am. J. Hum. Genet. 2002, 70, 793–799. [Google Scholar] [CrossRef] [Green Version]
  21. Labie, D.; Dunda-Belkhodja, O.; Rouabhi, F.; Pagnier, J.; Ragusa, A.; Nagel, R.L. The -158 site 5’ to the G gamma gene and G gamma expression. Blood 1985, 66, 1463–1465. [Google Scholar] [CrossRef] [Green Version]
  22. Prasing, W.; Mekki, C.; Traisathit, P.; Pissard, S.; Pornprasert, S. Genotyping of BCL11A and HBS1L-MYB Single Nucleotide Polymorphisms in β-thalassemia/HbE and Homozygous HbE Subjects with Low and High Levels of HbFWalailak. J. Sci. Tech 2018, 15, 627–636. [Google Scholar] [CrossRef]
  23. Miller, I.J.; Bieker, J.J. A novel, erythroid cell-specific murine transcription factor that binds to the CACCC element and is related to the Kr¨uppel family of nuclear proteins. Mol. Cell Biol. 1993, 13, 2776–2786. [Google Scholar] [PubMed] [Green Version]
  24. Drissen, R.; von Lindern, M.; Kolbus, A.; Driegen, S.; Steinlein, P.; Beug, H.; Grosveld, F.; Philipsen, S. The Erythroid Phenotype of EKLF-Null Mice: Defects in Hemoglobin Metabolism and Membrane Stability. Mol. Cell. Biol. 2005, 25, 5205–5214. [Google Scholar] [CrossRef] [PubMed] [Green Version]
  25. Pilon, A.M.; Ajay, S.S.; Kumar, S.A.; Steiner, L.A.; Cherukuri, P.F.; Wincovitch, S.; Bodine, D.M. NISC Comparative Sequencing Center. Genome-wide ChIP-Seq reveals a dramatic shift in the binding of the transcription factor erythroid Kruppel-like factor during erythrocyte differentiation. Blood 2011, 118, e139–e148. [Google Scholar] [CrossRef] [PubMed]
  26. Borg, J.; Papadopoulos, P.; Georgitsi, M.; Gutierrez, L.; Grech, G.; Fanis, P.; Phylactides, M.; Verkerk, A.J.; van derSpek, P.J.; Scerri, C.A.; et al. Haploinsufficiency for the erythroid transcription factor KLF1 causes hereditary persistence of fetal hemoglobin. Nat. Genet. 2010, 42, 801–805. [Google Scholar] [CrossRef]
  27. Zhou, D.; Liu, K.; Sun, C.W.; Pawlik, K.M.; Townes, T.M. KLF1 regulates BCL11A expression and gamma- to beta-globin gene switching. Nat. Genet. 2010, 42, 742–744. [Google Scholar] [CrossRef]
  28. Hodge, D.; Coghill, E.; Keys, J.; Maguire, T.; Hartmann, B.; McDowall, A.; Weiss, M.; Grimmond, S.; Perkins, A. A global role for EKLF in definitive and primitive erythropoiesis. Blood 2006, 107, 3359–3370. [Google Scholar] [CrossRef] [Green Version]
  29. Funnell, A.P.; Maloney, C.A.; Thompson, L.J.; Keys, J.; Tallack, M.; Perkins, A.C.; Crossley, M. Erythroid Kruppel-like factor directly activates the basic Kr¨ uppel-like factor gene in erythroid cells. Mol. Cell Biol. 2007, 27, 2777–2790. [Google Scholar] [CrossRef] [Green Version]
  30. Satta, S.; Perseu, L.; Maccioni, L.; Giagu, N.; Galanello, R. Delayed fetal hemoglobin switching in subjects with KLF1 gene mutation. Blood Cells Mol. Dis. 2012, 48, 22–24. [Google Scholar] [CrossRef]
  31. Stadhouders, R.; Aktuna, S.; Thongjuea, S.; Aghajanirefah, A.; Pourfarzad, F.; van Ijcken, W.; Lenhard, B.; Rooks, H.; Best, S.; Menzel, S.; et al. HBS1L-MYB intergenic variants modulate fetal hemoglobin via long-range MYB enhancers. J. Clin. Investig. 2014, 124, 1699–1710. [Google Scholar] [CrossRef] [PubMed] [Green Version]
  32. Weatherall, D. Anaemia: Pathophysiology, classification, and clinical features. In Oxford Textbook of Medicine, 3rd ed.; Weatherall, D.J., Ledingham, J.G.G., Warrell, D.A., Eds.; Oxford University Press: Oxford, UK, 1996; pp. 3457–3462. [Google Scholar]
  33. Weatherall, D. Single gene disorders or complex traits: Lessons from the thalassaemias and other monogenic diseases. Br. Med. J. 2000, 321, 1117–1121. [Google Scholar] [CrossRef] [PubMed] [Green Version]
  34. Weatherall, D.J.; Clegg, J.B. The Thalassaemia Syndromes, 4th ed.; Blackwell Science: Oxford, UK, 2001. [Google Scholar]
  35. Weatherall, D.J. Phenotype—Genotype relationships in monogenic disease: Lessons from the thalassaemias. Nat. Rev. Genet. 2001, 2, 245–255. [Google Scholar] [CrossRef]
  36. Chaouch, L.; Moumni, I.; Ouragini, H.; Darragi, I.; Kalai, M.; Chaouachi, D.; Boudrigua, I.; Hafsia, R.; Abbes, S. rs11886868 and rs4671393 ofBCL11Aassociated with HbF level variation and modulate clinical events among sickle cell anemia patients. Hematology 2016, 21, 425–429. [Google Scholar] [CrossRef]
  37. Dadheech, S.; Madhulatha, D.; Jain, S.; Joseph, J.; Jyothy, A.; Munshi, A. Association of BCL11A Genetic Variant (rs11886868) with severity in β-Thalassemia Major and Sickle Cell Anemia. Ind. J. Med. Res. 2016, 143, 449. [Google Scholar]
  38. Sales, R.R.; Belisário, A.R.; Faria, G.; Mendes, F.; Luizon, M.R.; Viana, M.B. Functional polymorphisms of BCL11A and HBS1L-MYB genes affect both fetal hemoglobin level and clinical outcomes in a cohort of children with sickle cell anemia. Ann. Hematol. 2020, 99, 1453–1463. [Google Scholar] [CrossRef]
  39. Muszlak, M.; Pissard, S.; Badens, C.; Chamouine, A.; Maillard, O.; Thuret, I. Genetic Modifiers of Sickle Cell Disease: A Genotype-Phenotype Relationship Study in a Cohort of 82 Children on Mayotte Island. Hemoglobin 2015, 39, 156–161. [Google Scholar] [CrossRef]
  40. Bhanushali, A.A.; Patra, P.K.; Pradhan, S.; Khanka, S.S.; Singh, S.; Das, B.R. Genetics of fetal hemoglobin in tribal Indian patients with sickle cell anemia. Transl. Res. 2015, 165, 696–703. [Google Scholar] [CrossRef]
  41. Taher, A.; El Rassi, F.; Isma’eel, H.; Koussa, S.; Inati, A.; Cappellini, M.D. Letter to the Editor: Correlation of liver iron concentration determined by R2 MRI with serum ferritin in patients with thalassemia intermedia. Haematologica 2008, 93, 1584–1586. [Google Scholar] [CrossRef] [Green Version]
  42. Galarneau, G.; Palmer, C.D.; Sankaran, V.G.; Orkin, S.H.; Hirschhorn, J.N.; Lettre, G. Fine-mapping at three loci known to affect fetal hemoglobin levels explains additional genetic variation. Nat. Genet. 2010, 42, 1049–1051. [Google Scholar] [CrossRef] [Green Version]
  43. Winichagoon, P.; Fucharoen, S.; Chen, P.; Wasi, P. Genetic Factors Affecting Clinical Severity in β-Thalassemia Syndromes. J. Pediatr. Hematol. Oncol. 2000, 22, 573–580. [Google Scholar] [CrossRef] [PubMed]
  44. Labie, D.; Pagnier, J.; Lapoumeroulie, C.; Rouabhi, F.; Dunda-Belkhodja, O.; Chardin, P.; Beldjord, C.; Wajcman, H.; E Fabry, M.; Nagel, R.L. Common haplotype dependency of high G gamma-globin gene expression and high Hb F levels in beta-thalassemia and sickle cell anemia patients. Proc. Natl. Acad. Sci. USA 1985, 82, 2111–2114. [Google Scholar] [CrossRef] [PubMed] [Green Version]
  45. Rujito, L.; Basalamah, M.; Siswandari, W.; Setyono, J.; Wulandari, G.; Mulatsih, S.; Sofro, A.S.M.; Sadewa, A.H.; Sutaryo, S. Modifying effect of XmnI, BCL11A, and HBS1L-MYB on clinical appearances: A study on β-thalassemia and hemoglobin E/β-thalassemia patients in Indonesia. Hematol. Oncol. Stem Cell Ther. 2016, 9, 55–63. [Google Scholar] [CrossRef] [PubMed] [Green Version]
  46. Kumar, R.; Yadav, R.; Mishra, S.; Singh, M.P.S.S.; Gwal, A.; Bharti, P.K.; Rajasubramaniam, S. Krüppel-like factor 1 (KLF1) gene single nucleotide polymorphisms in sickle cell disease and its association with disease-related morbidities. Ann. Hematol. 2021, 100, 365–373. [Google Scholar] [CrossRef] [PubMed]
  47. Al-Allawi, N.; Qadir, S.M.A.; Puehringer, H.; Chui, D.H.K.; Farrell, J.J. The association of HBG2, BCL11A, and HMIP polymorphisms with fetal hemoglobin and clinical phenotype in Iraqi Kurds with sickle cell disease. Int. J. Lab Hematol. 2019, 41, 87–93. [Google Scholar] [CrossRef] [PubMed] [Green Version]
  48. Qadah, T.; Noorwali, A.; Alzahrani, F.; Banjar, A.; Filimban, N.; Felimban, R. Detection of BCL11A and HBS1L-MYB Genotypes in Sickle Cell Anemia. Indian J. Hematol. Blood Transfus. 2020, 36, 705–710. [Google Scholar] [CrossRef]
  49. Hariharan, P.; Colah, R.; Ghosh, K.; Nadkarni, A. Differential role of Kruppel like factor 1 (KLF1) gene in red blood cell disorders. Genomics 2019, 111, 1771–1776. [Google Scholar] [CrossRef]
  50. Lionel, A.; Carole, S.; Virginie, H.; Nicole, L.; Dominique, S. A Dominant Mutation in the Gene Encoding the Erythroid Transcription Factor KLF1 Causes a Congenital Dyserythropoietic Anemia. Am. J. Hum. Genet. 2010, 87, 721–727. [Google Scholar] [CrossRef] [Green Version]
Figure 1. Gel pictures showing the genotypes of BCL11A gene, rs1427407 (G>T) polymorphisms. Lane 1: GG (wild type), Lanes 3 and 4: GT (heterozygous), Lane 2: TT (homozygous mutant), M: 100 bp DNA marker.
Thalassrep 13 00009 g001
Figure 2. Sequencing results of BCL11A gene, rs1427407 (G>T) polymorphism (A) wild type GG, (B) heterozygous GT, (C) mutant homozygous TT.
Thalassrep 13 00009 g002
Figure 3. Gel pictures showing the genotypes of BCL11A gene, rs766432 (A>C) polymorphisms. Lanes 1 and 5: AA (wild type), Lanes 2 and 3: AC (heterozygous), Lane 4: CC (homozygous mutant), M: 100 bp DNA marker.
Thalassrep 13 00009 g003
Figure 4. Sequencing results of BCL11A gene, rs766432 (A>C) polymorphism (A) wild type AA, (B) heterozygous AC, (C) mutant homozygous CC.
Thalassrep 13 00009 g004
Figure 5. Gel pictures showing the genotypes of BCL11A gene, rs11886868 (C>T) polymorphisms. Lane 4: CC (wild type), Lanes 1, 6, 8 and 9: CT (heterozygous), Lanes 2, 3, 5 and 7: TT (homozygous mutant), M: 100 bp DNA marker.
Thalassrep 13 00009 g005
Figure 6. Sequencing results of BCL11A gene, rs11886868 (C>T) polymorphism (A) wild type CC, (B) heterozygous CT, (C) mutant homozygous TT.
Thalassrep 13 00009 g006
Figure 7. Gel pictures showing the genotypes of BCL11A gene, rs4671393 (A>G) polymorphisms. Lane 1: AA (wild type), Lanes 2 and 3: AG (heterozygous), Lane 4: GG (homozygous mutant), M: 100 bp DNA marker.
Thalassrep 13 00009 g007
Figure 8. Sequencing results of BCL11A gene, rs4671393 (A>G) polymorphism (A) wild type AA, (B) heterozygous AG, (C) mutant homozygous GG.
Thalassrep 13 00009 g008
Figure 9. Gel pictures showing the genotypes of BCL11A gene, rs10189857 (A>G) polymorphisms. Lane 1: AA (wild type), Lanes 3 and 4: AG (heterozygous), Lane 2: GG (homozygous mutant), M: 100 bp DNA marker.
Thalassrep 13 00009 g009
Figure 10. Sequencing results of BCL11A gene, rs10189857 (A>G) polymorphism (A) wild type AA, (B) heterozygous AG, (C) mutant homozygous GG.
Thalassrep 13 00009 g010
Figure 11. Gel pictures showing the genotypes of BCL11A gene, rs7557939 (G>A) polymorphisms. Lane 1, 2, and 7: GG (wild type), Lane 3 and 5: GA (heterozygous), Lane 4, 6, and 9: AA (homozygous mutant), M: 100 bp DNA marker. Lane 8, 10, 11 is blank.
Thalassrep 13 00009 g011
Figure 12. Sequencing results of BCL11A gene, rs7557939 (G>A) polymorphism (A) wild type GG, (B) heterozygous GA, (C) mutant homozygous AA.
Thalassrep 13 00009 g012
Figure 13. Gel pictures showing the genotypes of HBS1L-MYB rs9399137 (T>C) polymorphism. Lane 1 and 5: TT (wild type), Lanes 3 and 4: TC (heterozygous), Lanes 2 and 6: CC (homozygous mutant), M: 50 bp DNA marker.
Thalassrep 13 00009 g013
Figure 14. Gel pictures showing the genotypes of HBS1L-MYB rs9376090 (T>C) polymorphism. Lane 1 and 2: TT (wild type), Lanes 3 and 4: TC (heterozygous), Lane 5: CC (homozygous mutant), M: 100 bp DNA marker.
Thalassrep 13 00009 g014
Figure 15. Sequencing results of HBS1L-MYB rs9376090 (T>C) polymorphism (A) wild type TT, (B) heterozygous TC, (C) mutant homozygous CC.
Thalassrep 13 00009 g015
Figure 16. Gel pictures showing the genotypes of HBS1L-MYB rs28384513 (A>C) polymorphism. Lane 1: AA (wild type), Lanes 3 and 4: AC (heterozygous), Lane 2: CC (homozygous mutant), M: 100 bp DNA marker.
Thalassrep 13 00009 g016
Figure 17. Sequencing results of HBS1L-MYB rs28384513 (A>C) polymorphism (A) wild type AA, (B) heterozygous AC, (C) mutant homozygous CC.
Thalassrep 13 00009 g017
Figure 18. Gel pictures showing the genotypes of KLF1 rs2072597 (A>G) polymorphisms. Lanes 1 and 2: AA (wild type), Lanes 3, 4 and 6: AG (heterozygous), Lanes 5 and 7: GG (homozygous mutant), M: 100 bp DNA marker.
Thalassrep 13 00009 g018
Figure 19. Sequencing results of KLF1 rs2072597 (A>G) polymorphism (A) wild type AA, (B) heterozygous AG, (C) mutant homozygous GG).
Thalassrep 13 00009 g019
Figure 20. Gel pictures showing the genotypes of KLF1 rs112631212 (T>G) polymorphisms. Lanes 7 and 8: TT (wild type), Lanes 1, 2 and 3: TG (heterozygous), Lanes 4, 5 and 6: GG (homozygous mutant), M: 100 bp DNA marker.
Thalassrep 13 00009 g020
Figure 21. Sequencing results of KLF1 rs112631212 (T>G) polymorphisms (A) wild type TT, (B) heterozygous TG, (C) mutant homozygous GG.
Thalassrep 13 00009 g021
Table 1. List of QTLs gene, primer sequences and methodology.
GenePolymorphismPrimer SequencesMethodology
BCL11Ars766432(A)F: TTGTTTCGCTTTAGCTTTATTAAGGTACAAARMS-PCR
432(A)R: GACGTGTTCTGTATCTTGATTTTGGT
432(C)F: CCAAACAGTTTAAAGGTTACAGACAGACT
432(C)R: AAAATGAATGACTTTTGTTGTATGTAGAG
rs4671393F-GAGATAACTTAAGTGTGGTGTTARMS-PCR
R-GCTGTGGACAGCAAAGCTTCA
F-ATCCTCATCAGCTTGGCCATG
R-GGAAGACGTGGGCTGGGAGCTGGGAGTT
rs11886868F-TTTGGTGCTACCCTGAAAGACRFLP
R-ACTCAACAGTAGCAGAATGAAAGAG
rs7557939F-AGACAACAATGCAAGGGGGARFLP
R-TGAGAAGCCAAACTCCCAGC
rs1427407F-CACTCATCCCATGCACCACTCRFLP
R-CCACGTAGTTGGGCTTCACA
rs10189857Forward inner primer (A-allele)—TGCCCCTTGTGAACTACG
Reverse inner primer(A-allele)- TTCTATCAGCAGGTCAAGA
ARMS-PCR
Forward outer primer (G-allele)- GGATTTCAGGGTCCTTG
Reverse outer primer (G-allele)- GGTAGAGAACTGTGACA
HBS1L-MYBrs9399137137(C)F: AATGTAATTAACTGAACATATGGTTAGTCARMS-PCR
137(C)R: TTTATTGTTACAAGGTTAATTCACTGCC
137(T)F: GAAATACCATCACTGAGAAAAGCATAAG
137(T)R: CAGCAGGGTTGCTTGTGAAAAAACTTTA
rs9376090Forward inner primer (C allele)
GCTAAGTCTAGCTGAGTGTTAGACC
ARMS-PCR
Reverse inner primer (T allele)
GTTCCTGGCAGTATCCCACA
Forward outer primer
TCACAACTTTCATGCAAACATAA
Reverse outer primer
TGCTTCAGTCTTGTGCCTATTAT
rs28384513Forward inner primer (Tallele)
TGAGCTACCTACGCCAGCGTCCT
ARMS-PCR
Reverse inner primer (C allele)
TATCAGGAACCAAATTTGGAAAATAATACG
Reverse inner primer (g allele)
TCAGGAACCAAATTTGGAAAATAATTCC
Forward outer primer
CCGCCTAGAATTGACTGGTTTG
Reverse outer primer
TTTGTTGAATGCCCACTGTGTGC
KLF1rs2072597F-ATCCTCCGAACCCAAAAGCCRFLP
R-ACCTGGATCTCCTCCTCACC
rs112631212F-GGCTGGTCCTCAGACTTCACRFLP
R-GACAGGCAAACAAGACCCCT
Table 2. Genotype and allele frequency for BCL11A gene, rs1427407 (G>T) polymorphisms.
BCL11A
Gene Polymorphism
HBF (%)
<40
(n = 38)
HBF (%)
>40
(n = 62)
ORp-Value
rs NoGenotype
rs1427407GG19 (50.0)16 (25.8)RefRef
GT10 (26.3)23 (37.1)0.321
(0.113 to 0.916)
0.034
TT9 (23.7)23 (37.1)0.329
(0.114 to 0.944)
0.039
Allele Frequency
G48 (63.2)55 (44.4)RefRef
T28 (36.8)69 (55.6)2.1506
(1.1976 to 3.8621)
0.0104
rs766432AA14 (42.4)10 (18.9)RefRef
AC11 (21.2)25 (34.5)0.307
(0.094 to 1.002)
0.050
CC13 (36.4)27 (46.6)0.409
(0.138 to 1.214)
0.107
Allele Frequency
A39 (55.0)45 (36.2)RefRef
C37 (46.9)79 (63.8)1.8505
(1.0361 to 3.3048)
0.0375
rs11886868CC17 (44.7)11 (17.7)RefRef
CT11 (28.9)29 (46.8)0.236
(0.081 to 0.690)
0.008
TT10 (26.4)22 (35.5)0.338
(0.113 to 1.012)
0.053
Allele Frequency
C45 (59.2)51 (41.1)RefRef
T31 (40.8)73 (58.9)2.0778
(1.1625 to 3.7137)
0.0136
rs4671393AA14 (36.8)20 (32.3)RefRef
AG16 (42.1)22 (35.4)0.942
(0.355 to 2.498)
0.904
GG8 (21.1)20 (32.3)0.550
(0.176 to 1.720)
0.304
Allele Frequency
A44 (57.9)62 (50.0)RefRef
G32 (42.1)62 (50.0)0.7097
(0.420 to 1.196)
0.1984
rs10189857AA22 (57.9)30 (48.4)RefRef
AG6 (15.8)18 (29.0)0.441
(0.144 to 1.348)
0.151
GG10 (26.3)14 (22.6)0.936
(0.321 to 2.728)
0.936
Allele
Frequency
A50 (65.8)78 (62.9)RefRef
G26 (34.2)46 (37.1)1.1341
(0.623 to 2.061)
0.6799
rs7557939GG15 (39.5)26 (41.9)RefRef
GA19 (50.0)11 (17.7)3.789
(1.313 to 10.932)
0.014
AA4 (10.5)25 (40.4)0.262
(0.072 to 0.952)
0.042
Allele
Frequency
G49 (64.5))63 (50.8)RefRef
A27 (35.5)61 (49.2)1.7572
(0.9769 to 3.1607)
0.0598
rs9399137TT14 (37.9)16 (25.4)RefRef
TC14 (35.1)13 (22.2)1.259
(0.416 to 3.812)
0.683
CC10 (27.0) 33 (52.4)0.329
(0.114 to 0.956)
0.041
Allele Frequency
T42 (55.3)45 (36.3)RefRef
C34 (44.7)79 (63.7)2.1686
(1.2121 to 3.8801)
0.0091
rs9376090TT22 (59.5)31 (47.6)RefRef
TC10 (27.0)29 (46.0)0.532
(0.208 to 1.360)
0.188
CC6 (13.5)2 (6.4)4.575
(0.783 to 26.742)
0.091
Allele Frequency
T54 (71.1))91 (73.4)RefRef
C22 (28.9)33 (26.6)0.8901
(0.4713 to 1.6812)
0.7197
rs28384513AA18 (48.6)35 (56.5)RefRef
AC12 (32.4)22 (38.7)1.083
(0.426 to 2.754)
0.866
CC8 (21.0)5 (4.8)3.061
(0.819 to 11.436)
0.096
Allele Frequency
A48 (64.9)92 (74.2)RefRef
C28 (36.8)32 (25.8)0.5963
(0.3222 to 1.1036)
0.0997
rs2072597AA18 (47.4)39 (64.9)RefRef
AG6 (15.8)7 (11.3)1.628
(0.459 to 5.777)
0.451
GG14 (36.8)16 (25.8)1.645
(0.635 to 4.263)
0.306
Allele Frequency
A42 (56.3)85 (68.5)RefRef
G34 (44.7)39 (31.5)0.566
(0.314 to 1.022)
0.059
rs112631212TT25 (65.8)39 (62.9)RefRef
TG 8 (21.0)13 (20.9)0.956
(0.335 to 2.732)
0.933
GG 5 (13.2)10 (16.2)0.644
(0.182 to 2.280)
0.495
Allele Frequency
T58 (76.3)91 (73.4)Ref Ref
G 18 (23.7)33 (26.6)1.168
(0.602 to 2.265)
0.644
Table 3. Comparison of hematological parameter between two groups.
Hematological ParameterPatients with
HbF < 40
Patients with
HbF > 40
p-Value
Hb (g/dL)7.24 ± 1.256.91 ± 1.260.550
MCV68.02 ± 5.4368.11 ± 4.990.575
MCH23.40 ± 3.8422.70 ± 3.650.972
MCHC28.49 ± 4.0929.0 ± 3.430.384
HbA (%)56.70 ± 30.7714.29 ± 12.790.000
HbA2 (%)3.79 ± 0.863.53 ± 0.980.191
HbF (%)12.12 ± 6.0965.99 ± 14.560.000
Table 4. Comparison of clinical parameter between two groups.
Clinical ParametersPatients with
HbF < 40 (n = 38)
Patients with
HbF > 40 (n = 62)
OR
(95% CI)
p-Value
Hepatomegaly
Present590.892
Absent3353(0.275–2.893)0.849
Splenomegaly
Mild26500.135 (1.25–1.80)
Moderate460.081 (1.13–1.45)
Normal860.072 (1.24–1.52)0.113
Transfusion history
4 weeks29580.222
3 weeks94(0.063–0.783)0.013
Table 5. Regression coefficient (Beta) estimates and significance p value (in brackets). Age and gender were included as covariates. For the genetic data, Beta serves as a measure of the effect of an allele change from low-HbF to high-HbF allele. Nominally significant effects are in bold font.
SNP (rsno)HBMCVMCHMCHCHBAHBA2HBF
rs7664320.019
(0.853)
−0.136
(0.199)
−0.074
(0.496)
−0.142
(0.194)
0.009
(0.930)
−0.034
(0.762)
0.177
(0.058)
rs46713930.247
(0.030)
−0.046
(0.690)
0.010
(0.930)
0.014
(0.905)
−0.019
(0.861)
0.031
(0.793)
0.147
(0.144)
rs118868680.002
(0.983)
0.089
(0.415)
0.0207
(0.065)
0.015
(0.897)
−0.162
(0.128)
0.077
(0.501)
0.200
(0.038)
rs7557939−0.184
(0.074)
0.016
(0.875)
−0.031
(0.768)
−0.056
(0.600)
−0.129
(0.202)
0.002
(0.983)
0.173
(0.060)
rs101898570.110
(0.323)
−137
(0.228)
−0.070
(0.547)
0.003
(0.981)
−0.045
(0.684)
0.007
(0.956)
0.046
(0.646)
rs14274070.091
(0.397)
0.134
(0.222)
−0.009
(0.934)
−0.013
(0.908)
−0.115
(0.280)
−0.059
(0.611)
0.215
(0.028)
rs93991370.037
(0.734)
0.152
(0.171)
−0.034
(0.762)
0.039
(0.731)
−0.043
(0.689)
0.029
(0.802)
0.146
(0.136)
rs9376090−0.141
(0.191)
−0.081
(0.457)
0.005
(0.964)
−0.042
(0.712)
0.109
(0.308)
0.072
(0.535)
−0.139
(0.149)
rs28384513−0.064
(0.552)
−0.103
(0.344)
−0.025
(0.824)
−0.095
(0.399)
0.025
(0.817)
0.158
(0.170)
−0.214
(0.057)
rs2072597−0.027
(0.807)
0.121
(0.280)
0.027
(0.810)
−0.010
(0.929)
0.266
(0.016)
−0.051
(0.667)
−0.132
(0.180)
rs1126312120.115
(0.280)
0.045
(0.673)
0.001
(0.994)
−0.086
(0.441)
0.001
(0.994)
0.162
(0.157)
−0.053
(0.577)
Table 6. Evaluation of association of genetic marker of modifier gene for age of onset of disease.
Gene/Refrence Sequence NoGenotypeAge of Onset
<1 Year>1 Year
HbF
<40%
HbF
>40%
p-ValueHbF
<40%
HbF
>40%
p-Value
BCL11A rs766432AA540.191960.435
AC515610
CC61879
BCL11A rs4671393AA5130.142970.534
AG89813
GG31555
BCL11A rs11886868CC9160.758890.805
CT26811
TT51565
BCL11A rs7557939GG7160.4078100.053
GA59104
AA412411
BCL11A rs10189857AA9180.86213120.150
AG41028
GG3975
BCL11A rs1427407GG9110.1881050.174
GT311712
TT41558
HBS1L- MYB
rs9399137
TT790.228770.512
TC41875
CC410813
HBS1L- MYB rs9376090TT10160.05512150.158
TC319710
CC3230
HBS1L-MYB
rs28384513
AA5230.16713120.395
AC71026
CC3477
KLF1
rs2072597
TT7260.18211130.958
TC2245
CC7977
KLF1 rs112631212AA9220.70016170.844
AC5835
CC2733
Table 7. Association of genetic marker with the age of first transfusion.
Gene/Reference
Sequence No
GenotypeAge of First Transfusion
<1 Year>1 Year
HbF
<40%
HbF
>40%
p-ValueHbF
<40%
HbF
>40%
p-Value
BCL11A rs766432AA540.236960.253
AC512613
CC61879
BCL11A rs4671393AA5130.233970.488
AG89813
GG31258
BCL11A rs11886868CC9160.628890.765
CT311813
TT41066
BCL11A rs7557939GG6140.9698100.102
GA510106
AA510412
BCL11A rs10189857AA9180.94913120.220
AG41028
GG3678
BCL11A rs1427407GG990.1221070.311
GT310713
TT41358
HBS1L-MYB
rs9399137
TT890.200790.667
TC41576
CC412813
HBS1L- MYB rs9376090TT10140.05312170.129
TC318711
CC3230
HBS1L-MYB
rs28384513
AA5210.08113120.395
AC101026
CC1377
KLF1 rs2072597TT7250.09811140.947
TC2146
CC7878
KLF1 rs112631212AA9200.80216190.913
AC5835
CC2634
Table 8. Pathogenicity of variants of modifier gene using CADD and FATHMM-MKL.
Gene SNP rsIDChromosomePositionReferenceAlternateCADD C-ScoreFATHMM
Score
KLF1rs112631212chr1912996929TG12.950.59047
BCL11Ars10189857chr260713235AG15.530.39301
BCL11Ars1427407chr260718043TG16.860.82499
BCl11Ars766432chr260719970CA3.1960.1122
BCL11Ars11886868chr260720246CT4.3240.10101
BCL11Ars4671393chr260720951AG6.3080.23428
BCL11Ars7557939chr260721347GA4.8070.19352
HBS1L-MYBrs28384513chr6135376209TG7.6630.33151
HBS1L-MYBrs9376090chr6135411228TC0.6870.1287
HBS1L-MYBrs9399137chr6135419018TC12.680.80652
Disclaimer/Publisher’s Note: The statements, opinions and data contained in all publications are solely those of the individual author(s) and contributor(s) and not of MDPI and/or the editor(s). MDPI and/or the editor(s) disclaim responsibility for any injury to people or property resulting from any ideas, methods, instructions or products referred to in the content.

