Article

Characterization of Fruit Quality Traits and Biochemical Properties in Different Myanmar Mango Cultivars during Ripening Stages

1
Molecular Genetics Laboratory, Biotechnology Research Department, Ministry of Education, Kyaukse 05151, Myanmar
2
Cell Culture Laboratory, Biotechnology Research Department, Ministry of Education, Kyaukse 05151, Myanmar
3
Department of Horticultural Science, Kyungpook National University, Daegu 41566, Republic of Korea
*
Author to whom correspondence should be addressed.
Int. J. Plant Biol. 2023, 14(1), 14-27; https://doi.org/10.3390/ijpb14010002
Submission received: 29 November 2022 / Revised: 20 December 2022 / Accepted: 20 December 2022 / Published: 22 December 2022

Abstract

:
Here, we characterized the changes in fruit quality and biochemical parameters in four Myanmar mango cultivars from ripening stage 1 to 4 at ambient temperature. Total soluble solids, total sugars, and reducing and non-reducing sugar content increased, whereas titratable acidity decreased with increasing storage time in all cultivars. ‘Sein Ta Lone’ showed the highest consumer acceptability, with maximum sensory quality scores owing to its unique characteristics. ‘Hin Thar’ and ‘Ma Chit Su’ also had better quality and sensory attributes than ‘Yin Kwae’. Sugar/acid ratios in all cultivars ranged from 23 to 50, the standard sugar/acid ratios in high-quality mango fruits. The total phenolic content (TPC) and antioxidant activity among cultivars ranged from 8.20 to 14.96 mg gallic acid equivalents and 19.52 to 26.79 mg vitamin C equivalents antioxidant capacity, respectively, per 100 g of fruit extract throughout the storage. ‘Hin Thar’ was the richest in phytochemical compounds. A significant positive correlation was found between total phenolic activity and 2,2-diphenyl-1-picryl-hydrazyl free radical scavenging activity of fruits, showing that TPC exhibited linear relationships with the antioxidant activities of each mango variety during the different stages of ripening.

1. Introduction

Mango, Mangifera indica L, belonging to the Anacardiaceae family, is one of the most popular fruits and is commercially cultivated in different tropical and subtropical regions of the world because of its attractive color, flavor, excellent eating quality, and high nutritional value [1,2]. In addition to these favorable attributes, mangoes provide crucial bioactive compounds and many dietary antioxidants, such as ascorbic acid, flavonoids, carotenoids, and polyphenols, which have potential benefits for human health [3,4]. Previous studies reported the presence of antioxidant activity and phenolic compounds in mango pulp and peel during the maturation and ripening stages [2,4,5,6] and they varied depending on mango cultivars, fruit maturity, and fruit ripening stages [2,3,5,7,8,9]. Generally, mango fruits at the mature green harvest stage are hard in texture and possess low total soluble solids (TSS) content and high acidity, resulting in poor edible quality [10]. However, the fully-grown mangoes at the full ripening stage reveal softening texture followed by high sugar content, high TSS, low acidity, and visible and attractive color development [11,12]. TSS content is one of the most crucial prerequisites for evaluating fruit quality, similar to other indices such as fruit texture, flesh color, aroma, and flavor [10,13]. As mangoes are climacteric fruits, the ripening process occurs rapidly after harvesting due to increased fruit respiration. During mango fruit ripening, hydrolysis of starch into sugar, changes in structural polysaccharides, and increase in respiration and ethylene production, take place [11,14,15]. The increase in respiration and ethylene production causes chlorophyll degradation, carotenoid biosynthesis, changes in fruit color, biosynthesis of volatile compounds, and loss in fruit firmness [11,14,16]. All these changes are correlated with fruit nutritional and phytochemical composition and affect fruit softening and eating quality [10]. However, the quality attributes depend on cultivars, cultural practices, fruit maturity stages at harvest, and post-harvest conditions [7]. Previous reports have determined the effects of different ripening stages of mangoes on their biochemical and physiological parameters, sensory profile, and antioxidant properties [3,10,17].
There are approximately 69 edible mango species worldwide, and M. indica is the best-known species in subtropical and tropical regions. Mangoes originated in the Indo-Myanmar region and have been cultivated for over 4000 years in eastern India and Myanmar [18]. There are about 300 kinds of local mango cultivars grown in Myanmar, among which, ‘Sein Ta Lone’ (STL), ‘Ma Chit Su’ (MCS), ‘Hin Thar’ (HT), ‘Padamyar Nga Mauk’, and ‘Yin Kwae’ (YK) are popular as excellent quality mangoes [19]. Generally, the mango season starts from early March and lasts to the end of August in Myanmar, where the entire mango growing area covers 266,000 acres, with a total production of 2,565,452 metric tons in 2020 [20]. The main production areas for exportable mango cultivars and quality mango development are Mandalay and Southern Shan provinces in Myanmar, although they have been grown in other parts of the country. Several researchers have attempted to determine the physiochemical characteristics and quality of various Myanmar mango cultivars to develop good post-harvest strategies attractive to prospective consumers [20,21]. During the storage period, the occurrence of fruit shriveling and deterioration of appearance could reduce its marketable potential and value to some extent. However, little is known about the physiochemical aspects of the local mango cultivars of Myanmar during post-harvest and storage, and there is a lack of knowledge about the antioxidant capacity and phenolic compounds of these fruits during the maturation and ripening stages. Knowledge of the characteristics of different cultivars during their progressive ripening stages can benefit consumers and manufacturers in selecting specific mangoes. Therefore, this study aimed to analyze the status of fruit quality traits and biochemical properties of local mango cultivars, specifically on four commercial Myanmar mango landraces, during their storage and ripening stages.

2. Materials and Methods

2.1. Sample Collection and Storage Condition

Fresh mango fruits of uniform sizes of cultivars ‘STL’, ‘MCS’, ‘HT’, and ‘YK’ were separately harvested at their mature green stages from the local orchards around Kyaukse District, Mandalay division, Myanmar, during 2019 and 2020. After checking for disease and mechanical damage, the selected mangoes were wrapped with fruit-wrapping paper and stored at room temperature, approximately 24 ± 2.0 °C. Four ripening stages were established based on their peel surface colors: ripening stage 1 (RS1), ripening stage 2 (RS2), ripening stage 3 (RS3), and ripening stage 4 (RS4), having mango surfaces with 0–10, 20–30, 70–80, and 100% yellow color, respectively [3], and their physicochemical changes were assessed.

2.2. Weight Loss and Sensory Evaluation

Mangoes were weighed during storage, and their weight loss (WL) was determined and expressed as a percentage.
WL (%) = (Wi − Wf/Wi) × 100
where Wi = initial weight and Wf = final weight.
Sensory assessment on mangoes was performed by ten trained panelists. A 9-point hedonic scale was used for sensory evaluation depending on appearance, aroma, texture, flavor and overall acceptability [22].

2.3. Total Soluble Solids and Titratable Acidity

Total soluble solid (TSS) content was determined from the filtered residue of homogenized pulp using a digital refractometer, with a range 0–32% (ATAGO 1-alpha, Singapore) and expressed as degrees Brix (°Brix). Ten grams of pulp were homogenized in 50 mL of distilled water, and the filtrate was used to measure titratable acidity (TA) and pH. TA was assessed by titrating with 0.1 N NaOH to pH 8.2, and the percentage (%) of citric acid was calculated using the following formula [23]:
Titratable   acidity   ( % )   =   Volume   of   0.1   N   NaOH   ×   Factor   ( 0.0064 )   ×   100 Volume   of   sample   used

2.4. Total Sugars, Reducing and Non-Reducing Sugars

The total sugar (TS) content was calorimetrically determined by the anthrone method [24]. Four grams of flesh were ground by a mortar and a pestle, mixed with 5 mL of ethanol, and then boiled for 10 min. After cooling, the homogenates were filtered, and the extracts were evaporated to dryness in a steam bath. Each residue was dissolved in 100 mL distilled water and stored at 4 °C. One milliliter of each was removed and mixed with 4 mL of ice-cooled anthrone reagent (0.2% anthrone in concentrated sulfuric acid). The tubes were then boiled in a water bath for 10 min, and after cooling, the absorbance of each sample was measured at 620 nm in Biochrom TM WPA Biowave II UV–Vis Spectrophotometer (England). A standard curve was prepared using different glucose concentrations, and the percentage of TS present in each sample, measured as grams per 100 g of mango flesh, was determined.
The reducing sugar (RS) content of mangoes was determined by the dinitrosalicylic acid (DNS) method [25]. One milliliter of the flesh extract from the stock was removed and mixed with 3 mL DNS reagent (40% Rochelle salt). Test tubes were boiled for 7 min in a water bath. After cooling, the absorbance of the solution was measured at 575 nm using a blank reagent. The RS content in each sample was calculated using the glucose standard curve. Non-reducing sugar (NRS) contents were determined by subtracting the RS% from the TS%.

2.5. Free Radical Scavenging Activity and Total Phenolic Activity

One gram of pulp was mixed with 20 mL of 80% methanol, kept in a water bath shaker at 20 °C for 24 h. Then, it was filtrated with Whatman No.1 filter paper and centrifuged at 10,000× g for 10 min. The collected supernatant was evaporated to dryness to measure total soluble solids. The extract was used to measure DPPH free radical scavenging activity and total phenolic activity.
Antioxidant capacity was determined by the 2,2-diphenyl-1-picryl-hydrazyl (DPPH) method [26], with a few modifications. A stock solution of 0.3 mM DPPH was prepared freshly using pure methanol. Ten microliters of methanoic extract (10 mg/mL) of mango pulp of each cultivar were mixed with 90 μL of DPPH radical in a microplate. Then, the mixture was kept for 30 min in darkness at 37 °C, and the bleaching of DPPH was determined at 517 nm by a microplate reader (SPECTROstarNano). Ascorbic acid was used as a positive control. DPPH radical scavenging activity was calculated as follows: [(A0 − A1/A0) × 100], where A0 and A1 are the absorbances of the control and experimental sample, respectively. The antioxidant capacity of each extract was expressed as ascorbic acid (vitamin C) equivalent antioxidant capacity (mg VEAC per 100 g of fruit extract).
The total amount of phenol compounds in the plant extracts was measured using Folin–Ciocalteu reagent [27]: 100 μL of the fruit extract (1 mg/mL) was oxidized with 450 μL of freshly diluted Folin–Ciocalteu reagent (10% v/v). The reaction was neutralized by adding 450 μL of 7.5% w/v sodium carbonate and vortexing the samples for 20 s. Next, the samples were incubated at 37 °C for 1 h, and the absorbance of the resulting blue color was measured by a SPECTROstarNano microplate reader at a wavelength of 765 nm. Three replicates were performed for each sample. The total phenolic content (TPC) was calculated as gallic acid equivalents (GAE) using the following equation:
T = C × V / M
where T is the TPC in mg/g of the extracts as GAE,
C is the concentration of gallic acid established from the calibration curve in mg/mL,
V is the volume of the extract solution in milliliters, and
M is the weight of the extract in grams.

2.6. Statistical Analyses

All data are reported as mean ± standard error of three replicates. The experiment was performed in a completely randomized design, and the data were analyzed using one-way analysis of variance followed by Tukey’s post hoc test with a 95% confidence level (p < 0.05) using the SPSS 16.0 software package. The data were then subjected to Pearson correlation analysis to determine the correlation matrix between variables of the genotypes (p < 0.01).

3. Results

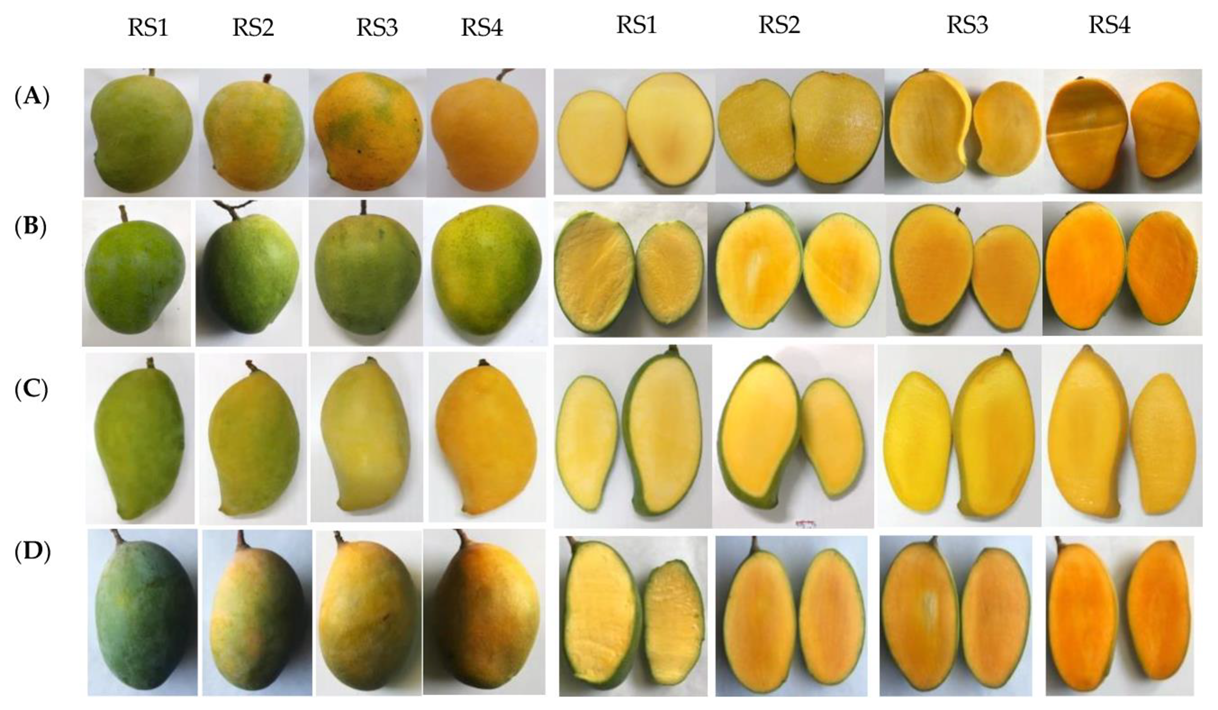
3.1. Fruit Size, Skin, and Flesh Color

Based on the fruit weight of the four mango cultivars, ‘HT’ was the largest one with 435 ± 15.00 g of fresh weight (FW), followed by MCS with 357.33 ± 12.05 g, ‘YK’ with 331.66 ± 16.28 g, ‘STL’ with 301.15 ± 9.77 g, respectively (Table 1). During storage, the peel and pulp color were recorded visually during ripening stages (Figure 1 and Figure 2). External and internal colors gradually changed from green to yellow and golden yellow, except for ‘MCS’, whereas the pulp color became golden yellow, but the peel color was still yellowish green at the end of the ripening stage.

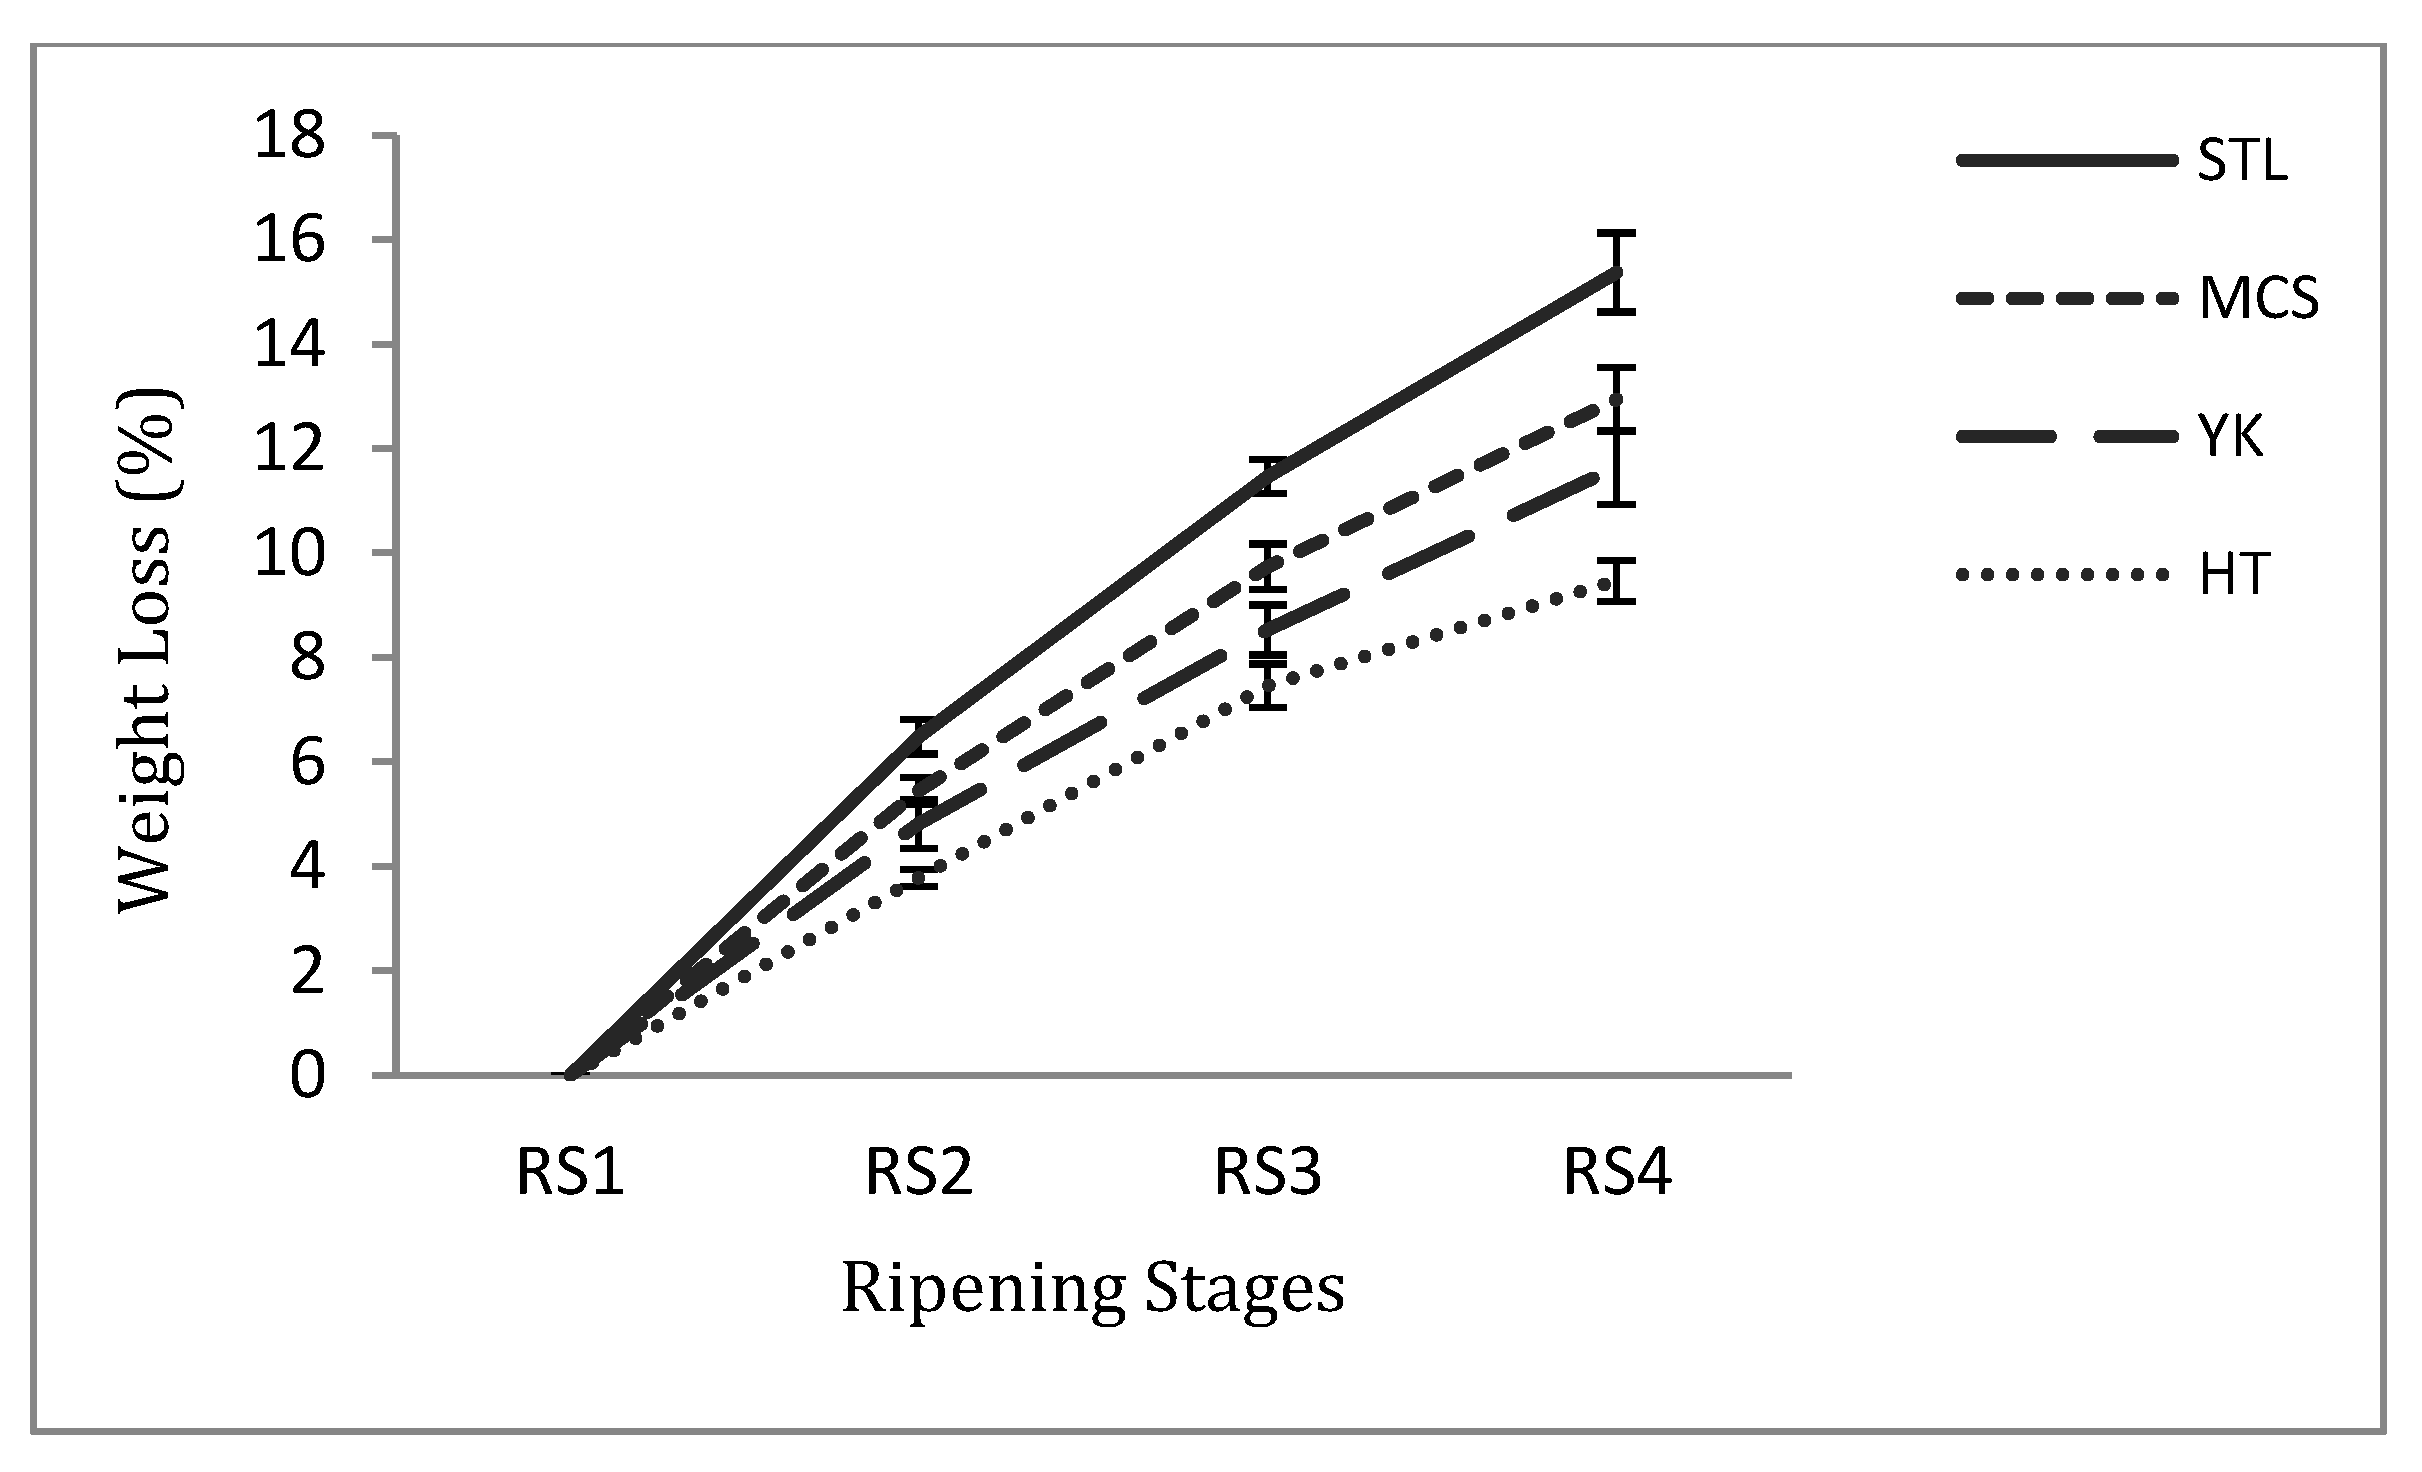
3.2. Weight Loss of the Four Mango Cultivars during Post-Harvest

Changes in weight loss (WL) varied depending on the cultivars and ripening conditions of the fruits. The WL of the four cultivars was recorded after harvesting during storage at ambient temperature (24 ± 2.0 °C) (Figure 2). Each cultivar showed a progressive increase in WL and the least values were observed in ‘HT’, with 3.77, 7.46, and 9.47% loss at RS2, RS3, and RS4, respectively. ‘YK’ lost 4.81% of its initial weight after RS2, rising to 8.52% at RS3, and reaching 11.64% at the end of ripening. In addition, weight loss in ‘MCS’ significantly increased from 5.44 to 9.74% between RS2 and RS3 and reached 12.94% at RS4. Notably, the highest rate of WL was observed in STL, where its initial WL was 6.48% at RS2, then significantly increased to 11.47% at RS3, reaching 15.37% at the end of storage (RS4).

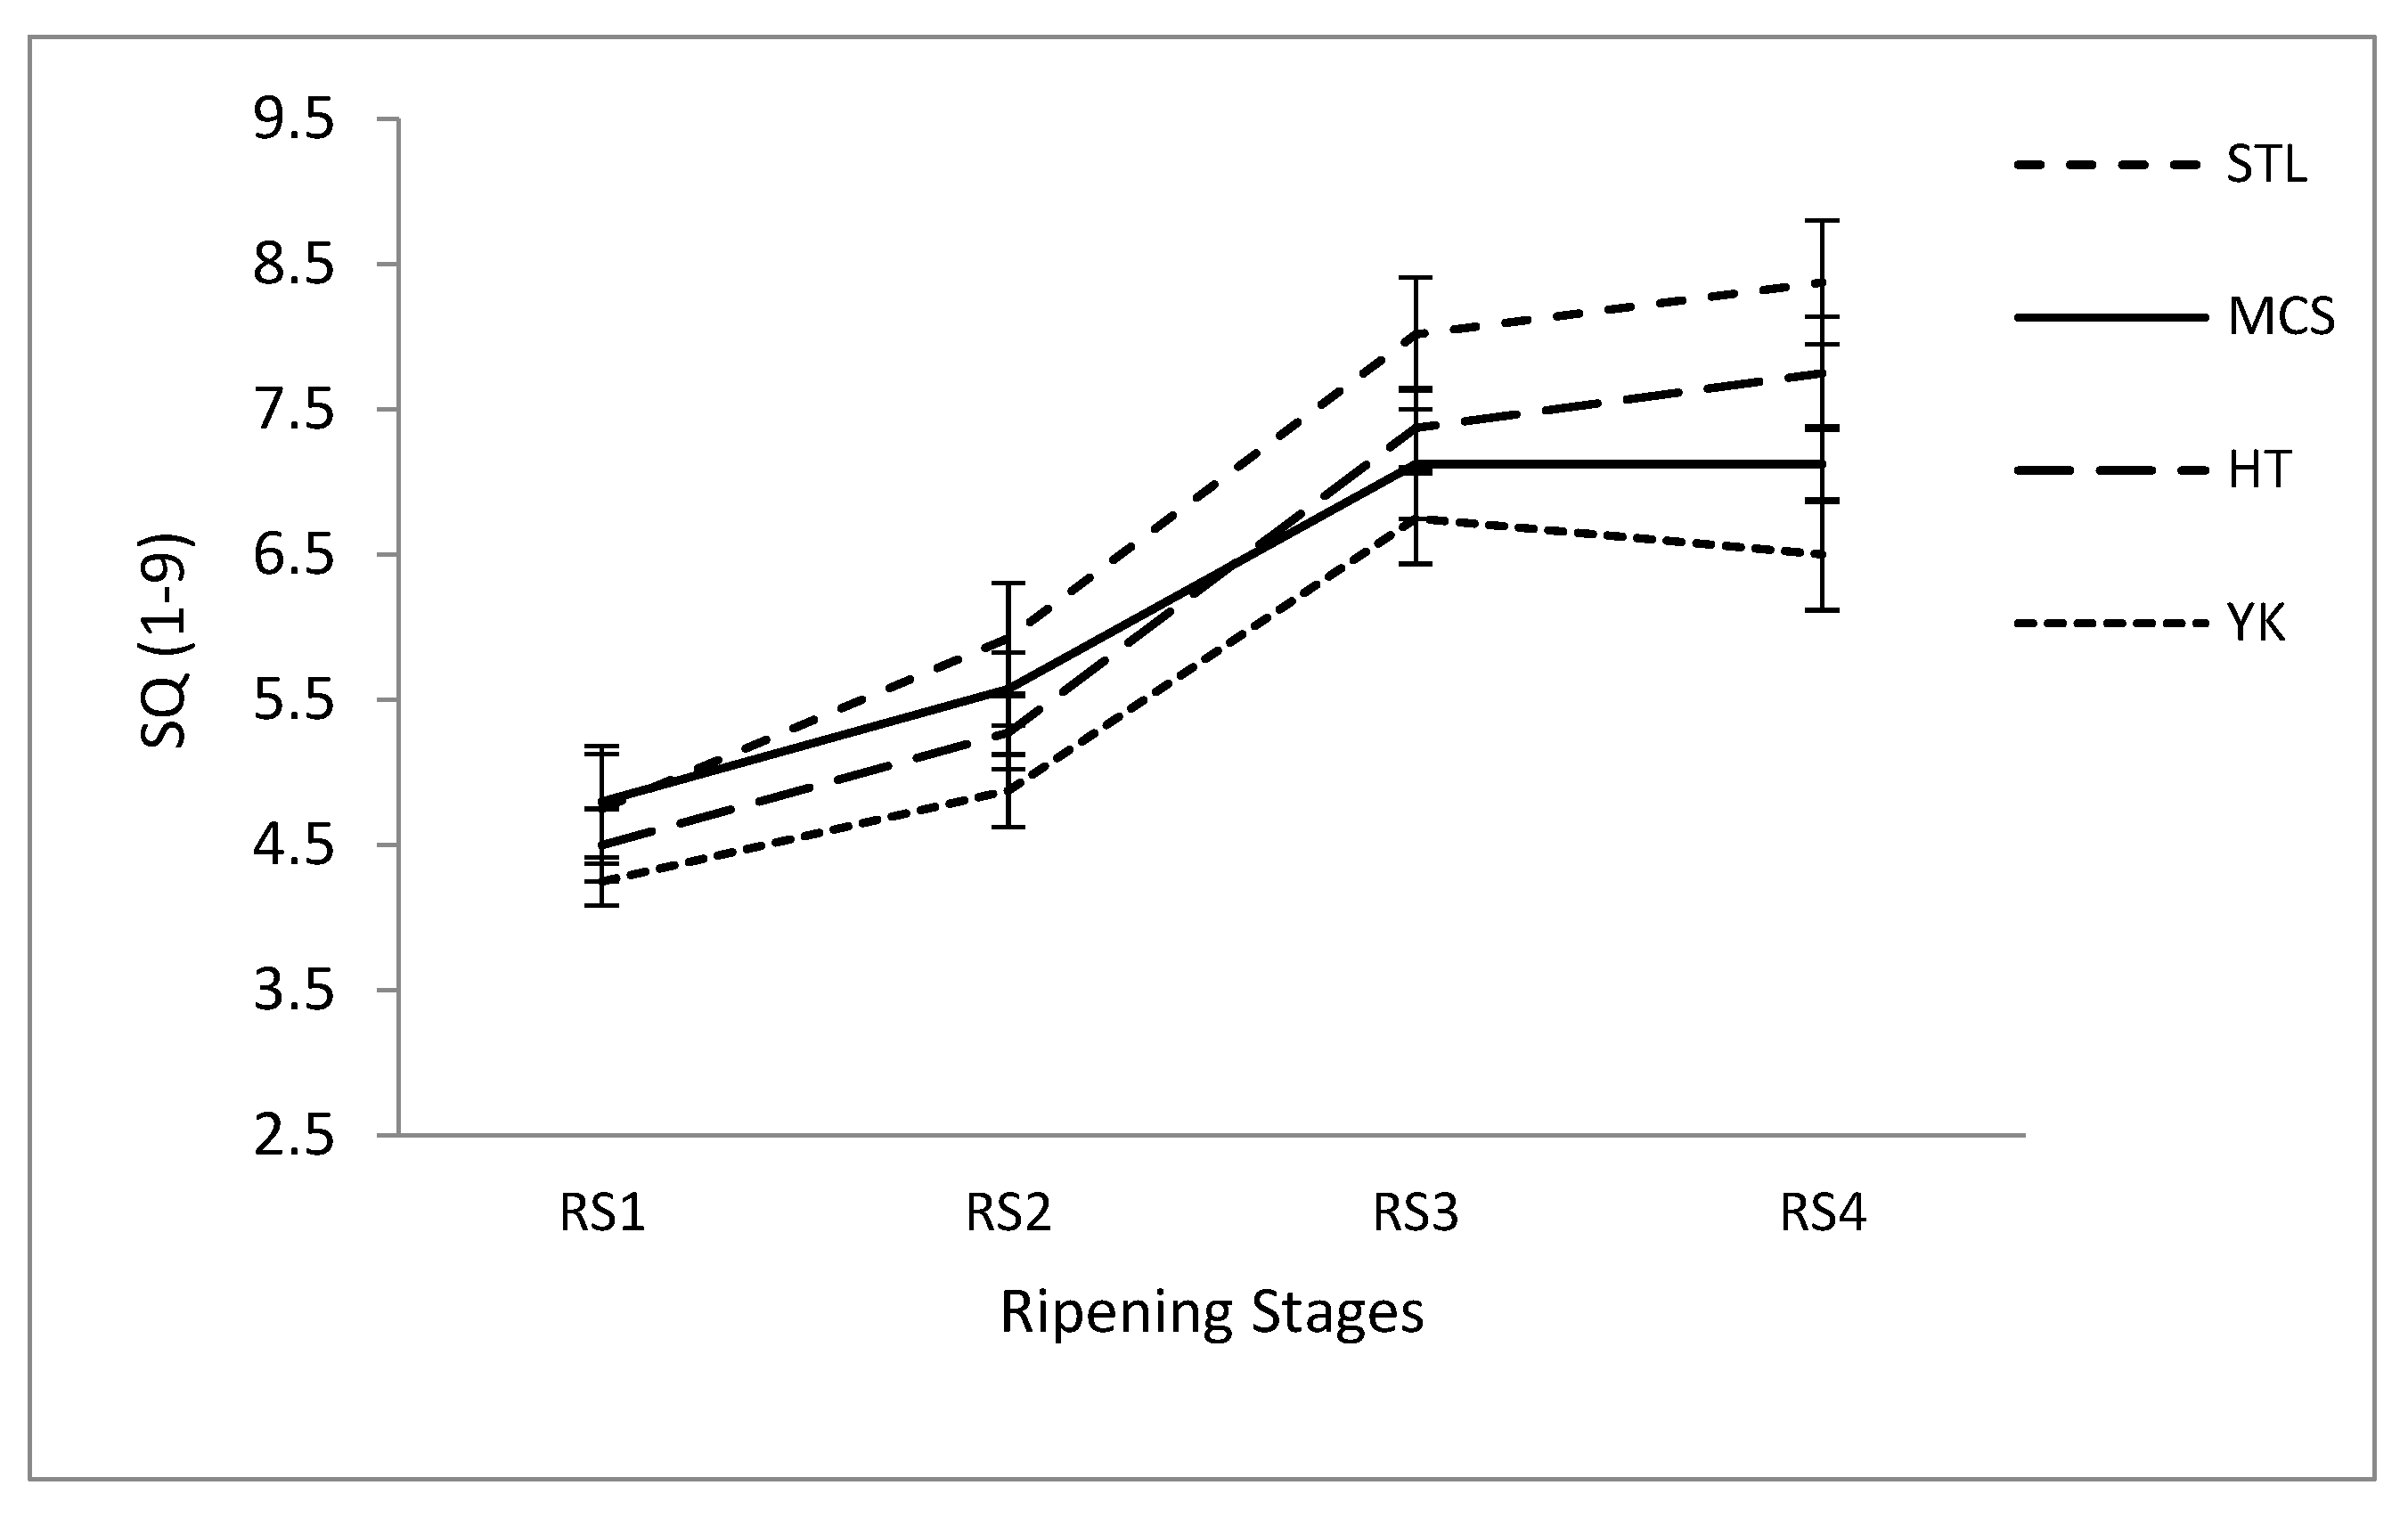
3.3. Sensory Quality (SQ)

The scores of sensory attributes gradually increased during ripening (Figure 3). ‘STL’ exhibited its excellent fruit quality and the highest consumer acceptability, showing maximum sensory attributes and overall acceptability with 8.02 ± 0.39 and 8.38 ± 0.43 SQ scores between RS3 and RS4, respectively. In addition, the appearance and color of ‘HT’ at the time of ripening were particularly appealing to the consumers, and other sensory characteristics were improved significantly with SQ values of 7.38 ± 0.28 and 7.75 ± 0.39 at RS3 and RS4, respectively, during storage. Owing to the pleasant odor, flavor, and mouthfeel, sensory evaluation of ‘MCS’ was higher than that of ‘HT’ and ‘YK’ cultivars at the beginning of ripening (RS1 and RS2), whereas SQ value became lower than ‘STL’ and ‘HT’ at the later stages. The lowest SQ score was observed in ‘YK’ during storage.

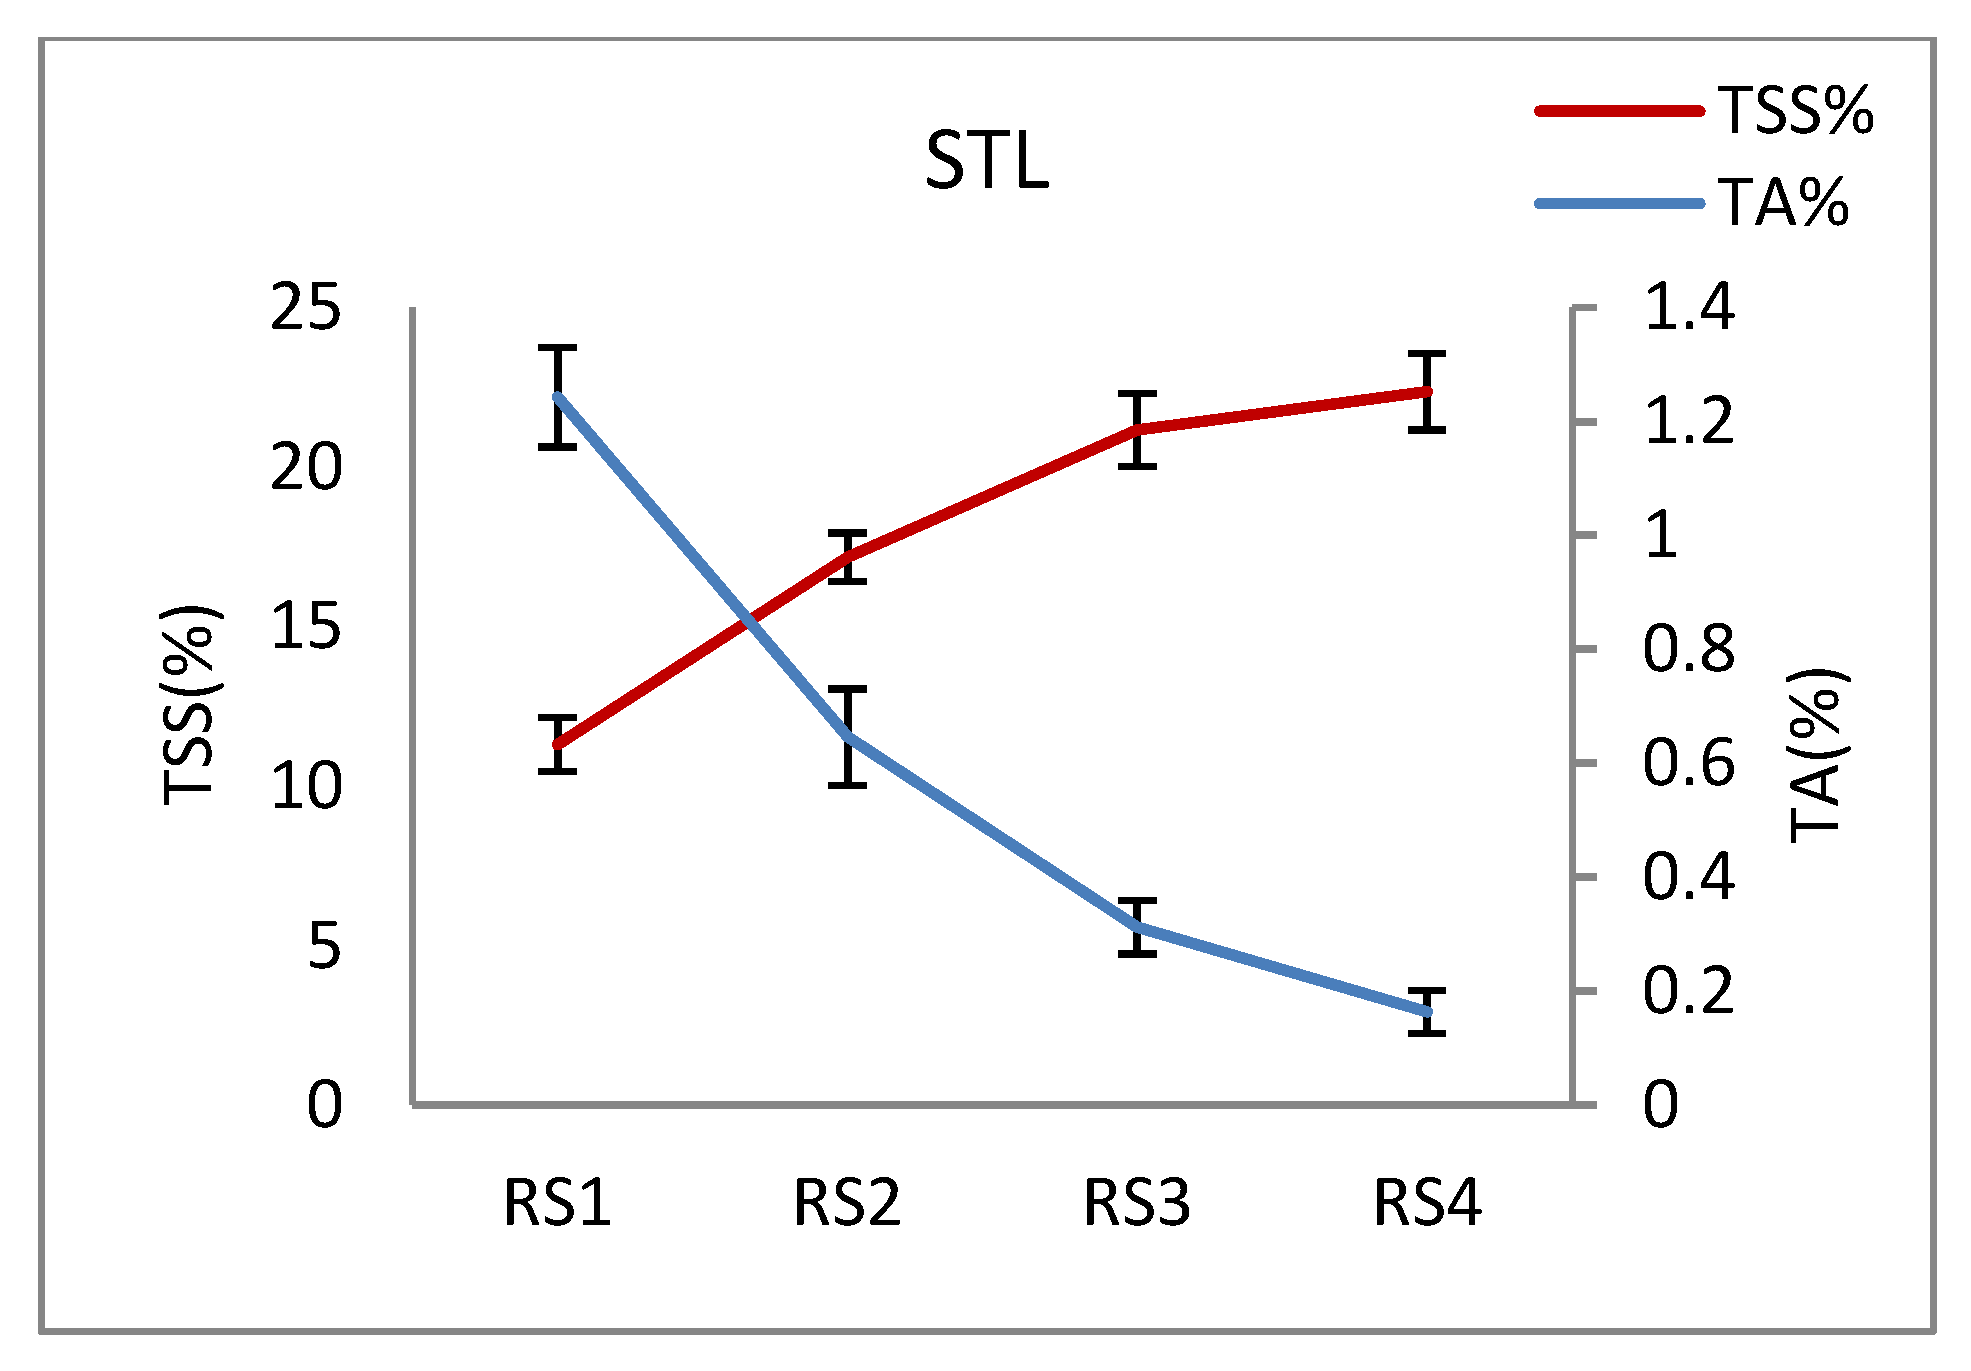
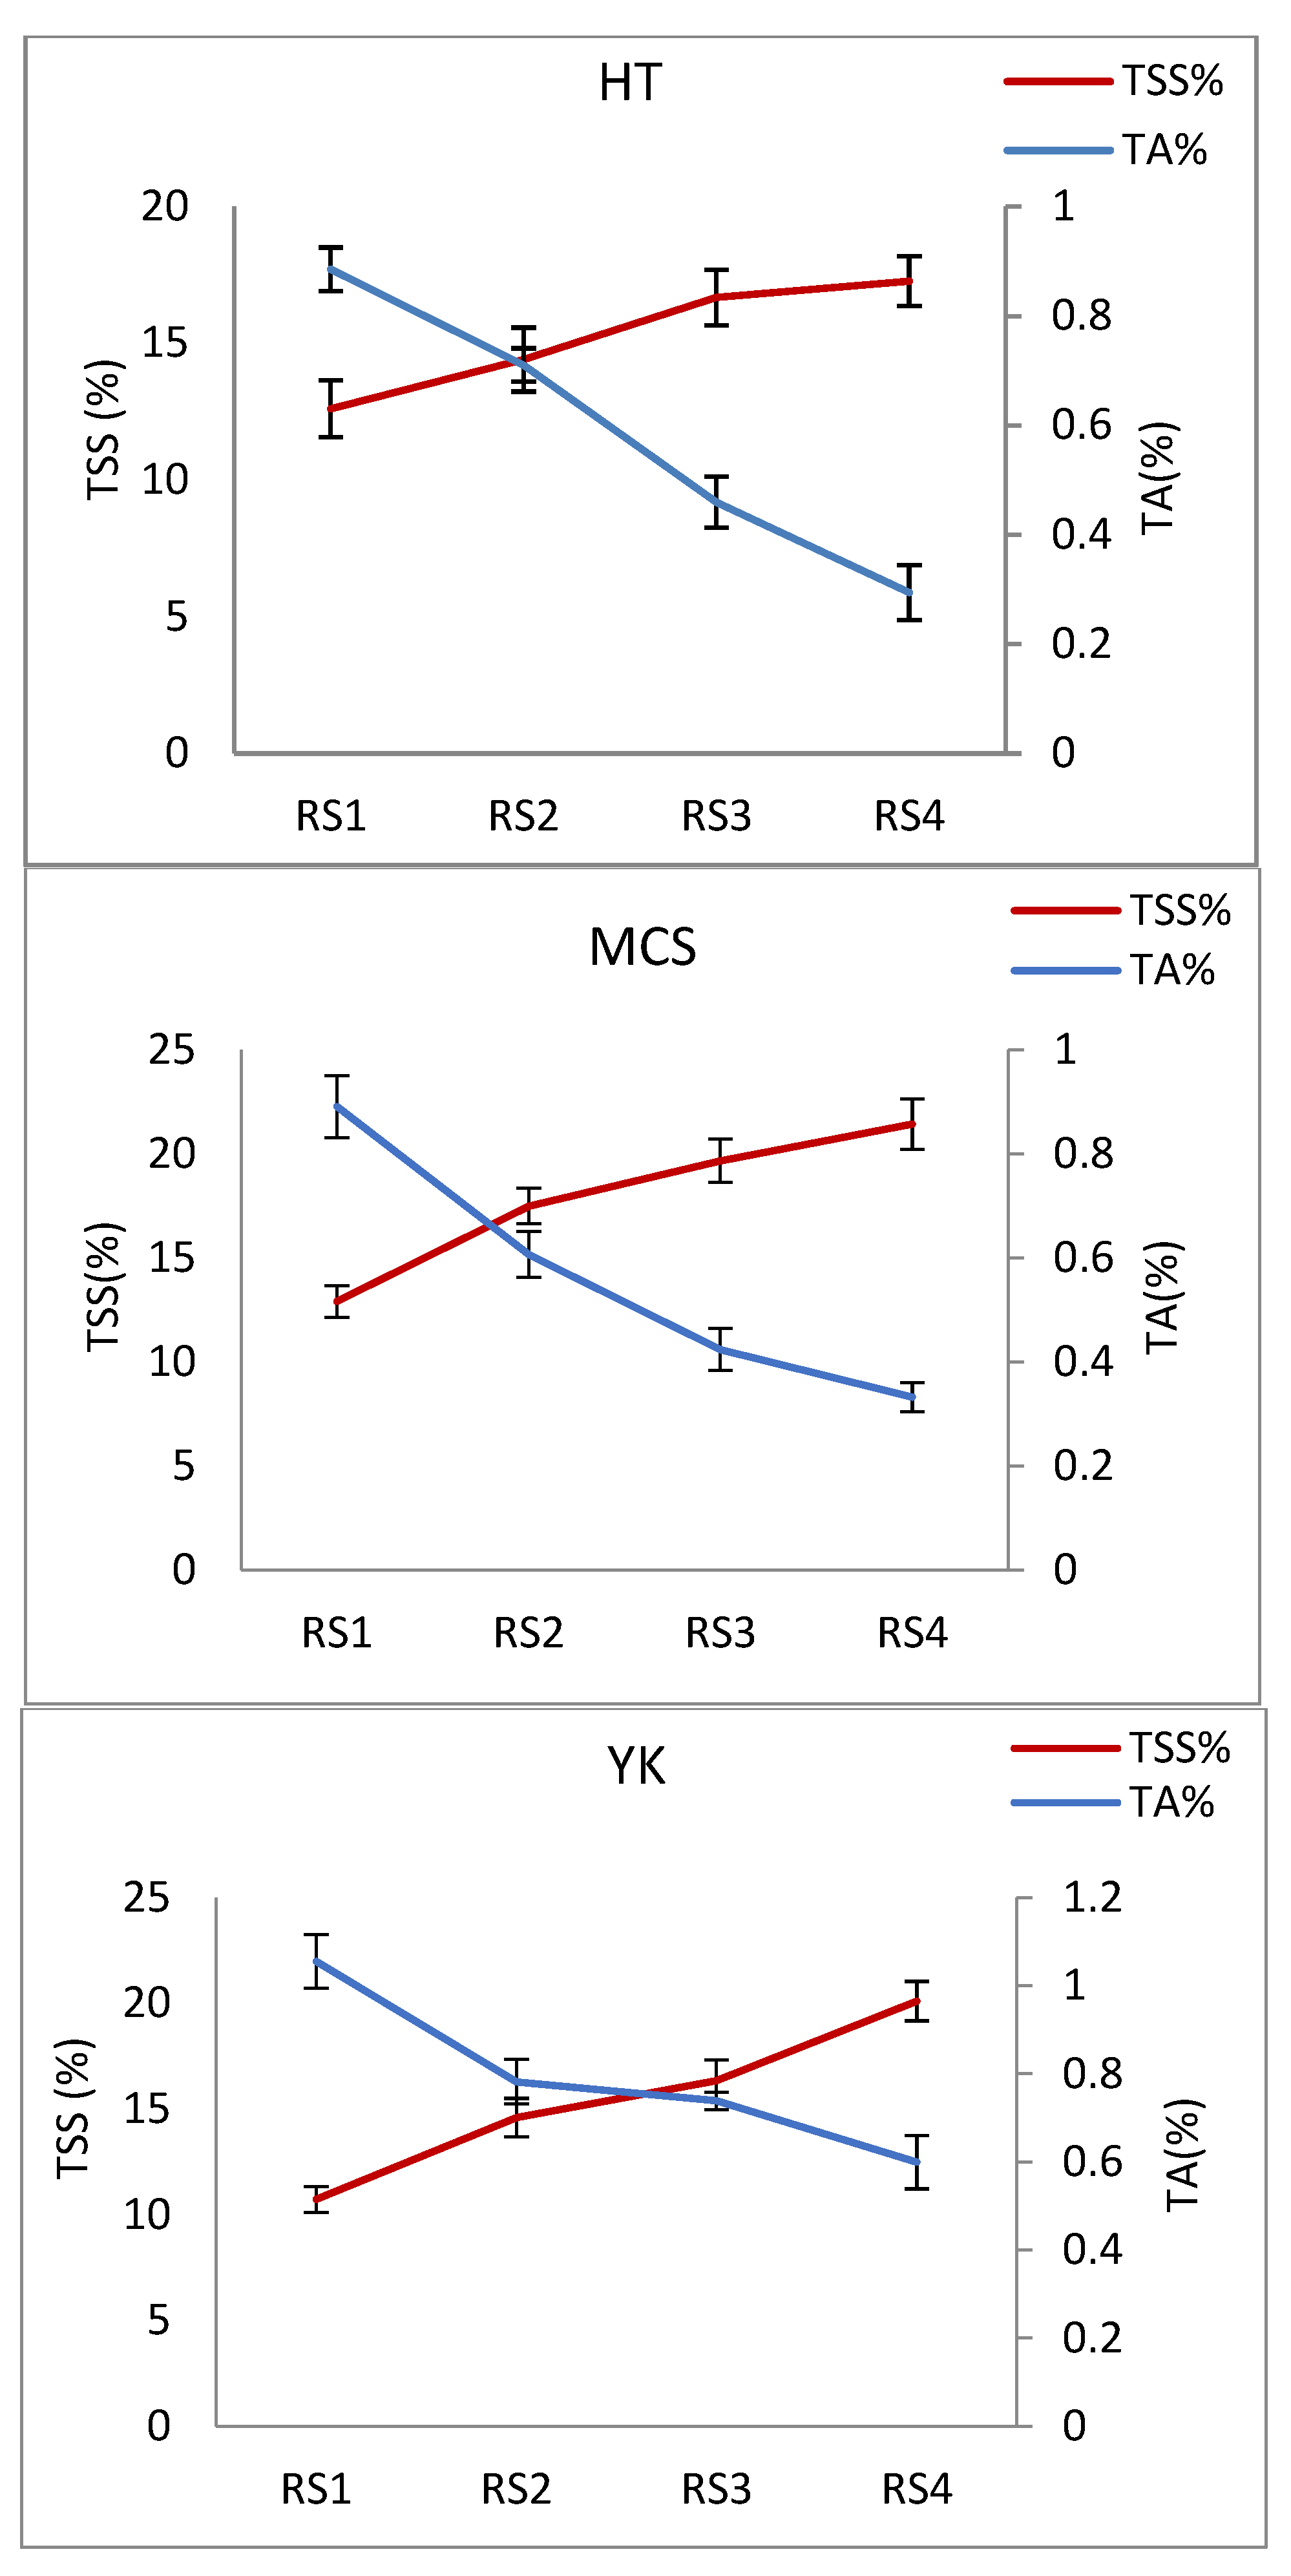
3.4. Changes in TSS and TA

Changes in the TSS and TA of the four mango cultivars during ripening are shown in Figure 4. Despite 11.33% TSS content, expressed as °Brix, in ‘STL’ at RS1, the TSS content sharply increased to 17.17% and 21.17% at RS2 and RS3, respectively, and 22.37% was observed as the highest TSS content at the last ripening stage, RS4. The TSS values of ‘MCS’ and ‘YK’ ranged from 12.92–21.43% and 10.73–20.12%, respectively, from RS1–RS4. The initial TSS in the ‘HT’ cultivar was 12.62 % and there was an average of 2% increase in RS2 and RS3. At the end of the ripening stage, RS4, the TSS content of ‘HT’ was 17.27%, which was the lowest among all cultivars.
In contrast to TSS, the percentage of TA declined significantly from the early to late harvest stages, as shown in Figure 4. Interestingly, TA% in ‘STL’ decreased by approximately half in each ripening stage, with 1.24 in RS1, 0.65 in RS2, 0.31 in RS3, and 0.16% in RS4. There was a similar progressive decline of TA percentage in ‘MCS’ and ‘HT’, with values in the range of 0.88–0.89, 0.61–0.71, 0.42–0.46, and 0.29–0.33% in R1, R2, R3, and the last ripening stage, RS4, respectively. ‘YK’ cultivar fell only half the value of TA% (1.05–0.59%) from RS1–RS4, although a dramatic decline in TA was observed in the mid stages.

3.5. Changes in TS, RS, NRS, and pH

TS and NRS contents accumulated during the ripening of mangoes (Table 2 and Table 3). At the beginning of storage, RS1, the initial values of TS and NRS contents in ‘STL’ were higher than those of the ‘MCS’, ‘HT’, and ‘YK’ cultivars, which displayed no considerable variation. Then, TS and NRS increased dramatically during storage, and the highest percentage of TS was observed in ‘STL’, followed by ‘MCS’, ‘YK’, and ‘HT’ with values of 18.15 ± 0.12, 16.81 ± 0.65, 14.62 ± 0.29, and 13.62 ± 0.64, respectively, at RS4. Likewise, NRS contents were 13.63 ± 0.18, 12.02 ± 0.56, 9.94 ± 0.1.10, and 9.52 ± 0.81 in ‘STL’, ‘MCS’, ‘YK’, and ‘HT’, respectively, at the last ripening stage. For RS percentage, no significant difference was observed in any of the four mango pulps, although it gradually increased during storage. In contrast to TA, the pH of the pulp increased during storage time (Table 2). ‘STL’ exhibited the highest initial pH throughout the ripening stages, significantly at RS3 and RS4, whereas ‘YK’ showed the lowest value at every stage. There was no considerable variation in pH between ‘MCS’ and ‘HT’.

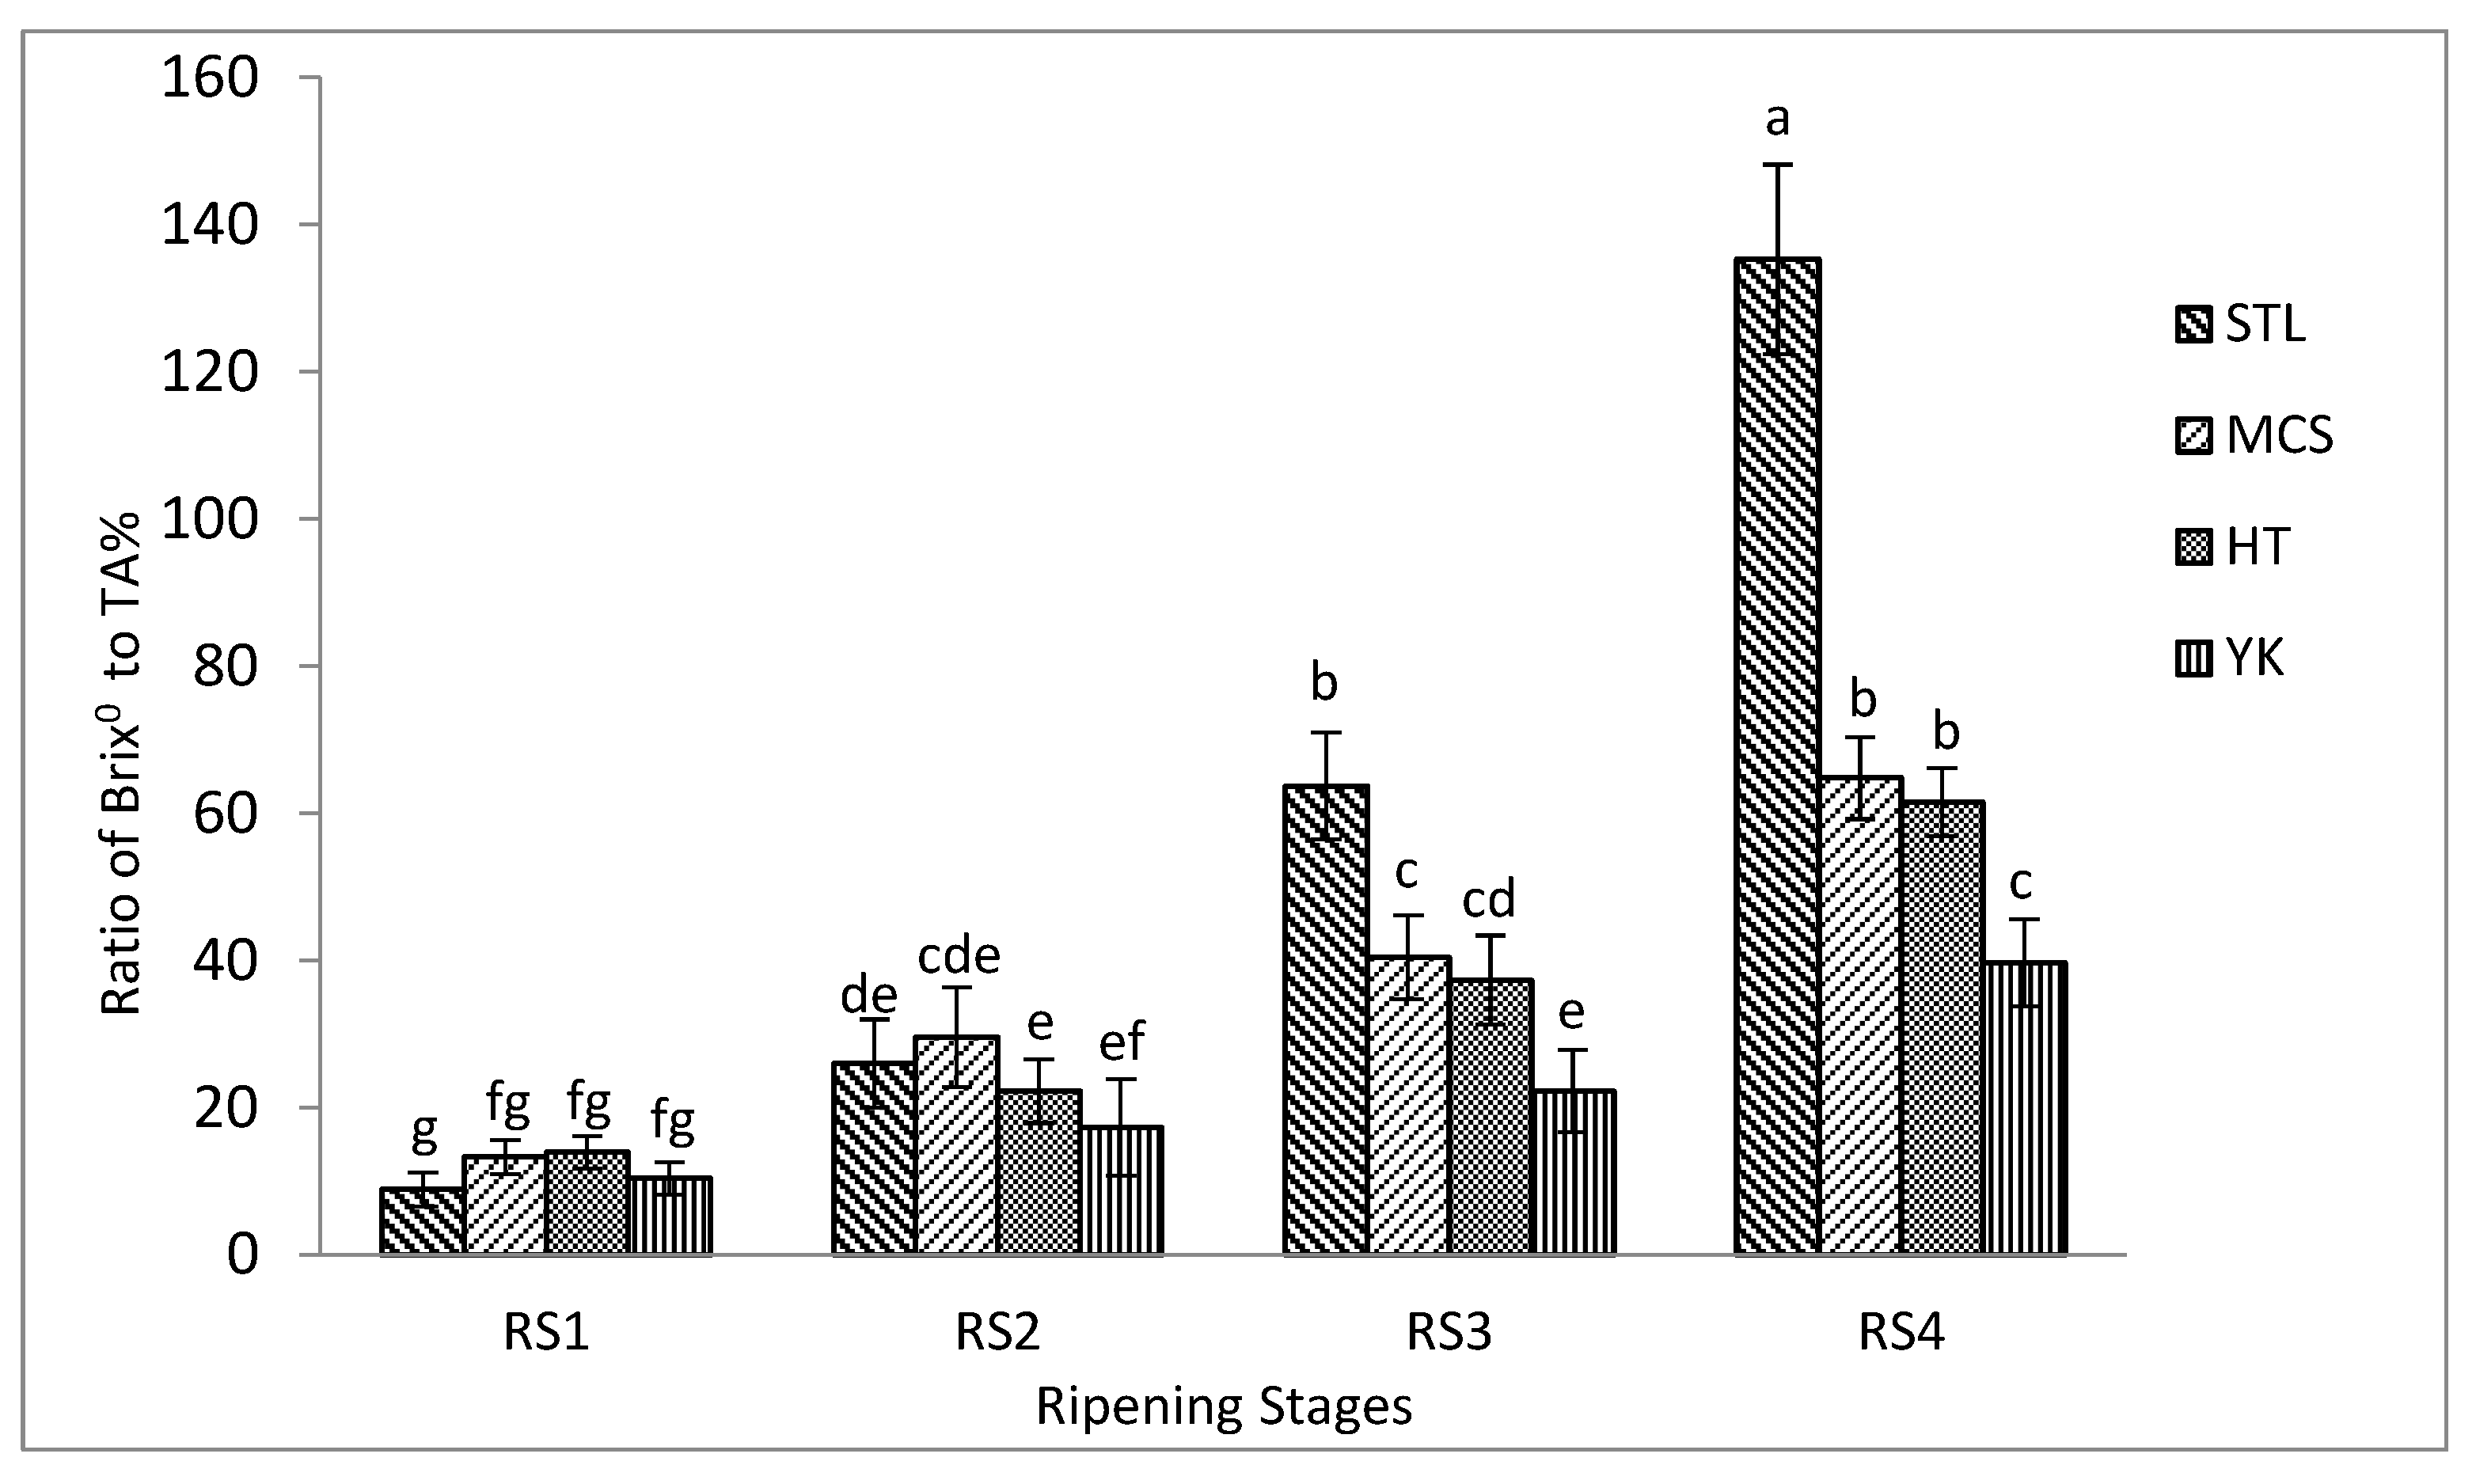
3.6. Changes in Sugar/Acid Ratio

During the early mature stage after harvest, the °Brix/TA ratio was low and did not show much difference among cultivars: it ranged between 8.88 ± 2.31 and 13.90 ± 2.19 in RS1 (Figure 5). Likewise, there was no significant difference in RS2 although there was a gradual increase in TSS/TA ratio. However, the ratio noticeably increased in ‘STL’ with 63.69 ± 7.26 in RS3 while there was a great change in values for ‘MCS’, ‘HT’, and ‘YK’ despite showing less significance. Surprisingly, ‘STL’ showed the highest significant sugar/acid ratio of 135.27 ± 12.88 with excellent fruit quality at the last edible stage, whereas that of ‘YK’ was 39.71 ± 5.90 at RS4. There was a 20–25% increase of the TSS/TA ratio in ‘MCS’ (64.78 ± 5.59) and ‘HT’ (61.52 ± 4.66) from RS3 to RS4.

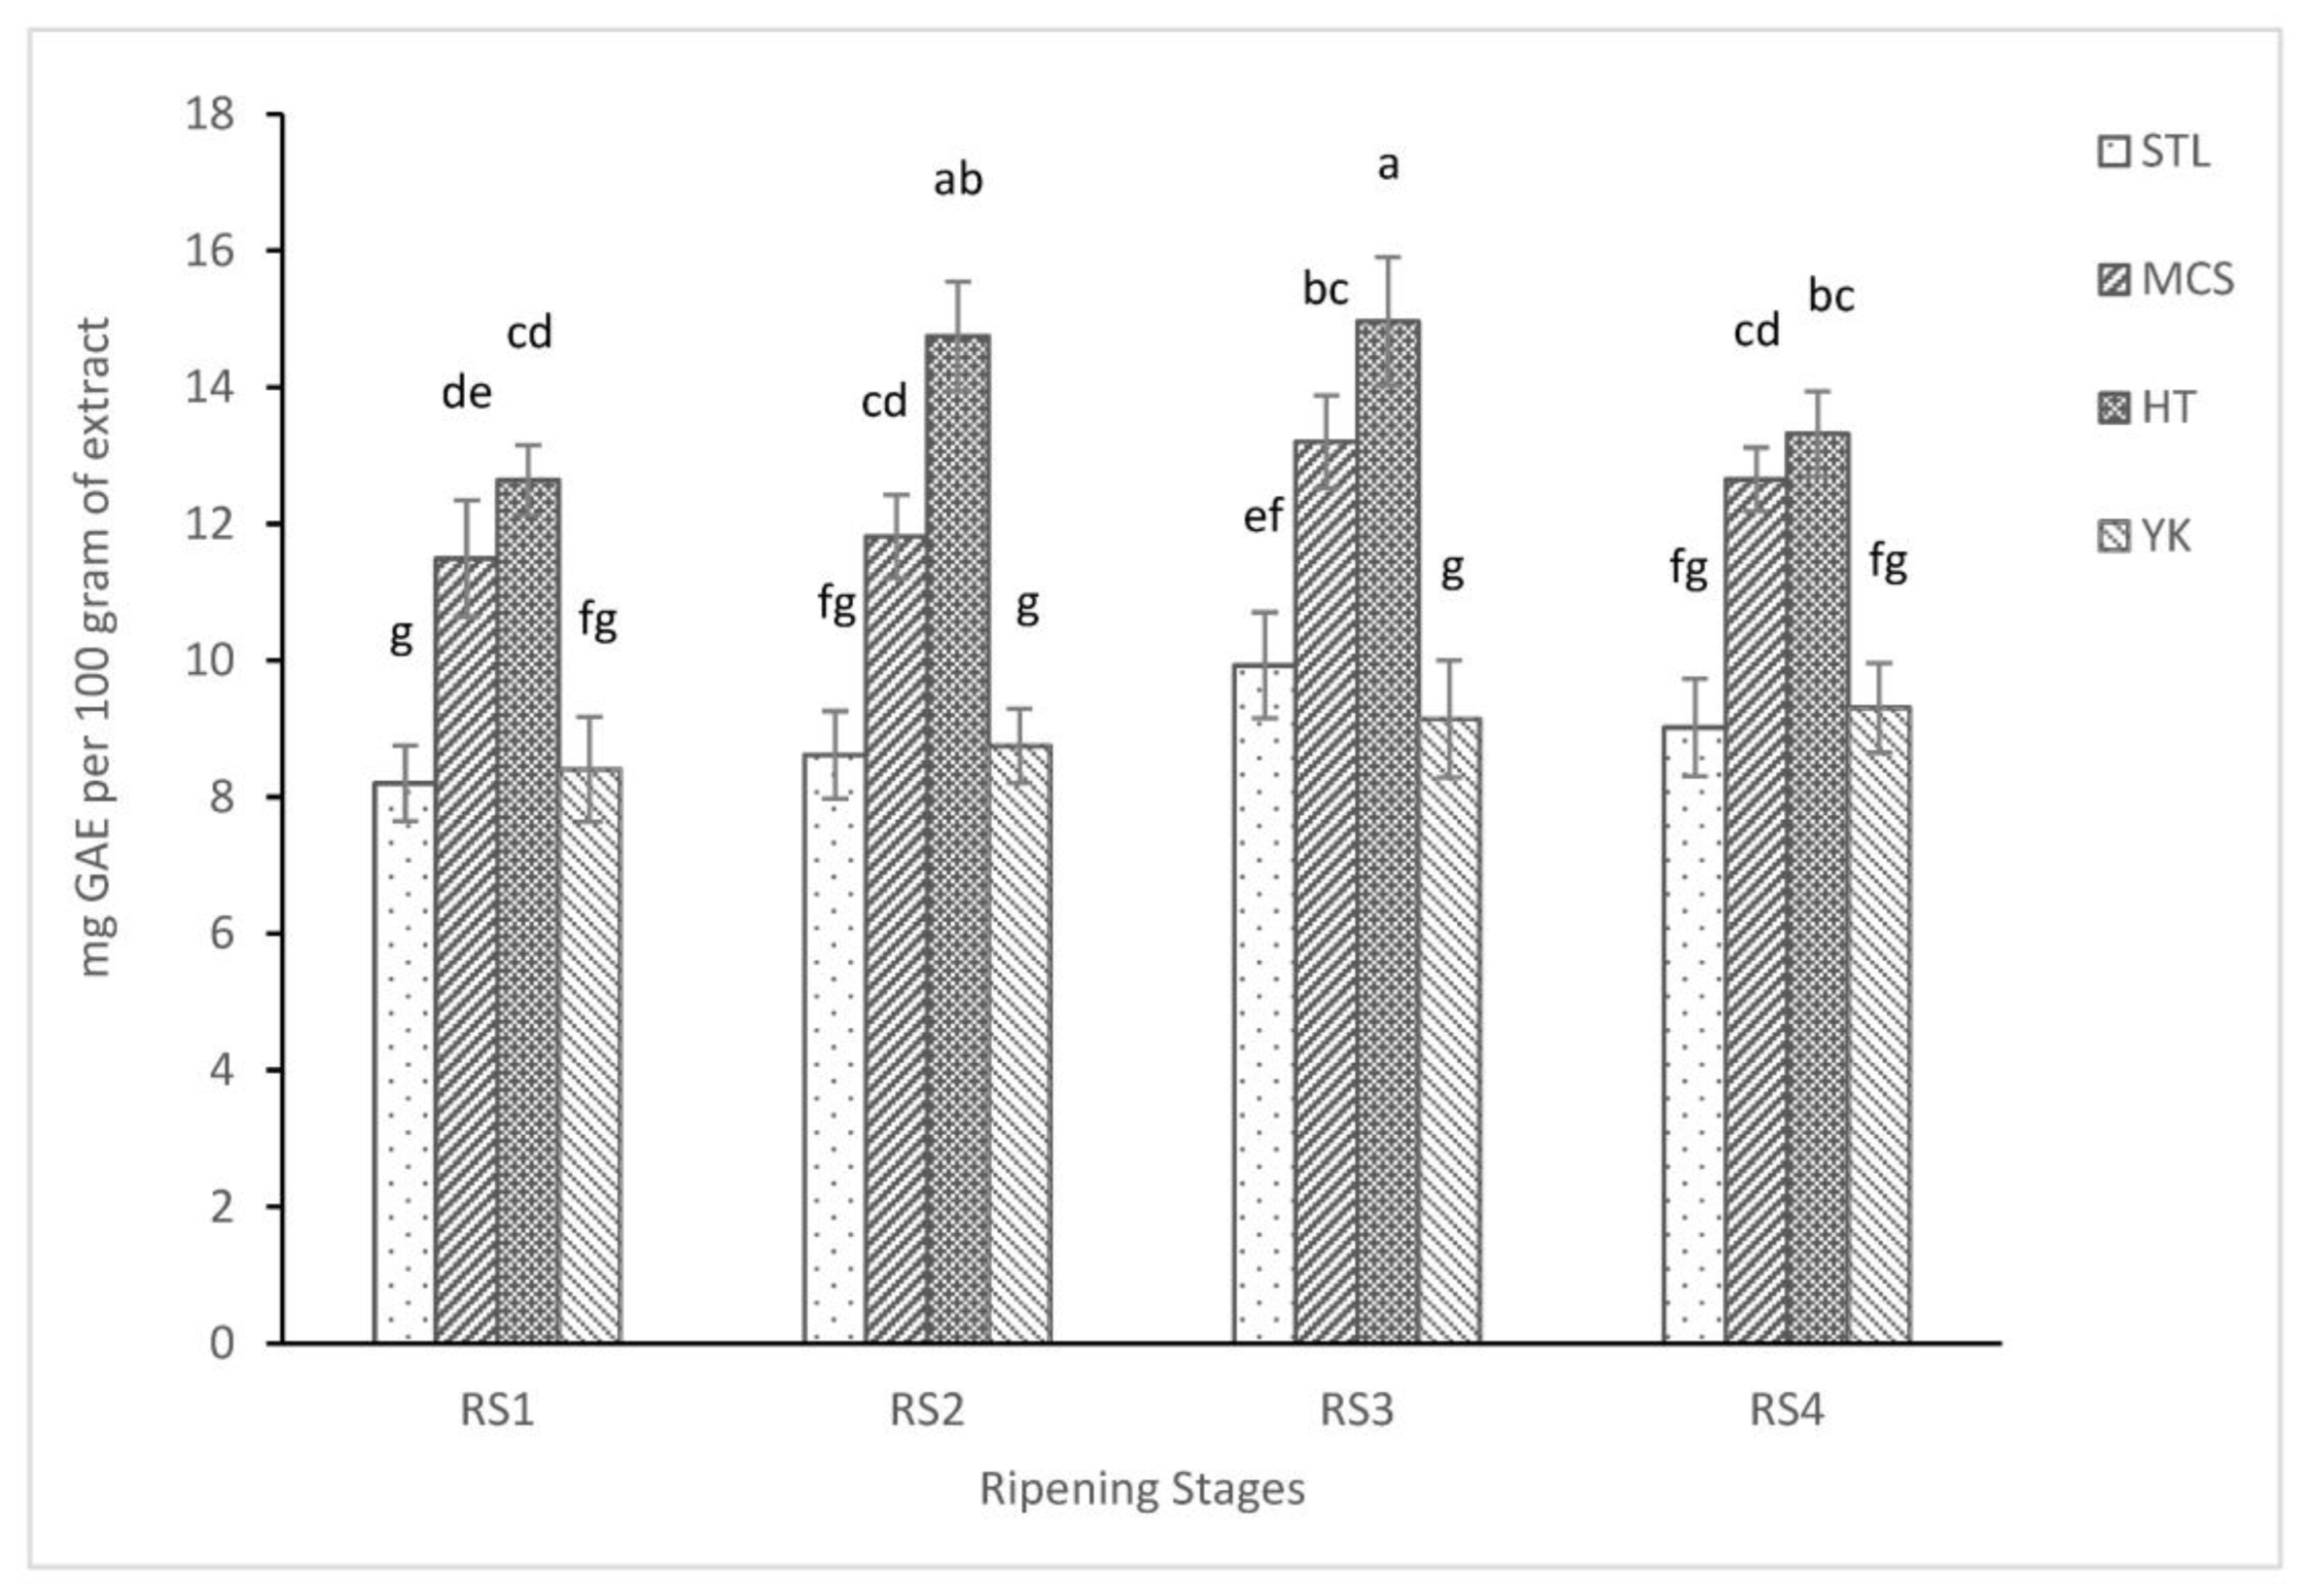
3.7. In Vitro Total Phenolic Activity

Concentrations of TPC were determined in four mangoes at different ripening stages (Figure 6). There was no considerable variation of TPC in ‘STL’, ‘MCS’, and ‘YK’ throughout their ripening stages, with values in the range of 8.20 ± 0.55–13.20 ± 0.68 mg GAE per 100 g of extract whereas ‘HT’ showed a significant increase in TPC from RS1 to RS2. After that, no changes were found in ‘HT‘at RS3, and then it showed a sudden decline in RS4. Overall, ‘HT’ and ‘MCS’ presented the highest and second highest significant TPC with their respective values of 14.96 ± 0.94 and 13.20 ± 0.68 mg GAE per 100 g of extract, in their mid-stages, whereas ‘YK’ and ‘STL’ showed similar TPC values during ripening.

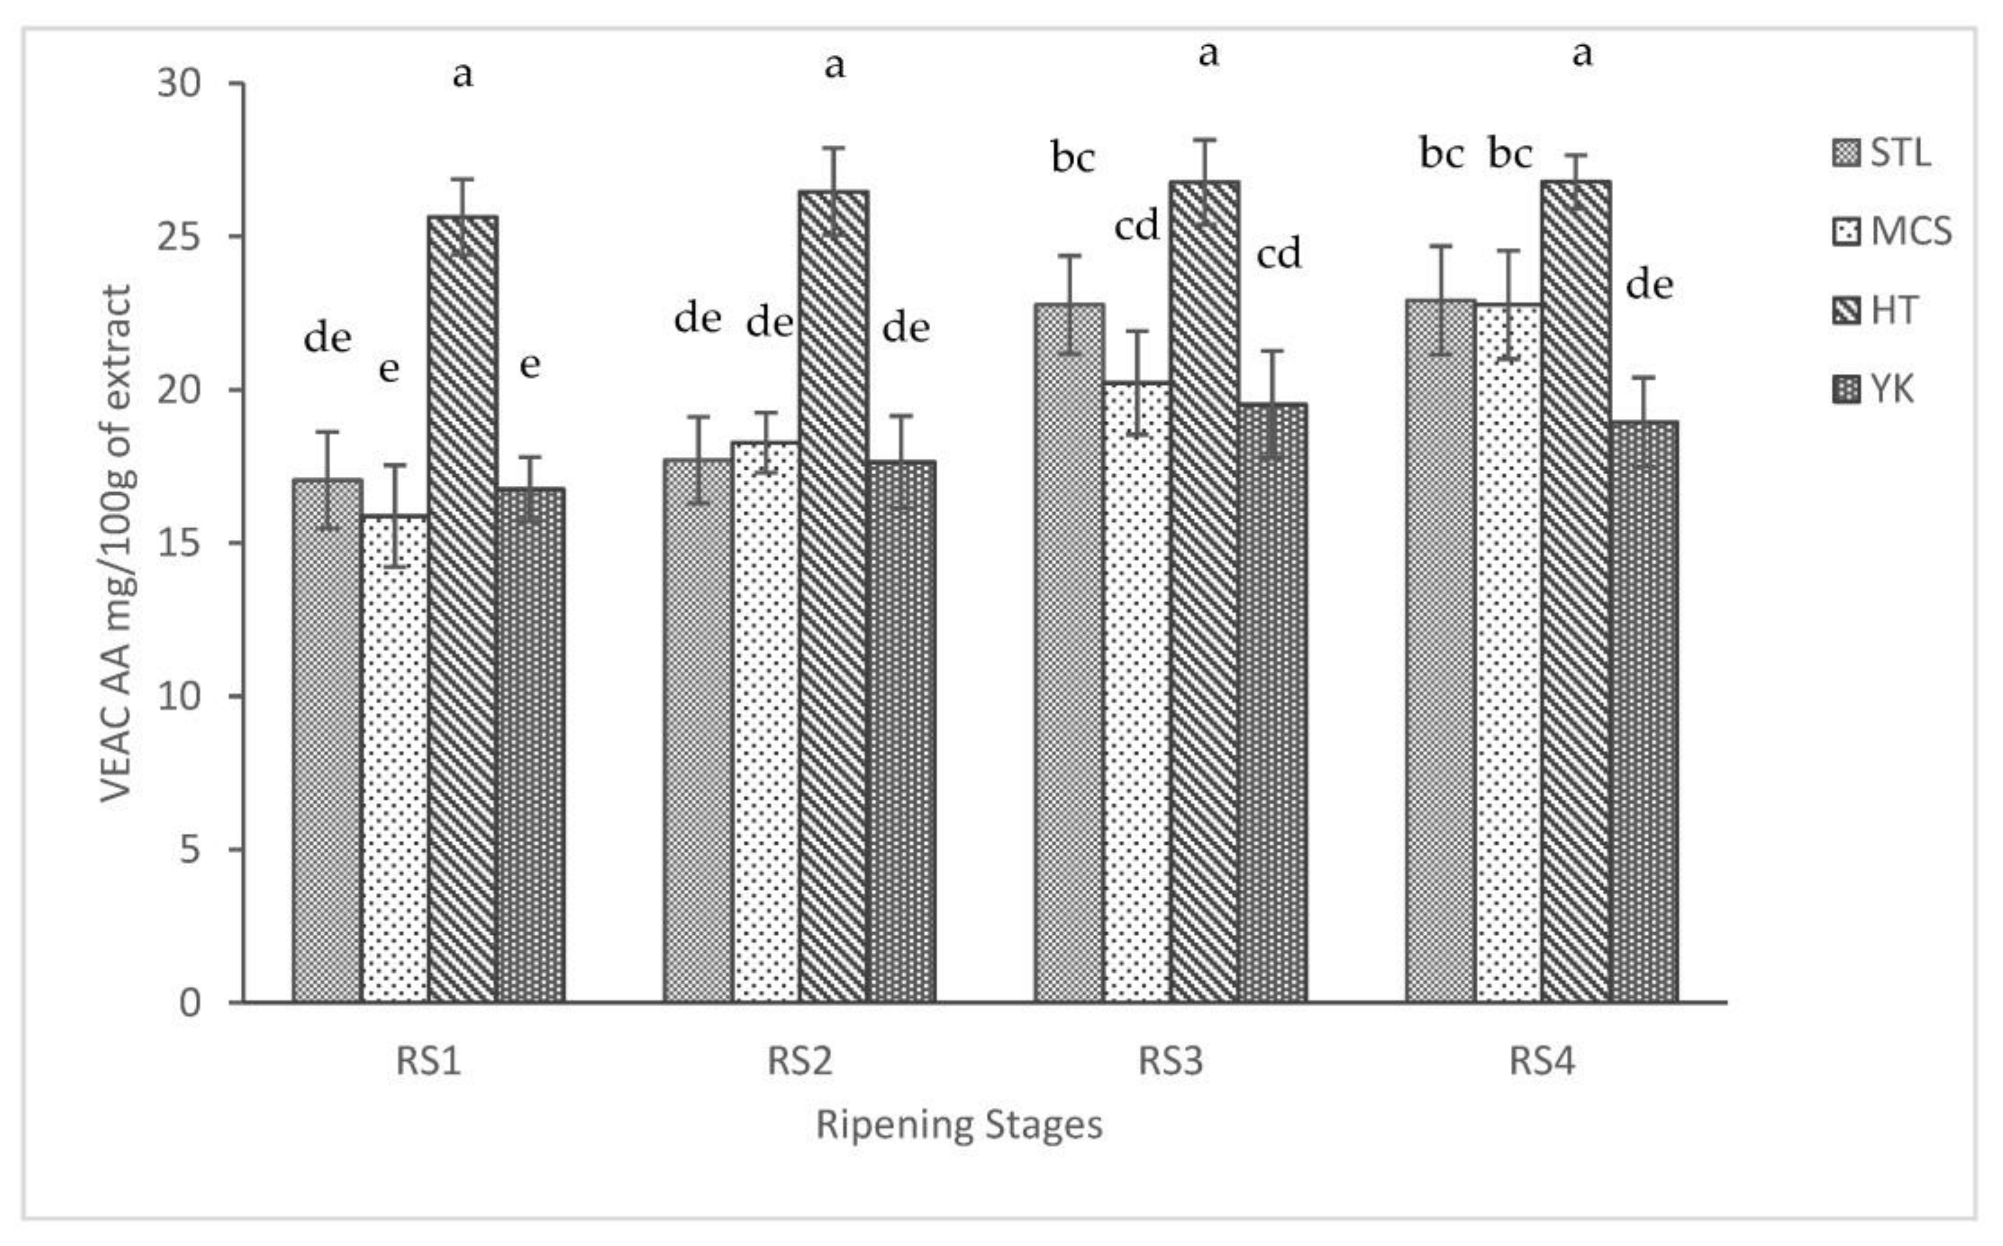
3.8. DPPH Free Radical Scavenging Activity

DPPH radical scavenging activity of the extracts was evaluated according to their different ripening periods (Figure 7). Although increasing trends were observed in total antioxidant contents from RS1 to RS3, no significant variation was observed in ‘MCS’, ‘HT’ and ‘YK’, with values ranging from 15.88 ± 1.66 to 20.23 ± 1.67, 25.63 ± 1.23 to 26.77 ± 1.34, and 16.76 ± 1.05 to 19.52 ± 1.75 VEAC mg AA/100 g of extract, respectively. However, ‘STL’ showed a significant increase from 17.05 ± 1.57 to 22.77 ± 1.60 VEAC mg AA/100 g of extract. ‘HT’ cultivar presented the highest significant antioxidant activity throughout the storage regardless of considerable variation at each ripening stage. When it reached to RS4, a slight decline was observed in ‘YK’ whereas there was a little increase in ‘MCS’. Free radical scavenging activity of ‘STL’ and ‘HT’ cultivars remained nearly constant at their last edible stages.

4. Discussion

The changes in fruit quality attributes and biochemical properties during fruit ripening stages of different mango cultivars grown in India, China, Thailand, and Maxico have been reported [3,5,6,7,10,11,14]. Myanmar is one of the countries that enrich local mango cultivars and grow the mangoes commercially. However, research regarding the status of fruit quality attributes and biochemical properties during their ripening stages or postharvest storage has been inadequate. Of the local mangoes, the cultivars such as ‘STL’, ‘MCS’, ‘HT’, and ‘YK’ are considered excellent by the consumers due to their fragrant flavor and nutritional values. However, it is still unknown whether their fruit quality attributes and biochemical properties varies during their ripening stages. Therefore, we investigated the presence and variation of the antioxidant activities, sugar contents, TSS, TPC, and TA, which are associated with the quality attributes and biochemical properties, in different ripening stages of the cultivars ‘STL’, ‘MCS’, ‘HT’, and ‘YK’. We observed that the investigated values differed depending on cultivars, and changes of the values during the ripening stages also differed among the cultivars. Our findings were consistent with those reported in previous studies [3,5,6,7,10,11,14], which also reported differences of the fruit quality values and biochemical properties depending on the cultivars and their ripening stages. Generally, skin color shows the carotenoid content of fruit flesh [28]. We also agreed with this for ‘STL’, ‘HT’, and ‘YK’ because the skin colors of the cultivars gradually changed from green to yellow during the ripening stages, and were associated with their flesh colors (golden yellow). However, the skin color cannot determine the carotenoid content in ‘MCS’, because although its skin color was still green until the last ripening stage, the flesh color was yellowing. This indicated that presence of carotenoid in all mango fruits cannot be determined using skin color, as it can vary depending on cultivars. Similar results have been reported in Thailand mango ‘Thongdum’ [8].
A gradual increase in LW among all four mangoes during ripening was observed in the order of ‘STL’ > ‘MCS’ > ‘YK’ > ‘HT’, indicating variation of LW depending on the cultivars. Theoretically, LW or fruit softening in climacteric fruits (i.e., apples and mangoes) is mainly due to excess production of ethylene during the ripening stages or storage periods [7,11,29], and suppression of ethylene production in the fruits using ethylene biosynthesis or receptor inhibitors delays weight loss [30,31]. Therefore, it was likely that ethylene levels produced in the cultivars varied, and that produced in ’STL’ would be higher than that of ‘YK’ or ‘MCS’, but that produced in ‘HT’ would be the lowest. Similar to LW, variation of SQ was also observed in all cultivars; in particular, the variation was more prominent at RS4. Based on SQ scores at RS4, the highest consumer acceptability was observed in ‘STL’ followed by ‘HT’, ‘MCS’, and ‘YK’, respectively. Variation of weight loss and SQ scores during mango ripening stages has been previously reported [10].
During the ripening stages (RS1 to RS4), the percentages of TSS gradually increased from 10% to 23%, while those of TA rapidly declined from 1.2% to 0.16%, depending on the cultivars. These results were similar to those observed in other mangoes such as ‘Ataulfo’ [3], ‘Tommy Atkins’ [12], and ‘Keitt’ [32]. However, TSS and TA values in the cultivars ‘Chokanan,’ ‘Golden phoenix,’ and ‘Water lily’ ranged from 16.80% to 20.30% or 0.26% to 0.12% during fruit ripening [33]. This indicated the differences of initial TSS and TA values contained in the different cultivars, which might reflect eating quality of the cultivars. During the ripening stages, decrease of TA values resulted in the loss of acidity as acids are utilized as substrates for respiration [34], which causes gradual increase in TSS and pH values, whereby increasing total sugar content during fruit ripening. This hypothesis was prominent in ‘STL’, which has the lowest TA but the highest TSS, total sugar, and pH. Overall, the TSS values of four mangoes, especially from RS3 to RS4 stages, are in line with the 10–20% soluble solid requirement for ripe mangoes [35], suitable for juice processing [36,37].
The mangoes exhibited significant differences in TS content during the ripening stages. The percentage of NRS in the four different mango pulps was much higher than that of RS throughout the ripening stages, and a sudden increase was observed in RS3 and RS4, while the percentage of RS was not significantly increased. It is possible that sucrose, an NRS, could be the major sugar in all four mango cultivars during the ripening stages; these findings were relevant to other mango cultivars such as ‘Keitt’ mangoes and ‘Ashwina’ hybrid mangoes, in which the amount of NRS was higher than that of RS [13,38]. The sugar/acid ratio is an essential indicator in fruit quality assessment and consumer acceptance, and the higher the sugar/acid ratio, the sweeter the fruit. Interestingly, the highest sugar/acid ratio was observed in ‘STL’ (135.27 ± 14.88) showing its excellent fruit quality among the cultivars. It has been widely reported that the typical sugar/acid ratio values for high-quality mango fruits range between 23 and 50 [38], and all four selected mango cultivars could be assumed to be high-quality mangoes.
In general, when the maturity of fruits increases, the antioxidant capacity and phenol content of the fruit mesocarp increases provided the fruits are not injured by pathogens or mechanical damage [1,3]. In this study, the TPC of the four mango cultivars from RS1 to RS4 ranged from 8.20 ton14.96 mg GAE per 100 g of extract. These results are different from those obtained by Rumainum et al. [8], in which the TPC in six Thai mango cultivars was between 7.9 and 21.8 mg/100 g dry weight. Likewise, Egyptian mango showed TPC in a range of 19.52 to 26.59 mg GAE per 100 g FW [39]. Ma et al. [4] described that the TPC in eight mango cultivars ranged from 8.8 to 193 mg GAE per 100 g FW. Previous studies have reported that the TPC in mango flesh ranges from 48 to 209 mg GAE per 100 g FW [1,3]. Differences in TPC concentrations between the cultivars and those studied in other works could be due to the differences in cultivars, growing conditions, ripening stages, and extraction methods [2,3,6]. Although there was a gradual increase from RS1 to RS3 during storage, a slight decline in the TPC was found in the last ripening stage, RS4, of ‘STL’, ‘MCS’, and ‘HT’, whereas ‘YK’ remained unchanged. These results were in good agreement with the findings of Palafox-Carlos et al. [3], in which the TPC of the mango ‘Ataulfo’ tended to decrease at the time of transition from RS3 to RS4. The decline in TPC could be associated with the loss of acid (mainly ascorbic and malic acids) during mango fruit respiration [3]. In contrast, Ibarra-Garza et al. [37] observed that the TPC of the mango ‘Keitt’ reached its peak at RS2 and then returned to its original level, suggesting that characterization of TPC in climacteric fruits, such as mango, depends on ethylene biosynthesis and respiratory processes during fruit ripening.
In this study, DPPH radical-scavenging activities were not significantly different in the cultivars except ‘HT’, which had the highest activity. However, during the ripening stages, slightly or significantly variation of the activities was observed in the cultivars except ‘HT’. The results indicated that presence of DPPH activates varied depending on the cultivars and their ripening stages. Liu et al. [6] also reported a great variation of DPPH radical-scavenging activity among four mango cultivars. Moreover, Palafox-Carlos [3] and Ediriweera [2] also observed that the differences in the levels of total antioxidant activity among mango cultivars mainly depend on their genotypic differences, physiological maturity stages and processes during fruit ripening. Mango can be considered as a good source of vitamins, minerals, organic acids total polyphenols, and dietary antioxidants, which contain different beneficial health-promoting properties [4]. Extracts of mango peel and flesh protect humans from cardiovascular diseases and some types of cancers such as prostate, breast and colon cancers by reducing oxidative stress caused by hydrogen peroxide induction [40,41,42]. Therefore, consumption of a mango with rich nutritional and phytochemical compounds such as ‘HT’ cultivar could provide the consumers with desirable nutrition and health benefits in their diet.

5. Conclusions

The present study demonstrated that different cultivars presented different features on physical, biochemical, total phenolic and antioxidant activities during ripening. We discovered that ‘HT’ was the richest in phytochemical compounds and ‘STL’ showed the highest sugar/acid ratio and consumer acceptability with the maximum SQ scores due to its unique characteristics. All cultivars can be assumed as good quality mangoes because their TSS/TA was in a range between 23 and 50, which is recorded as the range of typical sugar/acid ratios for high quality mangoes.

Author Contributions

Conceptualization, M.S.K. and A.H.N.; software, M.S.K. and S.T.; data curation, M.S.K., S.T., H.T.P.H. and C.M.N.; formal analysis, M.S.K.; investigation, M.S.K., S.T., M.M.M., K.P.W. and H.T.P.H.; methodology, M.S.K., C.M.N. and J.-S.H.; project administration, M.S.K. and S.T.; supervision, A.H.N. and M.S.K.; funding acquisition, M.S.K.; writing—original draft, M.S.K.; writing—review and editing, M.S.K. and A.H.N. All authors have read and agreed to the published version of the manuscript.

Funding

Financial support for this research was provided by Biotechnology Research Department (BRD), Ministry of Education, Kyaukse, Myanmar.

Institutional Review Board Statement

Not applicable.

Informed Consent Statement

Not applicable.

Data Availability Statement

Data are available upon request.

Acknowledgments

The authors would like to express their sincere gratitude to all members of the Molecular Genetics Laboratory and Pharmaceutical Research Laboratory, BRD, Kyaukse District, for their kind assistance and support.

Conflicts of Interest

The authors declare no conflict of interest.

References

  1. Kim, Y.; Lounds-Singleton, A.J.; Talcott, S.T. Antioxidant phytochemical and quality changes associated with hot water immersion treatment of mangoes (Mangifera indica L.). Food Chem. 2009, 115, 989–993. [Google Scholar] [CrossRef]
  2. Ediriweera, M.K.; Tennekoon, K.H.; Samarakoon, S.R. A review on ethnophamacological applications, pharmacological activities and bioactive compounds of mango (Mangifera indica L.). Evid. Based Complementary Altern. Med. 2017, 2017, 6949835. [Google Scholar] [CrossRef] [PubMed] [Green Version]
  3. Palafox-Carlos, H.; Yahia, E.M.; Islas-Osuna, M.; Gutierrez-Martinez, P.; Robles-Sánchez, M.; González-Aguilar, G. Effect of ripeness stage of mango fruit (Mangifera indica L., cv. ‘Ataulfo’) on physiological parameters and antioxidant activity. Sci. Hortic. 2012, 135, 7–13. [Google Scholar] [CrossRef]
  4. Ma, X.; Wu, H.; Liu, L.; Yao, Q.; Wang, S.; Zhan, R.; Xing, S.; Zhou, Y. Polyphenolic compounds and antioxidant properties in mango fruits. Sci. Hortic. 2011, 129, 102–107. [Google Scholar] [CrossRef]
  5. Manthey, J.; Perkins-Veazie, P. Influences of harvest date and location on the levels of carotene, ascorbic acid, total phenols, the in vitro antioxidant capacity, and phenolic profiles of five commercial varieties of mango (Mangifera indica L.). J. Agric. Food Chem. 2009, 57, 10825–10830. [Google Scholar] [CrossRef] [PubMed]
  6. Liu, F.X.; Fu, X.F.; Chen, F.; Liao, X.J.; Hu, X.S.; Wu, J.H. Physico-chemical and antioxidant properties of four mango (Mangifera indica L.) cultivars in China. Food Chem. 2013, 138, 396–405. [Google Scholar] [CrossRef] [PubMed]
  7. Vásquez-Caicedo, A.L.; Neidhart, S.; Carle, R. Postharvest ripening behavior of nine Thai mango cultivars and their suitability for industrial application. Acta Hort. 2004, 645, 617–625. [Google Scholar] [CrossRef]
  8. Rumainum, I.M.; Worarad, K.; Srilaong, V.; Yamane, K. Fruit quality and antioxidant capacity of six Thai mango cultivars. Agric. Nat. Resourc. 2018, 52, 208–214. [Google Scholar] [CrossRef]
  9. Abbasi, A.M.; Guo, X.; Fu, X.; Zhou, L.; Chen, Y.; Zhu, Y.; Yan, H.; Liu, R.H. Comparative assessment of phenolic content and in vitro antioxidant capacity in the pulp and peel of mango cultivars. Inter. J. Mol. Sci. 2015, 16, 13507–13527. [Google Scholar] [CrossRef] [Green Version]
  10. Gill, P.P.S.; Jawandha, S.K.; Kaur, N.; Singh, N. Physicochemical changes during progressive ripening of mango (Mangifera indica L.) cv. Dashehari under different temperature regimes. J. Food Sci. Tech. 2017, 54, 1–7. [Google Scholar] [CrossRef]
  11. Herianus, J.D.; Singh, L.Z.; Tan, S.C. Aroma volatiles production during fruit ripening of Kensington Pride mango. Postharvest Biol. Technol. 2003, 27, 323–336. [Google Scholar]
  12. Nassur, R.C.; González-Moscoso, S.; Crisosto, G.M.; Lima, L.C.; Vilas Boas, E.V.; Crisosto, C.H. Describing quality and sensory attributes of 3 mango (Mangifera indica L.) cultivars at 3 ripeness stages based on firmness. J. Food Sci. 2015, 80, S2055–S2063. [Google Scholar] [CrossRef] [PubMed]
  13. Hossain, M.A.; Rana, M.M.; Kimura, Y.; Roslan, H.A. Changes in biochemical characteristics and activities of ripening associated enzymes in mango fruit during the storage at different temperatures. BioMed. Res. Int. 2014, 2014, 232969. [Google Scholar] [CrossRef] [PubMed] [Green Version]
  14. Wongmetha, O.; Ke, L.; Liang, Y. The changes in physical, biochemical, physiological characteristics and enzyme activities of mango cv. Jinhwang during fruit growth and development. J. Life Sci. 2015, 72–73, 1–6. [Google Scholar]
  15. Saltveit, M.E. Effect of ethylene on quality of fresh fruits and vegetables. Postharv. Biol. Technol. 1999, 15, 279–292. [Google Scholar] [CrossRef]
  16. Tucker, G.A.; Grierson, D. Fruit ripening. In The Biochemistry of Plants; Daries, D., Ed.; Academic Press: New York, NY, USA, 1987; pp. 265–319. [Google Scholar]
  17. Jha, S.N.; Jaiswal, P.; Narsaiah, K.; Singh, A.K.; Kaur, P.P.; Sharma, R.; Kumar, R.; Bhardwaj, R. Prediction of sensory profile of mango using textural attributes during ripening. Food Bioprocess. Technol. 2013, 6, 734–745. [Google Scholar] [CrossRef]
  18. De Candolle, A.P. Origin of Cultivated Plants. In Mango: Botany, Production and Uses, 2nd ed.; CAB International: Wallingford, UK, 1904; pp. 5–7. [Google Scholar]
  19. Naing, W. Effects of modified atmosphere packing (MAP) with and without chemicals on postharvest characteristics of mango (Mangifera indica L.) cv. Sein Ta Lone. Master’s Thesis, Yezin Agricultural University, Nay Pyi Taw, Myanmar, 2003. [Google Scholar]
  20. Myanmar Agriculture Statistics. 2021. Available online: www.csostat.gov.mm/PublicationAndRelease/MyanAgriculture (accessed on 21 April 2021).
  21. Yi, P.P.; Soe, T.T.; Yamamoto, Y.; Myint, K.T. Influences of different storage conditions on postharvest quality of mango (Mangifera indica L. cv. Sein Ta Lone). Adv. Nutri. Food Sci. 2019. [Google Scholar]
  22. Lim, J. Hedonic scaling: A review of methods and theory. Food Qual. Prefer. 2011, 22, 733–747. [Google Scholar] [CrossRef]
  23. Salunkhe, D.K.; Desai, B.B. Post Harvest Biotechnology of Fruit; CRC Press, Inc.: Boca Raton, FL, USA, 1984; Volume 1, pp. 77–94. [Google Scholar]
  24. Jayaraman, J. Laboratory Manual in Biochemistry, 1st ed.; Wiley Eastern: New Delhi, India, 1981; p. 138. [Google Scholar]
  25. Miller, G.L. Use of dinitrosalicylic acid reagent for determination of reducing sugar. Anal. Chem. 1959, 31, 426–428. [Google Scholar] [CrossRef]
  26. Blois, M. Antioxidant determinations by the use of a stable free radical. Nature 1958, 181, 1199–1200. [Google Scholar] [CrossRef]
  27. Stanković, M.S. Total phenolic content, flavonoid concentration and antioxidant activity of Marrubium peregrinum L. extracts. Kragujev. J. Sci. 2011, 33, 63–72. [Google Scholar]
  28. Ornelas-Paz, J.J.; Yahia, E.M.; Gardea, A.A. Changes in external and internal color during postharvest ripening of Manila and Ataulfo mango fruit and relationship with carotenoid content determined by liquid chromatography-APcI+-time-of-flight mass spectrometry. Postharvest Biol. Technol. 2008, 50, 145–152. [Google Scholar] [CrossRef]
  29. Win, N.M.; Yoo, J.G.; Naing, A.H.; Kwon, J.G.; Kang, I. 1-Methylcyclopropene (1-MCP) treatment delays modifcation of cell wall pectin and fruit softening in “Hwangok” and “Picnic” apples during cold storage. Postharvest Biol. Technol. 2021, 180, 111599. [Google Scholar] [CrossRef]
  30. Li, R.; Ma, J.; Gu, H.; Jia, W.; Shao, Y.; Li, W. 1-Methylcyclopropene counteracts ethylene promotion of fruit softening and roles of MiERF2/8 and MiPG in postharvest mangoes. Front. Plant Sci. 2022, 13, 971050. [Google Scholar] [CrossRef] [PubMed]
  31. Li, L.; Shuai, L.; Sun, J.; Li, C.; Yi, P.; Zhou, Z.; He, X.; Ling, D.; Sheng, J.; Kong, K.W.; et al. The Role of 1-Methylcyclopropene in the regulation of ethylene biosynthesis and ethylene receptor gene expression in Mangifera indica L. (Mango Fruit). Food Sci. Nutr. 2020, 8, 1284–1294. [Google Scholar] [CrossRef] [PubMed] [Green Version]
  32. Padda, M.S.; do Amarante, C.V.; Garcia, R.M.; Slaughter, D.C.; Mitcham, E.J. Methods to analyse physico-chemical changes during mango ripening: A multivariate approach. Postharvest Biol. Technol. 2011, 62, 267–274. [Google Scholar] [CrossRef]
  33. Lawson, T.; Lycett, G.W.; Ali, A.; Chin, C.F. Characterization of Southeast Asia mangoes (Mangifera indica L.) according to their physicochemical attributes. Sci. Hortic. 2019, 243, 189–196. [Google Scholar] [CrossRef]
  34. Espitia, P.J.P.; Soares, N.F.F.; Botti, L.C.M.; Melo, N.R.; Pereira, O.L.; Silva, W.A. Assessment of the efficiency of essential oils in the preservation of postharvest papaya in an antimicrobial packaging system. Braz. J. Food Technol. 2012, 15, 333–342. [Google Scholar] [CrossRef] [Green Version]
  35. Yahia, E.M. Mango (Mangifera indica L.). In Postharvest Biology and Technology of Tropical and Subtropical Fruit: Cocona to Mango; Yahia, E.M., Ed.; Woodhead Publishing Limited: Sawston, UK, 2011; pp. 492–586. [Google Scholar]
  36. Grassin, C.; Coutel, Y. Enzymes in fruit and vegetable processing and juice extraction. In Enzymes in Food Technology; Whitehurst, R.J., van Oort, M., Eds.; Wiley-Blackwell: Ames, IA, USA, 2009; pp. 236–263. [Google Scholar]
  37. Ibarra-Garza, I.P.; Ramos-Parra, P.A.; Hernández-Brenes, C.; Jacobo-Velázquez, D.A. Effects of postharvest ripening on the nutraceutical and physicochemical properties of mango (Mangifera indica L. cv ‘Keitt’). Postharvest Biol. Technol. 2015, 103, 45–54. [Google Scholar] [CrossRef]
  38. Medlicott, A.P.; Thompson, A.K. Analysis of sugars and organic acids in ripening of mango fruit (Mangifera indica L. var Keitt) by high-performance liquid chromatography. J. Sci. Food Agric. 1985, 36, 561–566. [Google Scholar] [CrossRef]
  39. Nyangena, I.O.; Owino, W.O.; Imathiu, S.; Ambuko, J. Effect of pretreatments prior to drying on antioxidant properties of dried mango slices. Sci. Afr. 2019, 6, e00148. [Google Scholar] [CrossRef]
  40. Yahia, E. The contribution of fruit and vegetable consumption to human health. In Fruit and Vegetable Phytochemicals: Chemistry, Nutritional Value and Stability; De La Rosa, L.A., Alvarez-Parrilla, E., Gonzalez-Aguilar, G.A., Eds.; Wiley-Blackwell: Hoboken, NJ, USA, 2010; pp. 3–51. [Google Scholar]
  41. Vásquez-Caicedo, A.L.; Sruamsiri, P.; Carle, R.; Neidhart, S. Accumulation of all-trans-β-Carotene and its 9-cis and 13-cis Stereoisomers during postharvest ripening of nine Thai mango cultivars. J. Agric. Food Chem. 2005, 53, 4827–4835. [Google Scholar] [CrossRef] [PubMed]
  42. Kim, H.; Moon, J.Y.; Kim, H.J.; Lee, D.S.; Cho, M.; Choi, H.K.; Kim, Y.S.; Mosaddik, A.; Cho, S.K. Antioxidant and antiproliferative activities of mango (Mangifera indica L.) flesh and peel. Food Chem. 2010, 121, 429–436. [Google Scholar] [CrossRef]
Figure 1. The changes in fruit skin color, flesh color, and appearance of four mango cultivars [(A)’ Sein Ta Lone’, (B) ‘Ma Chit Su’, (C) ‘Hin Thar’, and (D) ‘Yin Kwae’] during four different ripening stages (RS1, RS2, RS3, RS4).
Ijpb 14 00002 g001
Figure 2. Weight loss (%) in the four mango cultivars [‘Sein Ta Lone’ (STL), ‘Ma Chit Su’ (MCS), ‘Hin Thar’ (HT), and ‘Yin Kwae’ (YK)] during ripening stages. Significant difference at p < 0.05 was calculated using SPSS version 16.0 Tukey’s test. Data are shown as mean ± standard error (SE).
Ijpb 14 00002 g002
Figure 3. Changes of sensory qualities in the four mango cultivars [‘Sein Ta Lone’ (STL), ‘Ma Chit Su’ (MCS), ‘Hin Thar’ (HT), and ‘Yin Kwae’ (YK)] during ripening. Significant difference at p < 0.05 was calculated using SPSS version 16.0 Tukey’s test. Data are shown as mean ± standard error (SE).
Ijpb 14 00002 g003
Figure 4. Changes of total soluble solids (TSS%) and titratable acidity (TA%) in the four mango cultivars [‘Sein Ta Lone’ (STL), ‘Ma Chit Su’ (MCS), ‘Hin Thar’ (HT), and ‘Yin Kwae’ (YK)] during ripening. Significant difference at p < 0.05 was calculated using SPSS version 16.0 Tukey’s test. Data are shown as mean ± standard error (SE).
Ijpb 14 00002 g004aIjpb 14 00002 g004b
Figure 5. Changes of sugar/acid ratio in the four mango cultivars [‘Sein Ta Lone’ (STL), ‘Ma Chit Su’ (MCS), ‘Hin Thar’ (HT), and ‘Yin Kwae’ (YK)] during ripening. Significant difference at p < 0.05 was calculated using SPSS version 16.0 Tukey’s test. Data are shown as mean ± standard error (SE). Means with the same letters are not significantly different at p < 0.05.
Ijpb 14 00002 g005
Figure 6. Changes of total phenolic content (TPC) in the four mango cultivars [‘Sein Ta Lone’ (STL), ‘Ma Chit Su’ (MCS), ‘Hin Thar’ (HT), and ‘Yin Kwae’ (YK)] during ripening. Significant difference at p < 0.05 was calculated using SPSS version 16.0 Tukey’s test. Data are shown as mean ± standard error (SE). Means with the same letters are not significantly different at p < 0.05. TPC is expressed as milligrams of gallic acid equivalent (GAE) per 100 g of fruit extract.
Ijpb 14 00002 g006
Figure 7. Free radical scavenging assay for 2,2-diphenyl-1-picryl-hydrazyl (DPPH) radicals that expressed as Vitamin C Equivalent Antioxidant Capacity (VEAC) mg ascorbic acid per 100 g of extract in the four mango cultivars [‘Sein Ta Lone’ (STL), ‘Ma Chit Su’ (MCS), ‘Hin Thar’ (HT), and ‘Yin Kwae’ (YK)] during ripening. Significant difference at p < 0.05 was calculated using SPSS version 16.0 Tukey’s test. Data are shown as mean ± standard error (SE). Means with the same letters are not significantly different at p < 0.05. IC 50 (µg/mL) of Ascorbic Acid (positive control) was 102.73 µg/mL.
Ijpb 14 00002 g007
Table 1. Fruit morphology traits of the four mango cultivars.
CultivarsFresh Weight (g)Length (cm)Diameter (cm)Visual Peel Color *Visual Pulp Color *
Sein Ta Lone301.15 ± 9.8c13.66 ± 0.3c10.66 ± 0.3bGolden yellowGolden yellow
Ma Chit Su357.33 ± 12.1b15.83 ± 0.6b12.33 ± 0.6aGreenish YellowGolden yellow
Hin Thar435 ± 15.0a18.1 ± 0.8a12.16 ± 0.3aYellowYellow
Yin Kwae331.66 ± 16.3bc15.46 ± 0.2b11.5 ± 0.5abGolden yellowGolden yellow
Significant difference was calculated using SPSS version 16.0 Tukey’s test. Data are shown as mean ± standard error (SE), (n = 10). * indicates the color at the mature ripened stage. Means with the same letters are not significantly different at p < 0.05.
Table 2. Changes of total sugar (TS) % and initial pH in pulps of the four mango cultivars [‘Sein Ta Lone’ (STL), ‘Ma Chit Su’ (MCS), ‘Hin Thar’ (HT), and ‘Yin Kwae’ (YK)] during ripening.
Total Sugar %Initial pH
RS‘STL’‘MCS’‘HT’‘YK’‘STL’‘MCS’‘HT’‘YK’
RS16.85 ± 0.1g4.87 ± 0.1h4.89 ± 0.5h4.83 ± 0.4h3.93 ± 0.1g3.65 ± 0.1ghi3.76 ± 0.4gh3.32 ± 0.7i
RS27.87 ± 0.3fg7.29 ± 0.3fg6.52 ± 0.2g9.53 ± 1.0e4.75 ± 0.1de3.86 ± 0.1gh3.92 ± 0.2g3.49 ± 0.1hi
RS312.73 ± 0.3c13.48 ± 0.6bc8.62 ± 0.2ef11.15 ± 1.0d5.55 ± 0.2b4.34 ± 0.2f4.70 ± 0.1def3.83 ± 0.2gh
RS418.15 ± 0.1a16.81 ± 0.7a13.62 ± 0.6c14.62 ± 0.3b6.16 ± 0.0a5.01 ± 0.3cd5.22 ± 0.1bc4.54 ± 0.2ef
Significant difference at p < 0.05 was calculated using SPSS version 16.0 Tukey’s test. Data are shown as mean ± standard error (SE). Means with the same letters are not significantly different at p < 0.05.
Table 3. Changes of reducing sugar (RS) % and non-reducing sugar (NRS) % in pulps of the four mango cultivars [‘Sein Ta Lone’ (STL), ‘Ma Chit Su’ (MCS), ‘Hin Thar’ (HT), and ‘Yin Kwae’ (YK)] during ripening stage (RS).
Reducing Sugar %Non-Reducing Sugar %
RS‘STL’‘MCS’‘HT’‘YK’‘STL’‘MCS’‘HT’‘YK’
RS12.47 ± 0.2ef2.43 ± 0.2ef2.01 ± 0.1f2.73 ± 0.1def4.38 ± 0.0de2.44 ± 0.2fg2.88 ± 0.5efg2.11 ± 0.2g
RS22.83 ± 0.1de3.24 ± 0.0cd2.09 ± 0.1f3.83 ± 0.2bc5.04 ± 0.2cd4.05 ± 0.3def4.43 ± 0.2de5.71 ± 1.1cd
RS33.23 ± 0.2cd3.94 ± 0.1bc2.45 ± 0.1ef4.46 ± 0.2ab9.5 ± 0.2b9.54 ± 0.6b6.17 ± 0.1c6.67 ± 0.7c
RS44.52 ± 0.2ab4.75 ± 0.1a3.09 ± 0.2de4.69 ± 0.8a13.63 ± 0.2a12.02 ± 0.6a9.52 ± 0.8b9.94 ± 1.1b
Significant difference at p < 0.05 was calculated using SPSS version 16.0 Tukey’s test. Data are shown as mean ± standard error (SE). Means with the same letters are not significantly different at p < 0.05.
Disclaimer/Publisher’s Note: The statements, opinions and data contained in all publications are solely those of the individual author(s) and contributor(s) and not of MDPI and/or the editor(s). MDPI and/or the editor(s) disclaim responsibility for any injury to people or property resulting from any ideas, methods, instructions or products referred to in the content.

