Article

The Response of Sugar Beet (Beta vulgaris L.) Genotypes at Different Ploidy Levels to Salt (NaCl) Stress

1
Graduate School of Natural and Applied Sciences, Ankara University, Ankara 06110, Türkiye
2
Laboratory of Biochemistry, Faculty of Agriculture, Niigata University, Niigata 950-2181, Japan
3
Department of Field Crops, Faculty of Agriculture, Ankara University, Ankara 06110, Türkiye
*
Authors to whom correspondence should be addressed.
Int. J. Plant Biol. 2023, 14(1), 199-217; https://doi.org/10.3390/ijpb14010017
Submission received: 14 December 2022 / Revised: 10 January 2023 / Accepted: 21 January 2023 / Published: 30 January 2023
(This article belongs to the Topic Tolerance to Drought and Salt Stress in Plants)
(This article belongs to the Section Plant Response to Stresses)

Abstract

:
Sugar beet (Beta vulgaris L.) is cultivated in temperate climates worldwide to produce sugar. The production of sugar beet and other plants is in danger due to the world’s increasingly salinized soils. Although different sugar beet genotypes exist at various ploidy levels, most of them are diploid (2X) with 18 chromosomes. The majority of polyploid plants have different variations, morphologies, and anatomy. Diploid and polyploid plants especially have different morphology, physiology, cellularity, and biochemistry. As a result, polyploidy has been identified as an essential component in determining plant salt tolerance. To evaluate the effects of salt (NaCl) stress on sugar beet genotypes, diploid (2X), triploid (3X), and tetraploid (4X) genotypes were exposed to 0 (control), 50, and 150 mM NaCl concentrations for seven weeks. Under control conditions, the diploid (2X) genotype showed higher growth performance compared to the tetraploid (4X) and triploid (3X) genotypes, respectively. Regarding germination and early-stage growth performance, a reduction of about 50% was observed in the diploid (2X) genotype under salt stress compared to the control condition. The diploid (2X) genotype showed higher germination, a greater salt tolerance index, and better seedling growth performance than the other ploidy levels. Late-stage growth, leaf length, leaf width, leaf area, cytological findings, and total chlorophyll content were all shown to be higher and less reduced (around 30%) under salt stress in diploid (2X) genotypes. Even though all of the findings in this study showed a decrease when plants were exposed to salt (NaCl), the diploid (2X) ploidy level plants displayed more robust growth and development than the triploid (3X) and tetraploid (4X) genotypes.

1. Introduction

Soil salinity is a significant adverse environmental issue that reduces crop yields globally and threatens over 833 million hectares of arable land [1]. According to current forecasts, roughly 690 million people (11% of the global population) suffer from hunger, and food demand is anticipated to rise by 85% (nearly 2.7 billion people) by 2050 [2,3]. To increase plant salt tolerance, agricultural production and food security must be improved. This will also lessen the potentially heavy burden on the planet’s natural resources [4]. Natural salinity occurs in arid and semi-arid regions with limited rainfall and high evaporation. Poor water quality, excessive soluble salts in irrigation water, inadequate drainage, and salt accumulation in the root zone are the leading causes of soil salinity [5]. Other contributing factors include the transport of salts as groundwater levels rise, the transport of salts to the soil surface as groundwater levels rise, and the accumulation of soluble salts in soil layers and groundwater [6]. Two primary stresses must deal with plants when they are subjected to salt stress [7]. Osmotic stress is the first stage of salt stress, and dissolved Na+ and Cl trigger ions that decrease the soil water potential in plant tissue [8]. Ionized Na+ and Cl ions disturb the Na+/K+ ratio in plant cells, resulting in ionic stress (the latter stage of salt stress) [9]. This complex interaction of hyperosmotic and hypersonic stressors has substantial consequences on plant life, affecting seed germination, reproduction, and seed texture. Numerous biochemical and physiological responses occur under salt stress, including slowing rates of respiration and photosynthesis, leaf expansion, stoma closure, and decreased biomass [4,7,10].
Ploidy is thought to be essential for plant evolution and reproduction, allows for higher adaptability to difficult environmental circumstances, and improves the functionality of genetic variations and resistance genes [11,12,13]. Genome duplication has been found to improve rice resistance to salt stress [14], whereas citrus tetraploid genotypes are more tolerant of moderate saline stress than diploids [11]. Barkla et al. [15] discovered that salt treatment increased ploidy levels considerably in the epidermal bladder cells of a halophyte known as the common ice plant (Mesembryanthemum crystallinum), suggesting that the relationship between ploidy level and salinity tolerance is reciprocal.
Higher ploidy cells have larger vacuoles [16], which are essential for regulating the osmotic pressure inside the cell [17]. According to Tal and Gardi [18], the high osmotic pressure of polyploid plant cells may lead to higher tissue metabolic activity by enabling more water absorption from the environment. As the ploidy level increases, more giant cells with quicker growth rates are generated [16]. According to Warner and Edwards [19], the number of chromosomes affects the diameter of the leaf cell. As the number of chromosomes increases, so does the amount of DNA in the cell, its enzymes’ activity, and the cell’s volume [20,21]. It has been found that polyploidy affects physiological processes or gene expression in plant species such as maize (Zea mays), potato (Solanum phureja), wheat (Triticum aestivum), and empress tree (Paulownia australis) [22,23]. Polyploidy is an essential component in determining a plant’s ability to handle salt [13,24]. Plants that have doubled genomes (polyploids) have improved salt stress resistance due to higher K+ accumulation [25]. Polyploid wheat has been examined in the form of cereals under salt-stress conditions. A germplasm collection was tested under salt-stress conditions. The endemic hexaploid known as winter wheat (Triticum macha) and the endemic tetraploid wheat (Triticum timopheevii) were found to be the most resilient to salinity stress [26].
Sugar beet production, which is more salt-resistant than other plants, is also threatened by rising salinity levels worldwide [27,28]. In temperate regions, sugar beet is grown to supply 21% of the world’s sugar demand. Conventional breeding techniques have been merged with cutting-edge in vitro culture and gene-transfer technology to create sugar beet cultivars that can survive salt. However, genotype adherence, a lack of regeneration, and the frequency of gene transfer severely limit research on sugar beet transformation and in vitro culture [11,12,13]. In this study, the morphological, physiological, and cytological responses of sugar beet (Beta vulgaris L.) genotypes at various diploid (2X), triploid (3X), and tetraploid (4X) ploidy levels to salt stress were studied.

2. Materials and Methods

2.1. Plant Material

In the study, seeds of diploid (2X, “Felicita”), triploid (3X, “Kassandra”), and tetraploid (4X, “AD-440”) sugar beet (Beta vulgaris L.) genotypes were used. All genotypes were obtained from the Turkish Sugar Factories, Sugar Research Institute, Etimesgut, Ankara, Türkiye. Seeds were incubated with distilled water at 130 rpm for 24 h in a shaker to facilitate germination and remove germination inhibitors from the seed coats [29].

2.2. Experimental Design

The salinity tolerance response of different ploidy levels (2X, 3X, and 4X) of sugar beet seedlings were tested in germination, seedling, and vegetative stages. Germination assays were carried out on batches of 100 seeds placed in 9 cm Petri dishes (20 seeds per dish, five replicates) on a layer of cotton wool moistened with distilled water [30]. Assays were carried out in darkness at 25 ± 1 °C, and germination scores were recorded on day four under 0 (control), 50, and 150 mM salinity (NaCl) stress conditions.
Germinated seeds were transplanted into 500 mL pots that included 500 g peat as a growing medium; peat has a low volume, high water capacity, and high organic matter content. Experiments were carried out in a growth chamber that provided 70% humidity, a 16-h light (630 µmol m−2 s−1)/8-h dark photoperiod, and 25/23 °C light/dark cycles for seven weeks. The salt stress (NaCl) was applied from germination for seven weeks as 0 (control), 50, and 150 mM NaCl were applied to each ploidy level. Shoot, height, and root length were recorded at the seedling (14-day-old plants) stage. For the vegetative stage, 42-day-old plants were selected, and seedling height, root length, leaf length, width, and approx. leaf area, plant fresh and dry weights (dried at 75 °C), tissue water content, and total chlorophyll content were recorded. The salt tolerance index (STI) is the ratio of the total fresh weight of the control (0 mM NaCl) seedling to the fresh weight of the salt-stressed (50 and 150 mM NaCl) seedling. The STI was calculated according to [13] with the formula below.
STI = (Total FW of salt-stressed seedling/Total FW of control seedling) × 100
Total chlorophyll content was determined according to work of Curtis and Shetty [31]. Fresh leaf material (50 mg) was treated with 1.5 mL of methanol for two hours in the dark at 23 °C. The absorbances were read at 650 and 665 nm using a UVmini-1240 spectrophotometer (Shimadzu, Kyoto, Japan).

2.3. Measurement of Na+ and K+ Contents

Concentrations of sodium and potassium ions were determined by a wet digestion method protocol [32]. Dried, finely powdered plant samples (50 mg) were digested in HNO3-HClO4 (4:1) and filled with distilled water to the final volume of 50 mL. The digested solution was filtered through 0.2-µm filters (Whatman, Maidstone, UK), and the solid fraction was discarded. The contents of Na+ and K+ in the extract were measured by the PFP7 flame photometer (Jenway, Cambridgeshire, UK).

2.4. Cytological Observations

Thin sections were taken with a scalpel from the upper epidermis layer of leaves in 42-day-old seedlings (vegetative stage). The number of cells, length, width, and approximate cell area were observed under an optical light microscope (Olympus, CX41, Tokyo, Japan) with a micrometer (µm). The number of stomata was counted in the 20 × 20 pane of the micrometer with five places for every leaf, and the mean stoma density per square millimeter was calculated. The stoma size was observed under a 10 × 40 magnification microscope, and the width and length of 10 stomata were measured for every leaf, and then the means were calculated. The results were analyzed by the mean stoma density and size of 10 individuals for every plot [33].

2.5. Statistical Analysis

The data were subjected to a two-way analysis of variance (ANOVA) using R software (V3.6.1, https://www.r-project.org) to assess differences among treatments. Means separation was determined using Tukey’s honestly significant difference (HSD) test at p < 0.05 with R software, including the “glht” function in the “multcomp” package [34]. All the traits under each treatment were combined and used as index values for PCA analysis. These index values were used to identify the correlation of response variable vectors and comparisons across the ordination space. Two-way heatmap clustering analysis (HCA) was performed on the same dataset as PCA analysis. Pearson correlation was used as a correlation-based distance method. The “euclidean algorithm” was used to compute the dissimilarity matrix. PCA and HCA were created using the RStudio Version 2022.02.04 software, including the “prcomp” function in the “factoextra” package [35]. Data were hierarchically clustered using the heatmap function in the “pheatmap” package with RStudio software [36].

3. Results

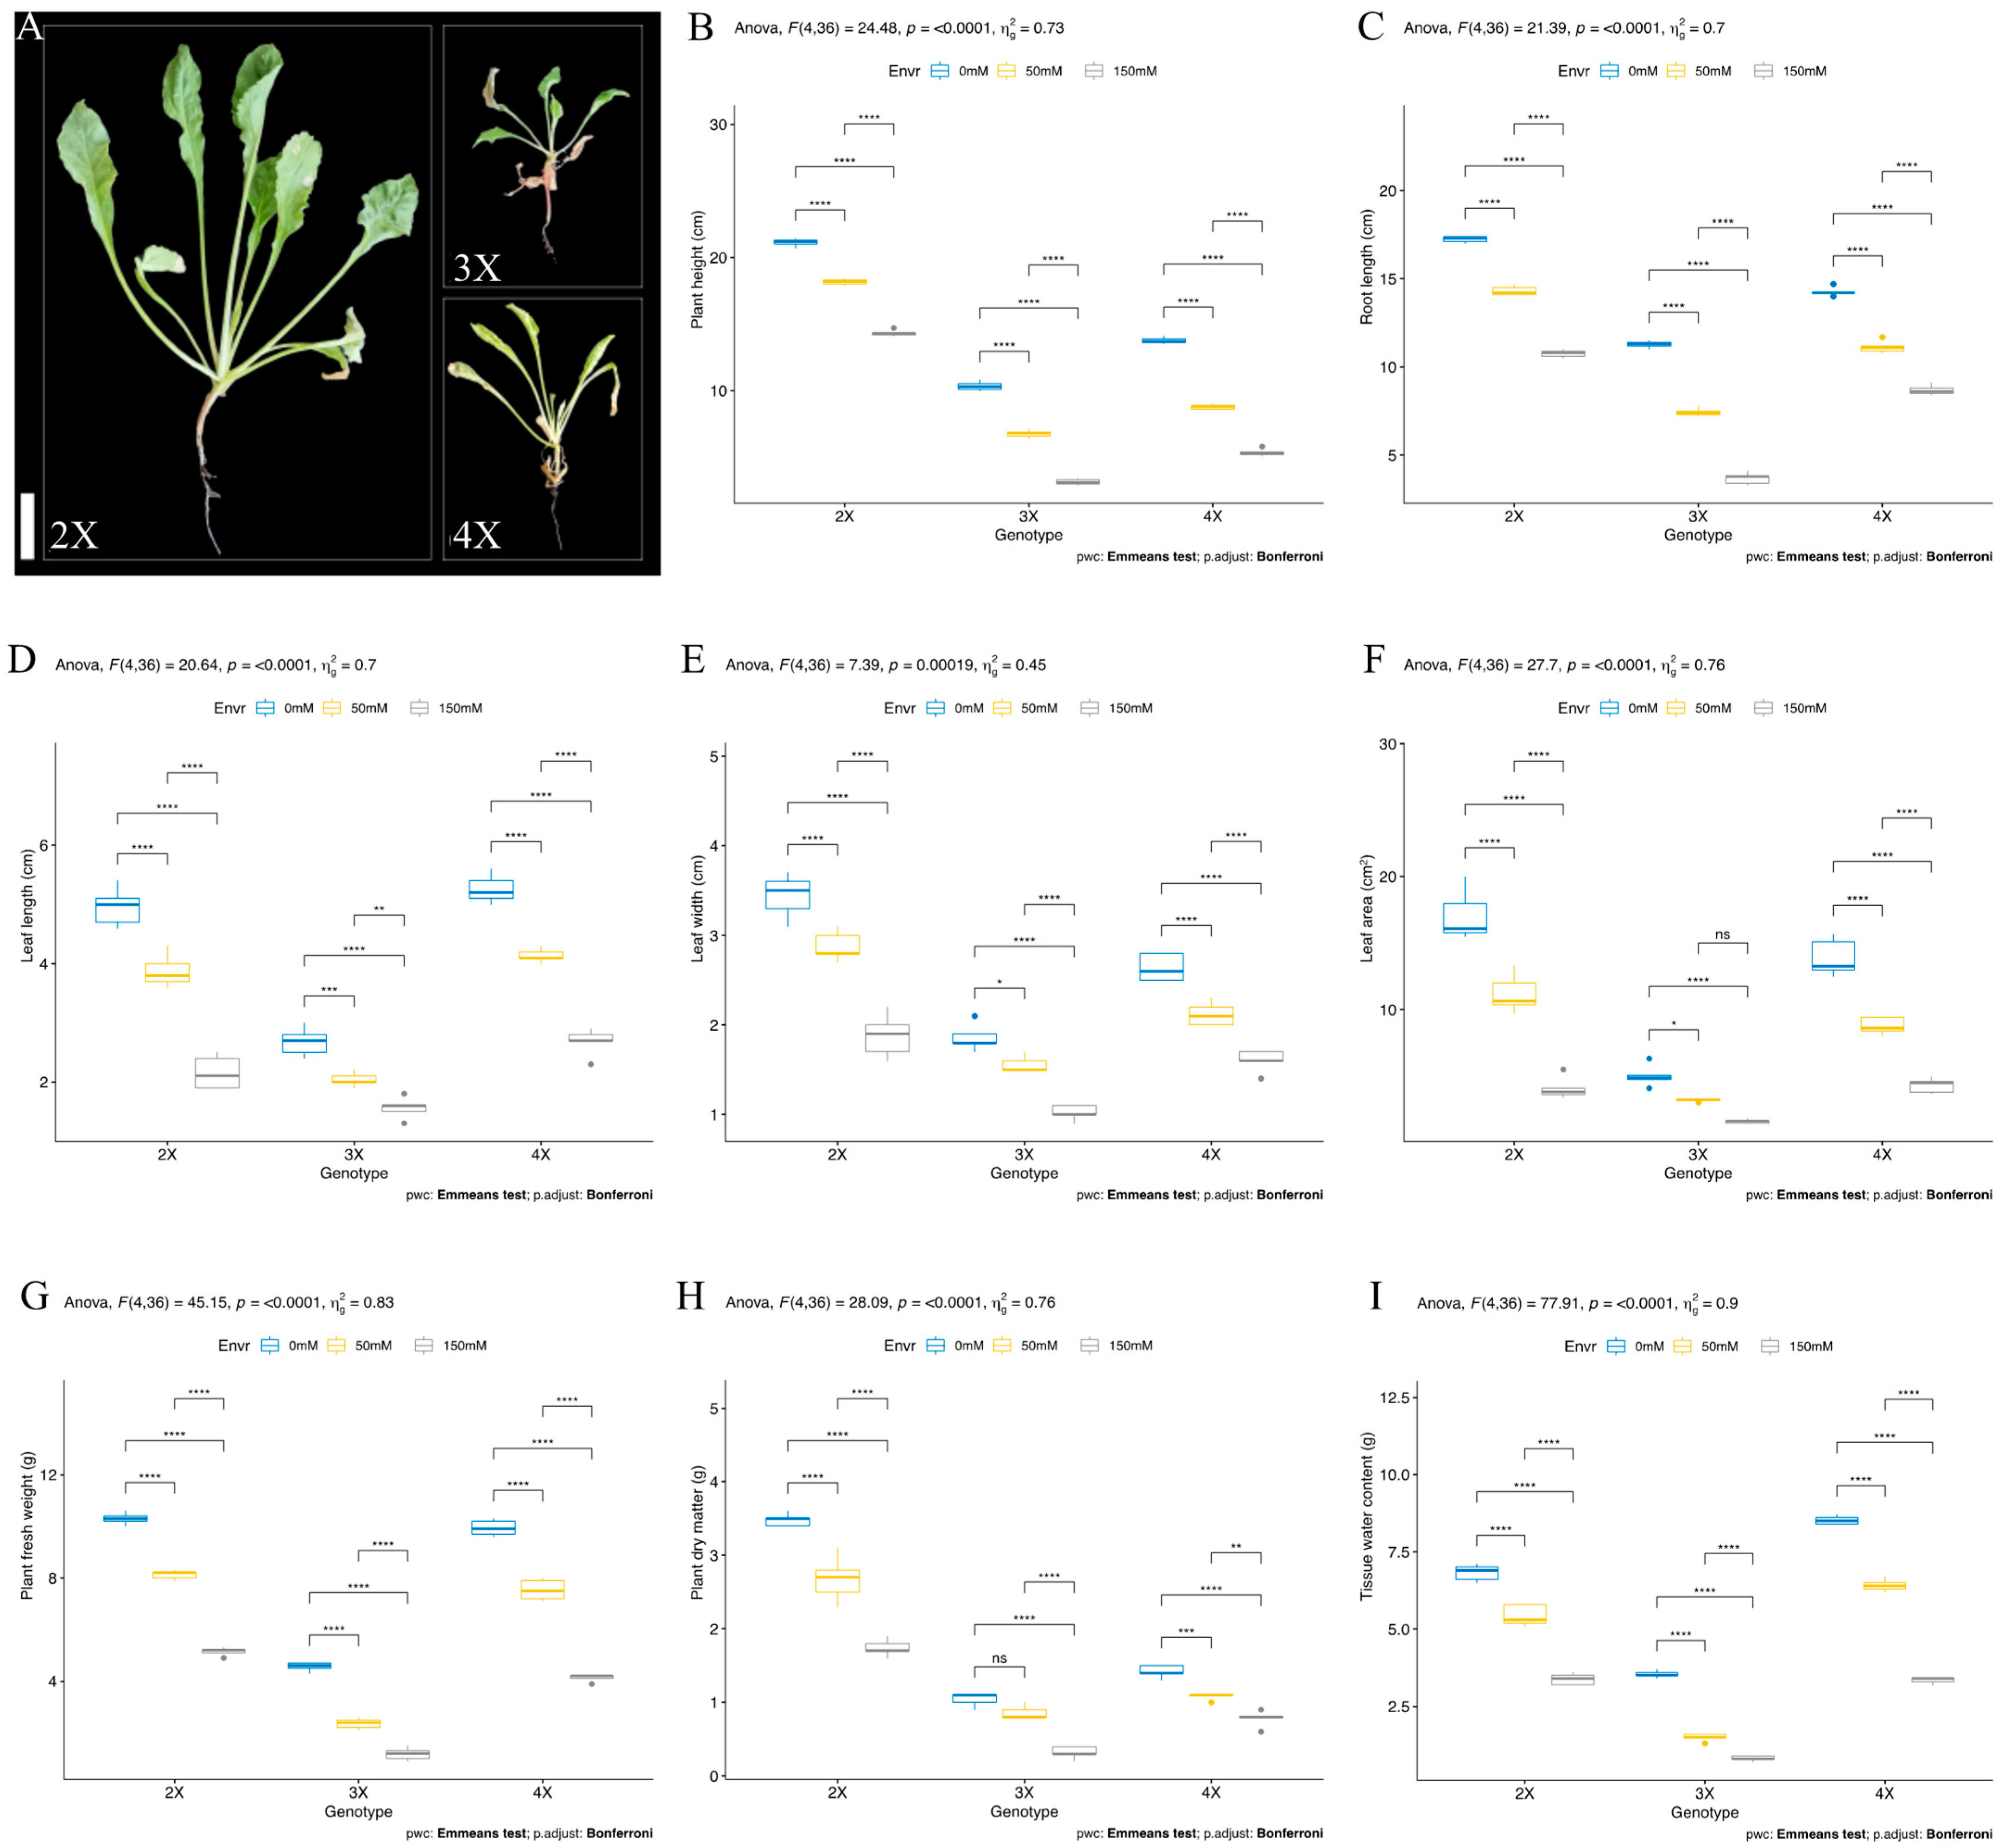
3.1. Germination and Seedling Stage

Salt stress significantly reduced the germination percentage of sugar beet (Beta vulgaris L.) by 7, 15, and 12% under 50 mM NaCl and 50, 56, and 60% under 150 mM NaCl stress compared to control in diploid (2X), triploid (3X), and tetraploid (3X) genotypes, respectively. However, germination percentages were observed to vary greatly depending on ploidy level in control conditions. Although the triploid (3X) genotype had the lowest germination rates under both control (31%) and salt stress (26% under 50 mM and 13% under 150 mM NaCl) conditions, the diploid (2X) genotype had the highest germination rates under both control (85%) and salt stress (79% under 50 mM and 42% under 150 mM NaCl) conditions (Figure 1A). The salt tolerance index (STI) significantly decreased by 21, 48, and 24% under 50 mM NaCl, and 50, 84, and 58% under 150 mM NaCl stress compared to control in diploid (2X), triploid (3X), and tetraploid (3X) genotypes, respectively (Figure 1B). The STI was found to be the highest in all ploidy levels under control conditions. However, diploid (2X) and tetraploid (4X) genotypes had almost the same STIs of 0.78 and 0.75 under 50 mM NaCl, respectively. The triploid (3X) and tetraploid (4X) genotypes had higher STIs: 0.49 and 0.41 at 150 mM NaCl, respectively. A significant drop (74%) was observed in STI of triploid (3X) genotypes under 150 mM NaCl (Figure 1B).
Salt stress increased seedling height and root length in plants of all ploidy levels during the seedling stage (14-day-old plants). The seedling height was found to be 8.7, 7.4, and 5.8 cm under control conditions in diploid (2X), triploid (3X), and tetraploid (3X) genotypes, respectively. Under 50 mM NaCl, seedling height was significantly increased by 22, 9, and 26% in diploid (2X), triploid (3X), and tetraploid (3X) genotypes compared to control, respectively. Surprisingly, seedling height was found to be much significantly higher than control and 50 mM NaCl stress than under 150 mM NaCl stress conditions in all examined genotypes. The seedling height was increased by 28, 11, and 36% under 150 mM NaCl compared to control in diploid (2X), triploid (3X), and tetraploid (3X) genotypes, respectively (Figure 1C). The 50 mM NaCl stress did not significantly affect root length, except in the tetraploid (4X) genotype. The root length of the tetraploid (4X) genotype was significantly increased by 13% under 50 mM NaCl stress compared to the control. A similar pattern was observed in 150 mM NaCl stress, and it significantly increased root length by 38, 27, and 31% in diploid (2X), triploid (3X), and tetraploid (3X) genotypes compared to control, respectively. The longest root was recorded in triploid (3X) and tetraploid (3X) genotypes under both control and salt stress (50 and 150 mM NaCl) conditions (Figure 1D).

3.2. Vegetative Stage

Salt stress significantly reduced plant viability during the vegetative stage (42-day-old plants) in contrast to the seedling stage, as seen in Figure 2A. Increased salt concentrations (50 mM and 150 mM NaCl) significantly reduced plant height at the vegetative stage in plants of all ploidy levels, and their height and root length drastically were reduced by increased salt concentrations (50 mM and 150 mM NaCl) during the vegetative stage. The highest plant height was observed in the diploid (2X) genotype at 21.12 cm, whereas triploid (3X) and tetraploid (4X) genotypes were 10.34 and 13.76 cm under control conditions. The 50 mM NaCl stress significantly reduced plant height by 14, 34, and 36% in diploid (2X), triploid (3X), and tetraploid (4X) genotypes compared to control conditions, respectively. The higher salt stress dose (150 mM NaCl) also drastically reduced plant height by 32, 69, and 61% in diploid (2X), triploid (3X), and tetraploid (4X) genotypes compared to control conditions, respectively. The highest plant height was observed as 14.32, 3.14, and 5.36 cm in diploid (2X), triploid (3X), and tetraploid (4X) genotypes under 150 mM NaCl stress conditions, respectively (Figure 2B). The same phenotype was observed in the root length trait. The highest root length was recorded in the diploid (2X) genotype under control (17.24, 11.28, and 14.26 cm in 2X, 3X, and 4X genotypes, respectively), 50 mM (14.32, 7.44, and 11.14 cm in 2X, 3X, and 4X genotype, respectively), and 150 mM (10.76, 3.68, and 8.68 cm in 2X, 3X, and 4X genotype, respectively) NaCl stress conditions. The root length was significantly shortened by 16, 34, and 21% in diploid (2X), triploid (3X), and tetraploid (4X) genotypes under 50 mM NaCl stress compared to control conditions, respectively. The highest reduction was observed with a maximum of 67% in triploid (3X), 37% in diploid (2X), and 39% in tetraploid (4X) genotypes under 150 mM NaCl stress conditions. For the same plant height, root length was found to be longer in diploid (2X) plants compared to triploid (3X) and tetraploid (4X) plants under control and salt stress conditions. Under control conditions, the diploid (2X) genotype showed high results, but the reduction percentage was found to be lower in the tetraploid (4X) genotype under salt stress conditions (Figure 2C).
The leaf length, leaf width, and leaf area traits were assessed to evaluate plant growth performance during the vegetative stage in all different ploidy genotypes. The leaf length was found to be higher in diploid (4.96 cm) and tetraploid (5.26 cm) genotypes under control conditions. The 50 mM NaCl stress significantly reduced leaf length by 21, 23, and 21% in 2X, 3X, and 4X genotypes, respectively. Similarly, 150 mM NaCl stress also led to leaf length significantly reduced by 56, 41, and 49% in diploid (2X), triploid (3X), and tetraploid (4X) genotypes, respectively. The highest leaf length was observed in 2X (2.88 cm) and 4X (4.14 cm) under 50 mM NaCl, and it was found highest in 4X (2.68) genotypes under 150 mM NaCl stress conditions (Figure 2D). The leaf width was found to be higher in 2X (3.44 cm), 4X (2.64 cm), and 3X (1.86 cm) under control conditions. The salinity (50 and 150 mM NaCl) significantly reduced leaf width by 16, 16, and 19% in diploid (2X), triploid (3X), and tetraploid (4X) genotypes under 50 mM NaCl, and it was significantly reduced by 45, 45, and 39% in diploid (2X), triploid (3X), and tetraploid (4X) genotypes under 150 mM NaCl stress compared to control conditions, respectively. The leaf width was found to be higher in the diploid (2X) genotype under 150 mM salt stress conditions (Figure 2E). The same phenomenon was observed in the leaf area. The diploid (2X) genotype showed a higher leaf area than the triploid (3X) and tetraploid (4X) genotypes under control conditions. The salt stress (50 mM NaCl) significantly reduced leaf area by 34, 36, and 36% in diploid (2X), triploid (3X), and tetraploid (4X) genotypes compared to control conditions, respectively. It was also significantly reduced by 76, 68, and 69% in diploid (2X), triploid (3X), and tetraploid (4X) genotypes under 150 mM NaCl stress compared to control, respectively. Under 50 mM NaCl stress, the diploid (2X) genotype showed greater leaf area, whereas it was greater in both diploid (2X) and tetraploid (4X) genotypes under 150 mM NaCl stress conditions (Figure 2F).
The fresh weight of diploid (2X, 10.3 g) and tetraploid (4X, 9.94 g) genotypes were found to be almost the same, but the fresh weight of the triploid (3X, 4.56 g) genotype was lower compared to 2X and 3X genotypes under control conditions. Salinity (50 mM NaCl) dramatically decreased the fresh weight by 21, 48, and 24% in diploid (2X), triploid (3X), and tetraploid (4X) genotypes compared to control conditions, respectively. It was also significantly decreased by 50, 74, and 58% under 150 mM NaCl stress in diploid (2X), triploid (3X), and tetraploid (4X) genotypes compared to control conditions, respectively. Under 50 and 150 mM NaCl stress conditions, the fresh weight was found to be higher in diploid (2X) genotypes (Figure 2G). The dry matter was found ca. 70 and 60% higher in diploid (2X) compared to triploid (3X) and tetraploid (4X) genotypes under control conditions, respectively. The 50 mM NaCl stress significantly reduced dry matter by 22, 17, and 23% compared to control conditions in diploid (2X), triploid (3X), and tetraploid (4X) genotypes, respectively. It was also significantly decreased by 50, 69, and 45% under 150 mM NaCl stress in diploid (2X), triploid (3X), and tetraploid (4X) genotypes compared to control conditions, respectively. The highest dry matter was recorded in diploid (2X) genotypes under 50 and 150 mM NaCl stress conditions compared to triploid (3X) and tetraploid (4X) genotypes (Figure 2H). The tissue water content (TWC) was detected higher in tetraploid (4X), diploid (2X), and triploid (3X) genotypes under control conditions. TWC significantly reduced by 20, 58, and 24% under 50 mM NaCl stress compared to control conditions in diploid (2X), triploid (3X), and tetraploid (4X) genotypes, respectively. The 150 mM NaCl stress also reduced TWC by 50, 76, and 60% in diploid (2X), triploid (3X), and tetraploid (4X) genotypes compared to control conditions, respectively (Figure 2I).

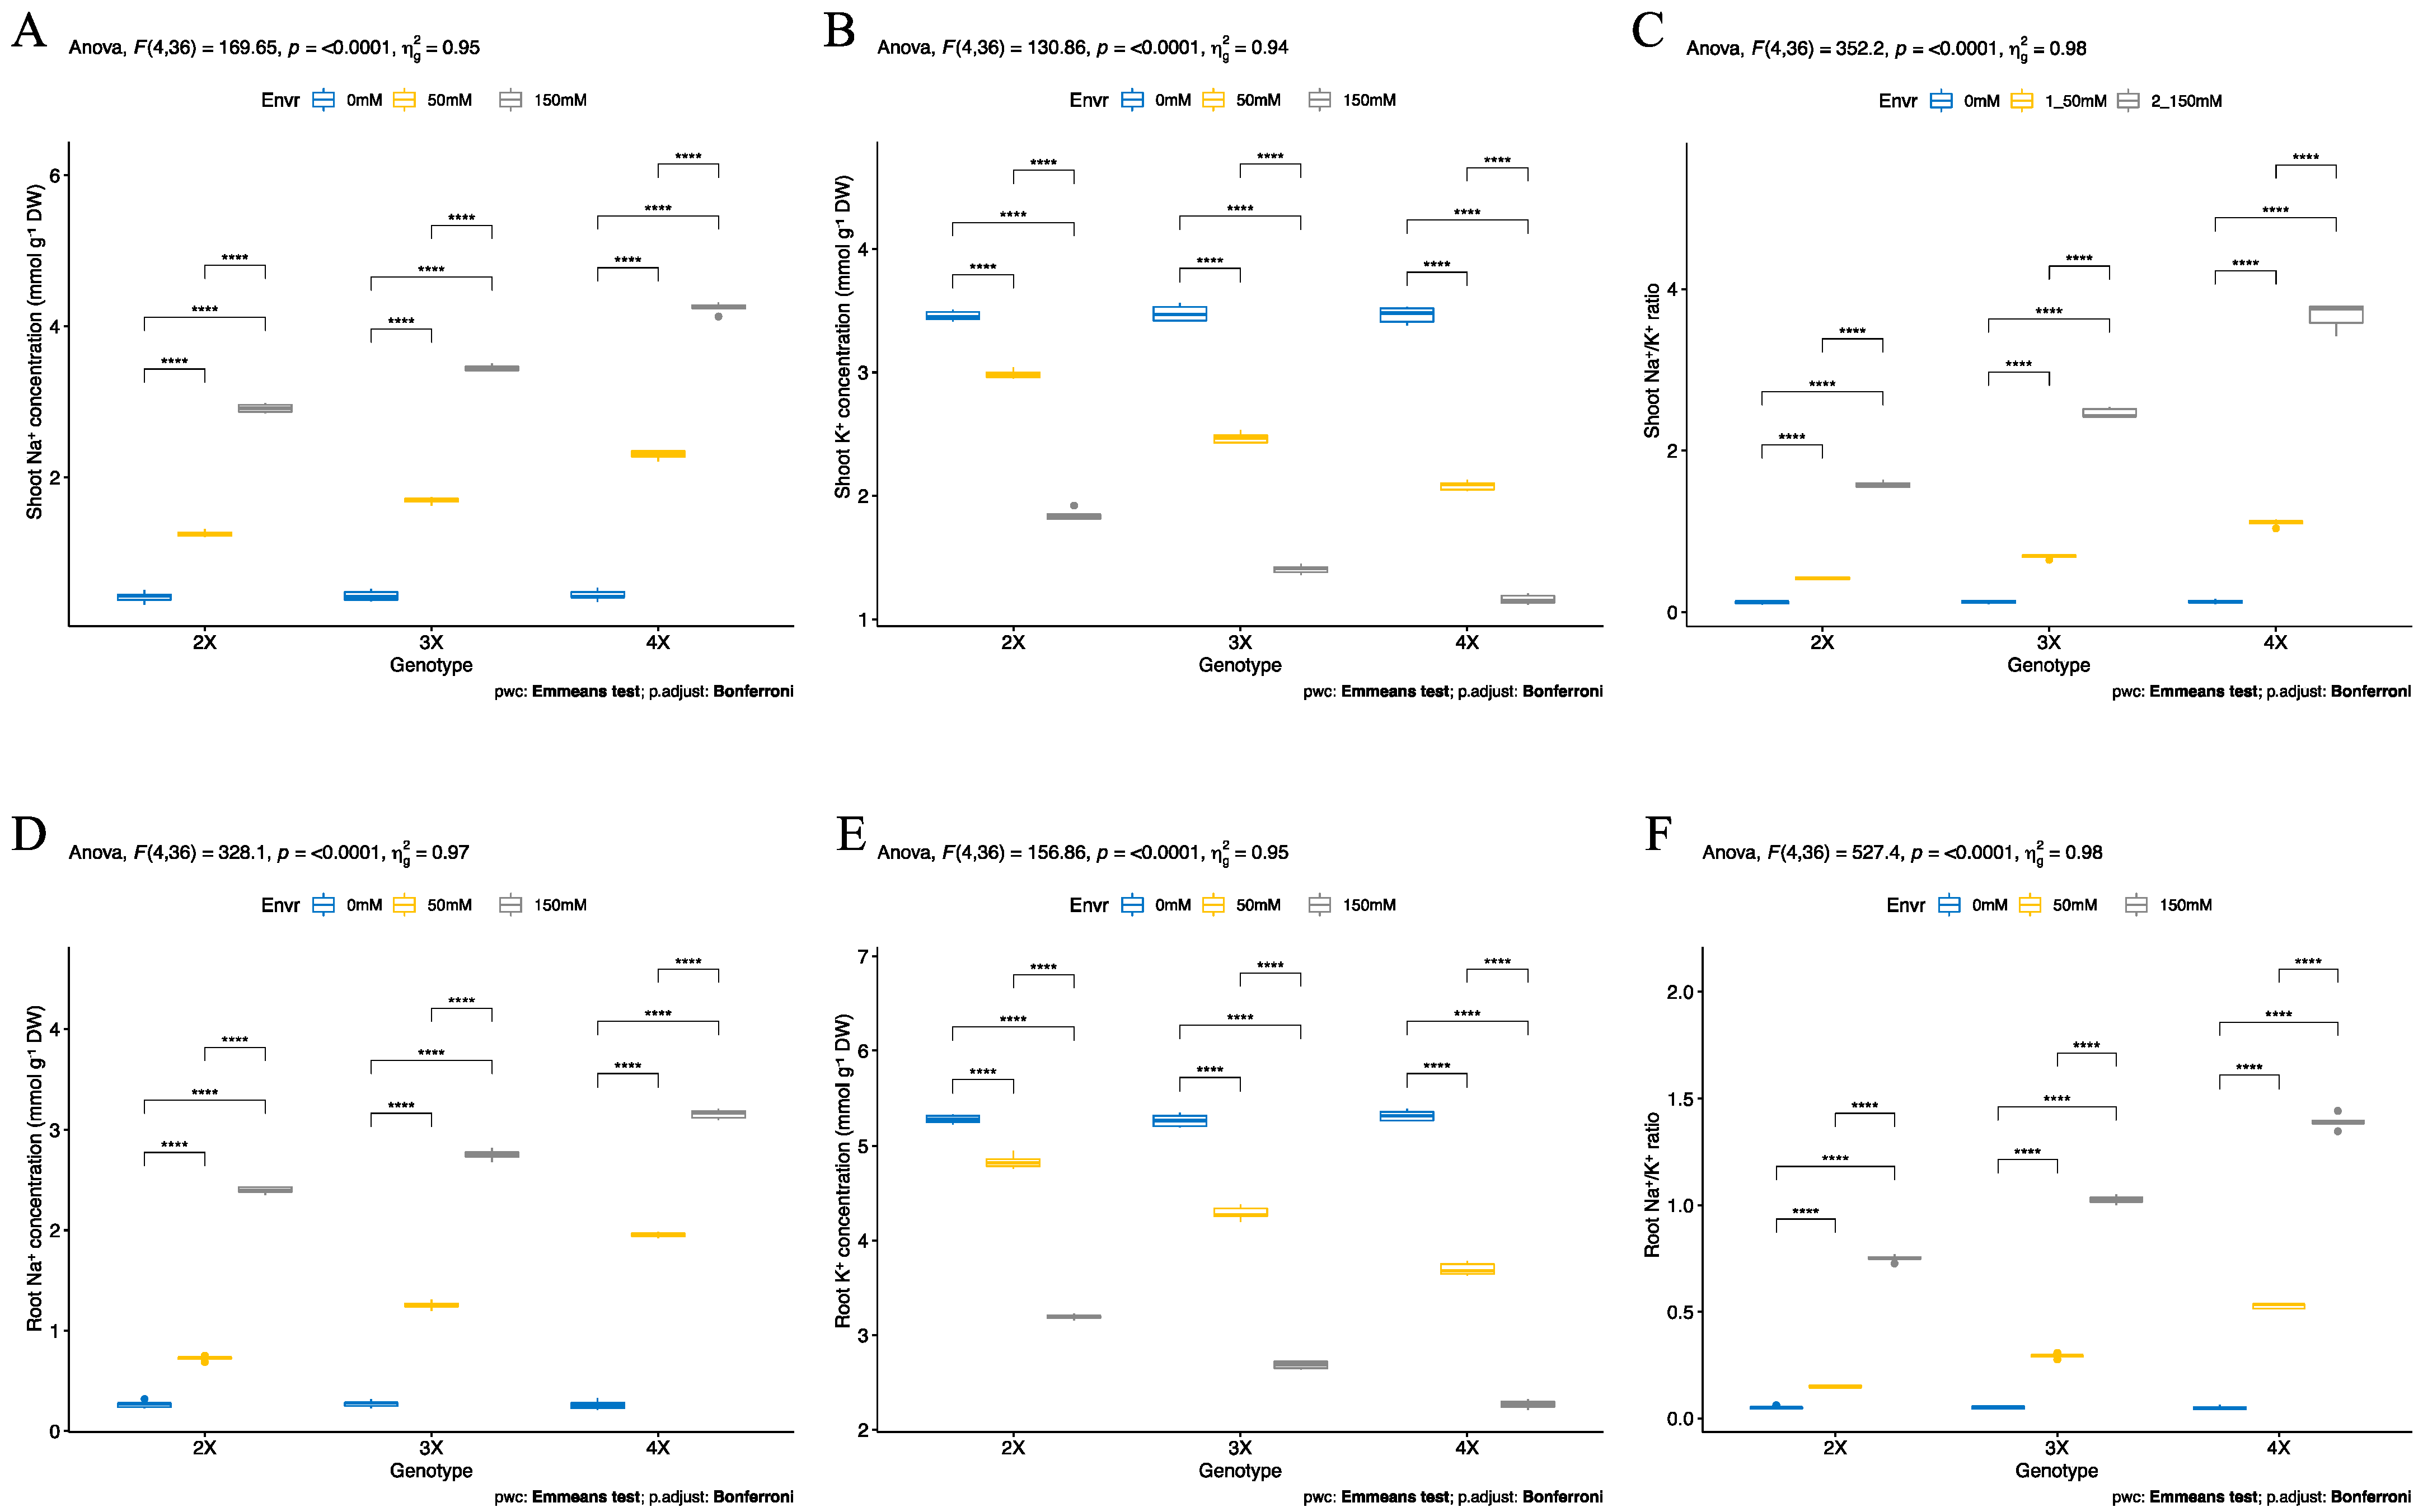
3.3. Ion Accumulation

Ion (Na+ and K+) accumulation was determined at the shoot and root tissues (42-day-old) in all genotypes under control and salt stress conditions. Although no significant differences were observed in sodium (Na+) concentrations among all ploidy plants under control conditions, the Na+ ion accumulation was significantly increased, and the potassium (K+) ion accumulation was significantly decreased under salt (50 and 150 mM NaCl) stress. The Na+ accumulation was significantly increased by 200, 292, and 419% in diploid (2X), triploid (3X), and tetraploid (4X) genotypes compared to control plants, respectively. The Na+ concentration was significantly maximized by 860% in shoot tissued of tetraploid (4X), 699% in triploid (3X), and 597% in diploid (2X) genotypes under 150 mM salt stress conditions. In particular, under salt stress conditions, shoot tissues of tetraploid plants had higher Na+ concentrations compared to other genotypes, and diploid (2X) plants had lower Na+ concentrations (Figure 3A). The potassium (K+) concentration was also found to be the same among shoot tissue of all genotypes under control conditions, but K+ ion accumulation was significantly decreased by 13, 28, and 39% in diploid (2X), triploid (3X), and tetraploid (4X) genotypes compared to control conditions, respectively. It was significantly decreased at 46% in diploid (2X), 59% in triploid (3X), and 66% in tetraploid genotypes under salt stress (150 mM NaCl) conditions. The highest K+ concentration was observed in the shoot tissue of the diploid (2X) genotype, and the lowest K+ concentration was recorded in tetraploid (4X) genotypes under salt stress conditions (Figure 3B). The lowest Na+/K+ ratio was observed in shoot tissued of the diploid (2X) genotype, and the highest Na+/K+ ratio was measured in shoot tissued of the tetraploid (4X) genotype under salt stress conditions (Figure 3C).
The same pattern was observed in the ion accumulation of root tissues in all examined polyploid (2X, 3X, and 4X) genotypes. Salt stress (50 and 150 mM NaCl) increased Na+ ion accumulation in root tissues in all genotypes. The Na+ ion accumulation was significantly boosted by 172, 362, and 645% in diploid (2X), triploid (3X), and tetraploid (4X) genotypes compared to control conditions, respectively. The Na+ ions were also significantly increased by 800% in diploid (2X), 911% in triploid (3X), and 1105% in tetraploid (4X) genotypes under 150 mM NaCl stress conditions compared to control conditions. The root tissue of the diploid (2X) genotype accumulated lower Na+ ions compared to triploid (3X) and tetraploid (4X) genotypes, and tetraploid genotypes had higher Na+ concentrations in root tissues (Figure 3D). Salinity (50 mM NaCl) significantly reduced K+ ion accumulation by 8, 18, and 30% in diploid (2X), triploid (3X), and tetraploid (4X) genotypes compared to control conditions, respectively. The K+ ion accumulation was decreased by 39% in root tissues of diploid (2X), 49% in triploid (3X), and 57% in tetraploid genotypes under 150 mM NaCl stress compared to control conditions. The highest K+ concentration was measured in root tissues of the diploid (2X) genotype, and the lowest K+ concentration was observed in root tissues of tetraploid (4X) genotypes under salt stress conditions (Figure 3E). The highest Na+/K+ ratio was recorded in the root tissues of the tetraploid (4X) genotype, and the lowest Na+/K+ ratio was observed in the root tissues of diploid (2X) genotypes under 150 mM NaCl stress conditions (Figure 3F).

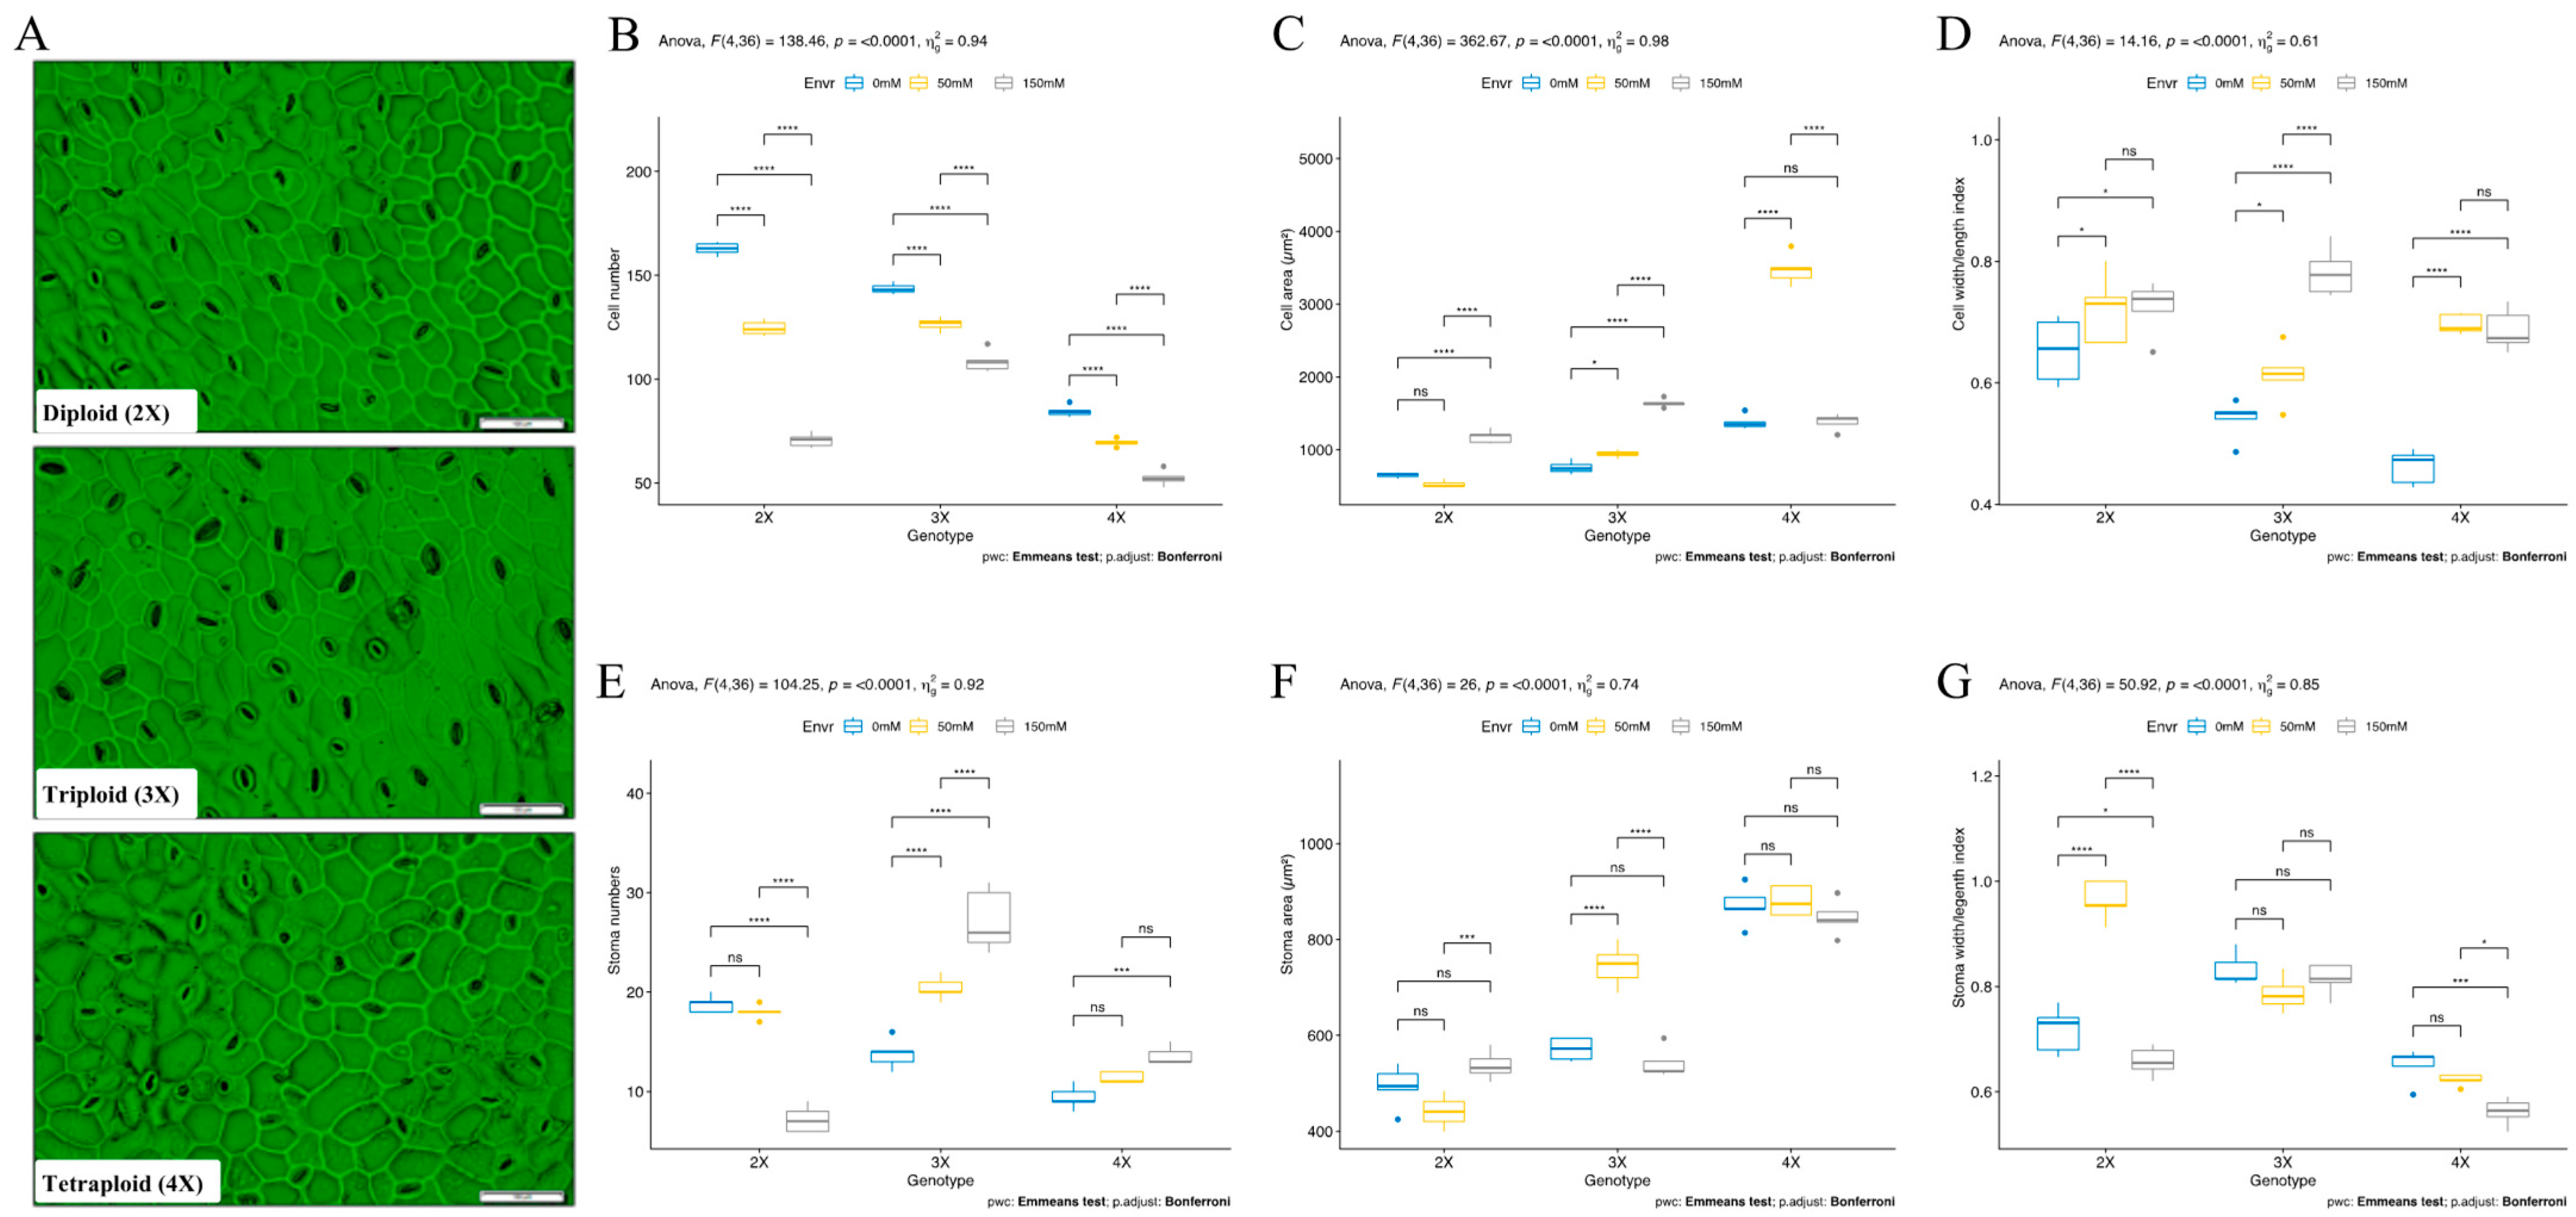
3.4. Cytological Response

Leaves of diploid (2X), triploid (3X), and tetraploid (4X) genotypes were observed at the vegetative stage to measure the number of cells and stoma; widths and lengths of cells and stoma; areas of cells and stoma in the unit field of view; and width/length index parameters of cells and stoma in order to determine cytological responses under salt stress conditions (Figure 4A). The cell number was found to be higher in the diploid (2X) genotype, and it was found to be lower in the tetraploid (4X) genotype under control conditions. The salt stress (50 mM NaCl) was significantly reduced by 23, 11, and 17% in diploid (2X), triploid (3X), and tetraploid (4X) genotypes compared to control conditions, respectively. The cell number was also significantly reduced by 56, 24, and 38% in diploid (2X), triploid (3X), and tetraploid (4X) genotypes compared to control conditions, respectively. The highest cell number was determined in the triploid (3X) genotype, and the lowest cell number was determined in tetraploid (4X) genotypes under 150 mM NaCl stress conditions (Figure 4B). The cell area was found to be 650, 765, and 1376 µm2 in diploid (2X), triploid (3X), and tetraploid (4X) genotypes under control conditions, respectively. The cell area was found to be higher in the tetraploid (4X) genotype compared to diploid (2X) and triploid (3X) genotypes under control conditions. The salt stress significantly increased at 116% in the triploid (3X) and 81% in the diploid (2X) genotypes’ cell area, but the cell area did not change in the tetraploid genotype under salt (150 mM NaCl) stress conditions (Figure 4C). These changes related to cell length and width size of plants under salt stress conditions; cell length and width were increased in diploid (2X) and triploid (3X) genotypes (Figure S1A,B). Additionally, the cell width/length index was increased under salt stress conditions, and the highest cell width/length index was found in the triploid (3X) genotype under salt stress conditions (Figure 4D).
The stoma number was found to be higher in the diploid (2X) genotype, and it was detected lower in the tetraploid (4X) genotype under control conditions. The salinity decreased at 61% stomata number in the diploid genotype but surprisingly increased by 44% in tetraploid (4X) and 97% in triploid genotypes under salt stress conditions. The triploid genotype showed a high number of stomas under salt stress conditions (Figure 4E). The stoma area was found to be higher in the tetraploid (4X) genotype, and it was found to be lower in the diploid (2X) genotype. The salinity increased the stoma area by 9% in the diploid (2X) genotype but decreased by 2% in the tetraploid (4X) and 5% in triploid genotypes under salt stress conditions (Figure 4F). Although all genotypes’ stomas enlarged in response to salt stress, only the diploid (2X) genotype’s stoma width changed. Under salt stress conditions, the stoma area was found to be larger in the diploid genotype (Figure S1C,D). The stoma width/length index did not significantly change but decreased by 8% in diploid (2X) and 13% in tetraploid genotypes under salt stress conditions (Figure 4G). Total chlorophyll content was found to be higher in the diploid (2X) genotype and lower in the triploid (3X) genotype under control conditions. The salinity reduced total chlorophyll content by 21% in diploid (2X), 34% in tetraploid (4X), and 40% in triploid (3X) genotypes under 150 mM salt (NaCl) stress conditions. The diploid (2X) genotype had a higher concentration of total chlorophyll compared to the triploid (3X) and tetraploid (4X) genotypes under salt stress conditions (Figure S1E). Additionally, all tested traits were significantly affected by genotype (G), environment (E), and genotype-environment (G × E) interactions (Table 1 and Table S1). The total chlorophyll content was found insignificant in G × E interaction.

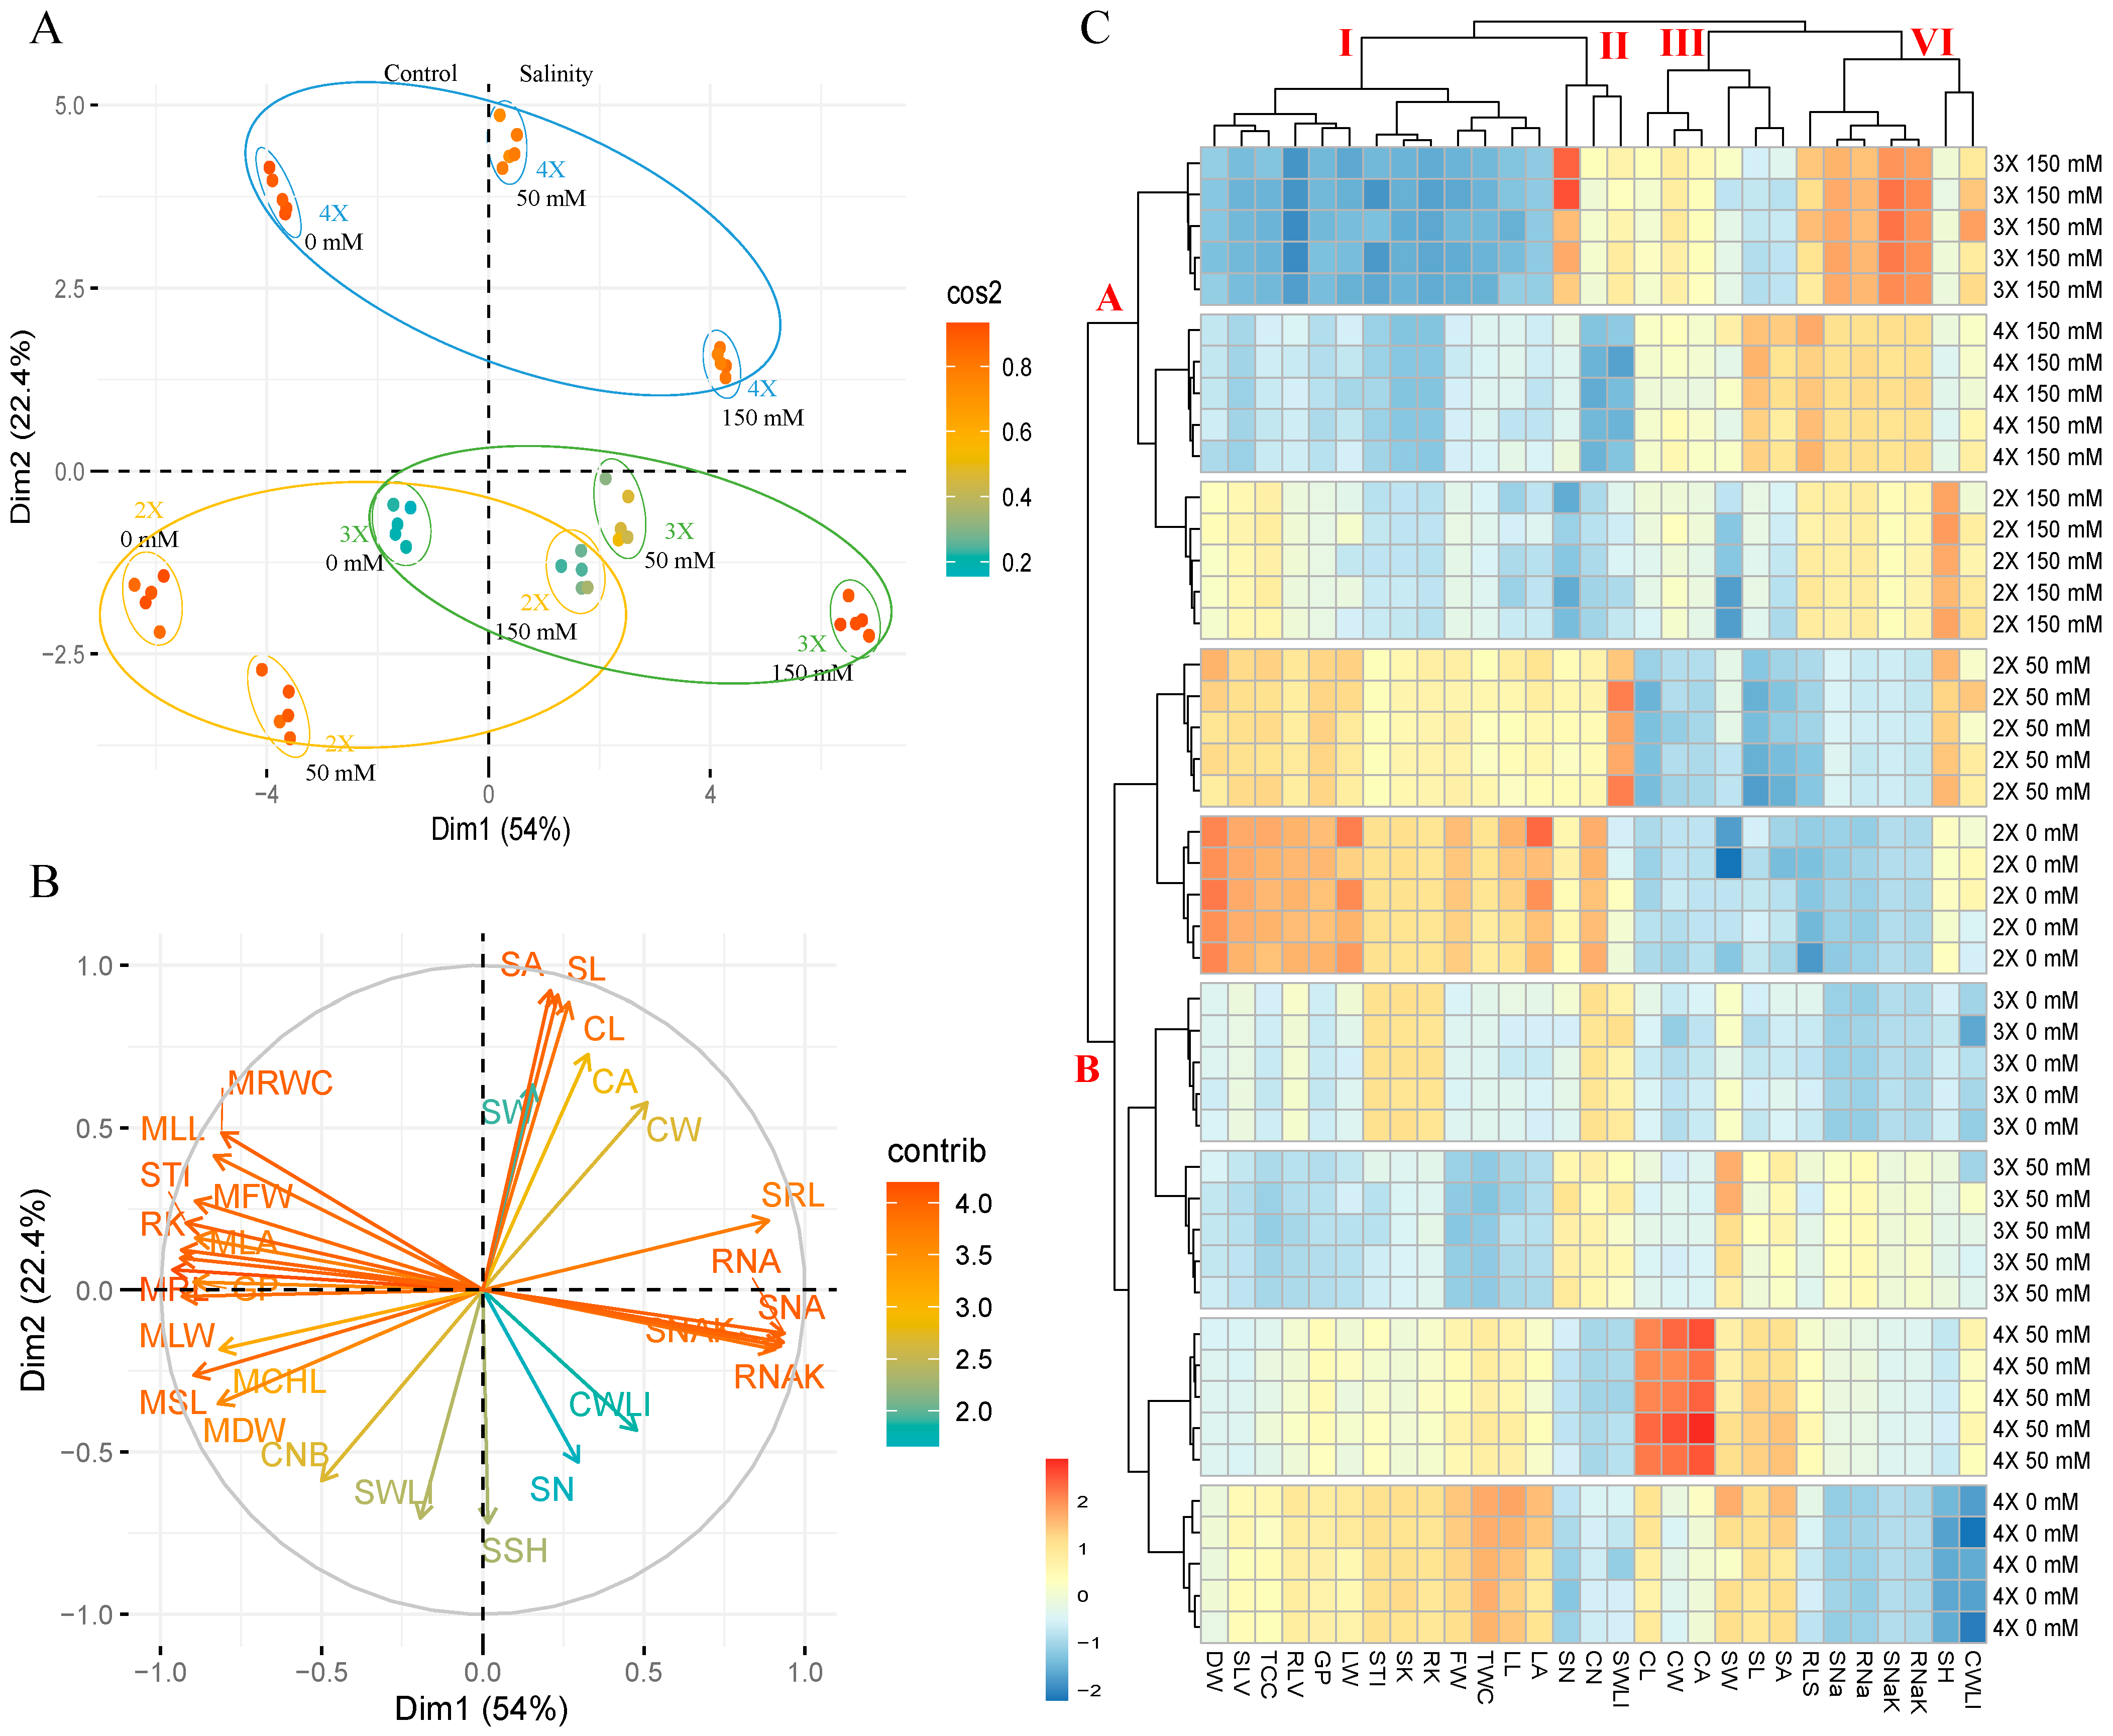
3.5. Principle Component and Hierarchical Clustering Analysis

PCA was used to evaluate genotype salt stress response and ploidy level. PCA results clearly distinguished between control and salt stress conditions (Figure 5A and Table S2). Based on measured traits, this allows for the identification of the salinity tolerance capacity of different ploidy genotypes. PCA also identified the traits that contributed to genotype tolerance (Figure 5B). PCA revealed that genotype characteristics were associated (76.4%) with dimension (Dim)1 and Dim2, with Dim1 being the major component (54%). Individuals’ colors represent the quality of representation of variables in the principal component, abbreviated as “Cos2.” In the analysis, almost 70% of the variables were rated as high quality. The tetraploid genotype was separated clearly from other genotypes. Under salt stress conditions, 50 mM and 150 mM NaCl exposed plants were clearly separated from control plants, but diploid (2X) genotype plants were found near the control group under both 50 mM and 150 mM NaCl stress conditions based on the euclidean distance graph. Triploid (3X) and tetraploid (4X) genotypes were found at the same distance under both stress conditions (Figure 5A, upper layer). PCA analysis revealed that cell- and stoma-related cell length (CL), cell width (SW), cell area (CA), stoma length (SL), stoma width (SW), and stoma area (SA) were the traits most contributing to the separation into the tetraploid (4X) group (Figure 5B).
The two-way HCA heat map revealed that all traits under control, 50 mM, and 150 mM NaCl salt stress conditions could be grouped into four major clusters (I–VI). The stress-exposed genotypes with different ploidy levels were divided into two major groups (A and B) (Figure 5C). Under control and 50 mM NaCl stress conditions, the traits were highly expressed in the diploid (2X), triploid (3X), and tetraploid (4X) genotypes, respectively. Cluster VI represented the CWLI, SSH, RNaK, SNaK, RNa, SNa, and SRL traits that were highly expressed in all genotypes under 150 mM NaCl stress. Cluster A showed that all ploidy level genotypes were under 150 mM NaCl, indicating that the genotypes were grouped based on stress explosion. The genotypes were grouped based on stress explosion, with Cluster A representing all ploidy level genotypes under 150 mM NaCl stress conditions and Cluster B representing control and 50 mM NaCl stress conditions (Figure 5C).

4. Discussion

Soil salinity is a major environmental factor limiting crop growth and yield performance. Consequently, plants will use several defense mechanisms to deal with salt stress. Polyploidy or whole-genome duplication is widely believed to have played a significant role in the evolution of plants by facilitating increased resilience in the face of adverse environmental conditions [37,38]. Ploidy plants are better resistant to biotic and abiotic stresses such as salinity [39]. Hexaploid bread wheat (Triticum aestivum) is more salt-tolerant than tetraploid wheat (T. turgidum) or durum wheat (T. durum), providing a clear example of the relationship between ploidy and salinity [40]. Sugar beets (Beta vulgaris L.) are resistant to salt and can be grown in a variety of environments. However, sugar beets are salt-sensitive during seed germination, so the salinity level should not exceed three dS/m (approximately 30 mM NaCl) [41,42]. Seed germination percentage was reduced in all ploidy levels in our experiments, but the diploid (2X) genotype showed less reduction. The diploid (2X) genotype performed well in both salt stress and control conditions, whereas the triploid (3X) genotype performed poorly in both control and NaCl treatment. Meratan et al. [43] reported that the germination percentages significantly decreased in Acanthophyllum species (especially in A. laxiusculum) of different ploidy levels exposed to NaCl stress. Agarwal and Pandey [44] also stated that they obtained similar results in the senna (Cassia angustifolia) plant. Jamil and Rha [45] reported that germination in sugar beet (Beta vulgaris L.) seeds decreased with increasing salt concentration.
Plant morphology and physiology define an adaptive mechanism that is critical for plant survival and development when the plant is exposed to salt stress at the seedling stage [46,47]. Except for some highly salt-tolerant genotypes of halophytes that have been shown to promote growth in the presence of low/moderate salt concentrations, growth reduction is a common reaction in plants that are exposed to salt-stress conditions [48]. Salinity promotes seedling shoot and root growth during the seedling stage in all ploidy levels, whereas the salinity effect reduces STI in all genotypes. According to our findings, the diploid (2X) genotype had greater STI than the other genotypes (3X and 4X). Surprisingly, we observed that salt stress boosted plant height at the early seedling stage in wheat [49]. According to Jamil and Rha [45], cabbage (Brassica oleracea L.) seedlings showed increased heights 10 and 15 days after the application of 0.5% NaCl. Taghizadegan et al. [50] discovered increases in seedling heights and root lengths of three-month-old sugar beet (Beta vulgaris L.) genotypes treated with 16 dS/m NaCl as compared to the control. The increase in these characteristics was viewed as an endeavor to increase tolerance to stress. It is thought that stressing salt-tolerant sugar beet genotypes during their early growth stages enhances their growth.
Plants exhibit morpho-physiological, cellular, and biochemical changes based on ploidy levels and growth period [51]. Most polyploid plants exhibit numerous new morphologies, anatomies, or variations; additionally, the responses of plants to environmental conditions to which they are exposed differ depending on the ploidy level of the plants [12,22,52,53,54]. When compared to controls, increasing salinity prevents/slows root growth, according to the studies. However, depending on plant species, genotypes, salt concentration, application time, and plant growth period, the final result may differ [43,45,55]. In contrast, in the seedling stage, the growth-promoting impact of salinity reduced shoot height and root length in all ploidy level genotypes in our experiment. Despite this loss in shoot height and root length, the diploid (2X) genotype outperformed the other genotypes under control and salt stress conditions. According to Pegtel [56], a high ploidy level does not always result in more significant seedling growth. A number of variables are predicted to contribute to this predicament. One of these potential explanations is the harmful effect of salt ion accumulation dose and time in the plant’s environment. Seedlings are also assumed to be the result of uneven mineral intake and genetic variances in genotypes [57] because morphological, physiological, biochemical, cellular, and molecular dimensions differ between diploid and tetraploid plants [14]. The most evident influence on plant morphology and phenotypic traits is salt damage [58]. The leaf is a vital organ for plants to maintain normal development and life cycles through photosynthesis and transpiration [59]. Leaves will respond to salt stress in the same way. Leaf-shape indices can be used to assess plant performance in a range of situations, including salt stress, because these indices can indicate leaf growth and development [60]. According to our findings, salinity reduced leaf width, length, and area in all ploidy-level genotypes. The diploid (2X) genotype outperformed the other genotypes that were examined in terms of leaf width, length, and area under control conditions. When salt stress was administered, it was discovered that those parameters had the same value in diploid (2X) and tetraploid (4X) genotypes. Salt stress reduces plant growth and development, which slows the pace of leaf area expansion development [61]. Salt damage in particular can reduce the elongation zone and/or period of the leaves, slowing the rate of leaf growth and the rate of local blade expansion [62]. In that instance, the plant’s adaptation to salt stress is reduced leaf area. Reduced water transpiration and nutrient supply demand are favorable, as they damage the energy distribution of leaf supply growth [58].
Plant biomass (fresh weight and dry matter) and tissue water content are essential indicators for salinity damage and tolerance in plants [7]. Plant biomass was reduced under salt stress conditions in all ploidy level genotypes. The fresh weight of diploid (2X) and tetraploid (4X) genotypes was the same under control settings, but under salt stress conditions, it was shown to be higher in the diploid genotype compared to other ploidy level genotypes. Dry matter was found to be greater in the diploid genotype under control conditions. All genotypes of salt trees lowered dry matter, although diploid genotypes produced more dry matter than other genotypes. One of the significant physiological components that contribute to salinity tolerance is the maintenance of plant water status in plant tissues [63]. Tissue water content (TWC) may be used to predict salt stress tolerance [64]. Increasing salinity contributes to changes in the water balance of cellular tissues [7]. According to our findings, under normal conditions, the tetraploid (4X) genotype had a greater TWC than the diploid (2X) genotype, but under salt stress conditions, the two genotypes had the same TWC. By altering the salt concentration, peas (Pisum sativum) [65], potatoes (Solanum tuberosum), sugarcane (Saccharum officinarum) [66], and rapeseed (Brassica napus) were able to minimize the amount of water in their tissues [67].
Plants are harmed by salinity due to osmotic and ion toxicity. Plants have developed several methods to limit salt damage in tissues depending on their environment and the level of stress. Osmotic adjustment, Na+ exclusion, and K+ retention are three of these strategies [68,69,70]. Na+ is a major toxic element in saline soils. Several studies have revealed that salt-tolerant plants accumulate fewer Na+ ions in leaves than salt-sensitive plants [69,70,71,72,73]. Salt stress increased Na+ accumulation while decreasing K+ accumulation at all ploidy levels in our study. Diploid genotypes accumulated less Na+ and more K+ in shoot and root tissues than other ploidy-level genotypes under salt stress conditions. Previous research also found that when salinity levels increased, Na+ accumulation also increased [74]. Additionally, sugar beet (Beta vulgaris L.) Na+ ion accumulation was found to increase inversely with ploidy levels, whereas K+ accumulation showed the opposite trend.
Diploid plants have smaller cells and stomata than tetraploid plants. As a result, tetraploid plants develop larger and thicker leaves, as well as larger flowers, fruits, and seeds [12,75]. During the vegetative stage, the number of cells dropped as the salt dose increased. This may be because salt-stressed plant cells divide more slowly. As salt concentrations were raised, so were cell length, width, and area increased. By comparing the decrease in cell number to the rise in cell size, salt tolerance can be estimated. Genotypes may attempt to compensate for a decrease in cell division by increasing cell size. Furthermore, as ploidy increased, the number of cells reduced, but cell sizes grew. As a result, the diploid (2X) genotype had the most cells, whereas the tetraploid (4X) genotype had the most significant cell size. Genotypes may increase cell size to compensate for a decline in cell division. Furthermore, as ploidy increased, cell numbers decreased, but cell sizes grew. As a result, the diploid (2X) genotype had the most significant number of cells, whereas the tetraploid (4X) genotype had the most considerable cell size. It has long been established that increasing cell sizes at higher ploidy levels is achievable only with “high ploidy syndrome”, as observed in tetraploid (4X) cells, which divide at a slower rate [76,77]. The quality of energy required to support cell division in high polyploids is increased due to the massive number of chromosomes. The inferior morphological parameters reported in polyploid genotypes during the early growth (vegetative growth stage) stages are assumed to be related to slower cell division in these genotypes [76]. In fact, identical conditions were observed in the tetraploid (4X) genotype in our study. In many physiological (total chlorophyll concentration) and morphological criteria, the tetraploid (4X) genotype trailed the diploid (2X) genotype. The results revealed that the tetraploid genotype had fewer stomas than the diploid genotype but had increased stoma length, width, and area. Warner and Edwards [19] found similar results, notably that as ploidy increased, the number of photosynthetic cells per unit leaf area decreased. The number of stomata per unit of leaf area in polyploid plants has been shown to be lower when the plants are exposed to high salt concentrations, as reported by Tal and Gardi [18]. In contrast, the stomata of these plants were more accessible. It was determined that the tetraploid (4X) genotype’s effort to enlarge the size of the cell and the chlorophyll-carrying stoma in response to an increasing salt dose was crucial for survival in this stressful situation. However, when comparing the diploid (2X) and tetraploid (4X) genotypes, it was found that the diploid (2X) genotype had more cells and stomas that contained chlorophyll.
Salinity had a detrimental effect on total chlorophyll content at all ploidy levels, with diploid (2X) genotypes outperforming triploid (3X) and tetraploid (4X) genotypes in all treatments. Some genotypes’ chlorophyll concentrations decrease under salt stress for causes such as pigment photo-oxidation [78], slower synthesis, and faster breakdown of chloroplasts [79]. Many factors can affect chlorophyll content values, including genotypic variances, growth stages, plant diseases, nutritional deficiencies, and stress. One of the most essential chloroplast components for photosynthesis is chlorophyll. Chlorophyll is vulnerable to salt stress because it gathers light and generates reducing pressures; this can damage plant productivity and quality [80,81]. Mahlooji et al. [82] found that under salt stress, some barley genotypes experienced a drop in chlorophyll content. Similarly, numerous researchers reported that salt stress reduced the chlorophyll content of plants [83,84]. Yang et al. [85] determined that under salt stress, hexaploid wheat genotypes exhibited substantially higher levels of chlorophyll content than tetraploid. In the salt environment, genotypes with a higher chlorophyll content have been shown to yield more than those with a lower level. Therefore, cultivar selection based on chlorophyll content can prevent yield losses under salt stress conditions [40,82,86,87].
Ploidy levels increase salinity tolerance in previous studies by several mechanisms [88,89]. Bread wheat (Triticum aestivum L., BBAADD) is a typical allohexaploid species with higher salt tolerance than its tetraploid wheat progenitor (BBAA). The TaHAG1 gene’s epigenetic control is thought to have contributed to salt tolerance by regulating the formation of reactive oxygen species (ROS) and signal specificity [90]. Tetraploid rice is more quickly triggered and expresses stress-responsive genes, such as those in the JA pathway, at higher levels than diploid rice under salt stress. This is accompanied by an increase in the concentration of the amino acid jasmonoyl isoleucine (JA-Ile), which confers stress tolerance. In tetraploid rice under stress, increased expression of the genes that respond to it can lead to hypermethylation and suppression of the TEs next to the stress-responsive genes [91]. The latest research demonstrated that polyploidy not only affects salinity tolerance by physio-biochemical traits but also has an effect on epigenetic and gene regulation mechanisms. Our results showed that the diploid (2X) genotype might have greater salinity tolerance because of the higher growth performance under control conditions than the triploid (3X) and tetraploid (4X) genotypes. However, our results showed different trends compared to previous and current research. More experiments are needed to understand the underlying mechanism deeply.

5. Conclusions

In the present study, the diploid (2X) genotype exhibited greater salinity tolerance by accelerating cell division, increasing growth development, accumulating osmotic regulatory metabolites, retaining fewer Na+ and high K+ concentrations in water, and activating photosynthetic mechanisms such as chlorophyll. As a result, it is predicted that, compared to other genotypes studied, growing the sugar beet (Beta vulgaris L.) diploid (2X) genotype in salinity-prone areas will reduce yield losses per unit area caused by salinity. The current study’s findings indicated that the results will serve as a foundation for future research and will provide helpful information for selecting and developing salt-tolerant genotypes at various ploidy levels.

Supplementary Materials

The following supporting information can be downloaded at https://www.mdpi.com/article/10.3390/ijpb14010017/s1, Figure S1: Cell and stoma parameters with total chlorophyll content. Table S1: Variance analysis tables. Table S2 Loading values and percentage contribution of variables on the axis identified by the principal component analysis (PCA) for all cultivars under control and saline conditions.

Author Contributions

Conceptualization, M.Y. and M.A.; methodology, E.G.E. and I.P.; software, M.A.; validation, E.G.E. and Y.O.; formal analysis, E.G.E.; investigation, M.A.; resources, M.Y.; data curation, Y.O. and I.P.; writing—original draft preparation, M.A.; writing—review and editing, M.A.; visualization, M.A.; supervision, M.Y.; project administration, M.Y.; funding acquisition, M.Y. All authors have read and agreed to the published version of the manuscript.

Funding

This research was funded by the FOSC project (Sus-Agri-CC) from the European Union’s Horizon 2020 research and innovation program under grant agreement 220N247 to M.Y.

Institutional Review Board Statement

Not applicable.

Informed Consent Statement

Not applicable.

Data Availability Statement

Data available on request due to restrictions eg privacy or ethical.

Conflicts of Interest

The authors declare no conflict of interest.

References

  1. FAO. Global Map of Salt-Affected Soils (GSASmap). Available online: https://www.fao.org/soils-portal/data-hub/soil-maps-and-databases/global-map-of-salt-affected-soils/en/ (accessed on 10 August 2022).
  2. UN. United Nations Set out 17 Sustainable Development Goals (SDGs). Available online: https://www.un.org/sustainabledevelopment/hunger/ (accessed on 2 September 2022).
  3. FAO. The Future of Food and Agriculture: Trends and Challenges. Available online: http://www.fao.org/3/a-I6583e.pdf (accessed on 9 September 2022).
  4. Xu, Q.; Burgess, P.; Xu, J.; Meyer, W.; Huang, B. Osmotic stress- and salt stress-inhibition and gibberellin-mitigation of leaf elongation associated with up-regulation of genes controlling cell expansion. Environ. Exp. Bot. 2016, 131, 101–109. [Google Scholar] [CrossRef]
  5. Bui, E.N. Causes of Soil Salinization, Sodification, and Alkalinization. In Oxford Research Encyclopedia of Environmental Science; Oxford University Press: Oxford, UK, 2017. [Google Scholar]
  6. Barrett-Lennard, E.G. The interaction between waterlogging and salinity in higher plants: Causes, consequences and implications. Plant Soil 2003, 253, 35–54. [Google Scholar] [CrossRef]
  7. Munns, R.; Tester, M. Mechanisms of salinity tolerance. Annu. Rev. Plant Biol. 2008, 59, 651–681. [Google Scholar] [CrossRef] [PubMed] [Green Version]
  8. Liang, W.; Ma, X.; Wan, P.; Liu, L. Plant salt-tolerance mechanism: A review. Biochem. Biophys. Res. Commun. 2018, 495, 286–291. [Google Scholar] [CrossRef] [PubMed]
  9. Deinlein, U.; Stephan, A.B.; Horie, T.; Luo, W.; Xu, G.; Schroeder, J.I. Plant salt-tolerance mechanisms. Trends Plant Sci. 2014, 19, 371–379. [Google Scholar] [CrossRef] [PubMed] [Green Version]
  10. Jahan, B.; AlAjmi, M.F.; Rehman, M.T.; Khan, N.A. Treatment of nitric oxide supplemented with nitrogen and sulfur regulates photosynthetic performance and stomatal behavior in mustard under salt stress. Physiol. Plant. 2020, 168, 490–510. [Google Scholar] [CrossRef] [PubMed]
  11. Saleh, B.; Allario, T.; Dambier, D.; Ollitrault, P.; Morillon, R. Tetraploid citrus rootstocks are more tolerant to salt stress than diploid. Comptes Rendus Biol. 2008, 331, 703–710. [Google Scholar] [CrossRef] [PubMed]
  12. Xue, H.; Zhang, B.; Tian, J.R.; Chen, M.M.; Zhang, Y.Y.; Zhang, Z.H.; Ma, Y. comparison of the morphology, growth and development of diploid and autotetraploid ‘hanfu’ apple trees. Sci. Hortic. 2017, 225, 277–285. [Google Scholar] [CrossRef]
  13. Wu, G.Q.; Lin, L.Y.; Jiao, Q.; Li, S.J. Tetraploid exhibits more tolerant to salinity than diploid in sugar beet (Beta vulgaris L.). Acta Physiol. Plant. 2019, 41, 51. [Google Scholar] [CrossRef]
  14. Tu, Y.; Jiang, A.; Gan, L.; Hossain, M.; Zhang, J.; Peng, B.; Xiong, Y.; Song, Z.; Cai, D.; Xu, W.; et al. Genome duplication improves rice root resistance to salt stress. Rice 2014, 7, 15. [Google Scholar] [CrossRef] [Green Version]
  15. Barkla, B.J.; Rhodes, T.; Tran, K.N.T.; Wijesinghege, C.; Larkin, J.C.; Dassanayake, M. Making epidermal bladder cells bigger: Developmental-and salinity-induced endopolyploidy in a model halophyte. Plant Physiol. 2018, 177, 615–632. [Google Scholar] [CrossRef] [PubMed]
  16. Jibiki, M.; Kuno, Y.; Shinoyama, H.; Fujii, T. Isolation and properties of large cell strains from a methanol-utilizing yeast, candida sp. n-16 by colchicine treatment. J. Gen. Appl. Microbiol. 1993, 39, 439–442. [Google Scholar] [CrossRef]
  17. Guertin, D.A.; Sabatini, D.M. Cell Size Control. eLS 2006. [Google Scholar] [CrossRef]
  18. Tal, M.; Gardi, I. Physiology of polyploid plants: Water balance in autotetraploid and diploid tomato under low and high salinity. Physiol. Plant 1976, 38, 257–261. [Google Scholar] [CrossRef]
  19. Warner, D.A.; Edwards, G.E. Effects of polyploidy on photosynthetic rates, photosynthetic enzymes, contents of dna, chlorophyll, and sizes and numbers of photosynthetic cells in the C4 dicot Atriplex confertifolia. Plant Physiol. 1989, 91, 1143–1151. [Google Scholar] [CrossRef] [Green Version]
  20. Molin, W.; Meyers, S.; Baer, G.; Schrader, L. Ploidy effects in isogenic populations of alfalfa: II. photosynthesis, chloroplast number, ribulose-1,5-bisphosphate carboxylase, chlorophyll, and dna in protoplasts. Plant Physiol. 1982, 70, 1710–1714. [Google Scholar] [CrossRef] [Green Version]
  21. Warner, D.A.; Ku, M.S.B.; Edwards, G.E. Photosynthesis, leaf anatomy, and cellular constituents in the polyploid C4 grass Panicum virgatum. Plant Physiol. 1987, 84, 461–466. [Google Scholar] [CrossRef] [Green Version]
  22. Stupar, R.M.; Bhaskar, P.B.; Yandell, B.S.; Rensink, W.A.; Hart, A.L.; Ouyang, S.; Veilleux, R.E.; Busse, J.S.; Erhardt, R.J.; Buell, C.R.; et al. Phenotypic and transcriptomic changes associated with potato autopolyploidization. Genetics 2007, 176, 2055–2067. [Google Scholar] [CrossRef] [Green Version]
  23. Riddle, N.C.; Jiang, H.; An, L.; Doerge, R.W.; Birchler, J.A. Gene expression analysis at the intersection of ploidy and hybridity in maize. Theor. Appl. Genet. 2010, 120, 341–353. [Google Scholar] [CrossRef]
  24. Ruiz, M.; Quiñones, A.; Martínez-Alcántara, B.; Aleza, P.; Morillon, R.; Navarro, L.; Primo-Millo, E.; Martínez-Cuenca, M.R. Effects of salinity on diploid (2x) and doubled diploid (4x) Citrus macrophylla Genotypes. Sci. Hortic. 2016, 207, 33–40. [Google Scholar] [CrossRef]
  25. Badridze, G.; Weidner, A.; Asch, F.; Börner, A. Variation in salt tolerance within a georgian wheat germplasm collection. Genet. Resour. Crop Evol. 2009, 56, 1125–1130. [Google Scholar] [CrossRef]
  26. Lv, X.; Chen, S.; Wang, Y. Advances in Understanding the physiological and molecular responses of sugar beet to salt stress. Front. Plant Sci. 2019, 10, 1431. [Google Scholar] [CrossRef] [PubMed] [Green Version]
  27. Gurel, E.; Gurel, S.; Lemaux, P.G. Biotechnology applications for sugar beet. CRC Crit. Rev. Plant Sci. 2008, 27, 108–140. [Google Scholar] [CrossRef]
  28. Feizi, M.; Fallahzade, J.; Noorshargh, P. sugar beet yield response to different levels of saline irrigation water and leaching in an arid region. J. Plant Nutr. 2018, 41, 654–663. [Google Scholar] [CrossRef]
  29. Murray, G.; Swensen, J.B.; Gallian, J.J. Emergence of sugar beet seedlings at low soil temperature following seed soaking and priming. HortScience 1993, 28, 31–32. [Google Scholar] [CrossRef] [Green Version]
  30. Capron, I.; Corbineau, F.; Dacher, F.; Job, C.; Côme, D.; Job, D. Sugarbeet seed priming: Effects of priming conditions on germination, solubilization of 11-S globulin and accumulation of LEA proteins. Seed Sci. Res. 2000, 10, 243–254. [Google Scholar] [CrossRef]
  31. Curtis, O.F.; Shetty, K. Growth medium effects on vitrification, total phenolics, chlorophyll, and water content of in vitro propagated oregano clones. Acta Hortic. 1996, 426, 489–503. [Google Scholar] [CrossRef]
  32. Mathis, W.T. Report on potassium and sodium in plants. J. AOAC Int. 1956, 39, 419–423. [Google Scholar] [CrossRef]
  33. Limin, Y.; Mei, H.; Guangsheng, Z.; Jiandong, L. The changes in water-use efficiency and stoma density of Leymus chinensis along northeast china transect. Acta Ecol. Sin. 2007, 27, 16–23. [Google Scholar] [CrossRef]
  34. Hothorn, T.; Bretz, F.; Westfall, P. Simultaneous inference in general parametric models. Biom. J. 2008, 50, 346–363. [Google Scholar] [CrossRef] [Green Version]
  35. Kassambara, A.; Mundt, F. Factoextra: Extract and Visualize the Results of Multivariate Data Analysis. R Package Version 1.0.7. Available online: https://CRAN.R-project.org/package=factoextra (accessed on 19 August 2022).
  36. Kolde, R. Pretty Heatmaps. R Package Version 1.0.10. Available online: https://CRAN.R-project.org/package=pheatmap (accessed on 23 September 2022).
  37. Soltis, P.S.; Marchant, D.B.; van de Peer, Y.; Soltis, D.E. Polyploidy and genome evolution in plants. Curr. Opin. Genet. Dev. 2015, 35, 119–125. [Google Scholar] [CrossRef] [PubMed] [Green Version]
  38. Parisod, C.; Holderegger, R.; Brochmann, C. Evolutionary consequences of autopolyploidy. New Phytol. 2010, 186, 5–17. [Google Scholar] [CrossRef] [PubMed]
  39. Chao, D.Y.; Dilkes, B.; Luo, H.; Douglas, A.; Yakubova, E.; Lahner, B.; Salt, D.E. polyploids exhibit higher potassium uptake and salinity tolerance in arabidopsis. Science 2013, 341, 658–659. [Google Scholar] [CrossRef] [Green Version]
  40. Munns, R.; James, R.A. Screening methods for salinity tolerance: A case study with tetraploid wheat. Plant Soil 2003, 253, 201–218. [Google Scholar] [CrossRef]
  41. Skorupa, M.; Gołȩbiewski, M.; Kurnik, K.; Niedojadło, J.; Kȩsy, J.; Klamkowski, K.; Wójcik, K.; Treder, W.; Tretyn, A.; Tyburski, J. Salt stress vs. salt shock—The case of sugar beet and its halophytic ancestor. BMC Plant Biol. 2019, 19, 57. [Google Scholar] [CrossRef] [Green Version]
  42. Pinheiro, C.; Ribeiro, I.C.; Reisinger, V.; Planchon, S.; Veloso, M.M.; Renaut, J.; Eichacker, L.; Ricardo, C.P. Salinity effect on germination, seedling growth and cotyledon membrane complexes of a portuguese salt marsh wild beet ecotype. Theor. Exp. Plant Physiol. 2018, 30, 113–127. [Google Scholar] [CrossRef]
  43. Meratan, A.A.; Ghafari, S.M.; Niknam, V. Effects of salinity on growth, proteins and antioxidant enzymes in three Acanthophyllum species of different ploidy levels. J. Sci. JSUT 2008, 33, 1–8. [Google Scholar]
  44. Agarwal, S.; Pandey, V. Antioxidant enzyme responses to NaCl stress in Cassia angustifolia. Biol. Plant 2004, 48, 555–560. [Google Scholar] [CrossRef]
  45. Jamil, M.; Rha, E.-S. The effect of salinity (NaCI) on the germination and seedling of sugar beet (Beta vulgaris L.) and cabbage (Brassica oleracea L.). Korean J. Plant Res. 2004, 7, 226–232. [Google Scholar]
  46. Koevoets, I.T.; Venema, J.H.; Elzenga, J.T.M.; Testerink, C. Roots withstanding their environment: Exploiting root system architecture responses to abiotic stress to improve crop tolerance. Front. Plant Sci. 2016, 7, 1335. [Google Scholar] [CrossRef] [Green Version]
  47. Rewald, B.; Shelef, O.; Ephrath, J.E.; Rachmilevitch, S. Adaptive plasticity of salt-stressed root systems. In Ecophysiology and Responses of Plants under Salt Stress; Springer: New York, NY, USA, 2012; pp. 169–201. [Google Scholar]
  48. Flowers, T.J.; Colmer, T.D. Salinity tolerance in halophytes. New Phytol. 2008, 179, 945–963. [Google Scholar] [CrossRef] [PubMed]
  49. Aycan, M.; Baslam, M.; Asiloglu, R.; Mitsui, T.; Yildiz, M. Development of new high-salt tolerant bread wheat (Triticum aestivum L.) genotypes and insight into the tolerance mechanisms. Plant Physiol. Biochem. 2021, 166, 314–327. [Google Scholar] [CrossRef] [PubMed]
  50. Taghizadegan, M.; Toorchi, M.; Vahed, M.M.; Khayamim, S. Evaluation of sugar beet breeding populations based morpho-physiological characters under salinity stress. Pak. J. Bot. 2019, 51, 11–17. [Google Scholar] [CrossRef]
  51. Berkov, S.; Philipov, S. Alkaloid production in diploid and autotetraploid plants of Datura stramonium. Pharm. Biol. 2002, 40, 617–621. [Google Scholar] [CrossRef]
  52. Romero-Aranda, R.; Bondada, B.R.; Syvertsen, J.P.; Grosser, J.W. Leaf Characteristics and net gas exchange of diploid and autotetraploid citrus. Ann. Bot. 1997, 79, 153–160. [Google Scholar] [CrossRef]
  53. Dong, Y.; Fan, G.; Zhao, Z.; Deng, M. Transcriptome expression profiling in response to drought stress in Paulownia australis. Int. J. Mol. Sci. 2014, 15, 4583–4607. [Google Scholar] [CrossRef] [Green Version]
  54. Sattler, M.C.; Carvalho, C.R.; Clarindo, W.R. The polyploidy and its key role in plant breeding. Planta 2016, 243, 281–296. [Google Scholar] [CrossRef]
  55. Pekol, S.; Baloğlu, M.C.; Çelik Altunoğlu, Y. Evaluation of genotoxic and cytologic effects of environmental stress in wheat species with different ploidy levels. Turk. J. Biol. 2016, 40, 580–588. [Google Scholar] [CrossRef]
  56. Pegtel, D.M. Effect of ploidy level on fruit morphology, seed germination and juvenile growth in scurvy grass (Cochlearia officinalis L. s.l., Brassicaceae). Plant Species Biol. 1999, 14, 201–215. [Google Scholar] [CrossRef]
  57. Odat, N. Intraspecific genetic variation within and between improved cultivars and landraces of durum wheat in germination and root architectural traits under saline conditions. Int. J. Plant Biol. 2020, 11, 7413. [Google Scholar] [CrossRef]
  58. Yu, X.; Shi, P.; Hui, C.; Miao, L.; Liu, C.; Zhang, Q.; Feng, C. Effects of salt stress on the leaf shape and scaling of Pyrus betulifolia bunge. Symmetry 2019, 11, 991. [Google Scholar] [CrossRef] [Green Version]
  59. Wright, I.J.; Dong, N.; Maire, V.; Prentice, I.C.; Westoby, M.; Díaz, S.; Gallagher, R.V.; Jacobs, B.F.; Kooyman, R.; Law, E.A.; et al. Global climatic drivers of leaf size. Science 2017, 357, 917–921. [Google Scholar] [CrossRef] [PubMed] [Green Version]
  60. Niklas, K.J.; Christianson, M.L. Differences in the scaling of area and mass of Ginkgo biloba (Ginkgoaceae) Leaves and their relevance to the study of specific leaf area. Am. J. Bot. 2011, 98, 1381–1386. [Google Scholar] [CrossRef] [PubMed]
  61. Munns, R.; Termaat, A. Whole-plant responses to salinity. Aust. J. Plant Physiol. 1986, 13, 143–160. [Google Scholar] [CrossRef]
  62. Bernstein, N.; Silk, W.K.; Lauchli, A. Growth and development of sorghum leaves under conditions of NaCl stress. Planta 1993, 191, 433–439. [Google Scholar] [CrossRef]
  63. Negrão, S.; Schmöckel, S.M.; Tester, M. Evaluating physiological responses of plants to salinity stress. Ann. Bot. 2017, 119, 1–11. [Google Scholar] [CrossRef] [PubMed] [Green Version]
  64. Hannachi, S.; van Labeke, M.C. Salt stress affects germination, seedling growth and physiological responses differentially in eggplant cultivars (Solanum melongena L.). Sci. Hortic. 2018, 228, 56–65. [Google Scholar] [CrossRef]
  65. Olmos, E.; Hellín, E. Mechanisms of salt tolerance in a cell line of Pisum sativum: Biochemical and physiological aspects. Plant Sci. 1996, 120, 37–45. [Google Scholar] [CrossRef]
  66. Niknam, V.; Meratan, A.A.; Ghaffari, S.M. The effect of salt stress on lipid peroxidation and antioxidative enzymes in callus of two acanthophyllum species. In Vitro Cell. Dev. Biol.-Plant 2011, 47, 297–308. [Google Scholar] [CrossRef]
  67. Santangeli, M.; Capo, C.; Beninati, S.; Pietrini, F.; Forni, C. Gradual exposure to salinity improves tolerance to salt stress in rapeseed (Brassica napus L.). Water 2019, 11, 1667. [Google Scholar] [CrossRef] [Green Version]
  68. Ashraf, M.; Athar, H.R.; Harris, P.J.C.; Kwon, T.R. Some prospective strategies for improving crop salt tolerance. In Advances in Agronomy; Academic Press: Cambridge, MA, USA, 2008; Volume 97, pp. 45–110. [Google Scholar]
  69. Tester, M.; Davenport, R. Na+ tolerance and Na+ transport in higher plants. Ann. Bot. 2003, 91, 503–527. [Google Scholar] [CrossRef] [PubMed]
  70. Almeida, D.M.; Margarida Oliveira, M.; Saibo, N.J.M. Regulation of Na+ and K+ homeostasis in plants: Towards improved salt stress tolerance in crop plants. Genet. Mol. Biol. 2017, 40, 326–345. [Google Scholar] [CrossRef] [PubMed] [Green Version]
  71. Rana, M.M.; Takamatsu, T.; Baslam, M.; Kaneko, K.; Itoh, K.; Harada, N.; Sugiyama, T.; Ohnishi, T.; Kinoshita, T.; Takagi, H.; et al. Salt tolerance improvement in rice through Efficient SNP marker-assisted selection coupled with speed-breeding. Int. J. Mol. Sci. 2019, 20, 2585. [Google Scholar] [CrossRef] [Green Version]
  72. Xue, Z.-Y.; Zhi, D.-Y.; Xue, G.-P.; Zhang, H.; Zhao, Y.-X.; Xia, G.-M. Enhanced salt tolerance of transgenic wheat (Tritivum aestivum L.) expressing a vacuolar Na+/H+ antiporter gene with improved grain yields in saline soils in the field and a reduced level of leaf Na+. Plant Sci. 2004, 167, 849–859. [Google Scholar] [CrossRef]
  73. Genc, Y.; McDonald, G.K.; Tester, M. Reassessment of tissue Na+ concentration as a criterion for salinity tolerance in bread wheat. Plant Cell Environ. 2007, 30, 1486–1498. [Google Scholar] [CrossRef] [PubMed]
  74. Wu, G.Q.; Liang, N.; Feng, R.J.; Zhang, J.J. Evaluation of salinity tolerance in seedlings of sugar beet (Beta vulgaris L.) cultivars using proline, soluble sugars and cation accumulation criteria. Acta Physiol. Plant 2013, 35, 2665–2674. [Google Scholar] [CrossRef]
  75. Xue, H.; Zhang, F.; Zhang, Z.H.; Fu, J.F.; Wang, F.; Zhang, B.; Ma, Y. Differences in salt tolerance between diploid and autotetraploid apple seedlings exposed to salt stress. Sci. Hortic. 2015, 190, 24–30. [Google Scholar] [CrossRef]
  76. Comai, L. The Advantages and disadvantages of being polyploid. Nat. Rev. Genet. 2005, 6, 836–846. [Google Scholar] [CrossRef]
  77. Tsukaya, H. Controlling size in multicellular organs: Focus on the leaf. PLoS Biol. 2008, 6, e174. [Google Scholar] [CrossRef] [Green Version]
  78. Da Conceição Gomes, M.A.; Suzuki, M.S.; da Cunha, M.; Tullii, C.F. Effect of salt stress on nutrient concentration, photosynthetic pigments, proline and foliar morphology of Salvinia auriculata Aubl. Acta Limnol. Bras. 2011, 23, 164–176. [Google Scholar] [CrossRef] [Green Version]
  79. Bonales-Alatorre, E.; Shabala, S.; Chen, Z.H.; Pottosin, I. Reduced tonoplast fast-activating and slow-activating channel activity is essential for conferring salinity tolerance in a facultative halophyte, quinoa. Plant Physiol. 2013, 162, 940–952. [Google Scholar] [CrossRef] [PubMed] [Green Version]
  80. Giunta, F.; Motzo, R.; Deidda, M. SPAD Readings and associated leaf traits in durum qheat, barley and triticale cultivars. Euphytica 2002, 125, 197–205. [Google Scholar] [CrossRef]
  81. Kiani-Pouya, A.; Rasouli, F. The potential of leaf chlorophyll content to screen bread-wheat genotypes in saline condition. Photosynthetica 2014, 52, 288–300. [Google Scholar] [CrossRef]
  82. Mahlooji, M.; Seyed Sharifi, R.; Razmjoo, J.; Sabzalian, M.R.; Sedghi, M. Effect of salt stress on photosynthesis and physiological parameters of three contrasting barley genotypes. Photosynthetica 2018, 56, 549–556. [Google Scholar] [CrossRef]
  83. Siddiqui, M.H.; Mohammad, F.; Khan, M.N. Morphological and physio-biochemical characterization of Brassica juncea L. Czern. & Coss. genotypes under salt stress. J. Plant Interact. 2009, 4, 67–80. [Google Scholar] [CrossRef]
  84. Taïbi, K.; Taïbi, F.; Ait Abderrahim, L.; Ennajah, A.; Belkhodja, M.; Mulet, J.M. Effect of salt stress on growth, chlorophyll content, lipid peroxidation and antioxidant defence systems in Phaseolus vulgaris L. S. Afr. J. Bot. 2016, 105, 306–312. [Google Scholar] [CrossRef]
  85. Yang, C.; Zhao, L.; Zhang, H.; Yang, Z.; Wang, H.; Wen, S.; Zhang, C.; Rustgi, S.; von Wettstein, D.; Liu, B. Evolution of physiological responses to salt stress in hexaploid wheat. Proc. Natl. Acad. Sci. USA 2014, 111, 11882–11887. [Google Scholar] [CrossRef] [Green Version]
  86. Cuin, T.A.; Parsons, D.; Shabala, S. Wheat cultivars can be screened for NaCl Salinity tolerance by measuring leaf chlorophyll content and shoot sap potassium. Funct. Plant Biol. 2010, 37, 656–664. [Google Scholar] [CrossRef]
  87. Shahzad, M.; Saqib, Z.A.; Hafeez, F.; Bilal, M.; Khan, S.A.; Asad, S.A.; Akhtar, J. Growth-related changes in wheat (Triticum aestivum L.) genotypes grown under salinity stress. J. Plant Nutr. 2016, 39, 1257–1265. [Google Scholar] [CrossRef]
  88. Talebi, S.F.; Saharkhiz, M.J.; Kermani, M.J.; Sharafi, Y. Polyploidy increases tolerance to salt stress in anise hyssop (Agastache foeniculum [Pursh.] Kuntze). Caryologia 2021, 74, 33–41. [Google Scholar] [CrossRef]
  89. Khalid, M.F.; Hussain, S.; Anjum, M.A.; Ahmad, S.; Ali, M.A.; Ejaz, S.; Morillon, R. Better salinity tolerance in tetraploid vs diploid volkamer lemon seedlings is associated with robust antioxidant and osmotic adjustment mechanisms. J. Plant Physiol. 2020, 244, 153071. [Google Scholar] [CrossRef] [PubMed]
  90. Zheng, M.; Lin, J.; Liu, X.; Chu, W.; Li, J.; Gao, Y.; An, K.; Song, W.; Xin, M.; Yao, Y.; et al. Histone acetyltransferase TaHAG1 acts as a crucial regulator to strengthen salt tolerance of hexaploid wheat. Plant Physiol. 2021, 186, 1951–1969. [Google Scholar] [CrossRef] [PubMed]
  91. Wang, L.; Cao, S.; Wang, P.; Lu, K.; Song, Q.; Zhao, F.J.; Chen, Z.J. DNA Hypomethylation in tetraploid rice potentiates stress-responsive gene expression for salt tolerance. Proc. Natl. Acad. Sci. USA 2021, 118, e2023981118. [Google Scholar] [CrossRef] [PubMed]
Figure 1. Effects of salinity stress on growth performance of different ploidy level sugar beet plants (Beta vulgaris L.) in the seedling stage. (A) Germination percentage, (B) salt tolerance index (STI), (C) seedling height, and (D) root length. Germination percentage was determined on the fourth day after the study began, and seedling height and root length were measured in 14-day-old seedlings that were exposed to the salt stress from germination. Means (± standard deviation) within the same graph, followed by the Emmeans test and p-value adjusted by the Bonferroni method from five independent biological replicates (n = 5). Asterisk indicates that ns—non-significant; * significant at p ≤ 0.05; **** significant at p ≤ 0.0001.
Ijpb 14 00017 g001
Figure 2. Effects of salinity stress on growth performance of different ploidy level sugar beet plants (Beta vulgaris L.) at vegetative stage. (A) The general morphology of CVs. “Felicita” (2X), “Kassandra” (3X), and “AD-440” (4X) at 150 mM NaCl dose. Bar = 1.0 cm, (B) plant height, (C) root length, (D) leaf length, (E) leaf width, (F) leaf area, (G) plant fresh weight, (H) plant dry matter, and (I) tissue water content were measured in 42-day-old plants that were exposed to salt stress from germination. Means (± standard deviation) within the same graph followed by the Emmeans test and p-value adjusted by the Bonferroni method from five independent biological replicates (n = 5). Asterisk indicates that ns—non-significant; * significant at p < 0.05; ** significant at p < 0.005; *** significant at p < 0.001; **** significant at p < 0.0001.
Ijpb 14 00017 g002
Figure 3. Ion content of different ploidy level sugar beet plants (Beta vulgaris L.) at vegetative stage. (A) Shoot Na+ concentration, (B) shoot K+ concentration, (C) shoot Na+/K+ ratio, (D) root Na+ concentration, (E) root K+ concentration, and (F) root Na+/K+ ratio were measured in 42-day-old plants that were exposed to 0 mM, 50 mM, and 150 mM salt (NaCl) stress from germination. Means (± standard deviation) within the same graph followed by the Emmeans test and p -value adjusted by the Bonferroni method from five independent biological replicates (n = 5). Asterisk indicates that ns—non-significant; **** significant at p < 0.0001.
Ijpb 14 00017 g003
Figure 4. Effects of salinity stress on cytologic observation of different ploidy level sugar beet plants (Beta vulgaris L.) at the vegetative stage. (A) Microscopic observations of cell and stomas, (B) cell number, (C) cell area, (D) cell width/length index, (E) stoma numbers, (F) stoma area, (G) stoma width/length index were measured in 42-day-old plants that were exposed to 0 mM, 50 mM, and 150 mM salt (NaCl) stress from germination. Means (± standard deviation) within the same graph followed by the Emmeans test and p-value adjusted by the Bonferroni method from five independent biological replicates (n = 5). Asterisk indicates that ns—non-significant; * significant at p < 0.05; *** significant at p < 0.001; **** significant at p < 0.0001.
Ijpb 14 00017 g004
Figure 5. The evaluation of all traits and genotypes by principal component analysis (PCA) and hierarchical clustering analysis (HCA). (A) Principal component analysis (PCA) of diploid (2X), triploid, (3X), and tetraploid (4X) sugar beet (Beta vulgaris L.) genotypes subjected to 0 (control), 50, and 150 mM of NaCl (salt stress) treatments; (B) bi-plot analysis to check the effects of traits on the individuals; (C) hierarchical clustering analysis (HCA) visualized with a heatmap of 3 sugar beet genotypes under control and stress conditions. GP: Germination percentage, STI: salt tolerance index, SH: Seedling height, RLS: root content, CN: cell number, CL: cell length, CW: cell width, CA: cell area, CWLI: cell width/length index, length (Seedling), SHV: shoot height (Vegetative), RLV: root length (Vegetative), LL: leaf length, LW: leaf width, LA: leaf area, FW: fresh weight, DM: dry matter, TWC: tissue water content, TCC: total chlorophyll, SN: stoma number, SL: stoma length, SW: stoma width, SA: stoma area, SWLI: stoma width/length index, SNa: shoot Na+ concentration, SK: shoot K+ concentration, SnaK: Shoot Na+/K+ ratio, Rna: root Na+ concentration, RK: root K+ concentration, and RNaK: root Na+/K+ ratio, clusters (I–VI and A–B). Means (±standard deviation) within the same graph followed by letters are significantly different at p < 0.05 according to Tukey HSD test from three to five independent biological replicates (n = 5).
Ijpb 14 00017 g005
Table 1. ANOVA analysis of genotype and environment on traits. Numbers represent mean square; G—genotype; E—environment; *** significant at p < 0.001; ns—non-significant.
TraitsGEG × ETraitsGEG × E
Germination percentage7717 ***4667 ***288 ***Cell width568.8 ***446.1 ***408 ***
Salt tolerance index0.1188 ***1.3898 ***0.032 ***Cell area6,776,725 ***2,001,220 ***3,508,768 ***
Seedling height 42.1 ***13.73 ***1 ***Cell width/length index0.02721 ***0.12722 ***0.02318 ***
Root length (Seedling)3.1 ***13.862 ***0.183 ***Stoma number312.2 ***27.8 ***214.3 ***
Shoot height (Vegetative)508.9 ***209.1 ***1.5 ***Stoma length641.6 ***8.3 ***51.8 ***
Root length (Vegetative)166.98 ***161.05 ***1.46 ***Stoma width55.02 ***18.29 ***3.29 ***
Leaf length15.857 ***17.698 ***1.11 ***Stoma area544,287 ***10,374 ***31741 ***
Leaf width5.892 ***4.995 ***0.193 ***Stoma width/length index0.17251 ***0.04782 ***0.04855 ***
Leaf area232.18 ***282.82 ***29.97 ***Shoot Na+ concentration2.42 ***73 ***2.38 ***
Fresh weight118.08 ***86.01 ***2.51 ***Shoot K+ concentration1.054 ***14.97 ***0.288 ***
Dry matter15.203 ***4.034 ***0.487 ***Shoot Na+/K+ ratio3.237 ***24.274 ***1.412 ***
Tissue water content71.35 ***53.59 ***2.67 ***Root Na+ concentration1.646 ***23.704 ***0.487 ***
Total chlorophyll content1,312,252 ***216,895 ***1559 nsRoot K+ concentration1.712 ***25.227 ***0.493 ***
Cell number14,739 ***10,633 ***1463 ***Root Na+/K+ ratio0.438 ***4.057 ***0.132 ***
Cell length2181.8 ***73 ***552.4 ***
Disclaimer/Publisher’s Note: The statements, opinions and data contained in all publications are solely those of the individual author(s) and contributor(s) and not of MDPI and/or the editor(s). MDPI and/or the editor(s) disclaim responsibility for any injury to people or property resulting from any ideas, methods, instructions or products referred to in the content.

