Article

Rhizopus oryzae Inulinase Production and Characterization with Application in Chicory Root Saccharification

by
Asmaa Abdella
1,*,
Mahmoud Al-Saman
1,
Fatma I. Abou-Elazm
2 and
Shaymaa Wagdy El-Far
3
1
Department of Industrial Biotechnology, Genetic Engineering and Biotechnology Research Institute, University of Sadat City, Sadat City 32897, Egypt
2
Department of Microbiology and Immunology, Faculty of Pharmacy, Misr University for Science and Technology, Giza 32361, Egypt
3
Division of Pharmaceutical Microbiology, Department of Pharmaceutics and Industrial Pharmacy, College of Pharmacy, Taif University, P.O. Box 11099, Taif 21944, Saudi Arabia
*
Author to whom correspondence should be addressed.
Microbiol. Res. 2023, 14(1), 297-315; https://doi.org/10.3390/microbiolres14010024
Submission received: 31 December 2022 / Revised: 7 February 2023 / Accepted: 17 February 2023 / Published: 20 February 2023

Abstract

:
The objective of this study was to create a fermentation process for the production of inulinase, an important enzyme with numerous applications in the food and pharmaceutical industries, using low-cost agricultural waste as substrates for Rhizopus oryzae NRRL 3563. High titer inulinase production in chicory roots by Rhizopus oryzae in a submerged culture was accomplished using a statistical experimental design. A two-level Plackett–Burman design followed by a three-level Box–Behnken design producing a high inulinase titer of 1085.11 U/mL, 2.83-fold the maximum level, was obtained in the screening experiment. The optimal levels were as follows: chicory root, 10 g/L; NaNO3, 5 g/L; and KCl, 0.2 g/L. The produced inulinase enzyme was purified using 70% ammonium sulfate precipitation and ultra-filtration causing 3.63-fold purification with 60% activity recovery. The enzyme had a molecular weight of approximately 130 KDa. The purified enzyme showed optimum activity at 50 °C and pH 6.0. The pH stability range was three to six and the temperature stability was up 70 °C. The purified inulinase could hydrolyze inulin and sucrose, but not cellobiose or soluble starch. Km and Vmax for inulin were determined to be 0.8 mg/mL and 50,000 U/mg, respectively. The two-level Plackett–Burman design was applied followed by a Box–Behnken model for optimization of fermentation conditions. Accordingly, the optimal combination of fermentation was a reaction time of seven hours, a temperature of 60 °C, and an enzyme concentration of 40,000 U/mL, which resulted in a 58.07% saccharification yield. The characteristics of the enzyme and its kinetic parameters suggested that it was highly effective in the fermentation of inulin and inulin-containing substrates. Additionally, it raises the potential of using inulinase enzymes in pharmaceutical and food industries.

1. Introduction

Inulin is the carbohydrate that is most frequently found in plants after starch. It is a fructan found in the roots and tubers of many plants, including Jerusalem artichokes, chicory, leeks, garlic, asparagus, dandelion, and camas. It is primarily composed of -(21)-D-fructosyl-fructose linkages that are terminated by a sucrose residue [1]. Inulin is hydrolyzed by two types of inulinases: exoinulinase (β-D-fructohydrolase, EC 3.2.1.80) and endoinulinase (2,1-β-D-fructan fructanohydrolase, EC 3.2.1.7) [2]. Inulin is hydrolyzed by exoinulinases at its terminal ends, yielding fructose and a glucose molecule. Endoinulinases break down inulin’s intrinsic -2,1 glycosidic linkage to produce fructooligosaccharides with a variable chain length [3].
Inulinases are employed in the manufacturing of high-fructose syrups, a crucial sweetener. As it has positive benefits for diabetic people, fructose is a safe substitute for sucrose as a sweetener [4]. Due to the absence of toxic byproducts, such as difructose anhydride, the enzymatic synthesis of fructose is advantageous. Inulinase breaks down inulin enzymatically to produce 95% pure fructose and fructo-oligosaccharides. [5]. Additionally, inulinases have been employed to create inulo-oligosaccharides, which are low-calorie saccharides that act as growth factors for beneficial microbes in the gut flora [6]. The generation of bioethanol from inulin is another application of inulinases [7]. Additionally, pullulan, sorbitol, single cell oil, gluconic acid, lactic acid, and citric acid have all been produced using inulinases [8].
Fungal strains are promising candidates for the production of inulinase enzymes due to their ability to grow on inexpensive substrates and their enzyme stability at high temperatures and low pH [9]. Fungi such as Aspergillus, Rhizopus, Penicillium, and Kluyveromyces are efficient producers of inulinase enzymes [10]. A potential source of thermotolerant enzymes is the thermophilic fungus Paecilomyces variotii. It is the asexual state of Byssochlamys spectabilis, a member of the Phylum Ascomycota (family Trichocomaceae) [11]. Paecilomyces can grow in a variety of temperatures and surfaces and it sporulates at a rapid rate. Its rapid multiplication guarantees the viable and reasonable development of commercial formulations [12].
A wide range of substrates were utilized in the production of inulinases. Inulin and inulin-rich raw materials are mostly utilized as a carbon source in submerged fermentation. [13]. As pure inulin is expensive, microbial inulinase is produced using alternate, more affordable raw substrates that include inulin [14]. There have been reports of inulinase production using a variety of low-cost substrates, including agave [15], wheat bran, rice bran, banana peel, and orange peel [16].
There are few reports on production of inulinase from Rhizopus oryzae. In this study, we enhanced the production of inulinase enzymes from Rhizopus oryzae on an inexpensive substrate, such as chicory root. In order to accomplish this, the concentrations of the significant components were optimized using the response surface methodology (RSM), which also allowed for a reduction in experimental units while still providing precise results in comparison to those obtained using univariate strategies [17]. Purification and characterization of the produced inulinase enzymes were further goals of this investigation. We also optimized the saccharification of chicory root using a response surface approach.

2. Materials and Methods

2.1. Cultures and Media

Aspergillus niger NRRL 3122, Aspergillus oryzae NRRL 2217, Rhizopus oryzae NRRL 3563, and Pacilomyces variotii NRRL 1115 used in this study were obtained from the Agricultural Research Service (ARS) culture collection (Peoria, IL, USA). These cultures were maintained by sub-culturing them every 4 weeks on potato-dextrose-agar (PDA) slants at 4 °C. Spore suspension was made by scraping spores from 7-day PDA slants that had been incubated at 30 °C with 10 mL of distilled water, resulting in a final concentration of approximately 2 × 10⁶ spores/mL. Oat and wheat bran were obtained from local markets. Chicory root was obtained from a local market, washed, air dried, and ground into fine powder. All carbon, nitrogen sources, vitamins, minerals, and chemicals were purchased from Acros-Organics (Fisher Chemical, Cairo, Egypt).

2.2. Culture Screening for Enzyme Production

The fermentation was performed in 250-mL flask containing 50 mL of medium containing (g/L): inulin, 10; K2HPO4, 1; MgSO4·7H2O, 0.5; NaNO3, 1.5; KCI, 0.5; FeSO4·7H2O, 0.1; (NH4) H2PO4, 2. The medium pH was adjusted to 6.5 using 1 M NaOH and sterilized by autoclaving at 121 °C, 204.7 kPa for 30 min. A total of 0.3 mL of spore suspension (2 × 10⁶ spores/mL) was used to inoculate the medium, which was then incubated for 12 days at 30 °C with 200 rpm of agitation. On the 2nd, 4th, 6th, and 8th days, broth samples were collected in triplicate and analyzed for inulinase after the mycelia were filtered out.

2.3. Effect of Different Carbon Sources

The effect of the carbon source on inulinase production was evaluated by using chicory root, orange peel, wheat bran, glucose, fructose, oat bran, inulin, and sucrose as different carbon sources at a concentration of 10 g/L. Chicory root was obtained from the garden of Sadat City University and was ground into a fine powder. Wheat bran and oat bran were obtained from a supermarket and were used unaltered. Glucose, fructose, inulin, and sucrose were obtained from (Sigma-Aldrich, Cairo, Egypt).

2.4. Multifactorial Experiments for Optimizing Inulinase Production

Optimization of inulinase production was achieved by using a sequential optimization strategy. In the first phase, components that affected inulinase production by Rhizopus oryzae were screened and identified (Section 2.5). In the second phase, the concentrations of the most significant factors were ascertained (Section 2.6).

2.5. Screening of Variables Influencing the Production of Inulinase Enzyme

A Plackett–Burman design [18] was used in the initial stage to screen and identify the most significant elements (medium components) influencing inulinase production. Plackett–Burman cannot be used to measure how different components interact. When it is uncertain which factors are most likely to have an impact on the dependent variable, this design is particularly helpful for screening a large number of variables. A 9-factor, 2-level Plackett–Burman design was used in this study. Nine factors, including chicory root, K2HPO4, MgSO4·7H2O, NaNO3, KCI, FeSO4·7H2O, (NH4)·H2PO4, temperature, and pH, were screened in 12 experimental trials. Table 1 demonstrates the factors analyzed and the level of each factor used in the experimental design. All experiments were performed for 6 days in duplicate and the mean of the inulinase activity was taken as the response (dependent variable). The main effect of each factor was calculated as the difference between the means of inulinase activity measured in cultivations using +1 (high concentration) and −1 (low concentrations).
A first-order polynomial linear model, as shown in the following equation, was applied to fit the Plackett–Burman design:
Y = βo + Σ βiXi
where Y is the response (inulinase activity (U/mL)), βo is the model intercept, βi is the linear coefficient for each factor, and Xi is the coded independent variable (level of each factor).
The magnitude of the coefficient βi and whether it was positive or negative showed the impact of the corresponding factor on inulinase production. The data were fitted in the model using JMP Pro 13 (SAS, Cary, NC, USA) at a significant level of p < 0.05. Using the Box–Behnken design, the significant factors were considered for further optimization.

2.6. Optimization of Significant Variables Using Box–Behnken Design

Response surface methodology (RSM) was used to further improve the factors from the Plackett–Burman design that were found to have a significant impact on inulinase production. [19]. The design consists of 15 experiments with 3 factors (KCI, NaNO3, and chicory roots) and 3 different levels (−1, 0, and 1). The optimal level of each factor for inulinase synthesis was then calculated using SAS JMP version 13 after the data were fitted into a second-order polynomial equation (SAS Institute, Cary, NC, USA). The following quadratic equation was fitted to inulinase production using multiple regression and the least squares method:
Y = βo + Σ βiXi + Σ βijXi Xj+ Σ βiiXi
where Y is the predicted response (inulinase activity); o, i, ii, ij, are the regression coefficients of the intercept, linear, quadratic, and interaction terms, respectively; and Xi and Xj are the coded independent variables (level of each factor). Using JMP Pro 13, the data were fitted into the model at a significance level of p < 0.05.

2.7. Analytical Methods

Inulinase activity was measured using a 1% inulin suspension (techno pharma Chem, India) prepared in 0.5 mL of 0.2 M sodium acetate buffer (pH 6.5). The suspension was mixed with 0.5 mL of buffer-diluted enzyme extract. After 20 min of incubation at 50 °C, the reaction mixture was stopped by adding 0.5 mL of the 3,5-dinitrosalicylic acid (DNS) reagent. Following the addition of DNS, the mixture was heated in a water bath for 5 min before being cooled to room temperature. The absorbance was measured at 575 nm in comparison to a blank without any enzyme. [20]. The inulinase activity was defined as the number of enzymes that releaseed 1 μmol of fructose per min. A pre-weighed filter (P8 Fisherbrand, 11 cm, Fisher Scientific, Waltham, MA, USA) was used to filter 50 mL of the culture for dry-weight measurements. The filter was then rinsed with distilled water and dried to a consistent weight at 60 °C. Using a Bradford protein assay kit (AGD Biomedicals -India) and bovine serum albumin as the standard, the total protein content was measured [21].

2.8. Purification of Inulinase

The precipitate was dissolved in 10 mL of 0.2 M sodium acetate buffer (pH 6.5) after centrifugation at 10,000 rpm for 20 min. It was then dialyzed against the same buffer for 48 h. Ammonium sulphate was added slowly with stirring to the crude enzyme to give 70% saturation at 4 °C and was allowed to stir for 60 min. The enzyme was then left to stand for 24 h at 4 °C. After centrifugation at 10,000 rpm for 20 min, the precipitate was dissolved in 10 mL of 0.2 M sodium acetate buffer (pH 6.5). It was then dialyzed against the same buffer for 48 h. After that, Amicon Ultra centrifugal filters 100 KDa MWCO were used to concentrate the clear supernatant. SDS-PAGE was used to verify the purity.

2.9. Characterization of Inulinase

The molecular weight of inulinase was estimated by 12% sodium dodecyl sulphate-polyacrylamide gel (SDS-PAGE) using standard protein markers (IRIS11Prestained Protein Ladder (IRIS11#PMI11-0500), (3–260) KDa, Bio-Helix, USA. The gel was stained with Coomassie Brilliant Blue R-250 [22]. To determine optimum temperature, inulinase activity was measured at temperatures ranging from 30 °C to 90 °C in 0.2 M sodium acetate buffer at pH 6.5. To determine the optimum pH, inulinase activity was measured at 50 °C in sodium acetate buffer at pH 3 to 6 and phosphate buffer at pH 7 and 9. Temperature stability was determined by measuring the residual activity after incubating the enzyme in 0.2 M sodium acetate buffer pH 6.5 at various temperatures (30–90 °C) for 120 min. The pH stability was determined by measuring the remaining activity after incubating the enzyme in series of buffers at a pH range of 3 to 9 at 4 °C for 24 h. Substrate specificity for purified inulinase was investigated by incubation of 0.5 mL of appropriately diluted enzyme solution with 0.5 mL of each substrate in 0.2 M sodium acetate buffer pH 6.5 at 50 °C for 30 min. Then, the measurements of the total amount of reducing sugars released from 1% polysaccharides (inulin and soluble starch) and glucose released from 10 mM (sucrose and cellobiose) were undertaken using DNS. The initial hydrolysis rate of inulin at different substrate concentrations (0.5, 1, 2, 5 and 10 mg/mL) prepared in 0.2 M sodium acetate buffer pH 6.5 at 50 °C was used to study the enzyme kinetics. The Michaelis constant (Km) and maximum velocity (Vmax) values were calculated according to Lineweaver and Burk by linear regression from double-reciprocal plots [23].

2.10. Fermentation of Chicory Root Using Produced Inulinase Enzyme

Powdered chicory root was suspended in 0.2 M acetate buffer and was hydrolyzed by its incubation with inulinase enzymes under the conditions indicated in the experimental design. Samples were taken from each reaction mixture at intervals indicated in the experimental design and boiled for 5 min to terminate the reaction. The hydrolyzed solutions were centrifuged at 11,000 rpm for 15 min. The reducing sugar present in the supernatant was measured using DNS. The saccharification yield percentage was calculated based on the amount of the reducing sugars (RS) obtained in the hydrolysate divided by the total sugar present in chicory root as shown in the following Equation [24]:
Saccharification yield (%) = RS(g) × 100/total sugar
Total sugar in the hydrolysate was assayed according to Scott and Melvin [25]. All samples, enzyme blanks, and substrate blanks were tested in duplicate.

2.11. Multifactorial Experiments for Fermentation of Chicory Root Using Produced Inulinase Enzyme

2.11.1. Screening of Factors Affecting Inulinase Production

The Plackett–Burman design [18] was employed to screen and determine the most important factors that influenced the saccharification yield percentage of chicory root. Six factors, including pH, temperature, time, substrate concentration, enzyme concentration, and agitation, were screened in 12 experimental trials. Each factor was examined at 2 levels. Table 2 illustrates the examined factors, as well as the levels of each factor used in the experimental design. All experiments were carried out in duplicate and the mean of the saccharification yield percentage was taken as the response (dependent variable). The magnitude and the ranking of each variable in the Plackett–Burman design were estimated by statistical analyses of the data. The main effect of each variable was calculated as the difference between the average of saccharification yield percentage at the high value (+) and at the low value (−).

2.11.2. Optimization of Significant Variables Using Box–Behnken Design

The variables with significant effects on the saccharification yield percentage, as identified by the Plackett–Burman design, were further optimized using a response surface (Box–Behnken design) (Box and Behnken, [19]). The design consists of 25 experiments where significant variables were tested at 3 levels and in multiple combinations with the other parameters.

3. Results and Discussion

3.1. Screening for Inulinase Producing Strains

The screening results of the four fungal strains (Aspergillus niger NRRL 3122 Aspergillus oryzae NRRL 2217, Rhizopus oryzae NRRL 3563, and Pacilomyces variotti NRRL 1115) for cell biomass, total protein, and inulinase production at different times in shake flask fermentations are shown in Table 3. It is clear that Rhizopus oryzae NRRL 3563 on the sixth day gave the highest inulinase activity (380 ± 15 U/mL), followed by Aspergillus niger NRRL 3112 which produced inulinase activity (135 ± 9.3 U/mL). Filamentous fungi are critical producers of many commercial enzymes and organic compounds. Fungal-based systems have several advantages over bacterial-based systems for protein production because high-level secretion of enzymes is a common trait of their decomposer lifestyle [26]. The results are in good agreement with Yazici et al., [27] who stated that Rhizopus oryzae was reported to be a potential source of inulinase enzyme production under batch fermentation mode, yielding 348.36 U/mL and a specific activity of 3621.78 U/mg. Gupta et al. [28] asserted that Aspergillus niger and Rhizopus oryzae are important inulinase enzyme producers.

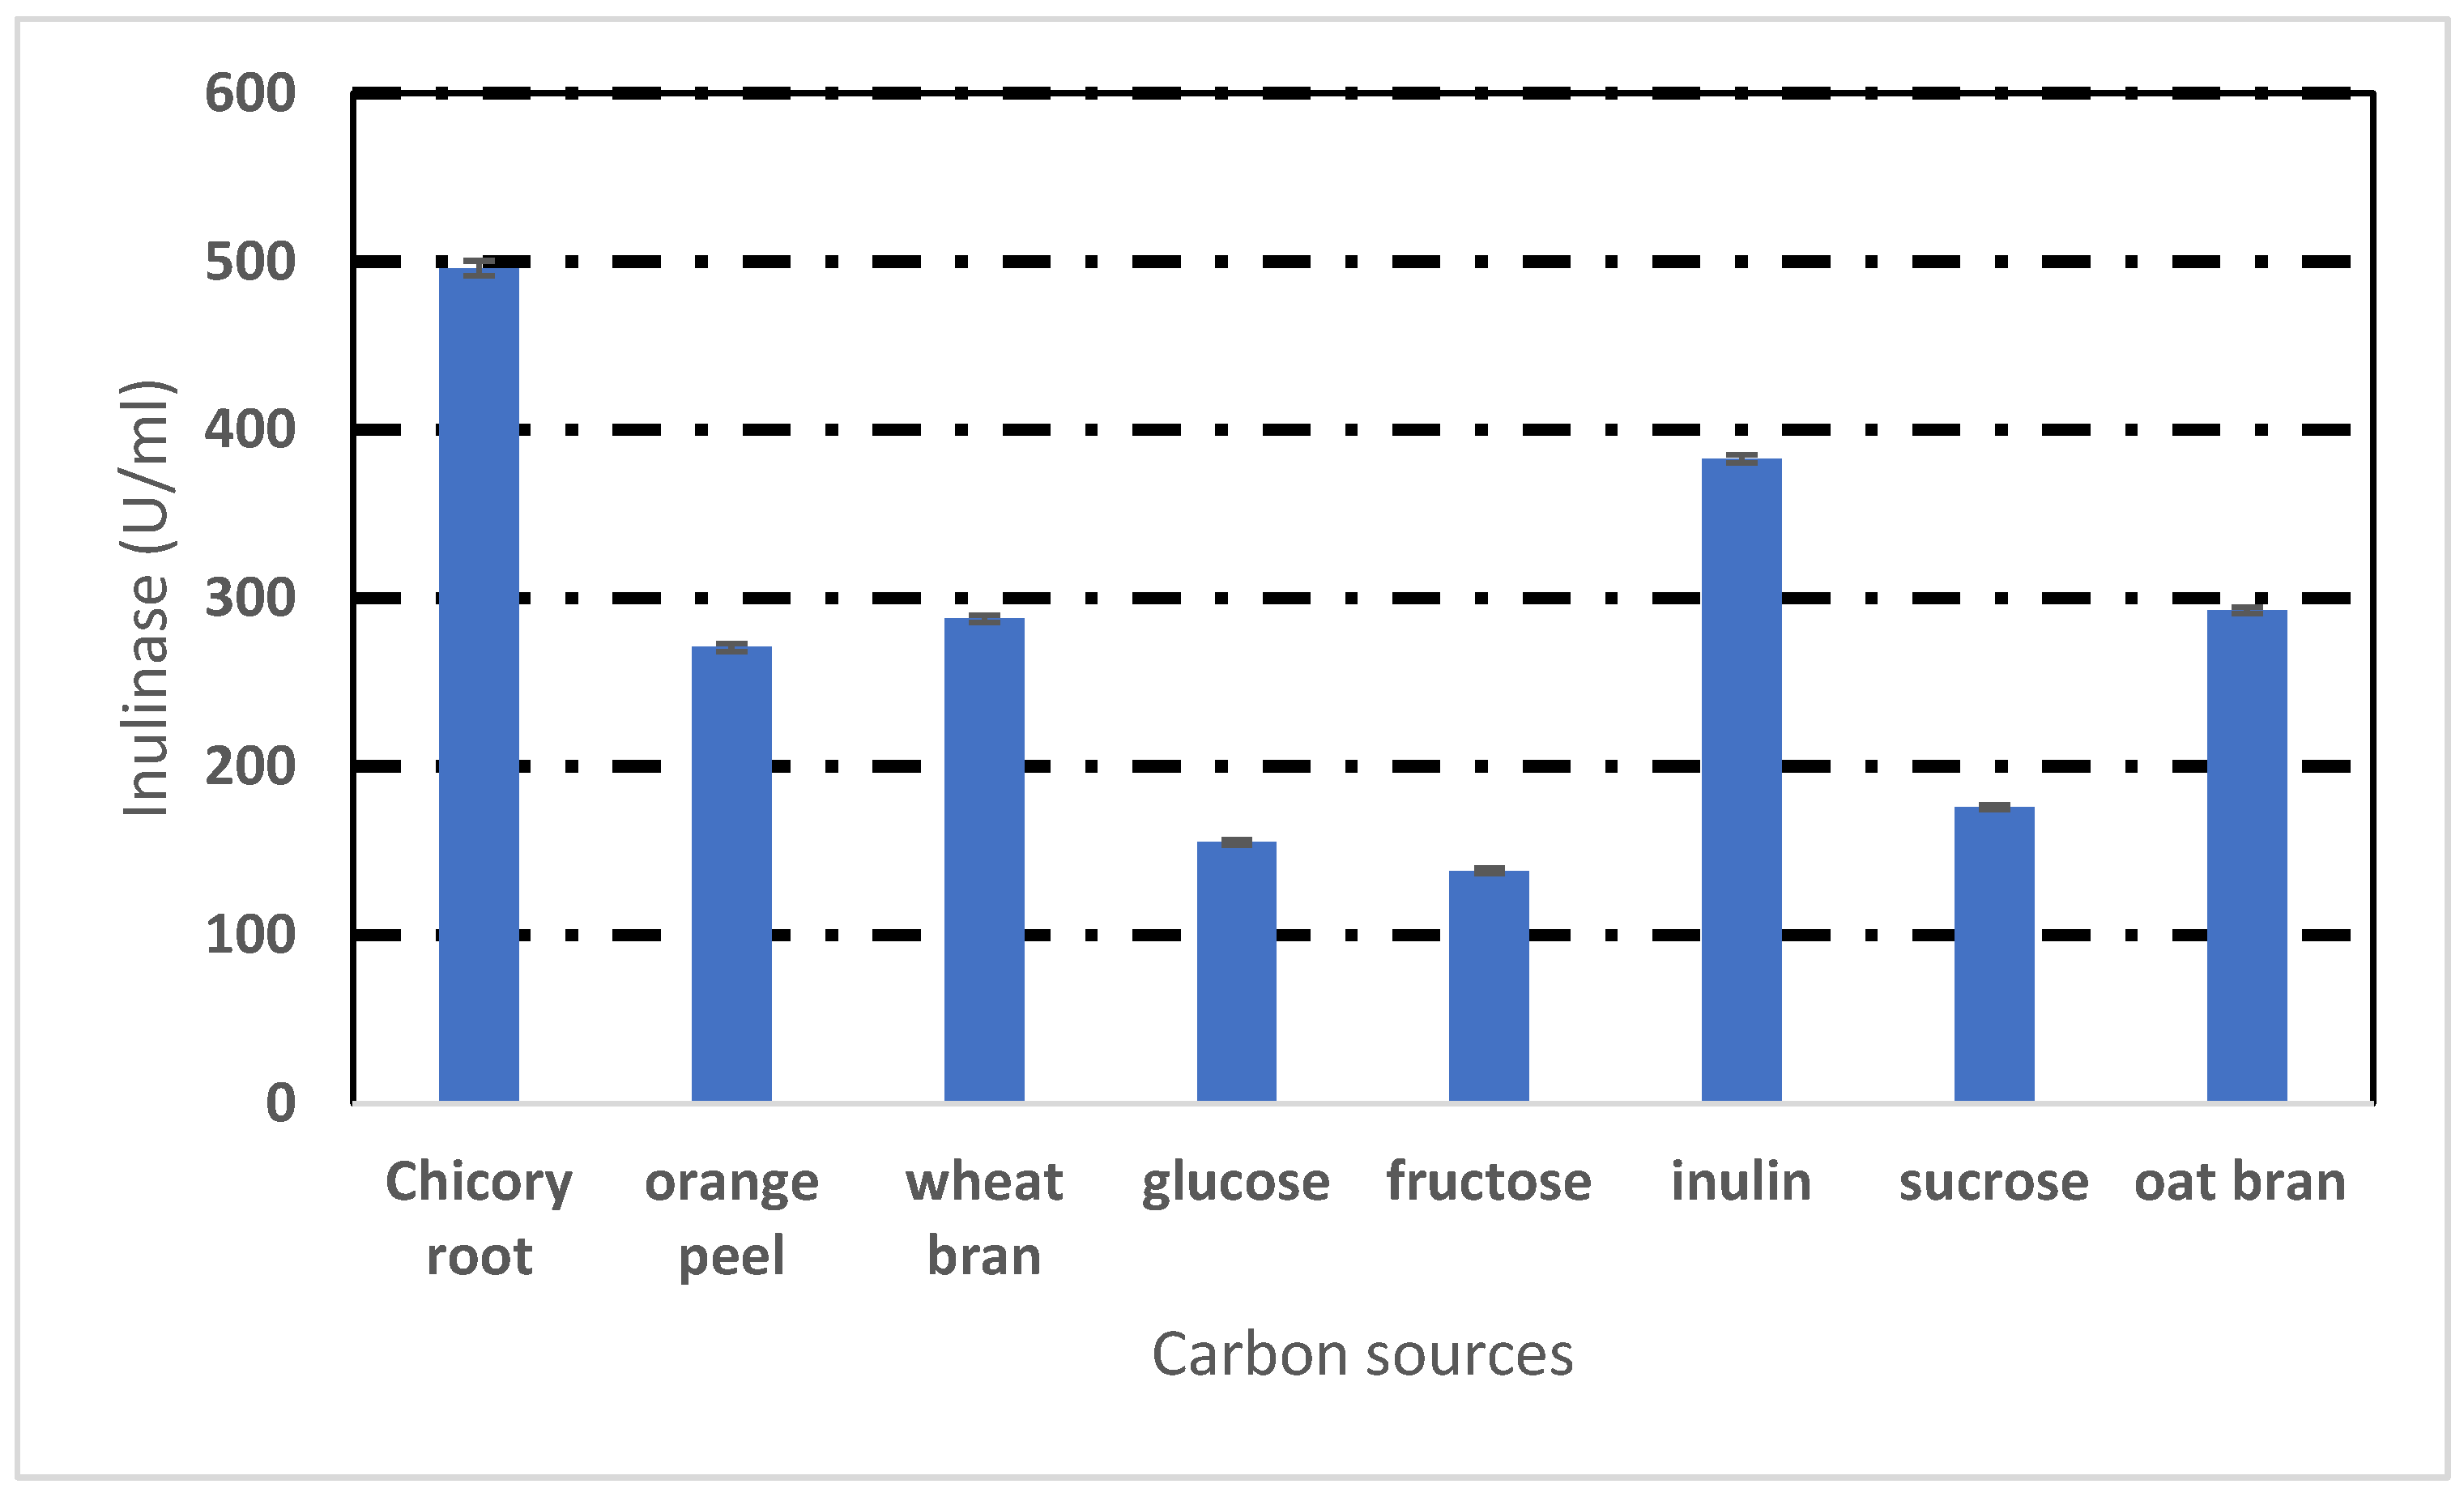
3.2. Effect of Different Carbon Sources on Inulinase Production by Rhizopus oryzae NRRL 3563

Inulinase production can vary extensively because its biosynthesis depends on the utilized carbon source [29]. The study of inulinase synthesis by Rhizopus oryzae NRRL 3563 cultured on various carbon sources (10 g/L) are compared in Figure 1. As can be observed, chicory root had the highest inulinase output (496 U/mL) followed by inulin (383 U/mL). Chicory root is made up of fructans polymers, which have a linear chain and range in size from 3 to 29 units of fructose. Its composition suggests that it might provide a good substrate for the synthesis of inulinase [30].
The high inulinase production reported with inulin is due to the induction of inulinase enzyme production by inulin as a potent and specific substrate for it [31]. There was also high inulinase activity in wheat bran (288 U/mL), orange peel (271 U/mL), and oat bran (293 U/mL). This may be explained by the fact that all of these waste products from agriculture and food production are basic substrates that contain proteins, cellulose, starch, and minerals that may be able to promote the production of enzymes. The fact that inulin serves as both a source of nutrients and a support matrix for promoting fungal adhesion may further contribute to the high inulinase production. A. niger mycelia had developed in the shake flask cultures as spherical pellets of varying diameters, depending on the carbon sources. Oat bran, wheat bran, and orange peel were insoluble particles that might increase with the mixing turbulence, which would improve aeration and cause larger pellets to break. Due to greater surface area, smaller pellets enhanced mass transfer, cell proliferation, and enzyme synthesis [32,33].
The lowest inulinase activity (155 and 138) U/mL was obtained with glucose and fructose, respectively, as the carbon source. Inulinase production has been reported to be attributed to catabolite repression by free sugars [34].

3.3. Multifactorial Designs for Optimizing Inulinase Production

3.3.1. Screening of Significant Variables Using the Plackett–Burman Design

The wide variation of inulinase activity measured in the Plackett–Burman experiment, ranging from 131.46–657.16 U/mL, is shown in Table 4, which highlights the significance of modifying medium composition to achieve higher inulinase activity. The linear correlation model that describes the correlation between the nine factors (chicory root, K2HPO4, NaNO3, KCL, FeSO4, NH4H2PO4, Temp, and pH) and the inulinase activity is as follows:
Inulinase activity (U/mL) = 1006.41 + −31.083 × chicory root + 40.555 × K2HPO4 + 122.33 × NaNO3 + −138.809 × KCL + −12.35 × FeSO4 + −8.23 × NH4H2PO4 + 6.54 × Temp + −30.32 × pH
The values for the variables in the equation are the concentrations used in each experiment.
The parameter estimates for each factor. Temperature, NaNO3, K2HPO4, and other variables all had positive effects on the synthesis of inulinase are displayed in Table 5, meaning that inulinase production increased as these variables’ concentrations increased. In contrast, chicory root, KCl, and pH had a negative impact on inulinase production, indicating that as their concentrations increased, inulinase production was suppressed.
Variables with a confidence level above 95% (p < 0.05) were regarded as significant factors in the Plackett–Burman statistical analysis. Table 5 shows that the most impacting factors were chicory root, KCl, and NaNO3, with p values of 0.0022, 0.034, and 0.032, respectively. The Plackett–Burman model had an R2 value of 0.94, indicating a reasonable and dependable fit. The concentrations of chicory root, KCl, and NaNO3 were determined to be the major significant factors studied on the synthesis of fungal inulinase based on the Plackett–Burman design results and they were chosen for further optimization using the Box–Behnken design.

3.3.2. Optimization of Medium Components Using Box–Behnken Design

The Box–Behnken design matrix is shown in Table 6. The experimental inulinase activity and the predicted inulinase activity were compared after each factor was evaluated at three different levels (−1, 0, and 1).
The wide variation of inulinase activity measured in the Box–Behnken experiment, ranging from 560–1075 U/mL, highlights the significance of different levels of chicory root and NaNO3 in achieving higher inulinase activity.
The following equation displays the Box–Behnken design’s second-order polynomial model.
Inulinase activity (U/mL) = 1582.66 + 390.37 × chicory root + −49.25 × NaNO3 + 15.125 × KCL + 71.25 (chicory root × NaNO3) + 9 (chicory root × KCL) − 29.5 (NaNO3 × KCL) + −94.45833 (chicory root × chicory root)
The values for the variables in the equation are the concentrations used in each experiment.
Table 7 contains the calculated coefficients for the linear, quadratic, and interaction factors. The model and coefficients were deemed significant if p < 0.05. Chicory root and NaNO3 both have significant p values of <0.0001 and 0.0082, respectively (Table 7). The sole significant interaction term was chicory root × NaNO3. A significant quadratic term was chicory root × chicory root. Additionally, the model’s p value was less than 0.0001, demonstrating the model’s accuracy in predicting inulinase activity.
The optimal conditions were found to be chicory root, 10 g/L; NaNO3, 5 g/L; KCL, 0.2 g/L; K2HPO4, 1 g/L; temp, 30 °C; and pH 6.5, which yielded an inulinase activity of 1085 U/mL.
From the RSM results, both carbon and nitrogen sources acted as limiting substrates and changes in their concentration affected inulinase production [35]. Fungi, being heterotrophs, obtain their required nutrients from the organic matter in the environment through the presence of efficient and extensive systems of powerful enzymes. Thus, they are able to utilize complex carbon sources as their energy source. The nitrogen source is an essential material for the growth of photosynthetic microorganisms. Its main function is to synthesize nitrogen-containing substances in cells [36].

3.4. Model Validation

Experimental verification and comparison of the optimal conditions obtained from the optimization experiment with the model’s predicted values are demonstrated in Table 6. The polynomial model’s predicted value of 1075 U/mL was equivalent to the mean inulinase yield that was obtained experimentally, which was 1085 U/mL. The determination coefficient was used to evaluate the goodness of fit (R2). In this instance, the investigated conditions had an R2 value of 0.99, indicating that the response model can account for 99% of the overall variation in the data. Additionally, it demonstrated how any two variables’ relative effects change while the third is held constant. At the 5% level, linear, cross product, and quadratic terms were all significant. Consequently, the quadratic model was chosen. Compared to the screening media, inulinase production increased by 283%.

3.5. Comparison of Optimization of Inulinase Production by Rhizopus oryzaei NRRL 3563 with other Fungi

The Rhizopus oryzae NRRL 3563 strain used in this study produced higher amounts of inulinase activity after medium optimization than most other organisms reported in the literature (Table 8). Aspergillus tamarii AR-IN9 achieved 71.97 U/mL inulinase activity and with a productivity of 24 U/mL/day on 1% dahlia tubers [5]. Skowronek et al. [37] optimized a medium and cultivation for Aspergillus niger 13/36 using the simplex method, which resulted in a maximum activity of 80 U/mL and productivity of 20 U/mL/day. Abou-Taleb et al. [38] used a Taguchi orthogonal array (TOA) design to optimize production of inulinase from Candida oleophila cultivated on a medium with 1% chicory root and achieved an activity of 46.38 U/mL. More recently, Singh and Chauhan [2] optimized production of inulinase from Penicillium oxalicum grown on 2% inulin and achieved an activity of 11.06 U/mL. Furthermore, Kluyveromyces marxianus achieved 129.21 U/mL inulinase activity and with a productivity of 32.3 U/mL/day on a medium with 3% chicory root [39].

3.6. Purification of Inulinase Enzyme

According to Table 9, following optimization the inulinase enzyme activity produced in the shake flask was 1085 U/mL. By precipitating the enzyme in an 70% saturated ammonium sulphate solution, the enzyme was purified. By using ultra-filtration, the precipitated enzyme was concentrated (Amicon Ultra-100 KDa, Millipore). The enzyme activity was 26,065 U/mL upon purification. With a 60% inulinase yield, the purification technique resulted in a 3.63-fold improvement in purity (recovery). Purification of enzymes is crucial for the meaningful interpretation of the results. The presence of other enzymes of the same group may interfere while studying the kinetic parameters, regarding stability against various denaturants and activators [40]. The purified enzyme fraction has a specific enzyme activity of 21,950 U/mg protein. In comparison to most documented literature, the specific activity is higher [41,42,43,44].

3.7. Characterization of Partially Purified Inulinase Enzyme

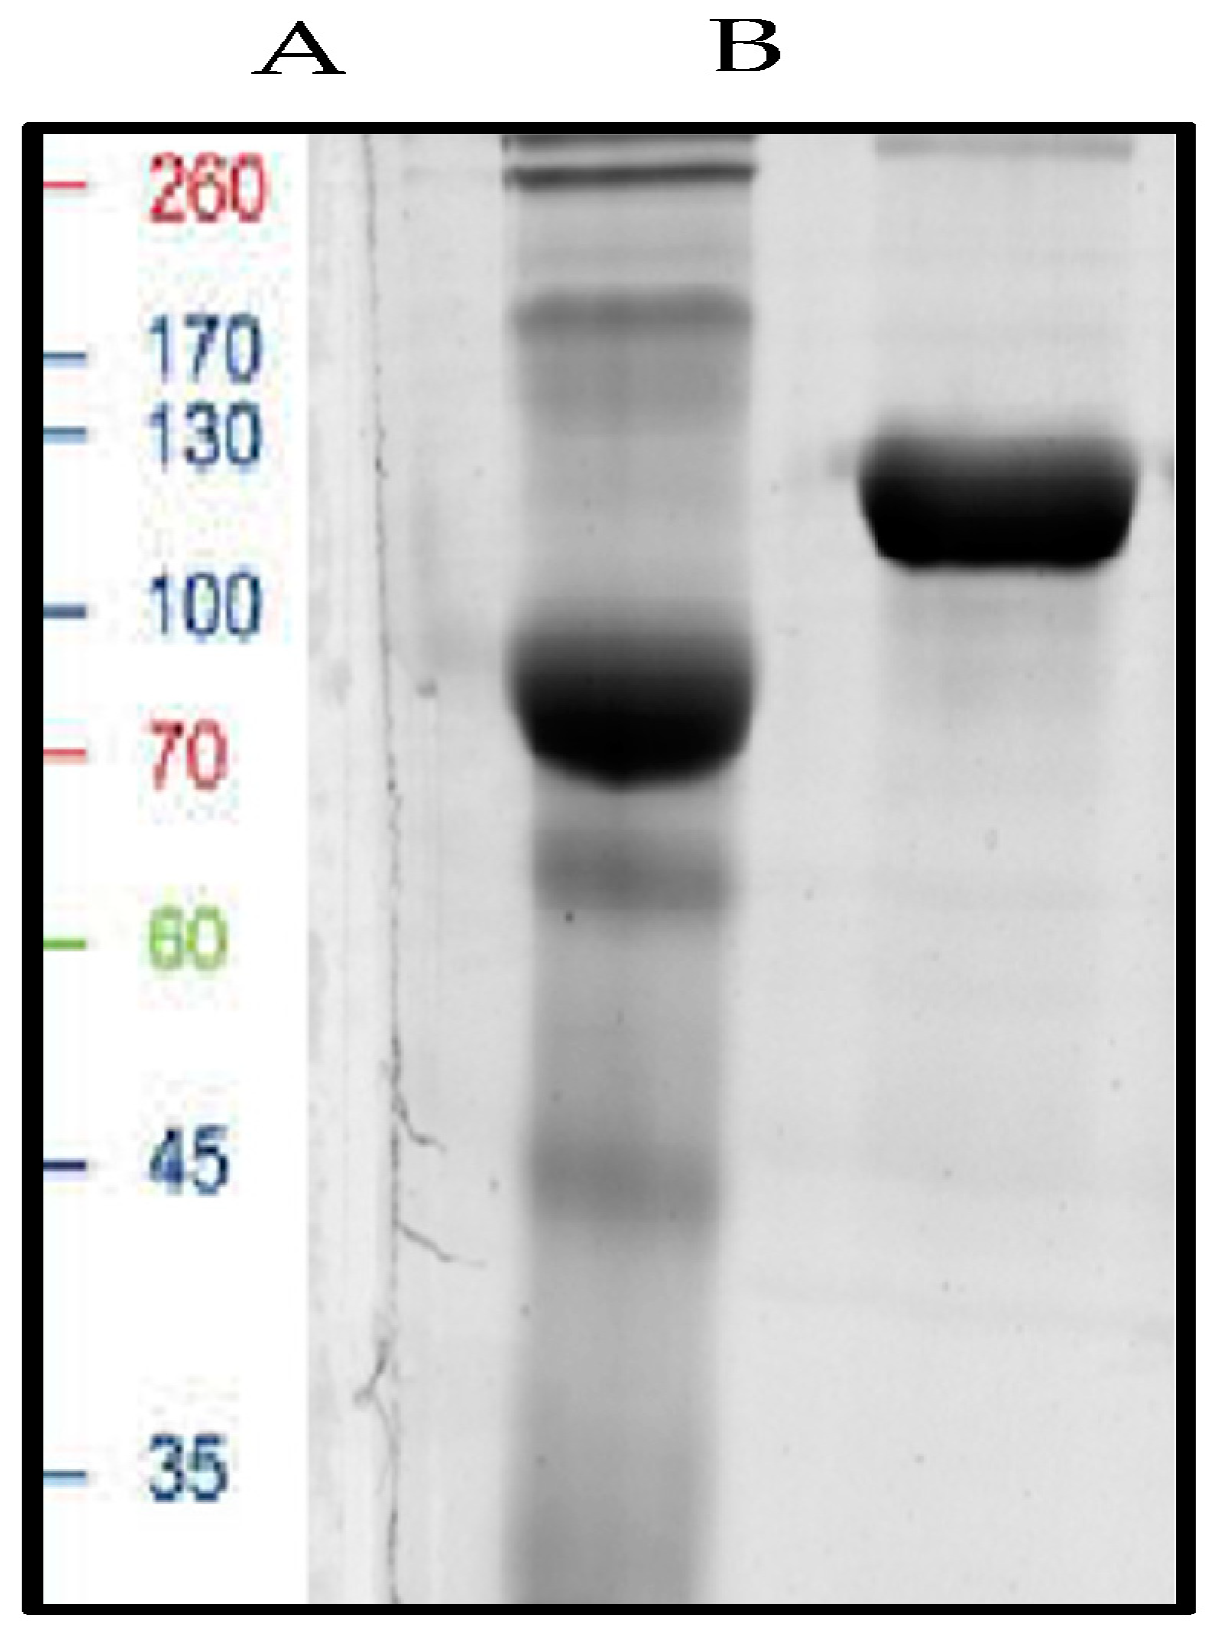
3.7.1. Molecular Determination

Purified inulinase migrated as a single band on SDS-PAGE, suggesting that the purified inulinase was a monomer consisting of a single polypeptide chain. The molecular weight of the inulinase was nearly 130 KDa (Figure 2). These results agree with Cho and Yun et al. [45] who reported that the molecular weight of fungal inulinases ranges between 30 and 175 KDa. Exoinulinase was produced from Aspergillus tamarii-U4 using kaolin clay as a carbon source, and had a molecular weight of 66 KDa [34]. Endoinulinase was produced from Rhizopus oligosporus NRRL 2710 using dry artichoke leaves as a carbon source, and had a molecular weight of 76 KDa [10]. Endoinulinase was produced from Xanthomonas campestris using inulin as a carbon source, and had a molecular weight of 55 KDa [46].

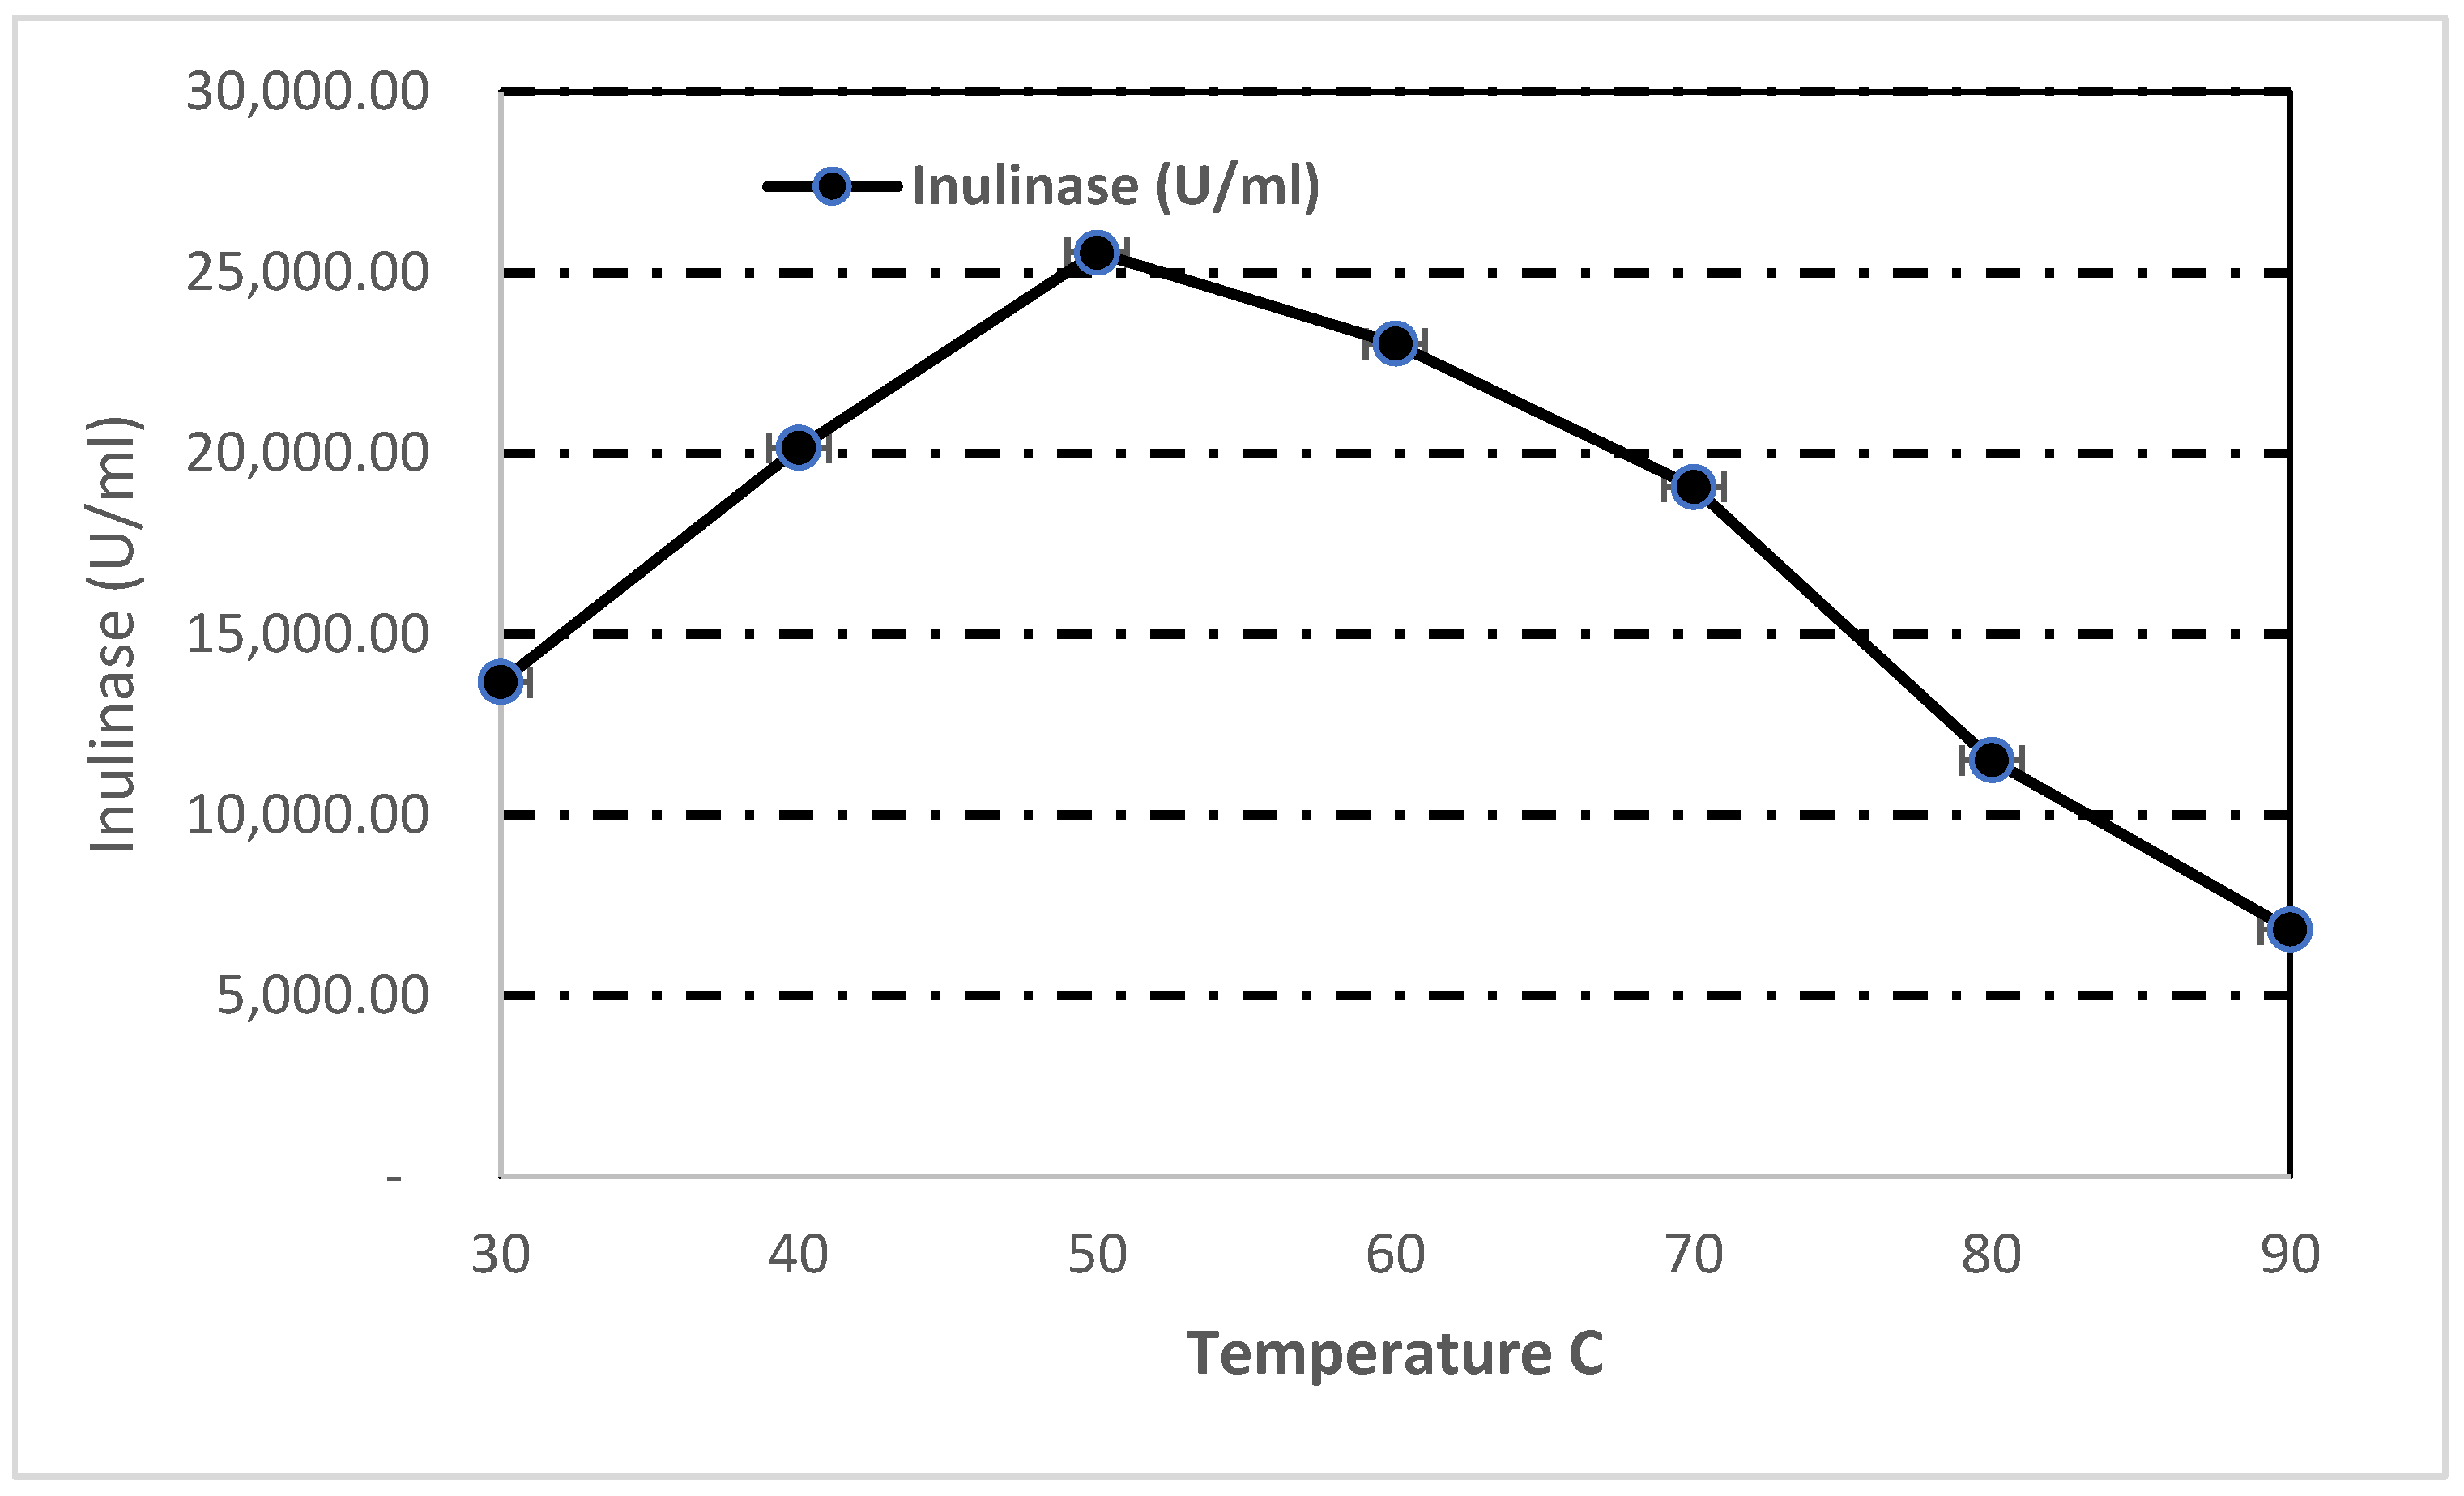
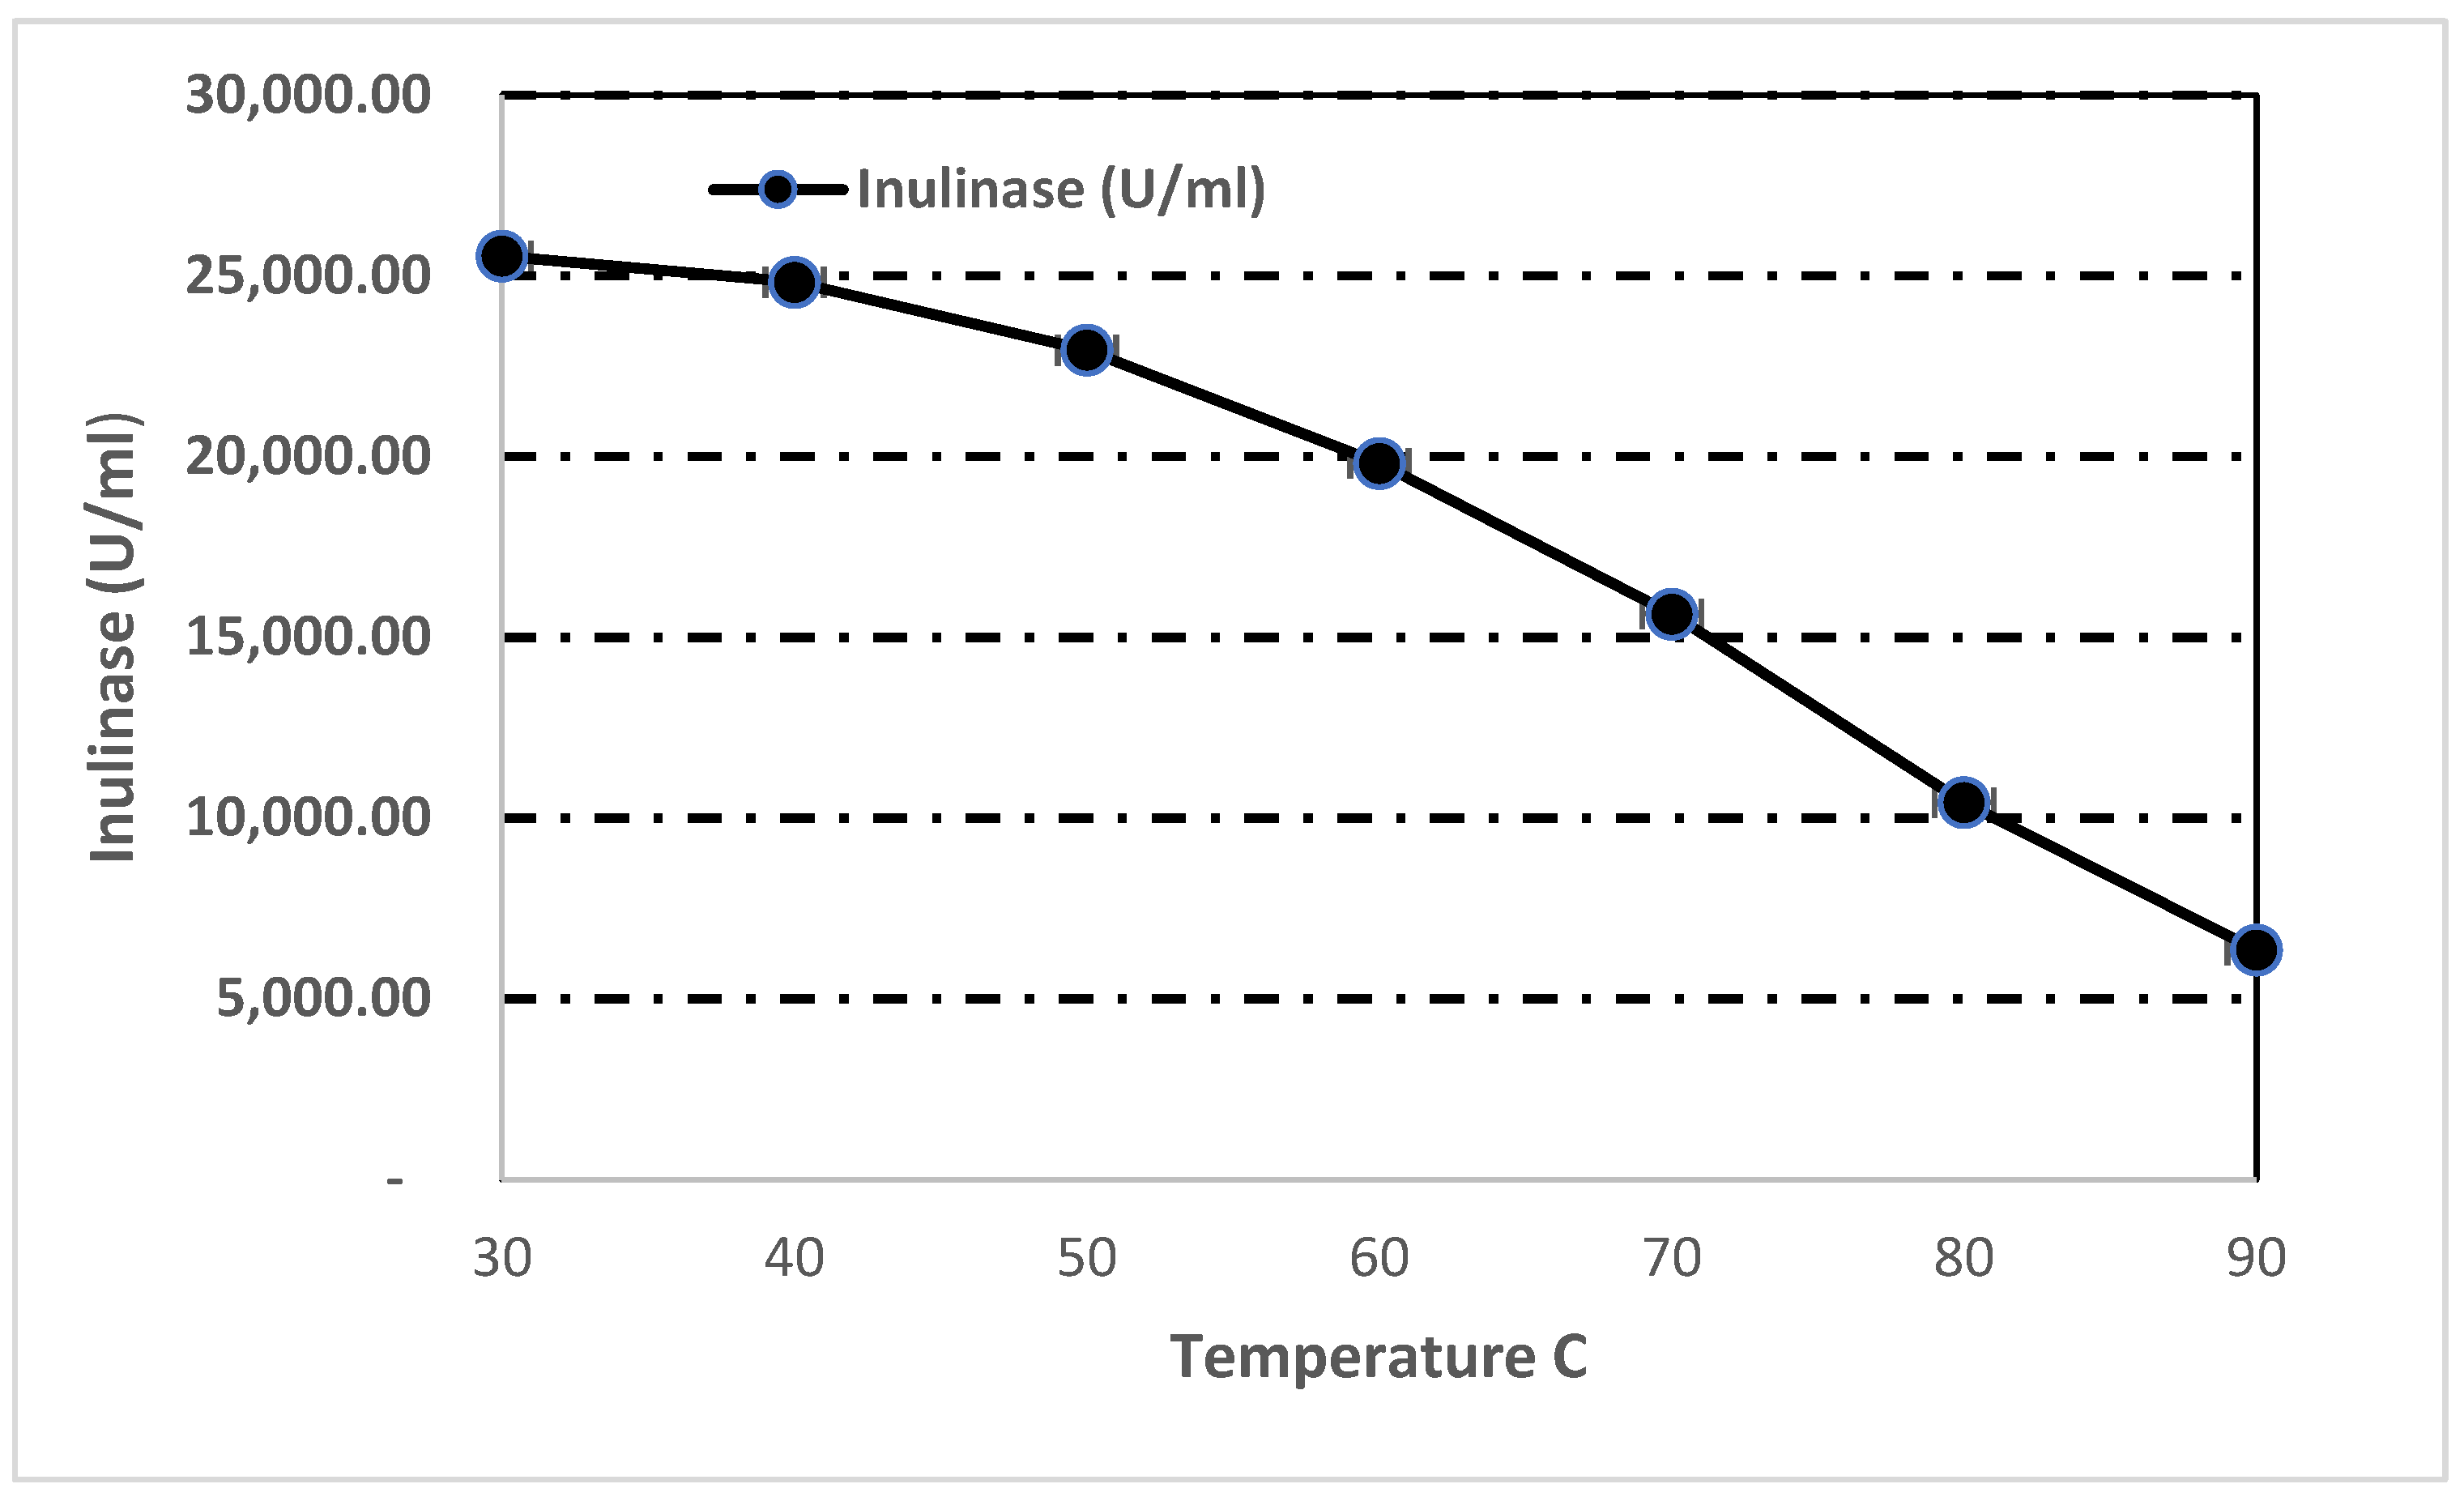
3.7.2. Effect of Temperature on Inulinase Activity and Stability

The enzyme activity increased as temperature increased, reaching a maximum activity at 50 °C. Activity then declined at 60, 70, 80, and 90 °C, reaching 90, 74, 45, and 26 % of its maximum activity (Figure 3). The observed optimum temperature lies in the same range (50–60 °C) of most reported inulinase produced by filamentous fungi. The optimum temperature of the exo-inulinase enzyme produced from Aspergillus tamarii-U4 was at 60 °C [34]. Huitro’n et al. [29] reported that the maximum activity of exo-inulinase produced from Aspergillus niger CH-A-2010 was at 50 °C. Nascimento et al. [47] reported that the maximum activity of inulinase produced from fungal endophyte CCMB 328 was at 48 °C. Abu El-souod et al. [48] reported that the maximum activity for U. atrum inulinase activity was reached at 36 °C.
Regarding thermal stability, 97% of enzyme activity was retained after incubation for 30 min at 40 °C. Furthermore, (90, 77, 61, 41, and 24) % of activity was retained after incubation for two hours at (50, 60, 70, 80, and 90) °C, respectively (Figure 4). Our strain is relatively stable compared with inulinase produced from other filamentous fungi. Saber and El-Naggar [5] produced inulinase from Aspergillus tamarii which had temperature stability of 75% at 50 °C for 90 min. Germec and Turhan [44] produced inulinase enzymes from Aspergillus niger which retained only 21.8% of activity at 60 °C for six hours. Garuba et al. [49] reported that extracellular inulinase produced by Penicilium citrinum had temperature stability of only 22% after incubation at 65 °C for three hours.
Abdella et al. [50] stated that intermolecular bonds, such as hydrogen and disulfide bonds, as well as molecular interactions such as electrostatic and hydrophobic interactions, are all related to thermal stability. In industrial applications, especially when biomass is being hydrolyzed at high temperatures, thermal stability is necessary. For the commercial manufacture of fructooligosaccharides and fructose from inulin, inulinases with an optimal temperature greater than 50 °C are a crucial component because high temperatures enable correct inulin solubility and also guard against microbial contamination [51].

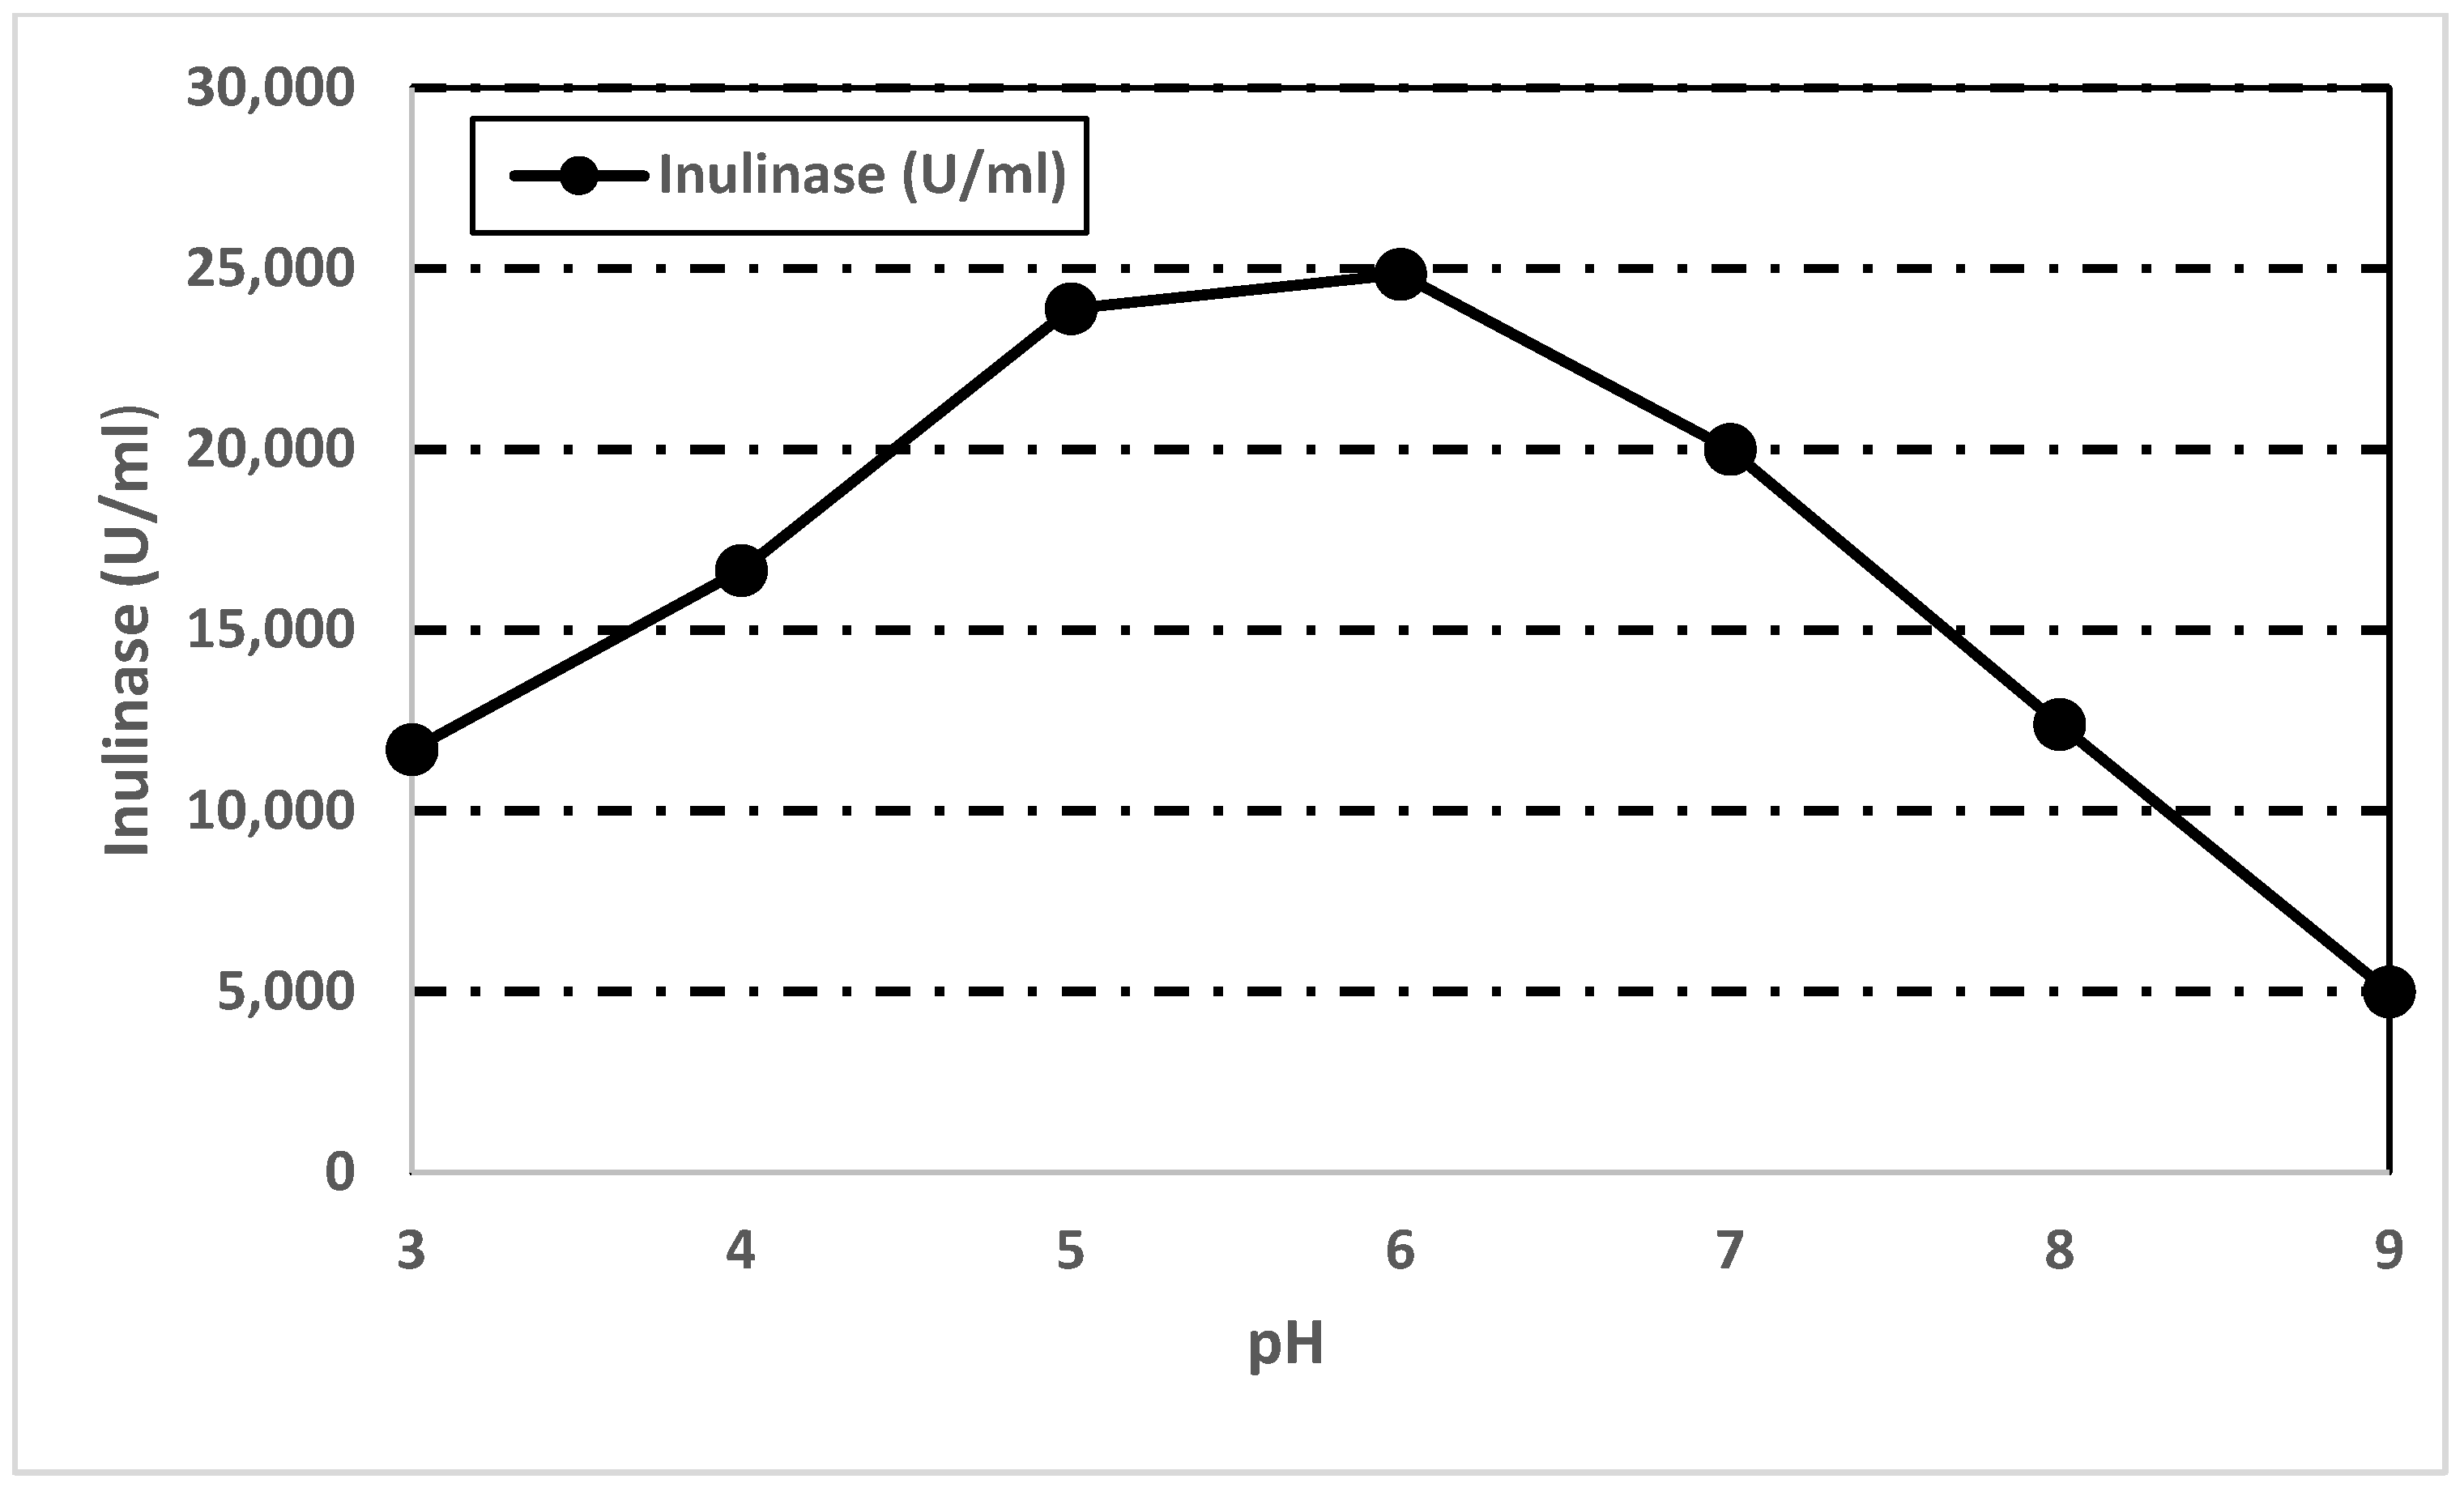
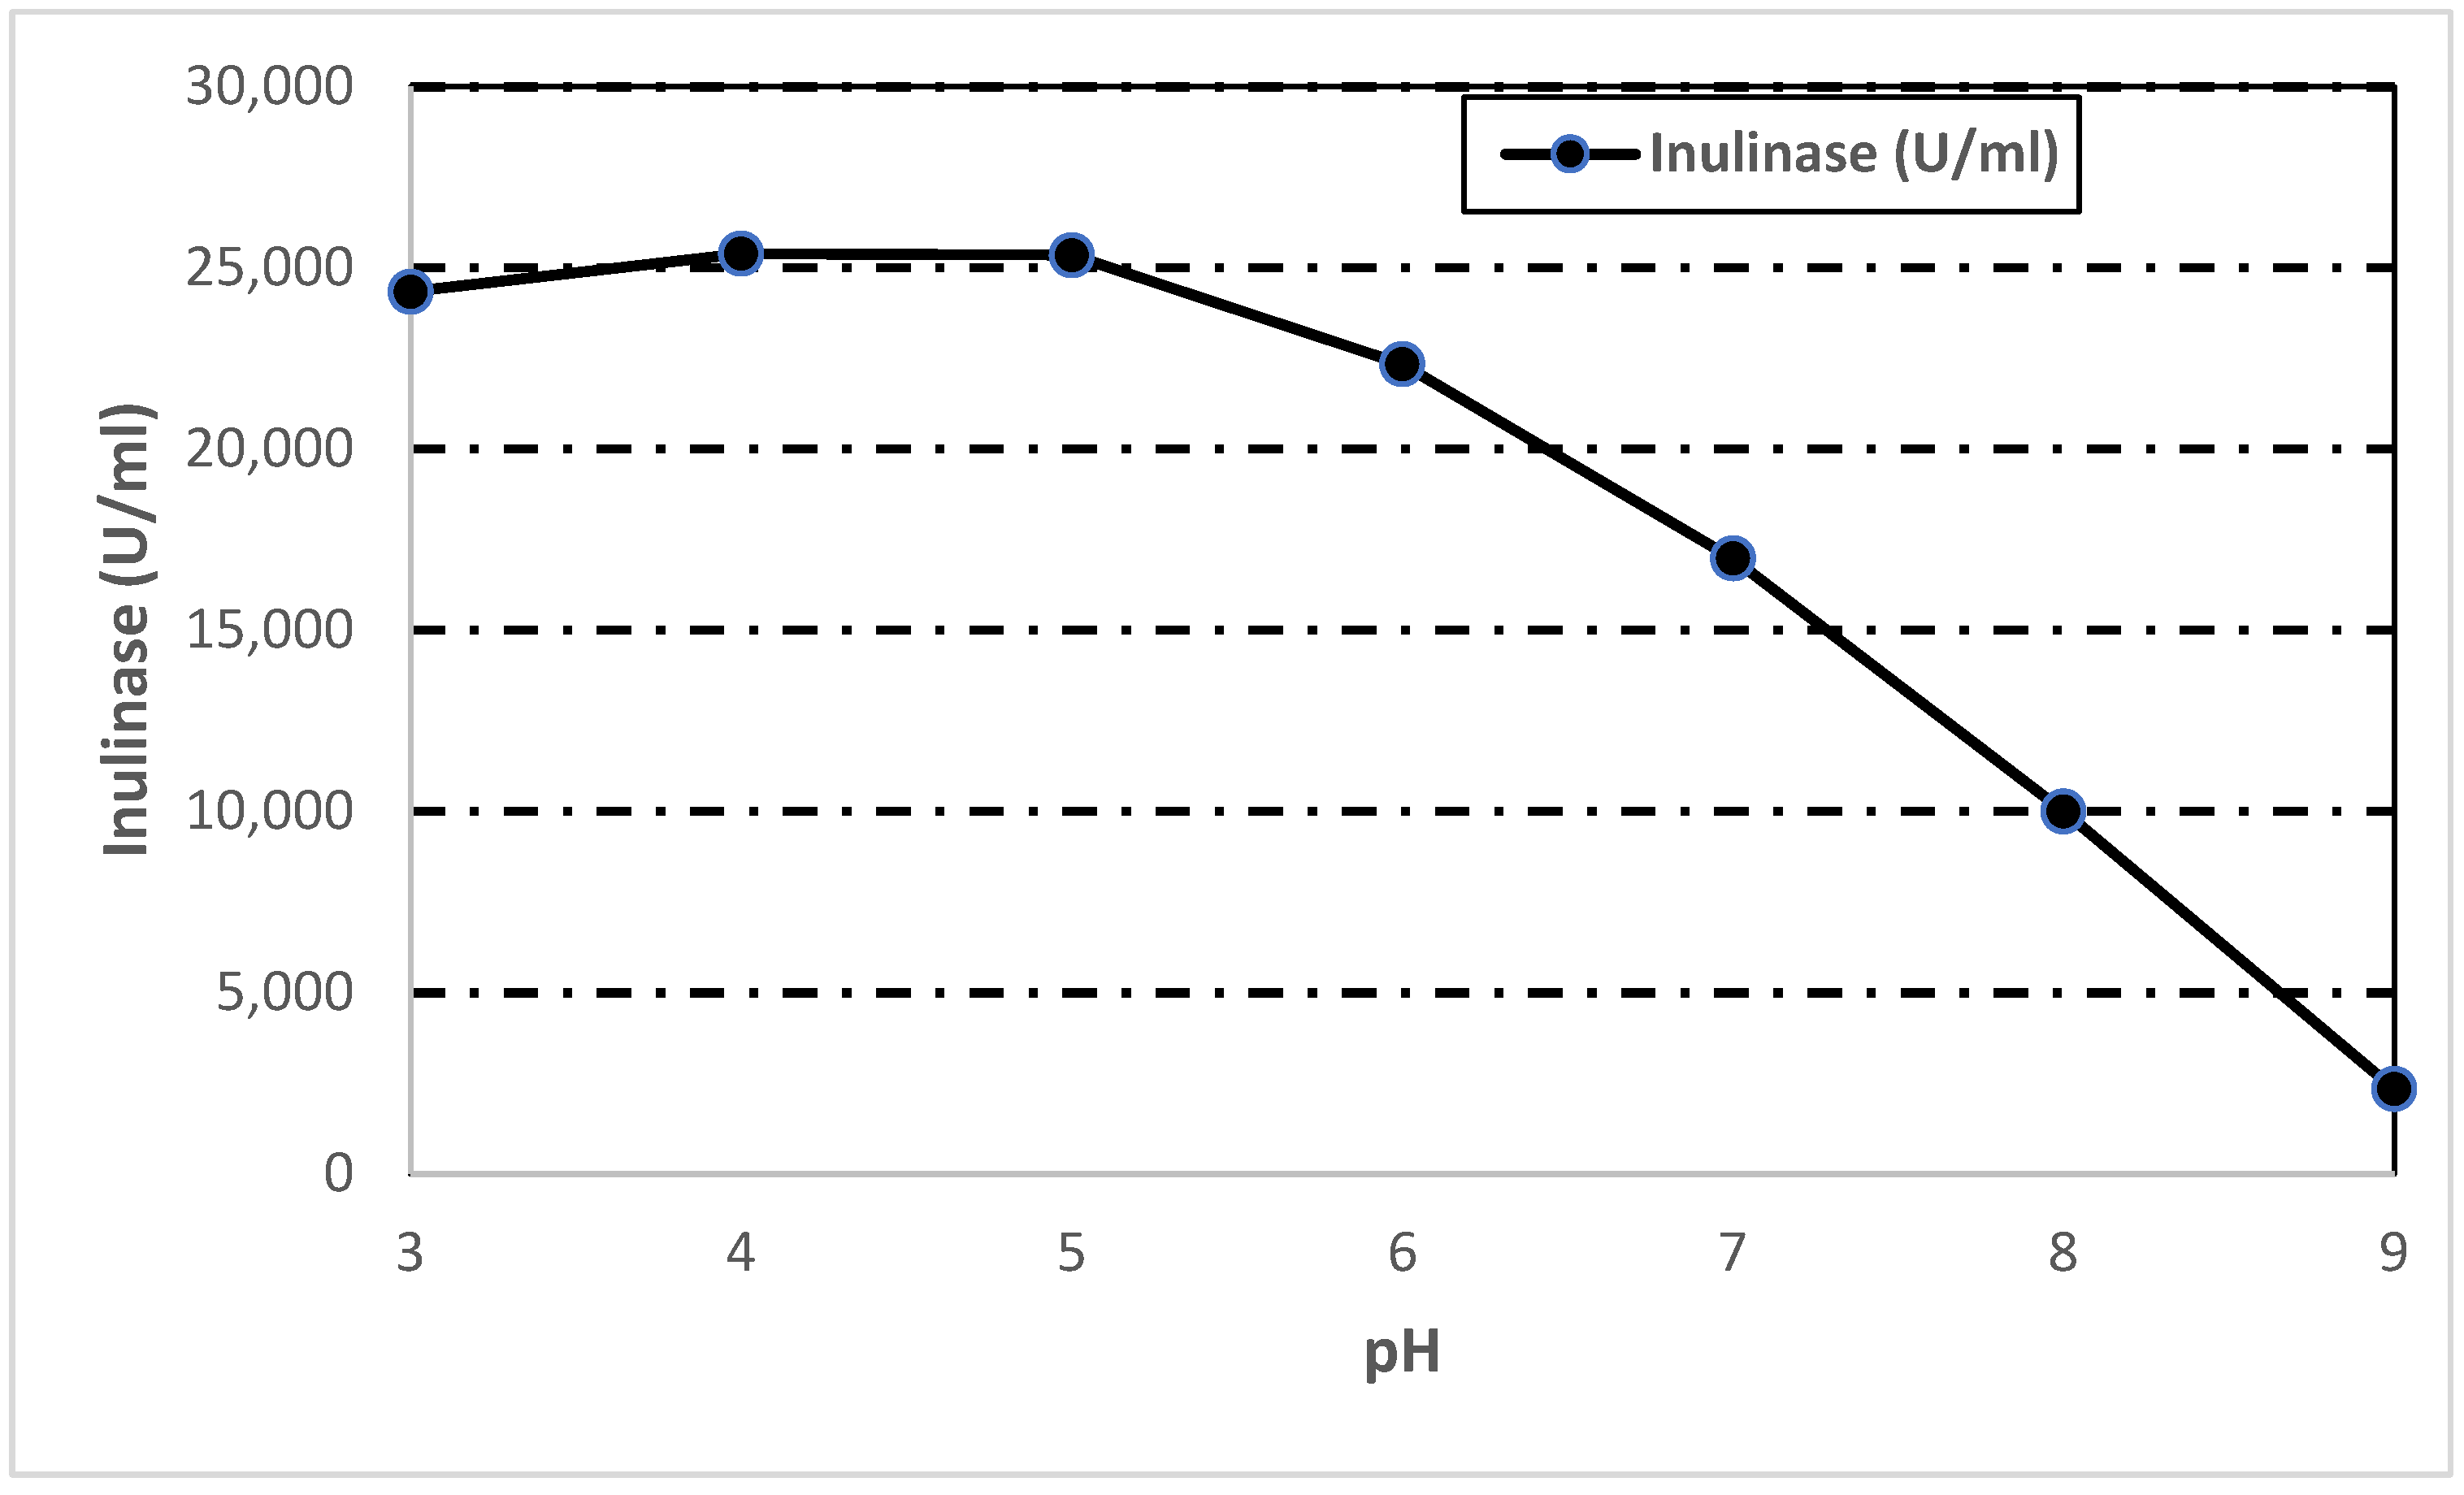
3.7.3. Effect of pH on Inulinase Activity and Stability

A pH range of 5 to 6 was suitable for enzyme activity with optimum at pH 6 then activity declined at pH (7, 8, and 9), reaching (82, 50, and 21)% of its maximum activity (Figure 5). The same optimum pH was recorded in several studies [52].
Inulinase enzymes retained 100% activity at pH 4, while 98, 87, 65, 39, and 7% of activity was retained when assayed at pH 5, 6, 7, 8, and 9, respectively, after 24 h incubation (Figure 6). The pH stability of inulinase from our strain was more stable in acidic pH than other species. Inulinase produced from Aspergillus ficuum JNSP5-06 was stable at (pH (6–8) [53]. Grauba et al. [34] stated that inulinase produced from Aspergillus tamarii-U4 was stable at 5 to 6. A low pH and higher temperature stability makes them industrially more advantageous over other microbial sources [8].

3.7.4. Substrate Specificity

The action of partially purified inulinase was tested over different substrates. The results summarized in Table 10 show that inulinase was maximally active against inulin with an activity of 26,230 U/mL, which contains β-(2→1)-D-fructosyl-fructose links [54]. Inulinase enzymes also have high specificity towards sucrose (7869 U/mL). This may be due to the participation of the same active site of enzymes in fructan and sucrose hydrolysis [55]. However, cellobiose and soluble starch were not observed to be hydrolyzed. Inulin did not hydrolyze glycosidic linkage between glucose monomers in starch and cellobiose [56].

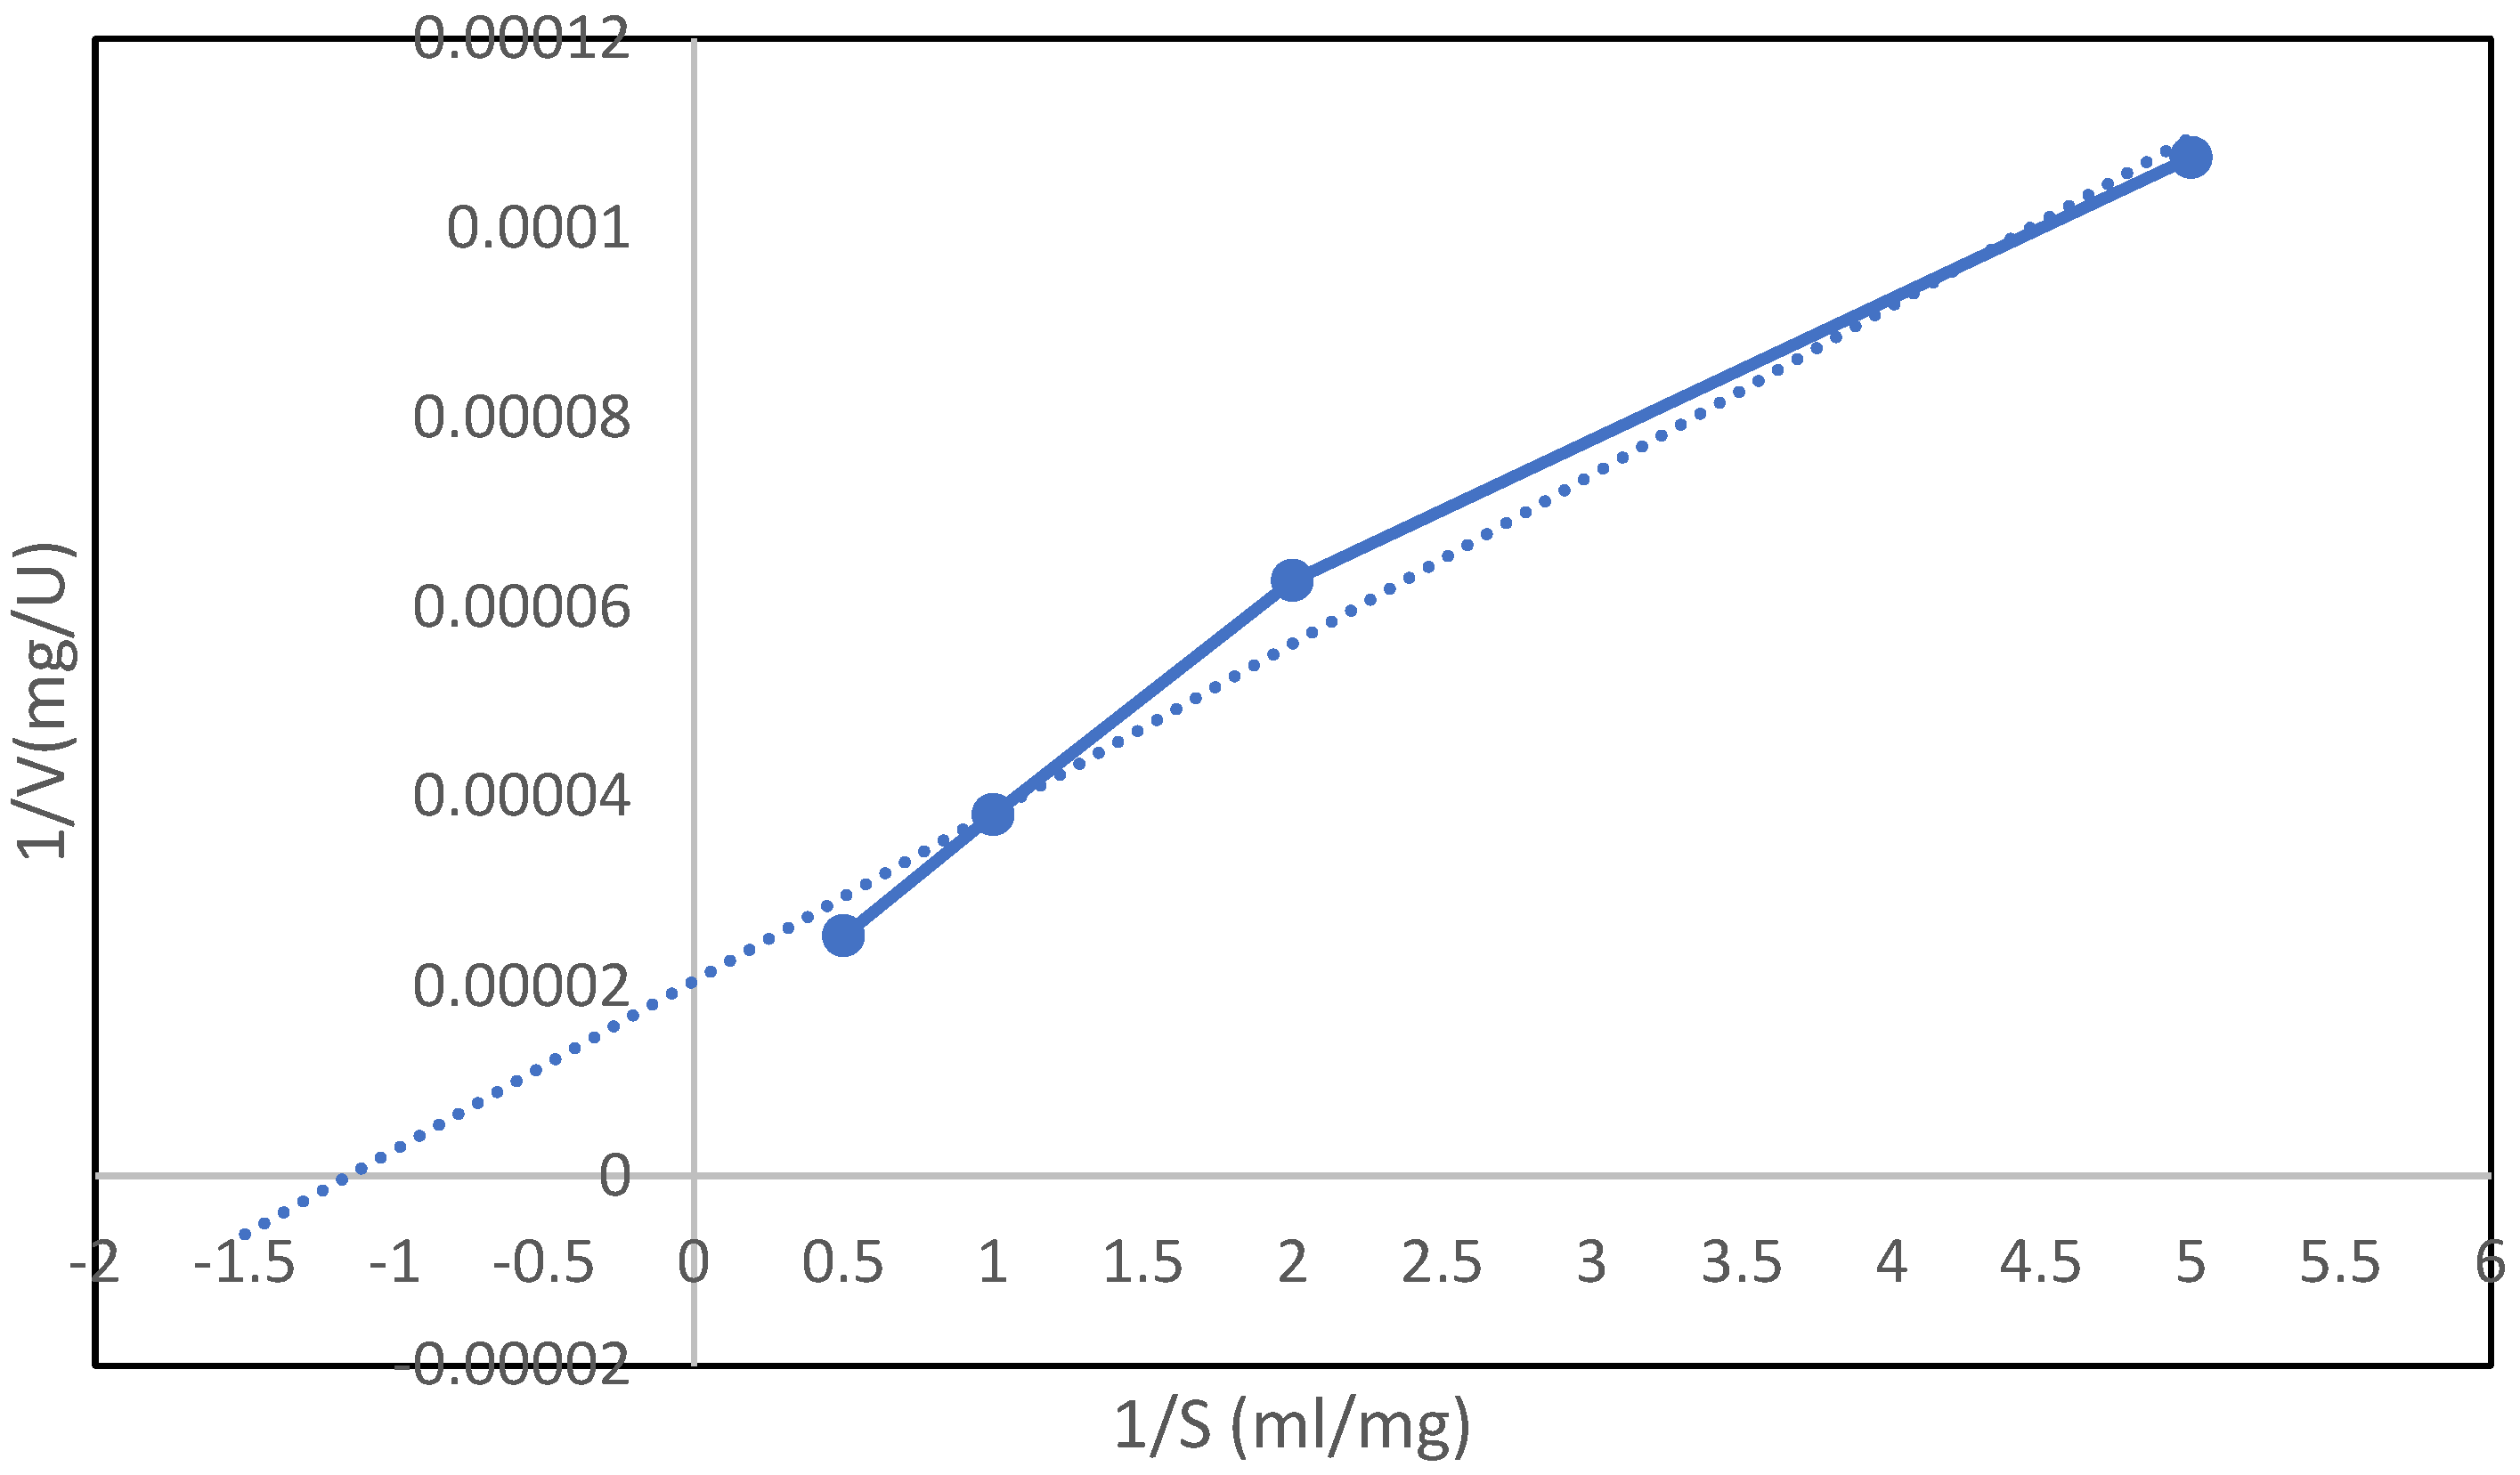
3.7.5. Determination of Kinetic Parameters of Inulinase

The hydrolytic activity of the purified inulinase was measured using inulin as a substrate at concentrations of 0.5, 1, 2, 5, and 10 mg/mL. The inulinase was observed to exhibit Michaelis–Menten kinetics. The Km and Vmax values obtained from the Lineweaver–Burk plot for inulin were 0.8 mg/mL and 50,000 U/mg, respectively (Figure 7). Inulinase produced in our study was shown to have low Km and very high Vmax compared with Aspergillus ficuum JNSP5-06, Thielavia terrestris NRRL 8126, and Xanthomonas campestris KM 24, which had a Km of 8.1, 5.15, and 3.15 mg/mL and a Vmax of 3217, 2115, and 8330 U/mg, respectively [44,47,53]. Enzyme kinetic constants (Km and Vmax) are determined using initial velocity measurements at varying substrate concentrations. Km helps us to understand how well an enzyme is suited to the substrate being used [57]. While a high Vmax indicated high enzyme activity, a low Km suggested high substrate affinity [58].

3.8. Multifactorial Experiments for Fermentation of Chicory Root Produced Using Inulinase Enzymes

3.8.1. Screening of Factors Affecting Fermentation of Chicory Root

The wide variation in saccharification of yield percentage of chicory root, from (5.1 to 27.21) % observed in the Plackett–Burman experiment (Table 11), emphasized the importance of optimizing conditions of inulin to optimize saccharification yield.
The linear correlation model that describes the correlation between the six factors (pH, temperature, substrate concentration, time, enzyme titer and agitation) and the saccharification yield percentage, as follows:
Saccharification yield % = 23.47 + −1.75 × (pH − 5.6)/1.5) + 4.76 × (temperature °C − 50)/10) + 0.303 × (substrate conc.% (w/v) − 1.55)/1.25) + 6.54 × (Time (h) − 1.25)/0.75) + 1.64 × (Enzyme conc. (U/mL) − 50,000)/20,000) + −0.03 × agitation (rpm)
The main effects of the examined factors on saccharification yield percentage are identified and presented in Table 12. Factors including time (h), substrate concentration (w/v), enzyme concentration (U/mL), and temperature presented positive effects on saccharification yield percentage, which means saccharification yield percentage was improved when increasing the values of these factors. Conversely, agitation and pH showed negative effects on saccharification yield percentage, indicating saccharification yield percentage was inhibited when increasing the values of these factors.
Variables with a confidence level above 95% (p < 0.05) were regarded as significant factors in the Plackett–Burman statistical analysis. With p values of 0.0332, 0.0038, and 0.0007, respectively, enzyme concentration, temperature, and time were chosen as the most important parameters in Table 12. The Plackett–Burman model had an R2 value of 0.95, indicating a reasonable and dependable fit. Using the Box–Behnken design, the relevant factors affecting saccharification yield percentage were chosen for further optimization.

3.8.2. Optimization of Medium Components Using Box–Behnken Design

The Box–Behnken design matrix is shown in Table 13. The experimental saccharification yield percentage and predicted saccharification yield percentage were compared, and each factor was examined at three levels (−1, 0, 1). There was a wide variation between saccharification yield percentage from 20.39% to 58.07%. The optimal conditions were found to be a temperature of 60 °C, an enzyme concentration of 40,000 U/mL, and a time of seven hours, which resulted in a 58.07% saccharification yield percentage.
The calculated coefficients for the linear, quadratic, and interaction factors. p < 0.05 was used to determine whether a model and its coefficients were significant (Table 14).
According to Table 14, time (h), temperature (°C), and enzyme concentration (U/mL) were the significant factors. Temperature (°C) × enzyme conc. (U/mL) was the only significant interaction term, and time (h) × time (h) was the only significant quadratic term. In addition, the p value of the model was 0.01732, which indicated that the model was reliable to predict the saccharification yield percentage.
The second-order polynomial model of the Box–Behnken design is shown in the following equation.
Saccharification yield%. = −392.45 + 6.99 × temperature °C + 62.3 × Enzyme conc.(U/mL) + −32.64 × Time (h) + −5.309 × (Temp (°C) × Enzyme conc.(U/mL)) + −0.038 (Temp (°C) × Time(h)) + 0.968 × Enzyme conc.(U/mL) × Time(h) + −0.0388 Enzyme conc.(U/mL) × Enzyme conc.(U/mL) + −2.64 × (Time(h) × Time (h)) + −0.0148 Temp(°C) × Temp(°C)
The values for the variables in the equation are the concentrations used in each experiment.
Saber and El-Naggar [5] stated that time and enzyme concentration had positive significant effects on the saccharification of different agro-wastes containing inulin, while Corrado et al. [54] reported that pH and temperature are the experimental variables with the greatest influence on inulin hydrolysis. Enzyme concentration and hydrolysis time were the most important variables which have positive effects on enzymatic hydrolysis of inulin [59]. The hydrolyzing ability of inulinase on inulin-containing agro-wastes depends on the affinity between substrates and enzymes. This may also be due to the degree of polymerization and the higher polyfructans in pure inulin as well as the presence of other ingredients in the inulin-containing materials [5].

3.9. Model Validation

The optimal condition realized from the optimization experiment was validated experimentally and compared with the prediction calculated from the model (Table 13). The experimentally obtained saccharification yield of 58.07% was comparable to the polynomial model predicted value of 57.51%. The determination coefficient was used to evaluate the goodness of fit (R2). In this instance, the response model was able to account for 98% of the overall variation in the data (R2 = 0.98 for the conditions under investigation). Additionally, it demonstrated how any two variables’ relative effects change while the third is held constant. At the 5% level, linear, cross product, and quadratic terms were all significant. Consequently, the quadratic model was chosen.

4. Conclusions

The production of inulinase enzymes, which are used in many foods and pharmaceuticals, was optimized using response surface methodology. By using the Plackett–Burman design key process factors were identified, and by using Box–Behnken design, they were optimized. Optimization resulted in 2.82-fold from 380 to 1085 U/mL. Thermophilic inulinase enzyme was produced by the Rhizopus oryzae strain overall. It demonstrated strong stability at a high temperature and an acidic pH. It exhibits one of the highest specific activities ever recorded for inulinase, a very high Vmax, and a strong affinity for inulin. Purified inulinase is a perfect option for saccharification of inulin-containing agricultural wastes, as well as other food and pharmaceutical industries. The procedure could be scaled up further for industrial purposes by employing inexpensive agricultural residue (chicory root) as substrates.

Author Contributions

A.A.—conceptualization, methodology, writing; M.A.-S.—Tables, Figures; F.I.A.-E.—Funding; S.W.E.-F.—Funding. All authors have read and agreed to the published version of the manuscript.

Funding

This research received no external funding.

Institutional Review Board Statement

Not applicable.

Informed Consent Statement

Not applicable.

Data Availability Statement

Available when required.

Conflicts of Interest

The authors declare no conflict of interest.

References

  1. Kango, N.; Jain, S.C. Production and Properties of Microbial Inulinases: Recent Advances. Food Biotechnol. 2011, 25, 165–212. [Google Scholar] [CrossRef]
  2. Singh, R.S.; Chauhan, K. Inulinase production from a new inulinase producer, Penicillium oxalicum BGPUP-4. Biocatal. Agric. Biotechnol. 2017, 9, 1–10. [Google Scholar] [CrossRef]
  3. Das, D.; Selvaraj, R.; Bhat, M.R. Optimization of inulinase production by a newly isolated strain Aspergillus flavus var. flavus by solid state fermentation of Saccharum arundinaceum. Biocatal. Agric. Biotechnol. 2019, 22, 101363. [Google Scholar] [CrossRef]
  4. Yang, Z.; Hu, J.; Zhao, M. Isolation and quantitative determination of inulin-type oligosaccharides in roots of Morinda officinalis. Carbohydr. Polym. 2011, 83, 1997–2004. [Google Scholar] [CrossRef]
  5. Saber, W.I.A.; El-Naggar, N.E. Optimization of fermentation conditions for the biosynthesis of inulinase by the new source; Aspergillus tamarii and hydrolysis of some inulin containing agro-wastes. Biotechnology 2009, 8, 425–433. [Google Scholar] [CrossRef]
  6. Das, D.; Bhat, R.; Selvaraj, R. Review of inulinase production using solid-state fermentation. Ann. Microbiol. 2019, 69, 201–209. [Google Scholar] [CrossRef]
  7. Gencheva, P.; Dobrev, G.; Delchev, N.; Hristov, J.; Ivanova, V. Jerusalem artichoke and pea hulls-based substrates as raw material for ethanol production by Saccharomyces cerevisiae. Int. Rev. Chem. Eng. 2012, 4, 84–90. [Google Scholar]
  8. Ilgın, M.; Germec, M.; Turhan, I. Inulinase production and mathematical modeling from carob extract by using Aspergillus niger. Biotech. Prog. 2020, 36, e2919. [Google Scholar] [CrossRef]
  9. Nath, S.; Kango, N. Recent Developments in Industrial Mycozymes: A Current Appraisa. Mycology 2022, 13, 81–105. [Google Scholar] [CrossRef]
  10. Mohamed, S.A.; Salah, H.A.; Moharam, M.E.; Foda, M.S.; Fahmy, A.S. Characterization of two thermostable inulinases from Rhizopus oligosporus NRRL 2710. Genet. Eng. Biotechnol. 2015, 13, 65–69. [Google Scholar] [CrossRef] [Green Version]
  11. Yazdanpanah, L.; Mohamadi, N. Antifungal activity of clove essential oil from Syzygium aromaticum on Paecilomyces variotii agent of pistachio dieback. J. Biodivers. Environ. Sci. 2014, 4, 42–45. [Google Scholar]
  12. Moreno-Gavíra, A.; Huertas, V.; Diánez, F.; Santos, M.; Sánchez-Montesinos, B. Paecilomyces and its importance in the biological control of agricultural pests and diseases. Plants 2020, 9, 1746. [Google Scholar] [CrossRef] [PubMed]
  13. Liu, X.Y.; Chi, Z.; Liu, G.L.; Wang, F.; Madzak, C.; Chi, Z.M. Inulin hydrolysis and citric acid production from inulin using the surface-engineered Yarrowia lipolytica displaying inulinase. Metab. Eng. 2010, 12, 469–476. [Google Scholar] [CrossRef] [PubMed]
  14. Trivedia, S.; Divechab, J.; Shaha, A. Optimization of inulinase productionby a newly isolated Aspergillus tubingensis CR16 using low-cost substrates. Car-Bohydrate Polym. 2012, 90, 483–490. [Google Scholar] [CrossRef] [PubMed]
  15. Alma, E.; Cruz-Guerrero, J.; Olvera, L.; Garcıá-Garibay, M.; Gómez-Ruiz, L. Inulinase-hyperproducing strains of Kluyveromyces sp. isolated from aguamiel (Agave sap) and pulqueWorld. J. Microbiol. Biotechnol. 2006, 22, 115–117. [Google Scholar]
  16. Onilude, A.A.; Fadaunsi, I.F.; Garuba, E.O. Inulinase production by Saccharomyces sp. in solid state fermentation using wheat bran as substrate. Annal. Microbiol. 2012, 62, 843–848. [Google Scholar] [CrossRef]
  17. Chellapandi, P.; Jani, H.M. Production of endoglucanase by the native strains of Streptomyces isolates in submerged fermentation. Braz. J. Microbiol. 2008, 39, 122–127. [Google Scholar] [CrossRef] [Green Version]
  18. Plackett, R.L.; Burman, J.P. The design of optimum multifactorial experiments. Biometrika 1946, 33, 305–325. [Google Scholar] [CrossRef]
  19. Box, G.E.P.; Behnken, D.W. Some new three level designs for the study of quantitative variables. Technometrics 1960, 2, 455–475. [Google Scholar] [CrossRef]
  20. Miller, G.L. Use of dinitrosalicylic acid reagent for determination of reducing sugar. Anal. Chem. 1959, 31, 426–428. [Google Scholar] [CrossRef]
  21. Bradford, M.M. Rapid and sensitive method for quantitation of microgram quantities of protein utilizing principle of protein-dye binding. Anal. Biochem. 1976, 72, 248–254. [Google Scholar] [CrossRef] [PubMed]
  22. Laemmli, U.K. Cleavage of structura l proteins during the assembly of the head of bacteriop hage. Nature 1970, T4, 680–685. [Google Scholar] [CrossRef] [PubMed]
  23. Lineweaver, H.; Burk, D. The determination of enzyme dissociation constants. J. Am. Chem. Soc. 1934, 56, 658–666. [Google Scholar] [CrossRef]
  24. Lan, T.Q.; Wei, D.; Yang, S.-T.; Liu, X. Enhanced cellulase production by Trichoderma viride in a rotating fibrous bed bioreactor. Bioresour. Technol. 2013, 133, 175–182. [Google Scholar] [CrossRef]
  25. Scott, T.A.; Melvin, E.H. Determination of Dextran with Anthrone. Anal. Chem. 1953, 25, 1656–1661. [Google Scholar] [CrossRef]
  26. Su, X.; Schmitz, G.; Zhang, M.; Roderick, I.; Mackie, R.I.; Cann, K.I. Heterologous Gene Expression in Filamentous Fungi. Adv. Appl. Microbiol. 2012, 81, 1–61. [Google Scholar]
  27. Yazici, S.O.; Sahin, S.; Biyik, H.H.; Geroglu, Y.; Ozmen, I. Optimization of fermentation parameters for high-activity inulinase production and purification from Rhizopus oryzae by Plackett–Burman and Box–Behnken. J. Food Sci. Technol. 2021, 58, 739–751. [Google Scholar] [CrossRef]
  28. Gupta, A.; Sharma, A.; Pathak, R.; Kumar, A.; Sharma, S. Solid State Fermentation of Non-Edible Oil Seed Cakes for Production of Proteases and Cellulases and Degradation of Anti-Nutritional Factors. J. Food Biotechnol. Res. 2018, 2, 2–7. [Google Scholar]
  29. Huitrón, C.; Pérez, R.; Gutiérrez, L.; Lappe, P.; Petrosyan, P.; Villegas, J.; Aguilar, C.; Rocha-Zavaleta, L.; Blancas, A. Bioconversion of Agave tequilana fructans by exo-inulinases from indigenous Aspergillus niger CH-A-2010 enhances ethanol production from raw Agave tequilana juice. J. Ind. Microbiol. Biotechnol. 2013, 40, 123–132. [Google Scholar] [CrossRef]
  30. Trivedi, S.; Divecha, J.; Shah, T.; Shah, A. Rapid and efficient bioconversion of chicory inulin to fructose by immobilized thermostable inulinase from Aspergillus tubingensis CR16. Bioresour. Bioprocess. 2015, 2, 32. [Google Scholar] [CrossRef] [Green Version]
  31. Singh, R.S.; Singh, R.P. Production of fructooligosaccharides from inulin by endoinulinases and their prebiotic potential. Food Technol. Biotechnol. 2010, 48, 435–450. [Google Scholar]
  32. Reeta, R.S. Beta-glucosidase from Aspergillus niger NII 08121: Molecular characterization and applications in bioethanol production. Ph.D. Thesis, National Institute for Interdisciplinary Science & Technology, Thiruvananthapuram, India, 2011. [Google Scholar]
  33. Abdella, A.; Mazeed, T.E.; Yang, S.T.; El-Baz, A.F. Production of β-Glucosidase by Aspergillus niger on Wheat Bran and Glycerol in Submerged Culture: Factorial Experimental Design and Process Optimization. Curr. Biotechnol. 2014, 3, 197–206. [Google Scholar] [CrossRef] [Green Version]
  34. Garuba, E.O.; Onilude, A.A. Exo-Inulinase Production by a catabolite repression-resistant mutant Thermophilic Aspergillus tamarii -U4 in solid state fermentation. Biotechnol. J. Inter. 2020, 24, 21–31. [Google Scholar] [CrossRef]
  35. Cazetta, M.L.; Contiero, J. Influence of nitrogen source and sucrose concentrationon inulinase production by Kluyveromyces marxianusin fed-batch fermentation. Afr. J. Biotechnol. 2011, 10, 12012–12017. [Google Scholar]
  36. Akinyele, B.J.; Adetuyi, F.C. Effect of agrowastes, pH and temperature variation on the growth of Volvariella volvacea. Afr. J. Biotechnol. 2005, 4, 1390–1395. [Google Scholar]
  37. Skowronek, M.; Fiedurek, J. Optimisation of Inulinase Production by Aspergillus niger Using Simplex and Classical Method. Food Technol. Biotechnol. 2004, 42, 141–146. [Google Scholar]
  38. Abou-Taleb, K.A.; Amin, S.A.; Ahmed, A.I. Production of exo-inulinase from Aspergillus niger and Candida oleophila for degradation of chicory root inulin and ethanol production. Middle East J. Agric. Res. 2019, 8, 855–867. [Google Scholar]
  39. Jain, S.C.; Jain, P.C.; Kango, N. Production of inulinase from kluyveromyces marxianus using dahlia tuber extract. Braz. J. Microbiol. 2012, 2012, 62–69. [Google Scholar] [CrossRef] [PubMed] [Green Version]
  40. Trapala, J.; Bustos-Jaimes, I.; Manzanares, P.; Bárzana, E.; Montiel, C.A. Purification and characterization of an inulinase produced by a Kluyveromyces marxianus strain isolated from blue agave bagasse. Protein Expr. Purif. 2020, 176, 105718. [Google Scholar] [CrossRef] [PubMed]
  41. Laowklom, N.; Chantanaphan, R.; Pinphanichakarn, P. Production, Purification and Characterization of Inulinase from a Newly Isolated Streptomyces sp. CP01. Nat. Resour. 2012, 3, 137–144. [Google Scholar]
  42. Ramapriya, R.; Thirumurugan, A.; Sathishkumar, T.; Manimaran, D.R. Partial purification and characterization of exoinulinase produced from Bacillus sp. J. Genet. Eng. Biotechnol. 2018, 16, 363–367. [Google Scholar] [CrossRef] [PubMed]
  43. Fawzi, E.M. Comparative study of two purified inulinases from thermophile thielavia terrestris NRRL 8126 and mesophile Aspergillus foetidus NRRL 337 grown on Cichorium Intybus L. Braz. J. Microbiol. 2011, 42, 633–649. [Google Scholar] [CrossRef] [PubMed] [Green Version]
  44. Germec, M.; Turhan, I. Thermostability of Aspergillus niger inulinase from sugar beet molasses in the submerged fermentation and determination of its kinetic and thermodynamic parameters. Biomass Convers. Biorefinery 2022, 12, 3219–3227. [Google Scholar] [CrossRef]
  45. Cho, Y.J.; Yun, J.W. Purification and characterization of an endoinulinase from Xanthomonas oryzae no. 5. Process Biochem. 2002, 37, 1325–1331. [Google Scholar] [CrossRef]
  46. Naidoo, K.; Kumar, A.; Sharma, V.; Permaul, K.; Singh, S. Purifi cation and Characterization of an Endoinulinase from Xanthomonas campestris pv. phaseoli KM 24 Mutant. Food Technol. Biotechnol. 2015, 53, 146–153. [Google Scholar] [CrossRef] [PubMed]
  47. Nascimento, D.S.; Junior, G.V.; Fernandes, P.; Ribeiro, G.C.A.; Lima, D.M.; Góes-Neto, A.; Oliveira, R.Q.; Figueiredo-Ribeiro, R.d.C.L.; de Assis, S. Production, characterization and application of inulinase from fungal endophyte CCMB 328. An. Acad. Bras. Ciências 2012, 84, 443–453. [Google Scholar] [CrossRef] [Green Version]
  48. AEl-souod, S.M.A.; Mohamed, T.M.; Ali, E.M.; El-badry, M.O.; El-keiy, M.M. Partial purification of extracellular exo-inulinase from Ulocladium atrum. J. Genet. Eng. Biotechnol. 2014, 12, 15–20. [Google Scholar] [CrossRef]
  49. Garuba, O.E.; Onilude, A.A.; Oyinlola, A.K. Isolation and molecular characterization of inulinase- producing thermophilic fungi from waste dumpsite located at apete-awotan in ibadan, south-western Nigeria. Innov. Rom. Food Biotechnol. 2015, 16, 31–36. [Google Scholar]
  50. Abdella, A.; Ramadan, S.; Hamouda, R.A.; Saddiq, A.A.; Alhazmi, N.M.; Al-Saman, M.A. Paecilomyces variotii xylanase production, purification and characterization with antioxidant xylo-oligosaccharides production. Sci. Rep. 2021, 11, 16468. [Google Scholar] [CrossRef]
  51. Flores-Gallegos, A.C.; Contreras-Esquivel, J.C.; Morlett-Chávez, J.A.; Aguilar, C.N.; Rodríguez-Herrera, R. Comparative study of fungal strains for thermostable inulinase production. J. Biosci. Bioeng. 2015, 119, 421–426. [Google Scholar] [CrossRef]
  52. Torabizadeha, H.; Mahmoud, A. Inulin hydrolysis by inulinase immobilized covalently on magnetic nanoparticles prepared with wheat gluten hydrolysates. Biotechnol. Rep. 2018, 17, 97–103. [Google Scholar] [CrossRef]
  53. Chen, H.Q.; Chen, X.M.; Li, Y.; Wanga, J.; Jin, Z.Y. Purification and characterisation of exo- and endo-inulinase from Aspergillus ficuum JNSP5-06. Food Chem. 2009, 115, 1206–1212. [Google Scholar] [CrossRef]
  54. Corrado, I.; Cascelli, N.; Ntasi, G.; Birolo, L.; Sannia, G.; Pezzella, C. Optimization of Inulin Hydrolysis by Penicillium lanosocoeruleum Inulinases and Efficient Conversion into Polyhydroxyalkanoates. Front. Bioeng. Biotechnol. 2021, 9, 108. [Google Scholar] [CrossRef]
  55. Barclaya, T.; Ginic-Markovica, M.; Johnstona, M.R.; Cooper, P.; Petrovsky, N. Analysis of the hydrolysis of inulin using real time 1H NMR spectroscopy. Carbohydr. Res. 2012, 352, 117–125. [Google Scholar] [CrossRef] [Green Version]
  56. Popoola-Akinola, O.O.; Raji, T.J.; Olawoye, B. Lignocellulose, dietary fibre, inulin and their potential application in food. Heliyon 2022, 8, e10459. [Google Scholar] [CrossRef]
  57. Zhang, Y.; Li, Y.-F.; Chi, Z.; Liu, G.-L.; Jiang, H.; Hu, Z.; Ch, Z.-M. Inulinase hyperproduction by Kluyveromyces marxianus through codon optimization, selection of the promoter, and high-cell-density fermentation for efficient inulin hydrolysis. Ann. Microbiol. 2019, 69, 647–657. [Google Scholar] [CrossRef]
  58. Abdella, A.; El-Baz, A.F.; Ibrahim, I.A.; Mahrous, E.E.; Yang, S.T. Biotransformation of soy flour isoflavones by Aspergillus niger NRRL 3122 β-glucosidase enzyme. Nat. Prod. Res. 2018, 32, 2382–2391. [Google Scholar] [CrossRef] [PubMed]
  59. Baston, O.; Neagu, C.; Bahrim, G. Establishing the Optimum Conditions for Inulin Hydrolysisby Using Commercial Inulinase. Rev. Chim. 2013, 64, 649–653. [Google Scholar]
Figure 1. Production of inulinase enzyme on various carbon sources by Rhizopus oryzae NRRL 3563.
Microbiolres 14 00024 g001
Figure 2. Cropped SDS-PAGE of inuliase enzyme produced by Rhizopus oryzae NRRL 3563. (Lane A) standard protein marker. (Lane B) SDS-PAGE of the partially purified inulinase enzyme.
Microbiolres 14 00024 g002
Figure 3. Temperature optima of the purified inulinase from Rhizopus oryzae NRRL 3563.
Microbiolres 14 00024 g003
Figure 4. Thermostability of the purified inulinase from Rhizopus oryzae NRRL 3563.
Microbiolres 14 00024 g004
Figure 5. pH optima of the purified inulinase from Rhizopus oryzae NRRL 3563.
Microbiolres 14 00024 g005
Figure 6. pH stability of the purified inulinase from Rhizopus oryzae NRRL 3563.
Microbiolres 14 00024 g006
Figure 7. Lineweaver–Burk plot of inulinase from Rhizopus oryzae NRRL 3563.
Microbiolres 14 00024 g007
Table 1. Variables and their levels employed in the Plackett–Burman design for screening of variables affecting inulinase production by Rhizopus oryzae NRRL 3563.
FactorLow Level (−1)High Level (+1)
chicory root10 g/L20 g/L
K2HPO40.52
MgSO·7H2O0.31
NaNO30.53
KCI0.31
FeSO4·7H2O0.050.5
(NH4) H2PO414
Temperature2535
pH5.57.5
(−1) and (+1) are coded levels in the Plackett–Burman design.
Table 2. Factors and testing levels for the Plackett–Burman experiment for saccharification of chicory root using inulinse enzyme produced from Rhizopus oryzae NRRL 3563.
FactorSymbolLow Level (−1)High Level (+1)
pHX158
Temp (°C)X24060
Time (h)X315
Substrate conc. % (w/v)X40.53
Enzyme conc. (U/mL)X510,00020,000
Agitation (rpm)X6100200
Table 3. Screening of cultures for inulinase production.
StrainIncubation Period (Day)Cell Dry Weight (g/L)pHProtein (mg/mL)Inulinase (IU/mL)
Aspergillus niger
NRRL 3122
23.46.420.0295 ± 3.6
45.146.740.05110 ± 7.1
65.166.480.07135 ± 9.3
84.946.630.07130 ± 8.5
Aspergillus oryzae
NRRL 2217
23.18.360.01775 ± 3.2
45.528.480.0290 ± 4.7
65.918.070.025110± 5.3
84.838.700.024108 ± 6.1
Pacilomyces variotti
NRRL 1115
25.37.310.0143 ± 1.2
47.467.160.0372 ± 2.3
67.986.880.04592 ± 3.1
87.268.240.04289 ± 2.7
Rhizopus oryzae
NRRL 3563
23.82.50.07160 ± 10
45.213.710.09250 ± 12
65.824.50.103380 ± 15
85.450.101370 ± 11
Table 4. Plackett–Burman experimental design matrix for screening of factors affecting inulinase production by Rhizopus oryzae NRRL 3563.
PatternChicory Root (g/L)K2HPO4
(g/L)
NaNO3
(g/L)
MgSO4
(g/L)
KCL
(g/L)
FeSO4
(g/L)
NH4H2PO4
(g/L)
Temp
°C
pHInulinase
(U/mL)
−+−−+−+++2020.50.310.051257.5139.16
+++++++++1020.510.30.51357.5328.33
−+++−−−+−10230.30.30.054355.5657.16
−−−+−−+−+200.5310.30.054257.5197.20
+−+++−−−+100.50.5110.54255.5279.33
−+−+++−−−2020.50.30.30.54255.5131.46
−−+−+++−−100.530.30.30.51257.5542.3
−−+−−+−++200.530.310.51355.5279.36.
+−−+−+++−2023110.54357.5262.93
+−−−+−−+−1023110.051255.5438.22
+++−−−+−−200.50.510.30.051355.5147.9
++−−−+−−+100.50.50.310.054357.5262.93
Table 5. Estimated effects, corresponding t ratios, and p-values for the Plackett–Burman design experiment.
FactorEstimateStd Errort Ratiop-Value
Chicory root−31.089.481−4.330.0022 **
NaNO3122.3337.923.490.032 **
KCL−138.8135.44−3.510.0343 **
FeSO4−12.3511.670.430.7231
MgSO435.3239.230.820.4325
K2HPO440.5563.200.800.4823
NH4H2PO48.235.430.320.8231
Temp6.549.4810.680.5471
pH−30.3247.406−0.640.5668
** Significant factors at p < 0.05.
Table 6. Box–Behnken factorial experimental design and responses of inulinase activity produced.
PatternChicory Root (g/L)NaNO3 (g/L)KCLExperimental Inulinase
(U/mL)
Predicted
Inulinase
(U/mL)
18,440−−7.530.3860.16850.14
+0+1040.31020.021010
+0−1040.12140.61060.22
07.540.21070.3890.225
+−01030.2990.37980.38
0+−7.550.3845.36840.01
++01050.21085.111075.02
−0+540.1650.07640.41
0−+7.530.1875.03865.15
07.540.2885.33875.44
0++7.550.1925.3915.37
−−0530.2635.27630.14
07.540.2845.36845.36
−+0550.2570.2560.43
−0−540.3575.27765.49
Table 7. Parameter estimates and summary of fit for Box–Behnken design.
FactorEstimateStd Errort Ratiop-Value
Intercept1582.666718.9989883.30<0.0001 **
Chicory root390.37511.6344533.55<0.0001 **
NaNO3−49.2511.63445−4.230.0082 **
KCL15.12511.634451.300.2503
Chicory root × NaNO371.2516.45364.330.0075 **
Chicory root × KCL916.45360.550.6079
NaNO3 × KCL−29.516.4536−1.790.1330
Chicory root × Chicory root−94.4583317.12545−5.520.0027 **
** Significant factors at p < 0.05. The values for the variables in the equation are the concentrations used in each experiment.
Table 8. Comparison of inulinase production from various substrates in fermentation by Rhizopus oryzae NRRL 3563 and other fungi.
MicroorganismSubstrateInulinase (U/mL)Productivity (U/mL/Day)References
Rhizopus oryzae NRRL 35631% chicory root1085180This study
Aspergillus tamarii AR-IN91% Dahlia tuber71.9724[5]
Aspergillus niger 13/361% sucrose8020[37]
Candida oleophila1% chicory root46.3811.59[38]
Penicillium oxalicum2% inulin11.062.5[2]
Kluyveromyces marxianus3% chicory root129.2132.3[39]
Table 9. Chart for the purification of inulinase enzyme.
Volumetric Activity
U/mL
Total Activity (U)Protein Conc
(mg/mL)
Total Protein (mg)Specific Activity
(U/mg)
Purification FoldsRecovery %
Crude enzyme1085217,0000.18366027.71100
70% Ammonium sulphate/dialysis8685173,3000.62312.4613,9402.380
Ultra-filtration 26,065130,3251.1875.93521,9503.6360
Table 10. Substrate specificity.
SubstrateRelative Activity (%)
Inulin100
Sucrose30
Cellobiose0
Soluble starch0
Table 11. Randomized Plakett–Burman experimental design for evaluating factors influencing saccharification yield percentage of chicory root by the inulinase enzyme produced from Rhizopus oryzae NRRL 3563.
PatternpHTemperature (°C)Substrate Conc. % (w/v)Time (h)Enzyme (U/mL)Agitation (RPM)Saccharification Yield %
−−+−−+5400.5510,0002005.83
++++++8603520,00020010.22
−+−−+−5600.5120,00010027.21
−+−+++5603120,00020021.6
+−−+−+8403110,0002005.1
−+++−−5603510,00010018.86
+−+++−8403520,0001005.61
++−−−+8600.5110,00020011.6
+++−−−8600.5510,00010010.8
−−−+−−5403110,00010010.22
+−−−+−8400.5120,0001006.04
−−+−++5403520,0002007.2
Table 12. Estimated effects, corresponding t ratios, and p-values for the Plackett–Burman design experiment.
FactorEstimateStd Errort Ratiop-Value
Enzyme conc. (U/mL) (10,000, 20,000)1.6390.922.920.0332 **
Time (h) (1, 5)6.5450.9347.490.0007 **
Substrate conc. % (w/v) (0.5, 3)0.30331.6790.180.8637
Temperature (°C) (40, 60)4.7680.56095.100.0038 **
pH (5, 8)−1.7510.9348−1.870.1199
Agitation (rpm)−0.030.0186−2.150.0840
** Significant factors at p < 0.05.
Table 13. Box–Behnken factorial experimental design and responses of saccharification yield percentage of chicory root by the inulinase enzyme produced from Rhizopus oryzae NRRL 3563.
PatternTemp (°C)Enzyme Conc.
(U/mL)
Time (h)ExpPred
08030,000920.3921.63
−0−6030,000544.6743.71
−−08040,000724.4223.32
+−07030,000748.8644.26
0+−8030,000534.934.56
0−−6030,000933.533.66
++07040,000534.936.25
+0−7030,000741.7144.26
08020,000757.9458.2
07040,000927.9128.22
−0+7030,000741.8744.82
0−+6020,000741.8742.92
0++6040,000758.0757.51
−+07020,000934.933.71
+0+7020,000548.7248.72
Table 14. Parameter estimates and summary of fit for Box–Behnken design.
FactorEstimateStd Errort Ratiop-Value
Intercept−392.73108.27−3.620.0017 **
Temp (°C) 6.992.243.150.0262 **
Time (h)32.648.763.730.0196 **
Enzyme conc. (U/mL)62.318.063.460.0173 **
Temp (°C) × Enzyme conc. (U/mL)−5.3090.157−8.60.032 **
Enzyme conc. (U/mL) × Time(h)0.9680.7931.220.2782
Temp (°C) × Time(h)−0.0380.075−0.490.662
Temp (°C) × Temp (°C)−0.01480.012−1.190.292
Time (h) × Time(h)−2.6424470.425−6.210.042 **
Enzyme conc. (U/mL) × Enzyme conc. (U/mL)−0.038871.6611.320.2442
** Significant factors at p < 0.05.
Disclaimer/Publisher’s Note: The statements, opinions and data contained in all publications are solely those of the individual author(s) and contributor(s) and not of MDPI and/or the editor(s). MDPI and/or the editor(s) disclaim responsibility for any injury to people or property resulting from any ideas, methods, instructions or products referred to in the content.

