Article

Omicron BA.2.75 Sublineage (Centaurus) Follows the Expectations of the Evolution Theory: Less Negative Gibbs Energy of Biosynthesis Indicates Decreased Pathogenicity

School of Life Sciences, Technical University of Munich, 85354 Freising, Germany
Microbiol. Res. 2022, 13(4), 937-952; https://doi.org/10.3390/microbiolres13040066
Submission received: 26 October 2022 / Revised: 9 November 2022 / Accepted: 10 November 2022 / Published: 14 November 2022
(This article belongs to the Topic Host–Parasite Interactions)

Abstract

:
SARS-CoV-2 belongs to the group of RNA viruses with a pronounced tendency to mutate. Omicron BA.2.75 is a subvariant believed to be able to suppress the currently dominant BA.5 and cause a new winter wave of the COVID-19 pandemic. Omicron BA.2.75 is characterized by a greater infectivity compared to earlier Omicron variants. However, the Gibbs energy of the biosynthesis of virus particles is slightly less negative compared to those of other variants. Thus, the multiplication rate of Omicron BA.2.75 is lower than that of other SARS-CoV-2 variants. This leads to slower accumulation of newly formed virions and less damage to host cells, indicating evolution of SARS-CoV-2 toward decreasing pathogenicity.

1. Introduction

Multicellular organisms represent hosts for many viruses [1] and interact [2,3]. Empirical formulas and thermodynamic properties are available in the literature for human host tissues [4], plant host organisms [5], and over 30 viruses [6,7,8,9,10,11,12,13]. These data are necessary for research on the biothermodynamic background of virus–host interactions.
All animate matter represents open thermodynamic systems performing growth [13,14,15,16,17,18,19,20,21,22,23,24,25,26]. During growth and biosynthesis, the state of the animate matter system changes [27], consequently, the thermodynamic properties of the organism change during biosynthesis [28,29,30,31]. Biothermodynamic research in microorganisms has been conducted in various environments, from bioreactors [32,33], through soil [34,35], to human infections [12]. During the evolution of viruses, mutations occur that change not only the thermodynamic properties due to a change in elemental composition, but also the information content [36,37,38]. In this way, the virus evolves.
Infection represents a biological interaction of a multicellular host and microorganisms [1]. However, interactions of viruses with their hosts also represent a thermodynamic process and have been studied extensively using the approaches of biothermodynamics and bioenergetics [12,39,40,41,42,43,44,45,46,47,48,49,50,51,52]. Thus, biothermodynamics is used in the analysis of the interactions of organisms with their environment and with other organisms [53,54,55,56,57]. However, virus–host interactions have still not been explored for many viruses, first of all due to a lack of data on the elemental composition and thermodynamic properties. This is a consequence of a lack of adequate biosafety levels in most biothermodynamics and chemical analysis laboratories as well as difficulties with producing virus samples of adequate purity and in sufficient amount [58]. Thus, the atom counting method was developed to calculate the elemental composition of various viruses [58]. The results of the atom counting method are in agreement with the experimentally determined virus empirical formulas [58,59,60].
Based on known empirical formulas of viruses and biosynthesis reactions, it is possible to find standard thermodynamic properties through the Battley, Roels, and Sandler–Orbey methods. In the Battley method, the standard enthalpy of live matter is found through the Patel–Erickson equation [61,62], while entropy is found using the Battley equation [63]. Enthalpy and entropy are then combined to find the Gibbs energy. On the other hand, the Roels method uses the Roels equation to find the Gibbs energy [64,65] and Patel–Erickson equation to find enthalpy [61,62]. Combining the Gibbs energy and enthalpy gives the entropy. In the Sandler–Orbey method, enthalpy and Gibbs energy are calculated using equations proposed by Sandler and Orbey [66,67]. These are combined to find entropy.
Virus–host interaction represents a chemical reaction [58,68]. Antigen–receptor interaction is similar to protein–ligand interactions [68,69]. The reactions of replication and translation represent the processes of polymerization of nucleotides and amino acids, respectively, catalyzed by enzymes [70,71,72]. The driving force for chemical reactions is the Gibbs energy [20,21,65,73]. Thus, it is necessary to know the Gibbs energy of biosynthesis. Biosynthesis forms virus building blocks that undergo self-assembly, forming new virions [74,75]. Virions accumulate inside the cell and lead to its damage [76]. The growth of viruses is reflected in the increase in the size of the virus population [11]. Gibbs energy of biosynthesis, ΔbsG, is proportional to biosynthesis rate, rbs, and thereby the multiplication rate according to the phenomenological equation
r b s = L b s T Δ b s G
where Lbs is the phenomenological coefficient for biosynthesis and T is temperature [8,9]. Phenomenological equations belong to the domain of nonequilibrium thermodynamics, which was shown to be an excellent approach for the analysis of life processes by Prigogine and coworkers [77,78,79,80].
Phenomenological equations, also known as linear phenomenological equations, are among the oldest discoveries of thermodynamics, dating back to the early 19th century [81]. They state that the rate of a process is proportional to its thermodynamic driving force [15,73]. The greater the desired rate of a process, the more useful energy must be dissipated (wasted), in order to achieve the desired rate [15,73]. Phenomenological equations are important, since they provide a link between thermodynamic and kinetic aspects of processes [73]. Phenomenological equations are applicable to a wide range of processes including heat flow, viscosity, electrical energy dissipation, diffusion, and chemical reactions [15,73]. Their wide applicability and simplicity makes them very important tools in chemical engineering [15,73].
SARS-CoV-2 belongs to RNA viruses, which entered the human population for the first time in December 2019 in Wuhan [82]. Human to human transmission was reported in January 2020 [83]. Shortly after in March 2020, the WHO declared COVID-19 a pandemic [84]. Until today, 623,893,894 COVID-19 cases have been reported, 6,553,936 deaths were confirmed, and 12,782,955,639 vaccine doses have been administered [85]. Despite the large number of administered vaccines, the pandemic has not been suppressed, but only its intensity has been decreased [86]. In Germany, in mid-October 2022, over 172 thousand new cases have been recorded daily [87].
RNA viruses exhibit a high tendency to mutate [88]. In 2019, the wild type SARS-CoV-2 has been identified, later labeled the Hu-1 variant. The Hu-1 variant has mutated several dozen times, which led to the appearance of new variants: Alpha, Beta, Gamma, Delta… and Omicron, with several subvariants [89,90,91]. The new subvariant BA.2.75 appeared in India and has spread to over 15 countries throughout the world, but has not yet become the dominant variant [92]. It seems that the sublineage BA.2.75 has the ability to evade the immune answer [92,93]. Genetic sequence data for the Omicron BA.2.75 variant are available at GISAID, the global data science initiative [94,95,96]. To determine the biological potential of the BA.2.75 subvariant for spreading through the population and pathogenicity, it is necessary to estimate the susceptibility and permissiveness for this variant. In the literature, it has been reported that susceptibility to BA.2.75 is greater, since the antigen–receptor binding reaction is characterized by a lower Gibbs energy of binding [69]. The permissiveness that influences the virus multiplication rate was the subject of analysis in this paper.
The Omicron BA.2.75 subvariant was characterized by a more negative Gibbs energy of binding than the competing BA.2 and BA.5 subvariants [69]. This leads to faster virus entry into host cells and more rapid spreading through the population, which is in accordance with the observations made in India [97,98].
Recently, several analyses have appeared on the influence of entropy generation on sustainability and the development of society [99,100,101]. The COVID-19 pandemic and each of the individual waves caused by various variants of SARS-CoV-2 influence the entropy generation change of the entire human society as a system. It would be interesting to make a predictive model that could extrapolate the effects of the pandemic on the generation of entropy in the future and development of society.
The aim of this paper was to find empirical formulas, molar masses as well as thermodynamic properties of live matter and biosynthesis for the Omicron BA.2.75 subvariant. Based on these data, a biothermodynamic and bioenergetic analysis of evolution of SARS-CoV-2 will be made from Hu-1, through Delta, to the Omicron BA.2.75 subvariant.

2. Materials and Methods

The Methods section begins with discussing sources from which starting data for this research were obtained. Next, the atom counting method is discussed, which was used to find the elemental compositions and molar masses of virus nucleocapsids. Then, predictive thermodynamic models are presented, which were used to find the standard thermodynamic properties of the nucleocapsid live matter. Finally, biosynthesis reactions are introduced and the equations used to find the standard thermodynamic properties of the biosynthesis of virus nucleocapsids.

2.1. Data Sources

Genetic sequence data for the Omicron BA.2.75 variant were taken from GISAID, the global data science initiative [94,95,96]. The genetic sequence of the Omicron BA.2.75 isolate from Germany can be found under the accession number EPI_ISL_13378924. It is labeled as hCoV-19/Germany/BW-RKI-I-863813/2022 and was isolated in the state of Baden-Wurttemberg on 3 June 2022. The genetic sequence of the Omicron BA.2.75 isolate from India can be found under the accession number EPI_ISL_13804325. It is labeled as hCoV-19/India/TN-CDFD-E130377/2022 and was isolated in the city of Vellore, state of Tamil Nadu, on 7 January 2022. The sequence was submitted by CDFD-INSACOG on 13 July 2022. The genetic sequence of the Omicron BA.2.75 isolate from the USA can be found under the accession number EPI_ISL_15421780. It is labeled as hCoV-19/USA/OR-UW-22091225964/2022 and was isolated in the state of Oregon on 12 September 2022. Thus, the findings of this study are based on metadata associated with three sequences available on GISAID up to 22 October 2022, and accessible at https://doi.org/10.55876/gis8.221022gh (GISAID Identifier: EPI_SET_221022gh). More information about the genetic sequence data can be found in the Supplementary Materials.
Each of the analyzed BA.2.75 sequences contained a small unknown part. For the sequence originating from Germany, the unknown part occupied the positions from 21,985 to 22,160. For the sequence originating from India, the unknown part occupied the positions from 26,932 to 27,153. For the sequence originating from the USA, the unknown part occupied the positions from 26,747 to 26,958. The unknown sequences were filled using complementary sequences of the Delta variant of SARS-CoV-2. The genetic sequence of the Delta variant was taken from the NCBI database [102], under the accession number OM471068.1. The genetic sequence of the Delta variant was aligned with each of the analyzed sequences of the Omicron BA.2.75 variant. The alignment was carried out using the Needleman–Wunsch algorithm [103]. For all three Omicron BA.2.75 sequences, the alignment in the area surrounding the unknown parts was good. Then, the unknown parts of the Omicron BA.2.75 sequences were filled with the analogous parts of the Delta variant sequence, as described in [9]. The genetic sequence of the Hu-1 (wild type) variant of SARS-CoV-2 was taken from the NCBI database [102], with the accession number NC_045512.
The nucleocapsid phosphoprotein sequence was taken from the NCBI database [102]. The accession number of the nucleocapsid phosphoprotein is UKQ14424.1. The membrane protein sequence was taken from the NCBI database [102], with the accession number QHR63293. The spike protein glycoprotein sequence of the Omicron BA.2.75 subvariant was taken from the NCBI database [102], with the accession number 8GS6_C. The spike glycoprotein sequence of the Hu-1 (wild type) variant was taken from the NCBI database [102] with the accession number QHR63290. The number of copies of the nucleocapsid phosphoprotein in the virus particle was taken from [104,105,106].

2.2. Elemental Composition

The virus genetic and protein sequences were used to find the elemental composition of the virus nucleocapsid, using the atom counting method [58]. The atom counting method was used to find the nucleocapsid empirical formula, molar mass of the nucleocapsid empirical formula, and molar mass of the entire nucleocapsid. The atom counting method has been described in [58]. It calculates the elemental composition of the virus particles using widely available data on genetic sequences, protein sequences, protein copy numbers, and virus size. The atom counting method is implemented using a computer program, which runs along nucleic acids and protein sequences and adds atoms coming from every residue. The contributions of proteins are multiplied by their copy numbers in the virus particle. Finally, the contributions of the nucleic acid and the proteins are summed to find the elemental composition of the virus particle. The atom counting method was found to give results in good agreement with experimentally determined elemental composition of the viruses [58,59,60].

2.3. Thermodynamic Properties of Live Matter

Nucleocapsid elemental compositions of the analyzed Omicron BA.2.75 isolates were used to find the standard thermodynamic properties of their nucleocapsids. This was conducted using predictive biothermodynamic models including the Patel–Erickson equation [61,62] and Battley equation [63].
Standard enthalpy of formation was calculated in two steps. First, the Patel–Erickson equation [61,62] was used to find the standard enthalpy of combustion, which was then converted into the standard enthalpy of formation using Hess’s law [107,108]. The Patel–Erickson equation gives the standard enthalpy of combustion of live matter, ΔCH0(bio), from the number of electrons transferred to oxygen during combustion, E [61,62].
Δ C H 0 b i o = 111.14 k J C m o l · E
E is calculated from the elemental composition, using the equation
E = 4 n C + n H 2 n O 0 n N + 5 n P + 6 n S
where nJ is the number of atoms of element J in the empirical formula of live matter [61,62]. ΔCH0(bio) can be converted into the standard enthalpy of the formation of live matter, ΔfH0(bio), using the equation [8]
Δ f H 0 b i o = n C   Δ f H 0 C O 2 + n H 2   Δ f H 0 H 2 O + n P 4   Δ f H 0 P 4 O 10 + n S   Δ f H 0 S O 3 Δ C H 0 b i o
Like for ΔfH0(bio), the entropy of live matter can also be calculated using predictive biothermodynamic models. Elemental composition can also be used to find the standard molar entropy of live matter, S0m(bio), using the Battley equation
S m 0 b i o = 0.187   J S m 0 J a J n J
where S0m(J) and aJ are the standard molar entropy and number of atoms of element J per formula unit in its standard state elemental form [63]. For example, the standard state elemental form of carbon is graphite represented by C, meaning that S0m(C) = 5.740 J/mol K and aC = 1 [107,108]. On the other hand, the standard state of hydrogen is gaseous H2, meaning that S0m(H2) = 130.684 and aH = 2 [107,108]. The Battley equation can be rearranged to give the standard entropy of the formation of live matter, ΔfS⁰(bio), by replacing the constant in from of the sum term with −0.813 [63].
Δ f S 0 b i o = 0.813   J S m 0 J a J n J
The changed constant from +0.187 to −0.817 comes from using a different reference state for measuring entropy [63]. The calculated ΔfS⁰(bio) and ΔfH0(bio) values are combined to find the standard Gibbs energy of the formation of live matter, ΔfG0(bio).
Δ f G 0 b i o = Δ f H 0 b i o T Δ f S 0 b i o
where T is the temperature [107,108].

2.4. Biosynthesis Reactions and Thermodynamic Properties of Biosynthesis

Elemental composition of live matter can be used to construct macrochemical reactions describing the production of live matter from nutrients, known as biosynthesis reactions. Stoichiometric coefficients in biosynthesis reactions depend on live matter elemental composition, since the more an element is present in live matter, the more nutrient that contains it will be needed for biosynthesis. The biosynthesis reactions of viruses can be described by the general reaction
AA + O2 + HPO42− + HCO3(Bio) + SO42− + H2O + H2CO3
where AA denotes a mixture of amino acids and (Bio) newly produced nucleocapsid live matter [8]. The standard thermodynamic properties of biosynthesis are found by applying Hess’s law to biosynthesis reactions, through the equations
Δ b s H 0 = p r o d u c t s ν   Δ f H 0 r e a c t a n t s ν   Δ f H 0
Δ b s S 0 = p r o d u c t s ν   S m 0 r e a c t a n t s ν     S m 0
Δ b s G 0 = p r o d u c t s ν   Δ f G 0 r e a c t a n t s ν   Δ f G 0
where ΔbsH0, ΔbsS0, and ΔbsG0 represent the standard enthalpy, entropy, and Gibbs energy of biosynthesis, respectively [8,107,108].

3. Results

The empirical formulas of the Omicron BA.2.75 nucleocapsids were determined for the first time and are presented in Table 1. For the Omicron BA.2.75 isolate from Germany, the nucleocapsid empirical formula was found to be CH1.5736O0.3426N0.3124P0.00601S0.00336. The empirical formula of the Omicron BA.2.75 nucleocapsid for the isolate from India was CH1.5735O0.3427N0.3124P0.00603S0.00336. The empirical formula of the Omicron BA.2.75 nucleocapsid for the isolate from USA was CH1.5737O0.3425N0.3123P0.00598S0.00336. Moreover, Table 1 gives the molar mass (molar weight) data for the nucleocapsids for the three isolates, reported in two forms: for unit carbon formulas and for entire nucleocapsids. Molar masses of the empirical formulas were 23.75 g/C-mol for the isolates from Germany and India, and 23.74 g/C-mol for the isolate from the USA. The molar mass of the entire nucleocapsid for the Omicron BA.2.75 isolates from Germany and USA was 117.2 MDa, while that of the isolate from India was 117.1 MDa.
Table 2 shows the stoichiometry of the biosynthesis for the BA.2.75 subvariant for all three isolates. Table 3 gives the standard thermodynamic properties of the formation for the nucleocapsids of the Omicron BA.2.75 subvariant. Table 4 presents the data on the standard thermodynamic properties of biosynthesis for the nucleocapsids of the Omicron BA.2.75 subvariant for all three isolates. The thermodynamic properties of biosynthesis refer to the production of live matter from nutrients. Gibbs energies of biosynthesis for the nucleocapsids of the isolates from Germany, India, and USA were −221.18 kJ/C-mol, −221.24 kJ/C-mol, and −221.12 kJ/C-mol, respectively.
Table 5 gives the elemental compositions of the SARS-CoV-2 Omicron BA.2.75 subvariant for nucleic acid and proteins and the entire virion. Nucleic acid and proteins denote the viral RNA genome and all copies of proteins constituting the virus particle. Entire virion denotes the entire virus particle including the nucleic acid, all proteins, and lipids in the envelope. Elemental compositions are reported as empirical formulas, normalized per mole of carbon. Table 6 gives the stoichiometric coefficients for the biosynthesis reactions of the SARS-CoV-2 Omicron BA.2.75 subvariant for nucleic acid and all proteins and the entire virion (including envelope lipids). Biosynthesis reactions represent the formation of live matter from nutrients as they are found in the organism’s environment. Table 7 shows the standard thermodynamic properties of the live matter of the SARS-CoV-2 Omicron BA.2.75 subvariant for nucleic acid and proteins and the entire virion. These were then combined with biosynthesis stoichiometry from Table 6 to find the standard thermodynamic properties of biosynthesis. Table 8 gives the standard thermodynamic properties of the biosynthesis of the SARS-CoV-2 Omicron BA.2.75 subvariant for nucleic acid and proteins and the entire virion.

4. Discussion

In 2019, the year when COVID-19 appeared and SARS-CoV-2 was identified as the cause of the disease, the entire empirical formula of only one virus was known—the poliovirus [59,60] as well as partial formulas of some bacteriophages [109]. Thermodynamic properties of human viruses were not available in the literature. Enthalpy change during the multiplication of the T4 phage in E. coli cells was measured by Guosheng et al. [50] and the transition from the lysogenic into lytic cycle of the Lambda phage was studied by Maskow et al. [51] using calorimetry. This situation has created a need to determine the empirical formula and thermodynamic properties of SARS-CoV-2 and other viruses. The obstacle to determining the empirical formula of viruses is the fact that viruses are hard to obtain in sufficiently pure state and in an amount required for analysis as well as the fact that most thermodynamic laboratories do not possess an adequate biosafety level. Determining the empirical formula has become possible after the development of the atom counting method [58]. Through application of this method, elemental compositions of the poliovirus and some other viruses were determined [110] and compared with the values obtained experimentally [59,60]. It was found that the calculated results obtained using the atom counting method are in good agreement with the experimentally determined values [58]. The empirical formula of the SARS-CoV-2 wild type (Hu-1) has been reported in [111]. Degueldre [112] has suggested a modified empirical formula of SARS-CoV-2 and an experimental method for the accurate measurement of virus elemental composition using mass spectrometry. Şimşek et al. [13] computationally found the formula of the Hu-1 variant of SARS-CoV-2.
The empirical formula of the Hu-1 variant of SARS-CoV-2 nucleocapsid [111] is CH1.5708O0.3452N0.3125P0.0060S0.0033. SARS-CoV-2 has during the last 3 years mutated multiple times. As a consequence of mutations, there have been changes in its elemental composition and thermodynamic properties. One of the goals of this paper was to find the empirical formula of the BA.2.75 subvariant nucleocapsid. Using the atom counting method, the empirical formula of Omicron BA.2.75 was calculated and is reported in Table 1. The empirical formula of the Omicron BA.2.75 nucleocapsid isolated in Germany was CH1.5736O0.3426N0.3124P0.00601S0.00336. The empirical formula of the Omicron BA.2.75 nucleocapsid isolated in India was CH1.5735O0.3427N0.3124P0.00603S0.00336. The empirical formula of the Omicron BA.2.75 nucleocapsid isolated in USA was CH1.5737O0.3425N0.3123P0.00598S0.00336. As expected, since all three formulas were for the same BA.2.75 subvariant, the empirical formulas were almost identical for all three samples taken from different continents. Additionally, the molar masses were determined, which are given in Table 1. The molar masses have been reported on two bases: first, the molar mass of empirical formula of the nucleocapsid was in daltons (g/C-mol), Mr, while the second was the molar mass of the entire nucleocapsid in megadaltons, Mr(nc). Dividing Mr(nc) with Mr gives the number of empirical formulas (C-atoms) in the entire nucleocapsid. The molar masses were, as expected, almost identical for the three BA.2.75 isolates. The molar mass of the entire nucleocapsid for the Omicron BA.2.75 isolates from Germany and USA were 117.2 MDa, while that of the isolate from India was 117.1 MDa. However, if we compare the empirical formula of BA.2.75 with that of Hu-1, we can note significant differences. The differences were the greatest in H and O content.
Table 2 gives the stoichiometric coefficients for the biosynthesis reactions of the nucleocapsids of the BA.2.75 subvariant. For the Hu-1 wild type, the biosynthesis reaction is
1.3905 AA + 0.4937 O2 + 0.006 HPO42− + 0.0437 HCO3→(Bio) + 0.0279 SO42− + 0.0551 H2O + 0.4342 H2CO3
where AA denotes amino acids and (bio) denotes the empirical formula of the Hu-1 variant (CH1.5708O0.3452N0.3125P0.0060S0.0033) [111]. The stoichiometric coefficients were very similar to those of all three samples of the BA.2.75 subvariant (Table 2).
Virus multiplication represents a biological process through an increase in the number of virus particles, resulting in the phenomenon of growth. Virus multiplication includes the replication of the virus nucleic acid, transcription, translation, self-assembly, and maturation. The replication of nucleic acids represents the polymerization reaction, based on an information template. There is polymerization of nucleotides into an identical copy of nucleic acid of the mother. The driving force for the polymerization reaction represents the Gibbs energy of biosynthesis [8]. Transcription represents a process of the polymerization of nucleotides into messenger RNA. The driving force for this reaction is the Gibbs energy of the biosynthesis of RNA. Translation represents a reaction of protein biosynthesis, based on an information template contained in the virus nucleic acid. The polymerization of amino acids into structural and functional virus proteins is driven by the Gibbs energy of the biosynthesis of proteins [110]. Self-assembly is a physical process of the formation of new virus particles from the synthesized virus components, using the hijacked cell metabolism. The driving force for self-assembly is also the Gibbs energy of self-assembly. The virus uses the host cell’s membrane to form new virus particles.
All of these processes require energy in the form of ATP or other nucleotide triphosphates. These are supplied by the host cell’s metabolic machinery, which has been hijacked by the virus. The energy supplied by the host cell comes from catabolism, which breaks down nutrients to obtain energy. The catabolism and the rest of the cell’s metabolic machinery are shared between the virus and its host. Therefore, they are identical for both and do not influence the competition outcome. The competition outcome is determined by the ability for biosynthesis during the biosynthetic processes of replication, transcription, and translation. The organism that performs these processes the fastest will win the competition for metabolic machinery.
Table 3 presents the standard thermodynamic properties of nucleocapsids of the three isolates of Omicron BA.2.75 subvariant. Standard enthalpies and the Gibbs energies of the formation of the three isolates were only slightly different. The standard entropies of formation were identical for all three samples. Thus, the standard thermodynamic properties of formation were very similar for all three samples, since they belonged to the same Omicron BA.2.75 subvariant.
Table 4 shows the standard thermodynamic properties of the biosynthesis of nucleocapsids of Omicron BA.2.75 subvariant samples from Germany, India, and USA. Standard thermodynamic properties of biosynthesis refer to the production of nucleocapsid live matter from nutrients [8]. Their values were very similar for all three BA.2.75 samples. However, for the Hu-1 variant, ΔbsH0 = −233.4 kJ/C-mol, ΔbsS0 = −37.7 kJ/C-mol, and ΔbsG0 = −222.2 kJ/C-mol. It can immediately be noticed that the Gibbs energy of the biosynthesis of the Omicron BA.2.75 subvariant (all three samples) was less negative than that of the Hu-1 variant. According to the evolution theory, it is expected that the SARS-CoV-2 virus evolves toward an increased infectivity and decreased or constant pathogenicity. Indeed, the Gibbs energy of antigen-receptor binding, of the Hu-1 variant is −43.4 kJ/mol [11], while that of the Omicron BA.2.75 variant is −49.41 kJ/mol [69]. The Gibbs energy of antigen–receptor binding is proportional to the binding rate, according to the binding phenomenological equation [69]. This leads to the conclusion that the binding rate, and thereby infectivity, has increased during evolution from Hu-1 to BA.2.75. However, the expected decrease in pathogenicity would have to be caused by decreased rates of the multiplication and biosynthesis of virus structural elements. The rates of multiplication and biosynthesis are proportional to Gibbs energy of biosynthesis. In that case, Gibbs energy of biosynthesis would have to be the same or less negative for BA.2.75 compared to Hu-1. Indeed, the Gibbs energy of the biosynthesis of the nucleocapsid for BA.2.75 is −221.2 kJ/C-mol, while that of Hu-1 is −222.2 kJ/C-mol. Thus, the Gibbs energy of the biosynthesis of BA.2.75 was slightly less negative, implying a lower rate of biosynthesis, multiplication, accumulation of viruses in host cells, and damage to host cells. Thus, it seems that the BA.2.75 subvariant has evolved exactly as expected by the theory of evolution, regarding the decrease in pathogenicity.
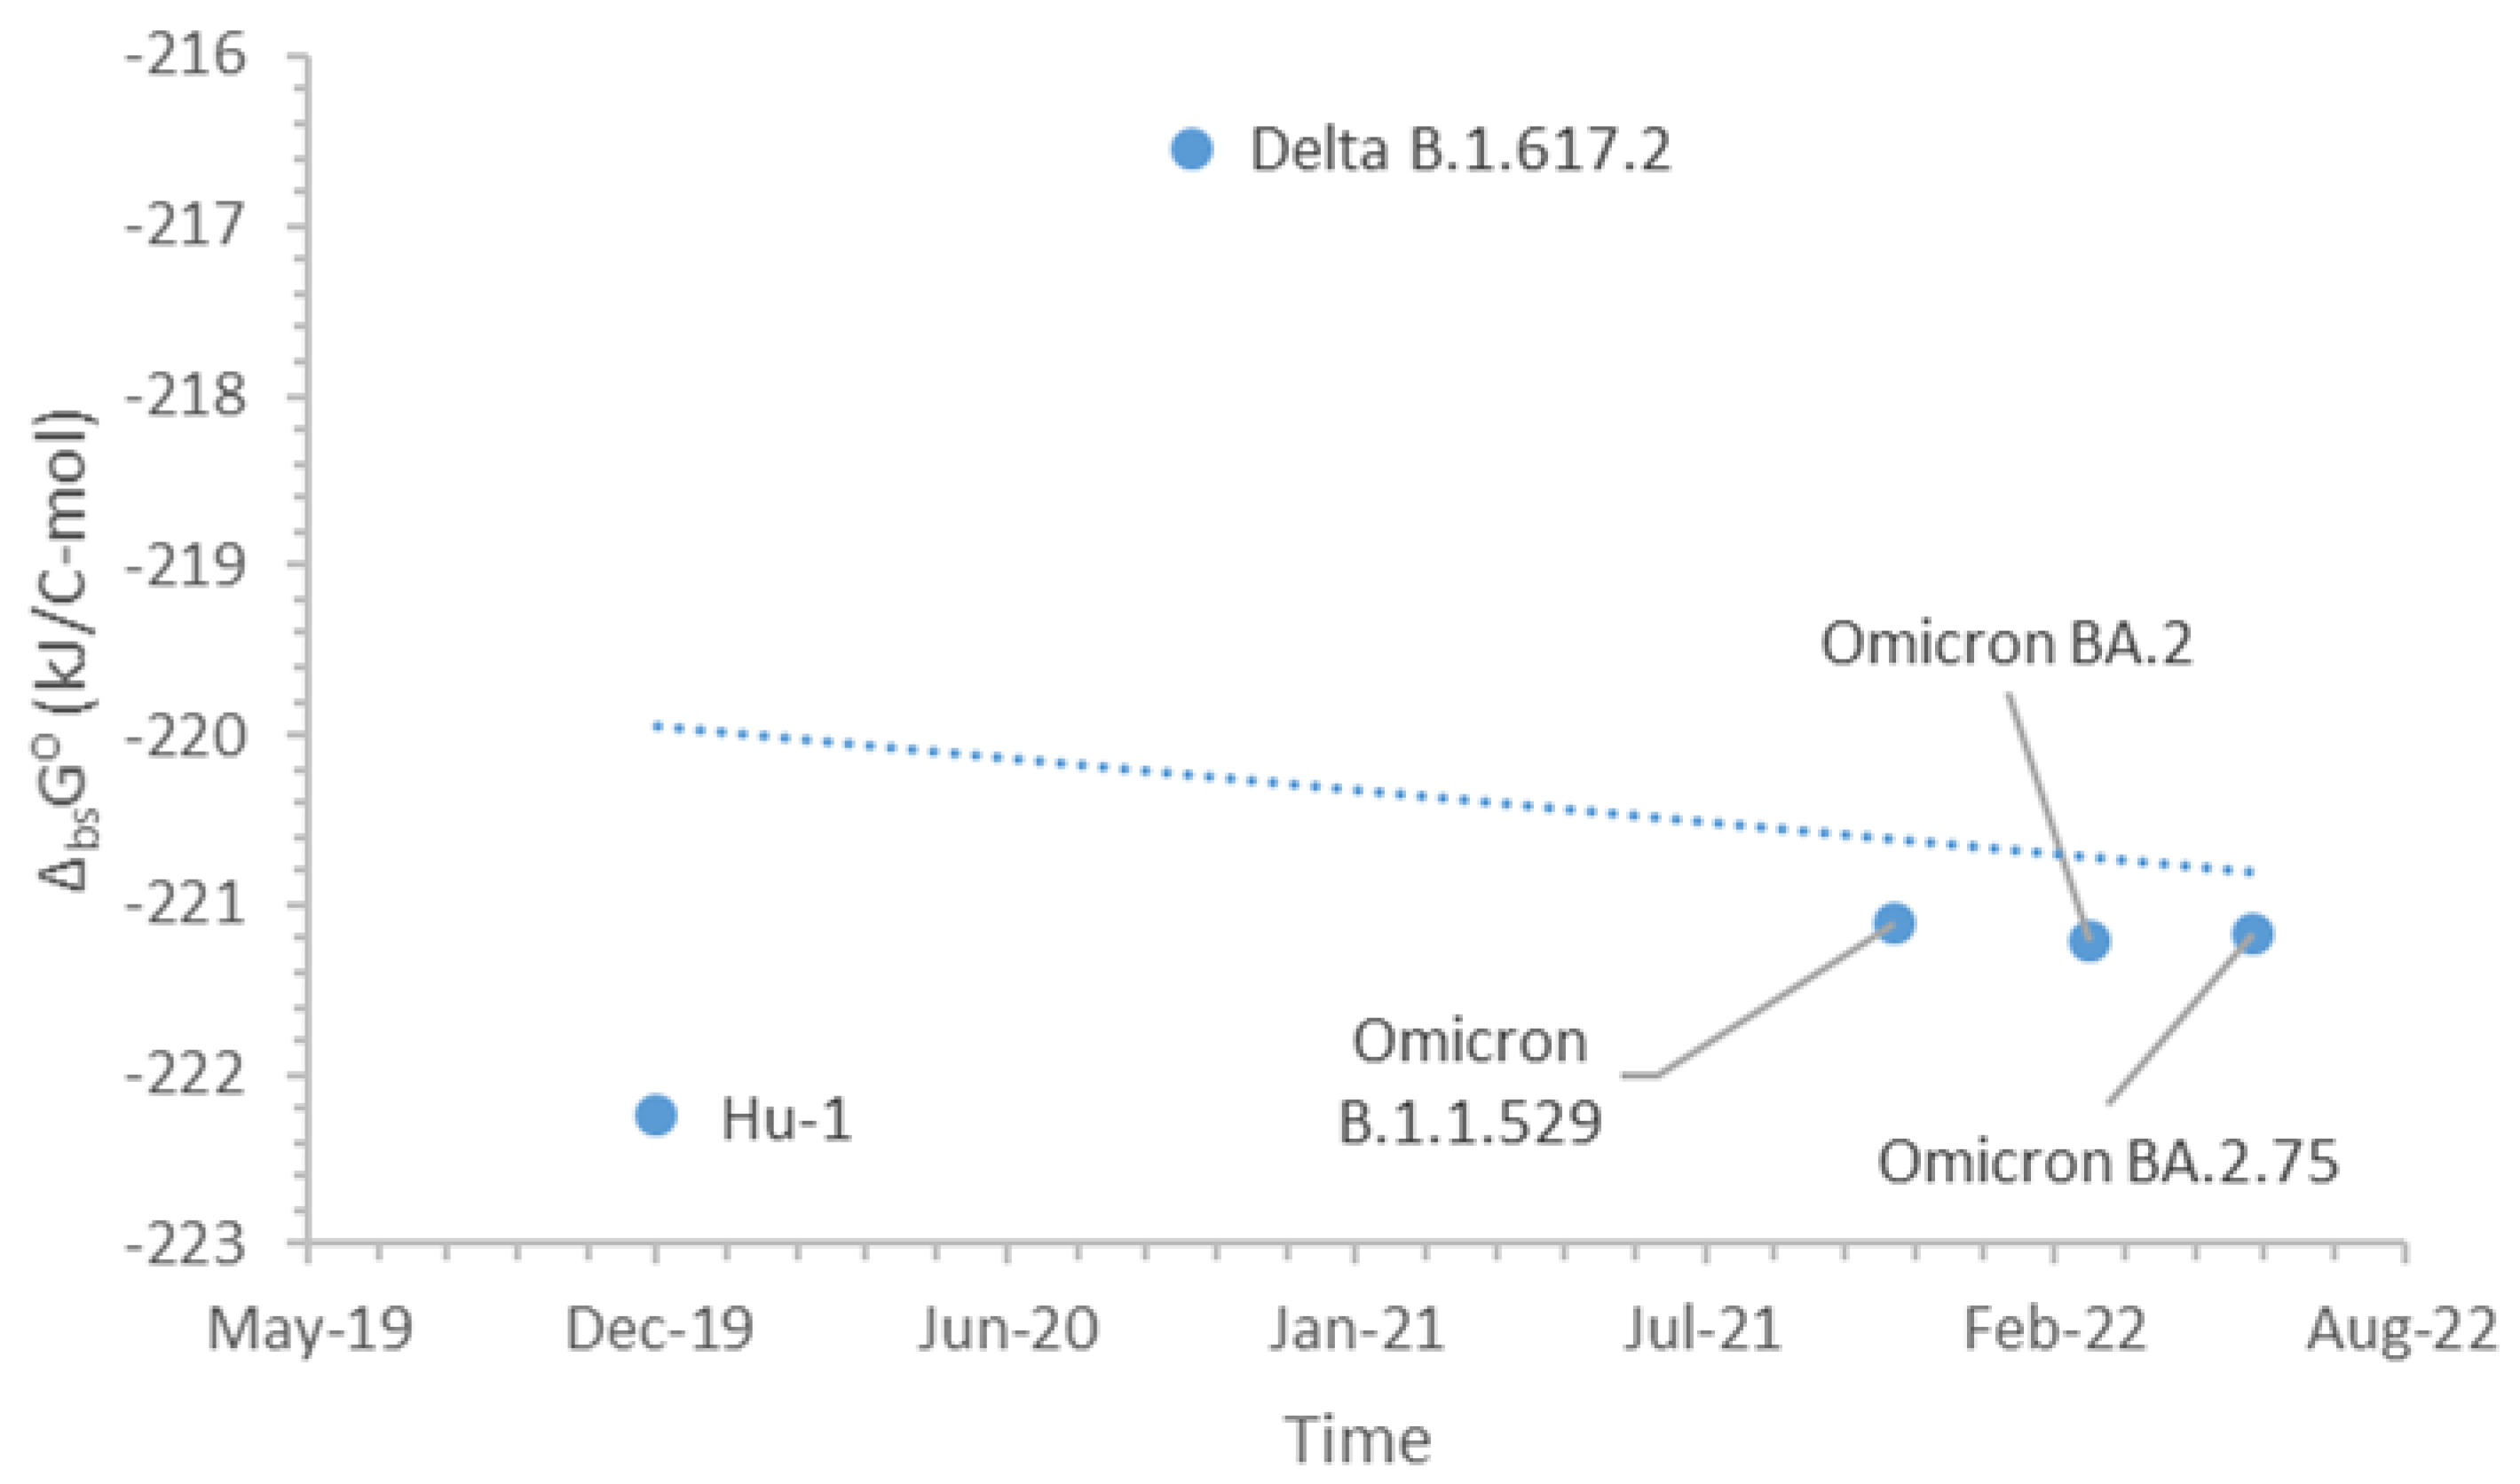
Figure 1 shows the standard Gibbs energies of the biosynthesis of nucleocapsids and their dates of appearance of SARS-CoV-2 variants including Hu-1 (Wild type), Delta B.1.617.2, Omicron B.1.1.529, Omicron BA.2, and Omicron BA.2.75. From the graph, it is possible to see the evolution of SARS-CoV-2 related to the multiplication inside the host cells. The trend of evolution is given by the dotted line. The values for the Omicron B.1.1.529, Omicron BA.2, and Omicron BA.2.75 variants were very similar. This implies that the mutations mostly occurred in the part of the nucleic acid related to the binding domain, rather than multiplication inside the host cell.
Table 8 provides the thermodynamic properties of biosynthesis for the nucleic acid and proteins as well as entire virus particles. There was a significant difference in the thermodynamic properties of the biosynthesis of nucleocapsids (nucleic acid with nucleoproteins) and nucleic acid with all of the proteins. Standard Gibbs energies of the biosynthesis of BA.2.75 nucleic acid and proteins was close to −174.5 kJ/C-mol. For the entire virus particles, the calculated standard Gibbs energy of biosynthesis was −9.45 kJ/C-mol.
The virus–host interaction occurred at two sites: at the host cell’s membrane (antigen-receptor binding) and in the cytoplasm (virus multiplication). Both processes represent chemical reactions and are driven by Gibbs energy. Antigen–receptor binding is driven by the Gibbs energy of binding, while virus multiplication is driven by the Gibbs energy of biosynthesis. Infectivity and transmissibility depend on the binding rate and Gibbs energy of binding. The Gibbs energy of binding is specific for each antigen–receptor pair and depends on the 3D structures of the antigen and receptor, which determine the intermolecular forces such as hydrogen bonds, van der Waals forces, hydrophobic interactions, etc. All of these interactions are taken into account in the Gibbs energy of binding, which is measured experimentally using methods such as surface plasmon resonance [113,114] or the non-competitive ELISA approach [115,116]. An analysis of Omicron BA.2.75 subvariant infectivity based on thee Gibbs energy of binding can be found in [69]. This research did not take into account the immune response, which would be an interesting subject for future research. Pathogenicity is a biological phenomenon, which is a consequence of the virus multiplication rate as well as the damage that occurs on the host cell during virus multiplication. The virus multiplication rate depends on its thermodynamic driving force—the Gibbs energy of biosynthesis. The Gibbs energy of biosynthesis and other thermodynamic properties can be calculated using standard thermodynamic tools, which are used for other microorganisms including the predictive biothermodynamic models (e.g., Patel–Erickson, Battley, Roels), growth reactions, thermodynamic properties of biosynthesis, etc.
The mechanistic biothermodynamic model that was presented in this paper is applicable to pathogen–host interactions of virions, subcellular, and cellular organisms. If we are discussing virus–host interactions, the hosts are cells of various tissues. On the other hand, if we are analyzing bacteria–host interactions, the hosts are various tissues and organisms, which are the subject of the interaction with microorganisms. The model is the same, but the analysis uses the thermodynamic properties of appropriate cells in the case of interactions with viruses, or tissues in the case of interaction with bacteria. Comparing the growth rates of microorganisms with those of cells and tissues provides an assessment of the ability of microorganisms to hijack the building blocks from the host.

5. Conclusions

The empirical formulas of the BA.2.75 subvariant nucleocapsid were determined for three isolates from Germany, India, and the USA. The empirical formulas and thermodynamic properties were very similar for the three isolates. The empirical formula of the isolate from Germany was CH1.5736O0.3426N0.3124P0.00601S0.00336. For the isolate from India, it was CH1.5735O0.3427N0.3124P0.00603S0.00336. Finally, for the isolate from the USA, it was CH1.5737O0.3425N0.3123P0.00598S0.00336. The similar empirical formulas can be explained by the three isolates belonging to the same BA.2.75 subvariant.
Molar masses were determined for the Omicron BA.2.75 subvariant nucleocapsids. Molar masses were reported on two bases: the molar masses of empirical formulas and the molar masses of entire nucleocapsids. The molar masses of thee empirical formulas were 23.75 g/C-mol for the isolates from Germany and India, and 23.74 g/C-mol for the isolate from the USA. The molar masses of the entire nucleocapsids for the isolates from Germany and India were 117.2 MDa, while that of the isolate from the USA was 117.1 MDa. Therefore, the molar masses were very similar for all three isolates of the Omicron BA.2.75 subvariant.
The Gibbs energy of biosynthesis was calculated for nucleocapsids of the Omicron BA.2.75 subvariant. The Gibbs energies of the biosynthesis for the nucleocapsids of the isolates from Germany, India, and the USA were −221.18 kJ/C-mol, −221.24 kJ/C-mol, and −221.12 kJ/C-mol, respectively. The three values were very similar to each other. However, they were all slightly less negative compared to that of the Hu-1 wild type, which was −222.2 kJ/C-mol. Thus, even though there is a great homogeneity in the elemental composition and thermodynamic properties within the Omicron BA.2.75 subvariant, there is a difference compared to the Hu-1 wild type.
Due to the less negative Gibbs energy of nucleocapsid biosynthesis, the pathogenicity of the Omicron BA.2.75 subvariant should be slightly lower than that of Hu-1. This is in accordance with the predictions of evolution theory. Mutations that appeared during evolution from Hu-1 to BA.2.75 variant have led to a decrease in the Gibbs energy of biosynthesis and thereby a decrease in the rates of virion multiplication, virion accumulation inside the host cells, and damage to host cells.

Supplementary Materials

The following supporting information can be downloaded at: https://www.mdpi.com/article/10.3390/microbiolres13040066/s1, Text S1: GISAID dataset availability and description.

Funding

This research received no external funding.

Institutional Review Board Statement

Not applicable.

Informed Consent Statement

Not applicable.

Data Availability Statement

The findings of this study are based on metadata associated with three sequences available on GISAID up to 22 October 2022, and accessible at https://doi.org/10.55876/gis8.221022gh (GISAID Identifier: EPI_SET_221022gh).

Acknowledgments

The author gratefully acknowledges all data contributors (i.e., the authors and the originating laboratories responsible for obtaining the specimens, and their submitting laboratories for generating the genetic sequence and metadata and sharing via the GISAID Initiative, on which this research is based).

Conflicts of Interest

The author declares no conflict of interest.

References

  1. Riedel, S.; Morse, S.; Mietzner, T.; Miller, S. Jawetz, Melnick & Adelbergs Medical Microbiology, 28th ed.; McGraw-Hill Education: New York, NY, USA, 2019. [Google Scholar]
  2. Istifli, E.S.; Netz, P.A.; Sihoglu Tepe, A.; Sarikurkcu, C.; Tepe, B. Understanding the molecular interaction of SARS-CoV-2 spike mutants with ACE2 (angiotensin converting enzyme 2). J. Biomol. Struct. Dyn. 2021, 1–12. [Google Scholar] [CrossRef] [PubMed]
  3. Datta, S.; Hett, E.C.; Vora, K.A.; Hazuda, D.J.; Oslund, R.C.; Fadeyi, O.O.; Emili, A. The chemical biology of coronavirus host-cell interactions. RSC Chem. Biol. 2020, 2, 30–46. [Google Scholar] [CrossRef] [PubMed]
  4. Popovic, M.E.; Minceva, M. Thermodynamic properties of human tissues. Therm. Sci. 2020, 24 Pt B, 4115–4133. [Google Scholar] [CrossRef] [Green Version]
  5. Popovic, M.; Minceva, M. Standard Thermodynamic Properties, Biosynthesis Rates, and the Driving Force of Growth of Five Agricultural Plants. Front. Plant Sci. 2021, 12, 671868. [Google Scholar] [CrossRef]
  6. Popovic, M.; Popovic, M. Strain Wars: Competitive interactions between SARS-CoV-2 strains are explained by Gibbs energy of antigen-receptor binding. Microb. Risk Anal. 2022, 21, 100202. [Google Scholar] [CrossRef]
  7. Popovic, M. Strain wars 2: Binding constants, enthalpies, entropies, Gibbs energies and rates of binding of SARS-CoV-2 variants. Virology 2022, 570, 35–44. [Google Scholar] [CrossRef] [PubMed]
  8. Popovic, M. Strain wars 3: Differences in infectivity and pathogenicity between Delta and Omicron strains of SARS-CoV-2 can be explained by thermodynamic and kinetic parameters of binding and growth. Microb. Risk Anal. 2022, 100217. [Google Scholar] [CrossRef]
  9. Popovic, M. Strain Wars 4—Darwinian evolution through Gibbs’ glasses: Gibbs energies of binding and growth explain evolution of SARS-CoV-2 from Hu-1 to BA.2. Virology 2022, 575, 36–42. [Google Scholar] [CrossRef]
  10. Popovic, M. Strain Wars 5: Gibbs energies of binding of BA.1 through BA.4 variants of SARS-CoV-2. Microb. Risk Anal. 2022, 100231. [Google Scholar] [CrossRef]
  11. Popovic, M. Beyond COVID-19: Do biothermodynamic properties allow predicting the future evolution of SARS-CoV-2 variants? Microb. Risk Anal. 2022, 22, 100232. [Google Scholar] [CrossRef]
  12. Popovic, M.; Minceva, M. Coinfection and Interference Phenomena Are the Results of Multiple Thermodynamic Competitive Interactions. Microorganisms 2022, 9, 2060. [Google Scholar] [CrossRef] [PubMed]
  13. Şimşek, B.; Özilgen, M.; Utku, F.Ş. How much energy is stored in SARS-CoV-2 and its structural elements? Energy Storage 2021, 4, e298. [Google Scholar] [CrossRef]
  14. Von Bertalanffy, L. The theory of open systems in physics and biology. Science 1950, 111, 23–29. [Google Scholar] [CrossRef] [PubMed] [Green Version]
  15. Balmer, R.T. Modern Engineering Thermodynamics; Academic Press: Cambridge, MA, USA, 2010. [Google Scholar] [CrossRef]
  16. Ozilgen, M.; Sorgüven, E. Biothermodynamics: Principles and Applications; CRC Press: Boca Raton, FL, USA, 2017. [Google Scholar]
  17. Lucia, U.; Grisolia, G.; Deisboeck, T.S. Thermodynamics and SARS-CoV-2: Neurological effects in post-Covid 19 syndrome. Atti Della Accad. Peloritana Dei Pericolanti 2021, 99, A3. [Google Scholar] [CrossRef]
  18. Lucia, U.; Grisolia, G.; Deisboeck, T.S. Seebeck-like effect in SARS-CoV-2 bio-thermodynamics. Atti Della Accad. Peloritana Dei Pericolanti-Cl. Di Sci. Fis. Mat. E Nat. 2020, 98, 6. [Google Scholar] [CrossRef]
  19. Lucia, U. Bioengineering thermodynamics of biological cells. Theor. Biol. Med. Model. 2015, 12, 29. [Google Scholar] [CrossRef] [Green Version]
  20. Von Stockar, U. Live cells as open non-equilibrium systems. In Biothermodynamics: The Role of Thermodynamics in Biochemical Engineering; von Stockar, U., Ed.; EPFL Press: Lausanne, Switzerland, 2013; pp. 475–534. [Google Scholar] [CrossRef]
  21. Von Stockar, U. Biothermodynamics of live cells: Energy dissipation and heat generation in cellular structures. In Biothermodynamics: The Role of Thermodynamics in Biochemical Engineering; von Stockar, U., Ed.; EPFL Press: Lausanne, Switzerland, 2013; pp. 475–534. [Google Scholar] [CrossRef]
  22. Lucia, U.; Grisolia, G. How life works—A continuous Seebeck-Peltier transition in cell membrane? Entropy 2020, 22, 960. [Google Scholar] [CrossRef]
  23. Schrödinger, E. What Is Life? The Physical Aspect of the Living Cell; Cambridge University Press: Cambridge, UK, 1944; ISBN 0-521-42708-8. [Google Scholar]
  24. Morowitz, H.J. Beginnings of Cellular Life: Metabolism Recapitulates Biogenesis; Yale University Press: New Haven, CT, USA, 1992. [Google Scholar]
  25. Morowitz, H.J. Energy Flow in Biology: Biological Organization as a Problem in Thermal Physics; Academic Press: New York, NY, USA, 1968. [Google Scholar]
  26. Popovic, M. Research in entropy wonderland: A review of the entropy concept. Therm. Sci. 2018, 22, 1163–1178. [Google Scholar] [CrossRef] [Green Version]
  27. Barros, N. Thermodynamics of Soil Microbial Metabolism: Applications and Functions. Appl. Sci. 2021, 11, 4962. [Google Scholar] [CrossRef]
  28. Popovic, M. Thermodynamic properties of microorganisms: Determination and analysis of enthalpy, entropy, and Gibbs free energy of biomass, cells and colonies of 32 microorganism species. Helyon 2019, 5, e01950. [Google Scholar] [CrossRef] [Green Version]
  29. Popovic, M. Living organisms from Prigogine’s perspective: An opportunity to introduce students to biological entropy balance. J. Biol. Educ. 2017, 52, 294–300. [Google Scholar] [CrossRef]
  30. Popovic, M. Comparative study of entropy and information change in closed and open thermodynamic systems. Thermochim. Acta 2014, 598, 77–81. [Google Scholar] [CrossRef]
  31. Popovic, M. Entropy change of open thermodynamic systems in self-organizing processes. Therm. Sci. 2014, 18, 1425–1432. [Google Scholar] [CrossRef]
  32. Schubert, T.; Breuer, U.; Harms, H.; Maskow, T. Calorimetric bioprocess monitoring by small modifications to a standard bench-scale bioreactor. J. Biotechnol. 2007, 130, 24–31. [Google Scholar] [CrossRef] [PubMed]
  33. Duong, H.L.; Paufler, S.; Harms, H.; Maskow, T.; Schlosser, D. Applicability and information value of biocalorimetry for the monitoring of fungal solid-state fermentation of lignocellulosic agricultural by-products. New Biotechnol. 2022, 66, 97–106. [Google Scholar] [CrossRef]
  34. Barros, N.; Fernandez, I.; Byrne, K.A.; Jovani-Sancho, A.J.; Ros-Mangriñan, E.; Hansen, L.D. Thermodynamics of soil organic matter decomposition in semi-natural oak (Quercus) woodland in southwest Ireland. Oikos 2020, 129, 1632–1644. [Google Scholar] [CrossRef]
  35. Barros, N.; Hansen, L.D.; Piñeiro, V.; Pérez-Cruzado, C.; Villanueva, M.; Proupín, J.; Rodríguez-Añón, J.A. Factors influencing the calorespirometric ratios of soil microbial metabolism. Soil Biol. Biochem. 2016, 92, 221–229. [Google Scholar] [CrossRef]
  36. Hansen, L.D.; Tolley, H.D.; Woodfield, B.F. Transformation of matter in living organisms during growth and evolution. Biophys. Chem. 2021, 271, 106550. [Google Scholar] [CrossRef]
  37. Hansen, L.D.; Popovic, M.; Tolley, H.D.; Woodfield, B.F. Laws of evolution parallel the laws of thermodynamics. J. Chem. Thermodyn. 2018, 124, 141–148. [Google Scholar] [CrossRef]
  38. Hansen, L.D.; Criddle, R.S.; Battley, E.H. Biological calorimetry and the thermodynamics of the origination and evolution of life. Pure Appl. Chem. 2009, 81, 1843–1855. [Google Scholar] [CrossRef]
  39. Gale, P. Using thermodynamic equilibrium models to predict the effect of antiviral agents on infectivity: Theoretical application to SARS-CoV-2 and other viruses. Microb. Risk Anal. 2021, 21, 100198. [Google Scholar] [CrossRef] [PubMed]
  40. Gale, P. How virus size and attachment parameters affect the temperature sensitivity of virus binding to host cells: Predictions of a thermodynamic model for arboviruses and HIV. Microb. Risk Anal. 2020, 15, 100104. [Google Scholar] [CrossRef] [PubMed]
  41. Gale, P. Towards a thermodynamic mechanistic model for the effect of temperature on arthropod vector competence for transmission of arboviruses. Microb. Risk Anal. 2019, 12, 27–43. [Google Scholar] [CrossRef]
  42. Gale, P. Using thermodynamic parameters to calibrate a mechanistic dose-response for infection of a host by a virus. Microb. Risk Anal. 2018, 8, 1–13. [Google Scholar] [CrossRef] [PubMed]
  43. Katen, S.; Zlotnick, A. The thermodynamics of virus capsid assembly. In Methods in Enzymology; Johnson, M.L., Holt, J.M., Ackers, G.K., Eds.; Academic Press: Cambridge, MA, USA, 2009; Volume 455, pp. 395–417. [Google Scholar] [CrossRef] [Green Version]
  44. Ceres, P.; Zlotnick, A. Weak protein-protein interactions are sufficient to drive assembly of hepatitis B virus capsids. Biochemistry 2002, 41, 11525–11531. [Google Scholar] [CrossRef] [PubMed]
  45. Casasnovas, J.M.; Springer, T.A. Kinetics and thermodynamics of virus binding to receptor: Studies with rhinovirus, intercellular adhesion molecule-1 (ICAM-1), and surface plasmon resonance. J. Biol. Chem. 1995, 270, 13216–13224. [Google Scholar] [CrossRef] [PubMed]
  46. Mahmoudabadi, G.; Milo, R.; Phillips, R. Energetic cost of building a virus. Proc. Natl. Acad. Sci. USA 2017, 114, E4324–E4333. [Google Scholar] [CrossRef] [Green Version]
  47. Tzlil, S.; Deserno, M.; Gelbart, W.M.; Ben-Shaul, A. A statistical-thermodynamic model of viral budding. Biophys. J. 2004, 86, 2037–2048. [Google Scholar] [CrossRef] [Green Version]
  48. Kaniadakis, G.; Baldi, M.M.; Deisboeck, T.S.; Grisolia, G.; Hristopulos, D.T.; Scarfone, A.M.; Sparavigna, A.; Wada, T.; Lucia, U. The κ-statistics approach to epidemiology. Sci. Rep. 2020, 10, 19949. [Google Scholar] [CrossRef]
  49. Lucia, U.; Deisboeck, T.S.; Grisolia, G. Entropy-based pandemics forecasting. Frontiers in Physics. 2020, 8, 274. [Google Scholar] [CrossRef]
  50. Liu, G.; Liu, Y.; Chen, X.; Liu, P.; Shen, P.; Qv, S. Study on interaction between T4 phage and Escherichia coli B by microcalorimetric method. J. Virol. Methods 2003, 112, 137–143. [Google Scholar] [CrossRef]
  51. Maskow, T.; Kiesel, B.; Schubert, T.; Yong, Z.; Harms, H.; Yao, J. Calorimetric real time monitoring of lambda prophage induction. J. Virol. Methods 2010, 168, 126–132. [Google Scholar] [CrossRef] [PubMed]
  52. Head, R.J.; Lumbers, E.R.; Jarrott, B.; Tretter, F.; Smith, G.; Pringle, K.G.; Islam, S.; Martin, J.H. Systems analysis shows that thermodynamic physiological and pharmacological fundamentals drive COVID-19 and response to treatment. Pharmacol. Res. Perspect. 2022, 10, e00922. [Google Scholar] [CrossRef] [PubMed]
  53. Von Stockar, U.; Maskow, T.; Vojinovic, V. Thermodynamic analysis of metabolic pathways. In Biothermodynamics: The Role of Thermodynamics in Biochemical Engineering; von Stockar, U., Ed.; EPFL Press: Lausanne, Switzerland, 2013; pp. 581–604. [Google Scholar] [CrossRef]
  54. Von Stockar, U.; Maskow, T.; Liu, J.; Marison, I.W.; Patino, R. Thermodynamics of microbial growth and metabolism: An analysis of the current situation. J. Biotechnol. 2006, 121, 517–533. [Google Scholar] [CrossRef] [PubMed]
  55. Maskow, T. Miniaturization of calorimetry: Strengths and weaknesses for bioprocess monitoring. In Biothermodynamics: The Role of Thermodynamics in Biochemical Engineering; von Stockar, U., Ed.; EPFL Press: Lausanne, Switzerland, 2013; pp. 423–442. [Google Scholar] [CrossRef]
  56. Maskow, T.; Kemp, R.; Buchholz, F.; Schubert, T.; Kiesel, B.; Harms, H. What heat is telling us about microbial conversions in nature and technology: From chip- to megacalorimetry. Microb. Biotechnol. 2010, 3, 269–284. [Google Scholar] [CrossRef]
  57. Maskow, T.; von Stockar, U. How reliable are thermodynamic feasibility statements of biochemical pathways? Biotechnol. Bioeng. 2005, 92, 223–230. [Google Scholar] [CrossRef]
  58. Popovic, M. Atom counting method for determining elemental composition of viruses and its applications in biothermodynamics and environmental science. Comput. Biol. Chem. 2022, 96, 107621. [Google Scholar] [CrossRef]
  59. Wimmer, E. The test-tube synthesis of a chemical called poliovirus. The simple synthesis of a virus has far-reaching societal implications. EMBO Rep. 2006, 7, S3–S9. [Google Scholar] [CrossRef] [Green Version]
  60. Molla, A.; Paul, A.V.; Wimmer, E. Cell-free, de novo synthesis of poliovirus. Science 1991, 254, 1647–1651. [Google Scholar] [CrossRef]
  61. Patel, S.A.; Erickson, L.E. Estimation of heats of combustion of biomass from elemental analysis using available electron concepts. Biotechnol. Bioeng. 1981, 23, 2051–2067. [Google Scholar] [CrossRef]
  62. Battley, E.H. The development of direct and indirect methods for the study of the thermodynamics of microbial growth. Thermochim. Acta 1998, 309, 17–37. [Google Scholar] [CrossRef]
  63. Battley, E.H. An empirical method for estimating the entropy of formation and the absolute entropy of dried microbial biomass for use in studies on the thermodynamics of microbial growth. Thermochim. Acta 1999, 326, 7–15. [Google Scholar] [CrossRef]
  64. Roels, J.A. Energetics and Kinetics in Biotechnology; Elsevier: Amsterdam, The Netherlands, 1983. [Google Scholar]
  65. Von Stockar, U.; Liu, J.-S. Does microbial life always feed on negative entropy? Thermodynamic analysis of microbial growth. Biochim. Et Biophys. Acta (BBA)—Bioenerg. 1999, 1412, 191–211. [Google Scholar] [CrossRef] [Green Version]
  66. Sandler, S.I.; Orbey, H. On the thermodynamics of microbial growth processes. Biotechnol. Bioeng. 1991, 38, 697–718. [Google Scholar] [CrossRef] [PubMed]
  67. Sandler, S.I. Chemical, Biochemical, and Engineering Thermodynamics, 5th ed.; Wiley: Hoboken, NJ, USA, 2017; ISBN 978-1-119-32128-6. [Google Scholar]
  68. Du, X.; Li, Y.; Xia, Y.L.; Ai, S.M.; Liang, J.; Sang, P.; Ji, X.-L.; Liu, S.Q. Insights into protein–ligand interactions: Mechanisms, models, and methods. Int. J. Mol. Sci. 2016, 17, 144. [Google Scholar] [CrossRef] [Green Version]
  69. Popovic, M. Omicron BA.2.75 Subvariant of SARS-CoV-2 Is Expected to Have the Greatest Infectivity Compared with the Competing BA.2 and BA.5, Due to Most Negative Gibbs Energy of Binding. BioTech 2022, 11, 45. [Google Scholar] [CrossRef]
  70. Dodd, T.; Botto, M.; Paul, F.; Fernandez-Leiro, R.; Lamers, M.H.; Ivanov, I. Polymerization and editing modes of a high-fidelity DNA polymerase are linked by a well-defined path. Nat. Commun. 2020, 11, 5379. [Google Scholar] [CrossRef]
  71. Johansson, E.; Dixon, N. Replicative DNA polymerases. Cold Spring Harb. Perspect. Biol. 2013, 5, a012799. [Google Scholar] [CrossRef] [Green Version]
  72. Lee, J.; Schwarz, K.J.; Kim, D.S.; Moore, J.S.; Jewett, M.C. Ribosome-mediated polymerization of long chain carbon and cyclic amino acids into peptides in vitro. Nat. Commun. 2020, 11, 4304. [Google Scholar] [CrossRef]
  73. Demirel, Y. Nonequilibrium Thermodynamics: Transport and Rate Processes in Physical, Chemical and Biological Systems, 3rd ed.; Elsevier: Amsterdam, The Netherlands, 2014. [Google Scholar]
  74. Buzón, P.; Maity, S.; Roos, W.H. Physical virology: From virus self-assembly to particle mechanics. Wiley Interdiscip. Rev. Nanomed. Nanobiotechnology 2020, 12, e1613. [Google Scholar] [CrossRef] [Green Version]
  75. Garmann, R.F.; Goldfain, A.M.; Manoharan, V.N. Measurements of the self-assembly kinetics of individual viral capsids around their RNA genome. Proc. Natl. Acad. Sci. USA 2019, 116, 22485–22490. [Google Scholar] [CrossRef] [PubMed] [Green Version]
  76. Schmid, M.; Speiseder, T.; Dobner, T.; Gonzalez, R.A. DNA virus replication compartments. J. Virol. 2014, 88, 1404–1420. [Google Scholar] [CrossRef] [PubMed] [Green Version]
  77. Prigogine, I. Nobel lecture: Time, Structure and Fluctuations. 1977. Available online: https://www.nobelprize.org/prizes/chemistry/1977/prigogine/lecture/ (accessed on 17 July 2022).
  78. Prigogine, I. Etude Thermodynamique des Phénomènes Irréversibles; Dunod: Paris, France, 1947. [Google Scholar]
  79. Prigogine, I.; Wiame, J.M. Biologie et thermodynamique des phénomènes irréversibles. Experientia 1946, 2, 451–453. [Google Scholar] [CrossRef] [PubMed]
  80. Glansdorff, P.; Prigogine, I. Thermodynamic Theory of Structure, Stability and Fluctuations; Wiley: Hoboken, NJ, USA, 1971. [Google Scholar]
  81. Müller, I. A History of Thermodynamics: The Doctrine of Energy and Entropy; Springer: Berlin, Germany, 2010; ISBN 978-3642079641. [Google Scholar]
  82. Kumar, A.; Singh, R.; Kaur, J.; Pandey, S.; Sharma, V.; Thakur, L.; Sati, S.; Mani, S.; Asthana, S.; Sharma, T.K.; et al. Wuhan to World: The COVID-19 Pandemic. Front. Cell. Infect. Microbiol. 2021, 11, 596201. [Google Scholar] [CrossRef]
  83. Acuti Martellucci, C.; Flacco, M.E.; Cappadona, R.; Bravi, F.; Mantovani, L.; Manzoli, L. SARS-CoV-2 pandemic: An overview. Adv. Biol. Regul. 2020, 77, 100736. [Google Scholar] [CrossRef]
  84. Cucinotta, D.; Vanelli, M. WHO Declares COVID-19 a Pandemic. Acta Bio-Med. Atenei Parm. 2020, 91, 157–160. [Google Scholar] [CrossRef]
  85. WHO. Coronavirus Disease (COVID-19) Pandemic. World Health Organization. 2022. Available online: https://www.who.int/emergencies/diseases/novel-coronavirus-2019 (accessed on 23 October 2022).
  86. Worldometer. COVID-19 Coronavirus Pandemic. 2022. Available online: https://www.worldometers.info/coronavirus/ (accessed on 23 October 2022).
  87. Worldometer. WORLD/COUNTRIES/GERMANY. 2022. Available online: https://www.worldometers.info/coronavirus/country/germany/ (accessed on 23 October 2022).
  88. Duffy, S. Why are RNA virus mutation rates so damn high? PLoS Biol. 2018, 16, e3000003. [Google Scholar] [CrossRef] [Green Version]
  89. Wang, R.; Chen, J.; Gao, K.; Hozumi, Y.; Yin, C.; Wei, G.W. Analysis of SARS-CoV-2 mutations in the United States suggests presence of four substrains and novel variants. Commun. Biol. 2021, 4, 228. [Google Scholar] [CrossRef]
  90. Barton, M.I.; MacGowan, S.A.; Kutuzov, M.A.; Dushek, O.; Barton, G.J.; van der Merwe, P.A. Effects of common mutations in the SARS-CoV-2 Spike RBD and its ligand, the human ACE2 receptor on binding affinity and kinetics. Elife 2021, 10, e70658. [Google Scholar] [CrossRef]
  91. Callaway, E. The coronavirus is mutating—Does it matter? Nature 2020, 585, 174–177. [Google Scholar] [CrossRef]
  92. Sheward, D.J.; Kim, C.; Fischbach, J.; Sato, K.; Muschiol, S.; Ehling, R.A.; Björkström, N.K.; Hedestam, G.; Reddy, S.T.; Albert, J.; et al. Omicron sublineage BA.2.75.2 exhibits extensive escape from neutralising antibodies. Lancet. Infect. Dis. 2022, 22, 1538–1540. [Google Scholar] [CrossRef]
  93. Takashita, E.; Yamayoshi, S.; Fukushi, S.; Suzuki, T.; Maeda, K.; Sakai-Tagawa, Y.; Ito, M.; Uraki, R.; Halfmann, P.; Watanabe, S.; et al. Efficacy of Antiviral Agents against the Omicron Subvariant BA.2.75. N. Engl. J. Med. 2022, 387, 1236–1238. [Google Scholar] [CrossRef] [PubMed]
  94. Khare, S.; Gurry, C.; Freitas, L.; Schultz, M.B.; Bach, G.; Diallo, A.; Akite, N.; Ho, J.; Lee, R.T.; Yeo, W.; et al. GISAID’s Role in Pandemic Response. China CDC Wkly. 2021, 3, 1049–1051. [Google Scholar] [CrossRef] [PubMed]
  95. Elbe, S.; Buckland-Merrett, G. Data, disease and diplomacy: GISAID’s innovative contribution to global health. Glob. Chall. 2017, 1, 33–46. [Google Scholar] [CrossRef]
  96. Shu, Y.; McCauley, J. GISAID: Global initiative on sharing all influenza data—From vision to reality. Euro Surveill. Bull. Eur. Sur Les Mal. Transm. Eur. Commun. Dis. Bull. 2017, 22, 30494. [Google Scholar] [CrossRef] [Green Version]
  97. Callaway, E. Will ‘Centaurus’ be the next global coronavirus variant? Indian cases offers clues. Nature 2022, 608, 462–463. [Google Scholar] [CrossRef]
  98. Vogel, G. New Omicron strains may portend big COVID-19 waves. Science 2022, 377, 1479. [Google Scholar] [CrossRef]
  99. Lucia, U.; Fino, D.; Grisolia, G. A thermoeconomic indicator for the sustainable development with social considerations. Environ. Dev. Sustain. 2022, 24, 2022–2036. [Google Scholar] [CrossRef]
  100. Lucia, U.; Grisolia, G. The Gouy-Stodola Theorem—From Irreversibility to Sustainability—The Thermodynamic Human Development Index. Sustainability 2021, 13, 3995. [Google Scholar] [CrossRef]
  101. Grisolia, G.; Fino, D.; Lucia, U. The education index in the context of sustainability: Thermo-economic considerations. Front. Phys. 2022, 10, 968033. [Google Scholar] [CrossRef]
  102. National Center for Biotechnology Information. NCBI Database [online]. 2022. Available online: https://www.ncbi.nlm.nih.gov/ (accessed on 22 October 2022).
  103. Needleman, S.B.; Wunsch, C.D. A general method applicable to the search for similarities in the amino acid sequence of two proteins. J. Mol. Biol. 1970, 48, 443–453. [Google Scholar] [CrossRef]
  104. Neuman, B.W.; Buchmeier, M.J. Supramolecular architecture of the coronavirus particle. Adv. Virus Res. 2016, 96, 1–27. [Google Scholar] [CrossRef] [PubMed]
  105. Neuman, B.W.; Kiss, G.; Kunding, A.H.; Bhella, D.; Baksh, M.F.; Connelly, S.; Droese, B.; Klaus, J.P.; Makino, S.; Sawicki, S.G.; et al. A structural analysis of M protein in coronavirus assembly and morphology. J. Struct. Biol. 2011, 174, 11–22. [Google Scholar] [CrossRef] [PubMed]
  106. Neuman, B.W.; Adair, B.D.; Yoshioka, C.; Quispe, J.D.; Orca, G.; Kuhn, P.; Milligan, R.A.; Yeager, M.; Buchmeier, M.J. Supramolecular architecture of severe acute respiratory syndrome coronavirus revealed by electron cryomicroscopy. J. Virol. 2006, 80, 7918–7928. [Google Scholar] [CrossRef] [PubMed]
  107. Atkins, P.W.; de Paula, J. Physical Chemistry for the Life Sciences, 2nd ed.; W.H. Freeman and Company: New York, NY, USA, 2011; ISBN 978-1429231145. [Google Scholar]
  108. Atkins, P.W.; de Paula, J. Physical Chemistry: Thermodynamics, Structure, and Change, 10th ed.; W.H. Freeman and Company: New York, NY, USA, 2014; ISBN 978-1429290197. [Google Scholar]
  109. Jover, L.F.; Effler, T.C.; Buchan, A.; Wilhelm, S.W.; Weitz, J.S. The elemental composition of virus particles: Implications for marine biogeochemical cycles. Nat. Rev. Microbiol. 2014, 12, 519–528. [Google Scholar] [CrossRef]
  110. Popovic, M.; Minceva, M. A thermodynamic insight into viral infections: Do viruses in a lytic cycle hijack cell metabolism due to their low Gibbs energy? Heliyon 2020, 6, e03933. [Google Scholar] [CrossRef]
  111. Popovic, M.; Minceva, M. Thermodynamic insight into viral infections 2: Empirical formulas, molecular compositions and thermodynamic properties of SARS, MERS and SARS-CoV-2 (COVID-19) viruses. Heliyon 2020, 6, e04943. [Google Scholar] [CrossRef]
  112. Degueldre, C. Single virus inductively coupled plasma mass spectroscopy analysis: A comprehensive study. Talanta 2021, 228, 122211. [Google Scholar] [CrossRef]
  113. Rusnati, M.; Chiodelli, P.; Bugatti, A.; Urbinati, C. Bridging the past and the future of virology: Surface plasmon resonance as a powerful tool to investigate virus/host interactions. Crit. Rev. Microbiol. 2015, 41, 238–260. [Google Scholar] [CrossRef] [Green Version]
  114. Han, P.; Li, L.; Liu, S.; Wang, Q.; Zhang, D.; Xu, Z.; Han, P.; Li, X.; Peng, Q.; Su, C.; et al. Receptor binding and complex structures of human ACE2 to spike RBD from omicron and delta SARS-CoV-2. Cell 2022, 185, 630–640.e10. [Google Scholar] [CrossRef]
  115. Beatty, J.D.; Beatty, B.G.; Vlahos, W.G. Measurement of monoclonal antibody affinity by non-competitive enzyme immunoassay. J. Immunol. Methods 1987, 100, 173–179. [Google Scholar] [CrossRef]
  116. Wu, L.; Zhou, L.; Mo, M.; Liu, T.; Wu, C.; Gong, C.; Lu, K.; Gong, L.; Zhu, W.; Xu, Z. SARS-CoV-2 Omicron RBD shows weaker binding affinity than the currently dominant Delta variant to human ACE2. Signal Transduct. Target. Ther. 2022, 7, 8. [Google Scholar] [CrossRef] [PubMed]
Figure 1. Standard Gibbs energy of biosynthesis during the evolution of the SARS-CoV-2 variants. The graph shows the standard Gibbs energy of biosynthesis, ΔbsG0, of the SARS-CoV-2 variants versus the time they appeared. The dotted line shows the trend of evolution in the multiplication rate of the SARS-CoV-2 variants.
Microbiolres 13 00066 g001
Table 1. Empirical formulas and molar masses of the SARS-CoV-2 Omicron BA.2.75 nucleocapsids. Empirical formulas have the general form CnCHnHOnONnNPnPSnS. Molar masses are reported in two forms. The first form is the molar mass of the empirical formula of the virus particle, Mr, with the units in g/C-mol (Da). The second is the molar mass of the entire nucleocapsid, Mr(nc), expressed in MDa.
OriginnCnHnOnNnPnSMr (g/C-mol)Mr(nc) (MDa)
Germany11.57360.34260.31240.006010.0033623.75117.2
India11.57350.34270.31240.006030.0033623.75117.2
USA11.57370.34250.31230.005980.0033623.74117.1
Table 2. Stoichiometric coefficients for the biosynthesis reactions of the nucleocapsids of the Omicron BA.2.75 subvariant. (Bio) denotes the empirical formula of the nucleocapsid live matter (from Table 1).
NameReactants Products
Amino AcidO2HPO42−HCO3BioSO42−H2OH2CO3
Germany1.39000.49110.00600.043710.02790.05380.4337
India1.39010.49130.00600.043710.02790.05380.4338
USA1.38990.49100.00600.043810.02790.05370.4337
Table 3. Standard thermodynamic properties of the nucleocapsid live matter of the Omicron BA.2.75 subvariant. The table contains data on the standard enthalpy of formation, ΔfH0, standard molar entropy, S0m, and standard Gibbs energy of formation, ΔfG0.
NameΔfH0 (kJ/C-mol)S0m (J/C-mol K)ΔfG0 (kJ/C-mol)
Germany−75.3732.49−33.26
India−75.4032.49−33.28
USA−75.3532.49−33.23
Table 4. Standard thermodynamic properties of biosynthesis of the Omicron BA.2.75 subvariant. The table gives data on the standard enthalpy of biosynthesis, ΔbsH0, standard entropy of biosynthesis, ΔbsS0, and standard Gibbs energy of biosynthesis, ΔbsG0.
NameΔbsH0 (kJ/C-mol)ΔbsS0 (J/C-mol K)ΔbsG0 (kJ/C-mol)
Germany−232.26−37.33−221.18
India−232.34−37.34−221.24
USA−232.20−37.31−221.12
Table 5. Empirical formulas and molar masses of the SARS-CoV-2 nucleic acid and proteins and entire virions. Nucleic acids and proteins represent the viral RNA together with nucleoprotein, membrane proteins, and spike protein. On the other hand, the entire virion includes nucleic acid, proteins, and envelope lipids. Empirical formulas have the general form CnCHnHOnONnNPnPSnS. Molar masses are reported in two forms. The first form is the molar mass of the empirical formula, Mr, with the units in g/C-mol (Da). The second is the molar mass of the entire nucleic acid and all protein copies, or entire virion, Mr(nc), expressed in MDa.
VariantnCnHnOnNnPnSMr (g/C-mol)Mr(nc) (MDa)
Nucleic acid and proteins
BA.2.75 Germany11.56570.31980.29420.003850.0046023.09177.6
BA.2.75 India11.56560.31990.29420.003870.0046023.10177.6
BA.2.75 USA11.56570.31980.29420.003840.0046023.09177.6
Hu-1 (Wild type)11.5645190.3212880.293840.0038650.00491623.12178.9
Entire virion
BA.2.75 Germany11.65460.27010.22010.007060.0033521.41225.7
BA.2.75 India11.65460.27010.22010.007070.0033521.41225.8
BA.2.75 USA11.65470.27000.22010.007000.0034021.41225.7
Hu-1 (Wild type)11.6389610.2851450.2300620.0064560.00376421.77220.0
Table 6. Stoichiometric coefficients for the biosynthesis reactions of the SARS-CoV-2 nucleic acid and proteins and entire virions. Nucleic acids and proteins represent the viral RNA together with the nucleoprotein, membrane proteins, and spike protein. On the other hand, the entire virion includes the nucleic acid, proteins, and envelope lipids. (Bio) denotes the empirical formula of live matter (from Table 5).
VariantReactantsProducts
Amino AcidCH2OO2HPO42−HCO3BioSO42−H2OH2CO3
Nucleic Acid and Proteins
BA.2.75 Germany1.30920.00000.38220.00390.041910.02480.06570.3511
BA.2.75 India1.30920.00000.38230.00390.041910.02480.06580.3511
BA.2.75 USA1.30910.00000.38210.00380.042010.02480.06570.3511
Hu-1 (Wild type)1.30760.00000.38080.00390.041210.02450.06680.3488
Entire Virion
BA.2.75 Germany0.97950.07630.00000.00710.023210.01870.06560.0790
BA.2.75 India0.97960.07620.00000.00710.023210.01870.06560.0790
BA.2.75 USA0.97940.07650.00000.00700.023210.01860.06550.0791
Hu-1 (Wild type)1.02380.00980.00000.00650.025610.01920.06740.0591
Table 7. Standard thermodynamic properties of the live matter or SARS-CoV-2 nucleic acid and proteins and entire virions. Nucleic acids and proteins represent the viral RNA together with the nucleoprotein, membrane proteins, and spike protein. On the other hand, the entire virion includes the nucleic acid, proteins, and envelope lipids. The table contains data on the standard enthalpy of formation, ΔfH0, standard molar entropy, S0m, and standard Gibbs energy of formation, ΔfG0.
VariantΔfH0 (kJ/C-mol)S0m (J/C-mol K)ΔfG0 (kJ/C-mol)
Nucleic Acid and Proteins
BA.2.75 Germany−69.3031.62−28.31
BA.2.75 India−69.3231.62−28.33
BA.2.75 USA−69.2831.62−28.29
Hu-1 (Wild type)−69.5031.63−28.50
Entire Virion
BA.2.75 Germany−62.0430.45−22.57
BA.2.75 India−62.0530.45−22.58
BA.2.75 USA−62.0030.44−22.53
Hu-1 (Wild type)−64.6630.72−24.84
Table 8. Standard thermodynamic properties of the biosynthesis of SARS-CoV-2 nucleic acid and proteins and entire virions. Nucleic acids and proteins represent the viral RNA together with thee nucleoprotein, membrane proteins, and spike protein. On the other hand, the entire virion includes nucleic acid, proteins, and envelope lipids. The table gives data on the standard enthalpy of biosynthesis, ΔbsH0, standard entropy of biosynthesis, ΔbsS0, and standard Gibbs energy of biosynthesis, ΔbsG0.
VariantΔbsH0 (kJ/C-mol)ΔbsS0 (J/C-mol K)ΔbsG0 (kJ/C-mol)
Nucleic Acid and Proteins
BA.2.75 Germany−181.73−27.43−173.57
BA.2.75 India−181.78−27.44−173.62
BA.2.75 USA−181.68−27.42−173.53
Hu-1 (Wild type)−180.98−27.37−172.84
Entire Virion
BA.2.75 Germany−6.569.67−9.45
BA.2.75 India−6.569.66−9.45
BA.2.75 USA−6.579.67−9.46
Hu-1 (Wild type)−4.776.88−6.89
Publisher’s Note: MDPI stays neutral with regard to jurisdictional claims in published maps and institutional affiliations.

