
Diagnostic Performance of Individual Symptoms to Predict SARS-CoV-2 RT-PCR Positivity and Symptom Persistence among Suspects Presenting in Primary Care during the First Wave of COVID-19
 ,
,  , , , and
Abstract
:1. Introduction
2. Methods
2.1. Study Design
2.2. Setting
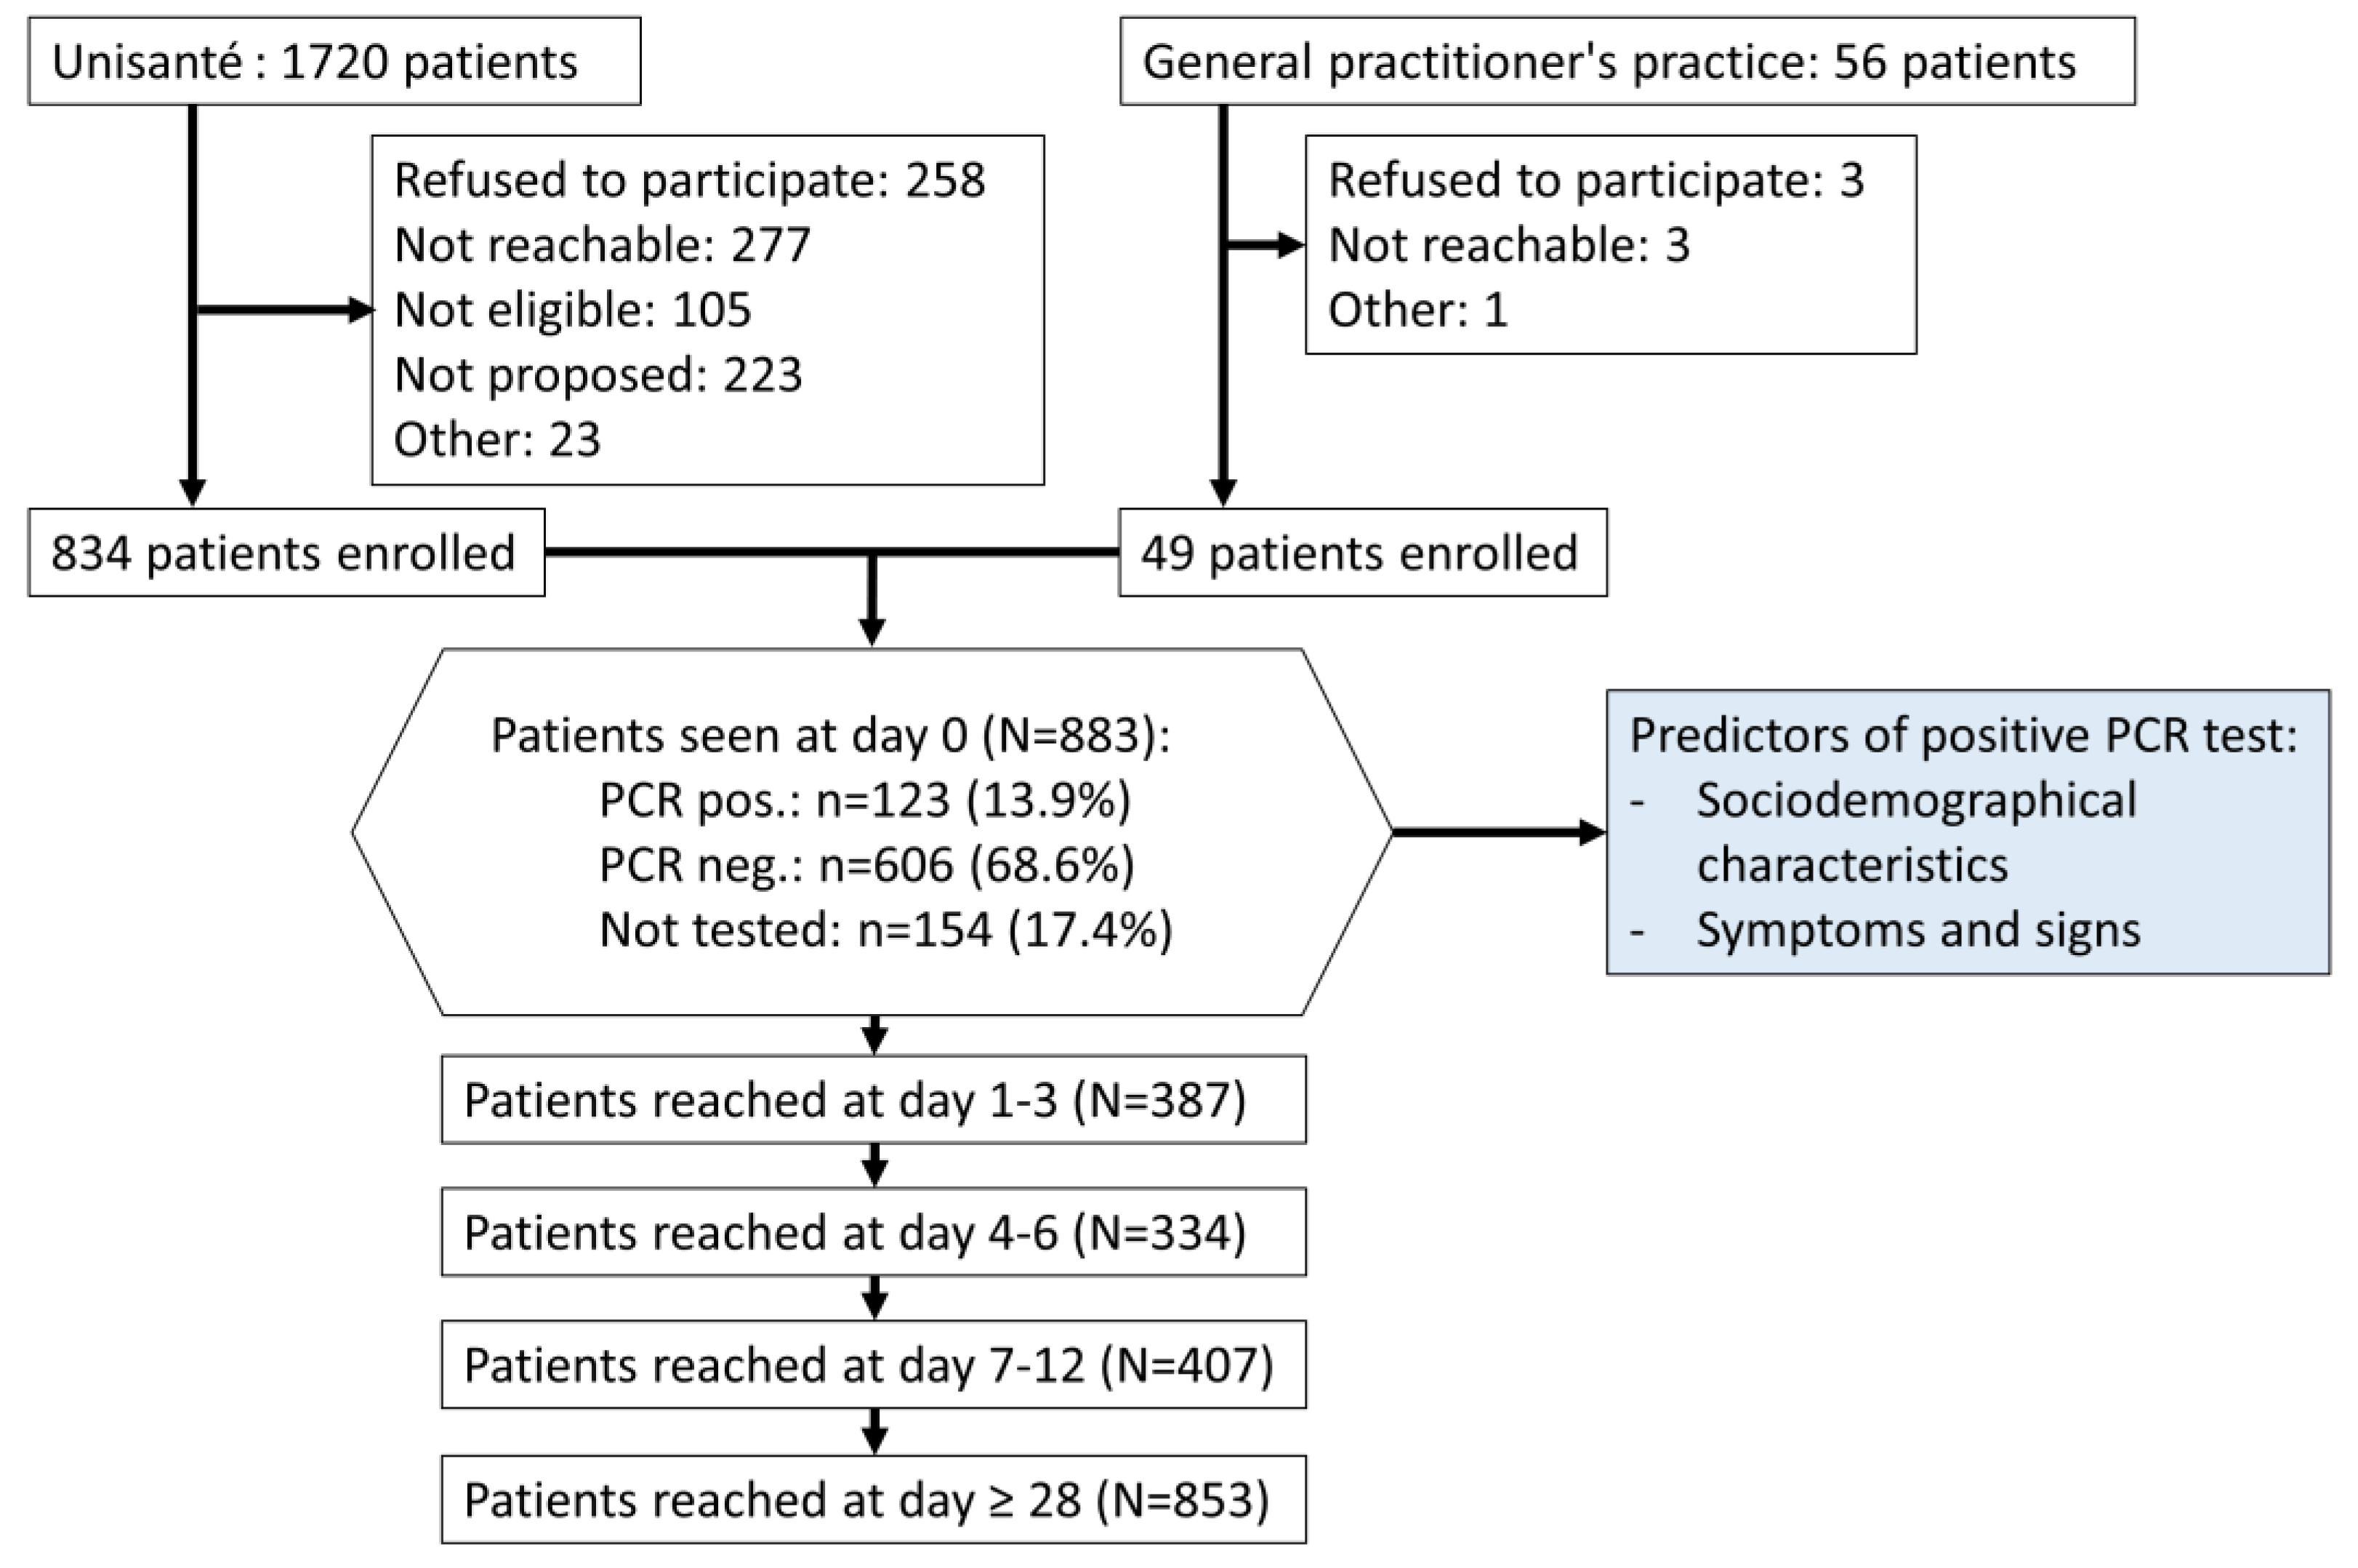
2.3. Participants
2.4. Data Source
2.5. Sample Size
2.6. RT-PCR
2.7. Statistical Analysis
3. Results
3.1. Sociodemographic Characteristics of the Study Participants
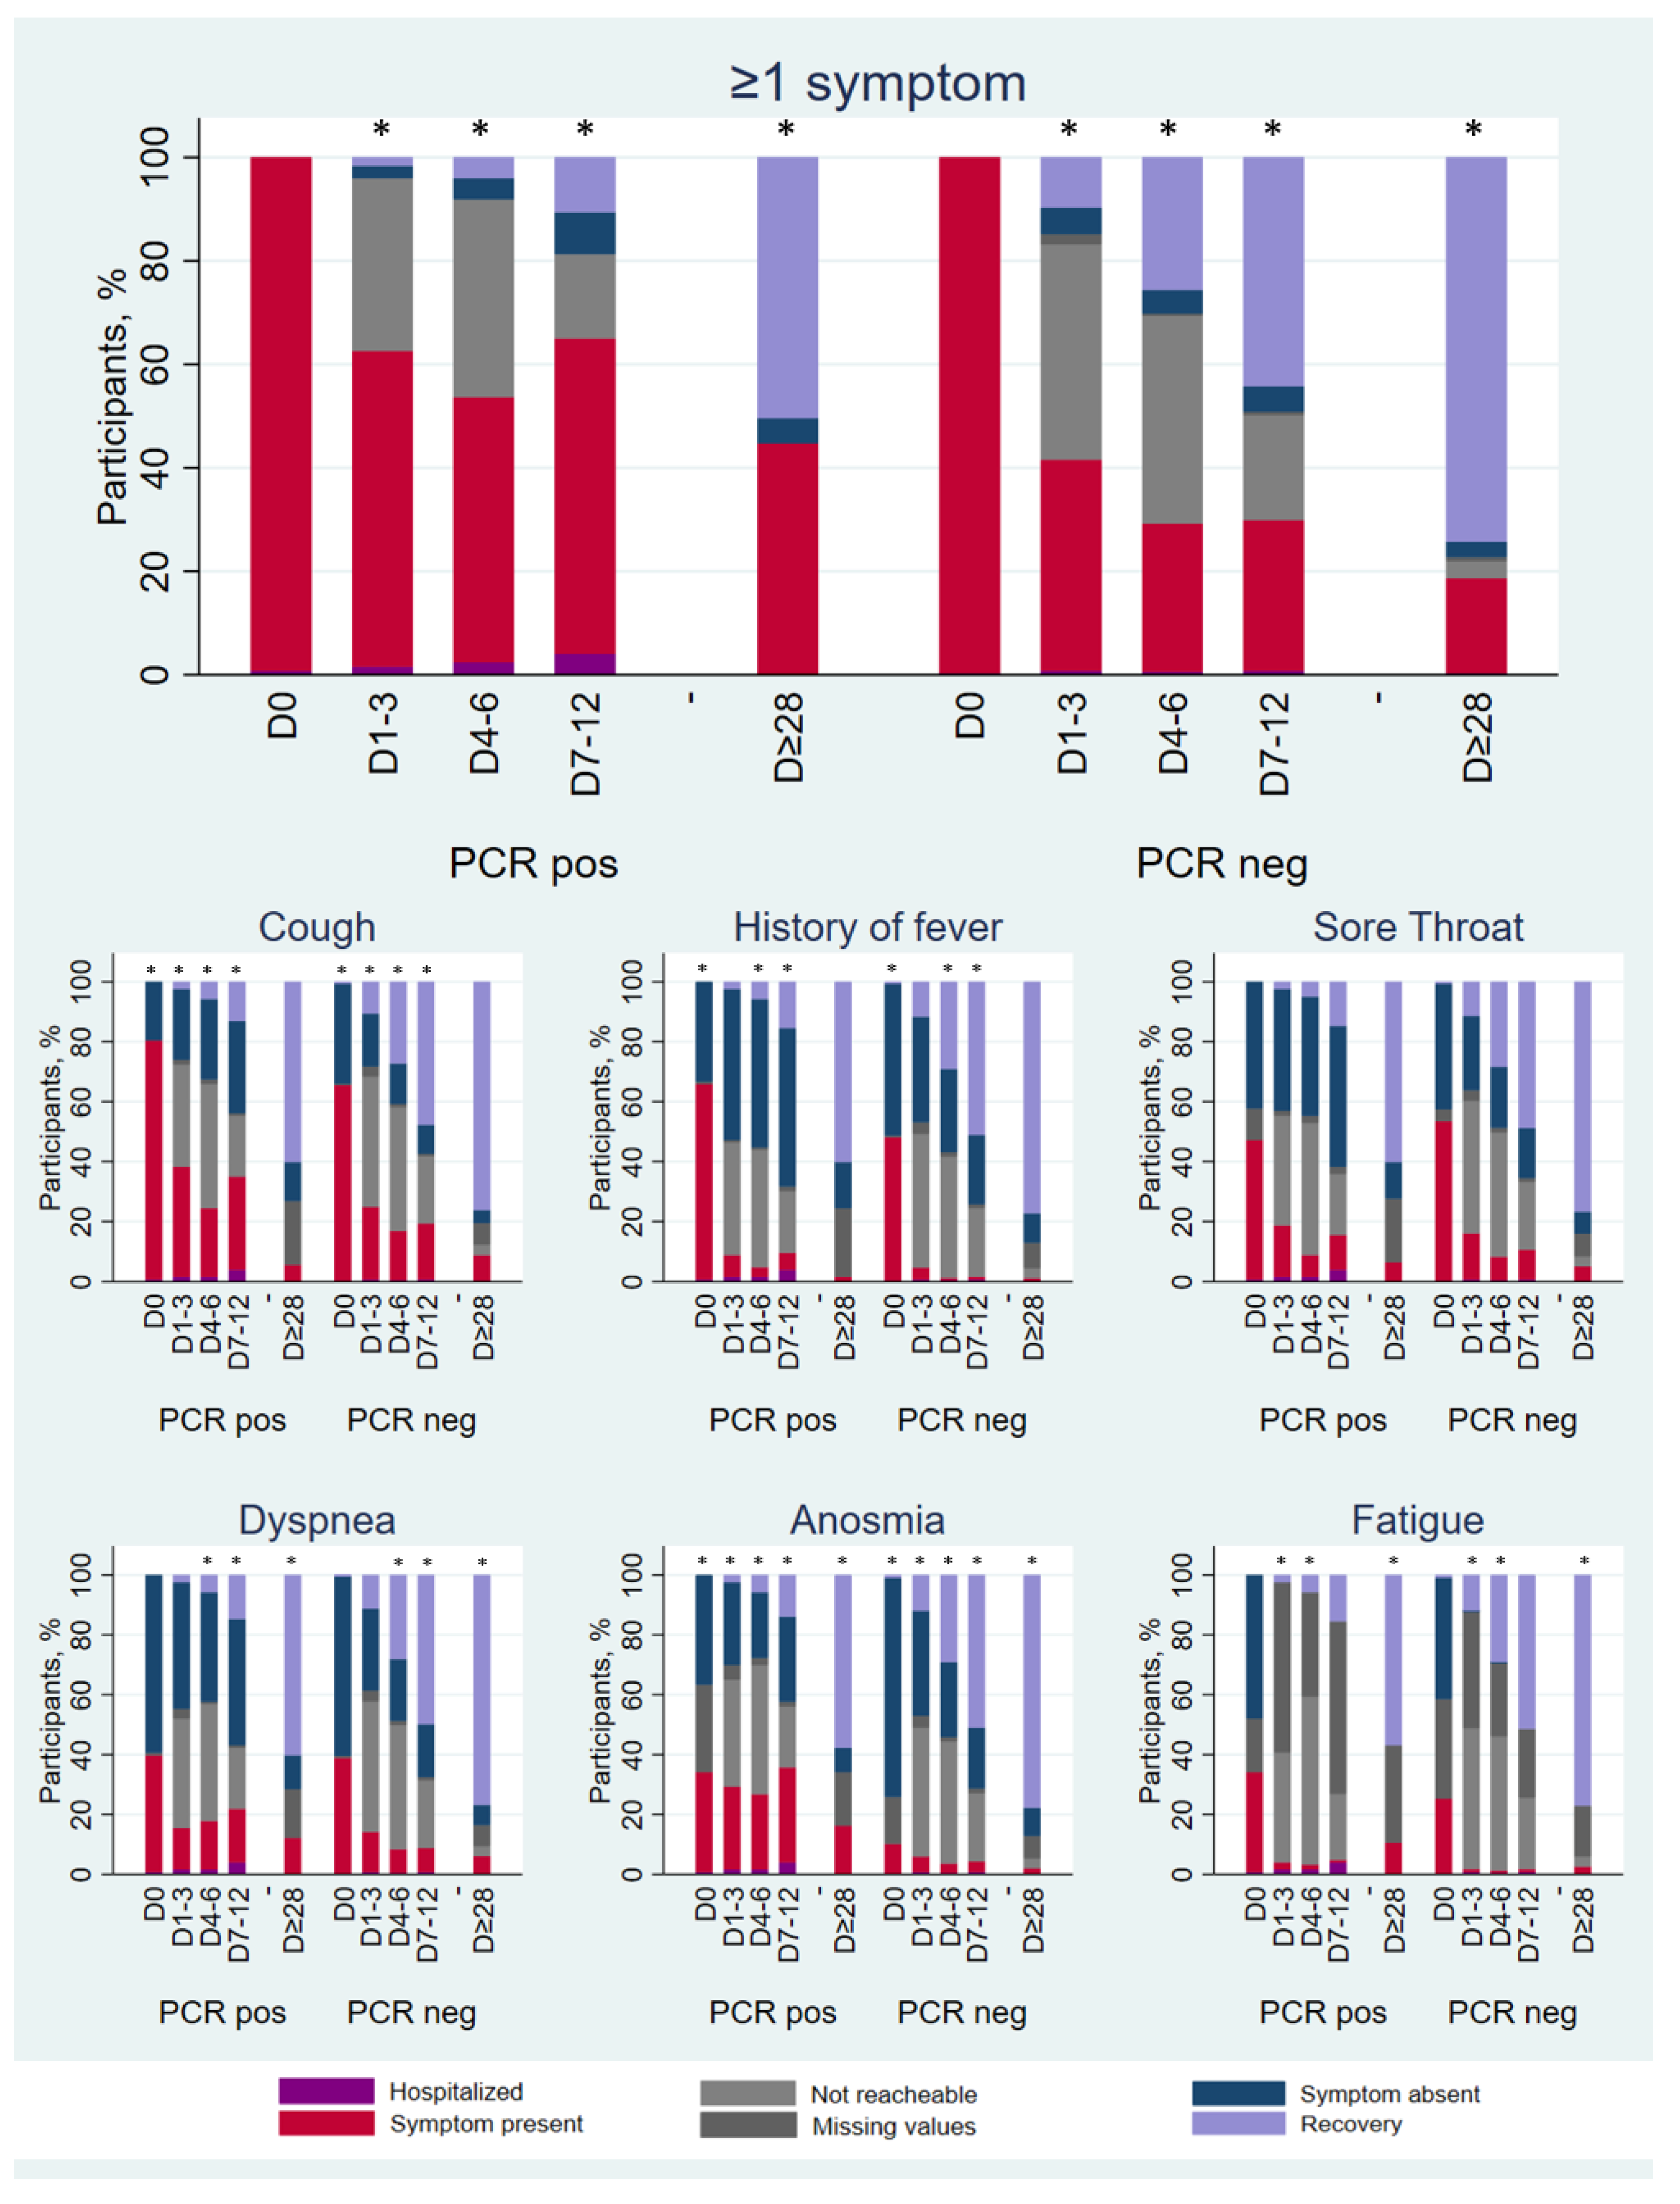
3.2. Symptoms and Signs
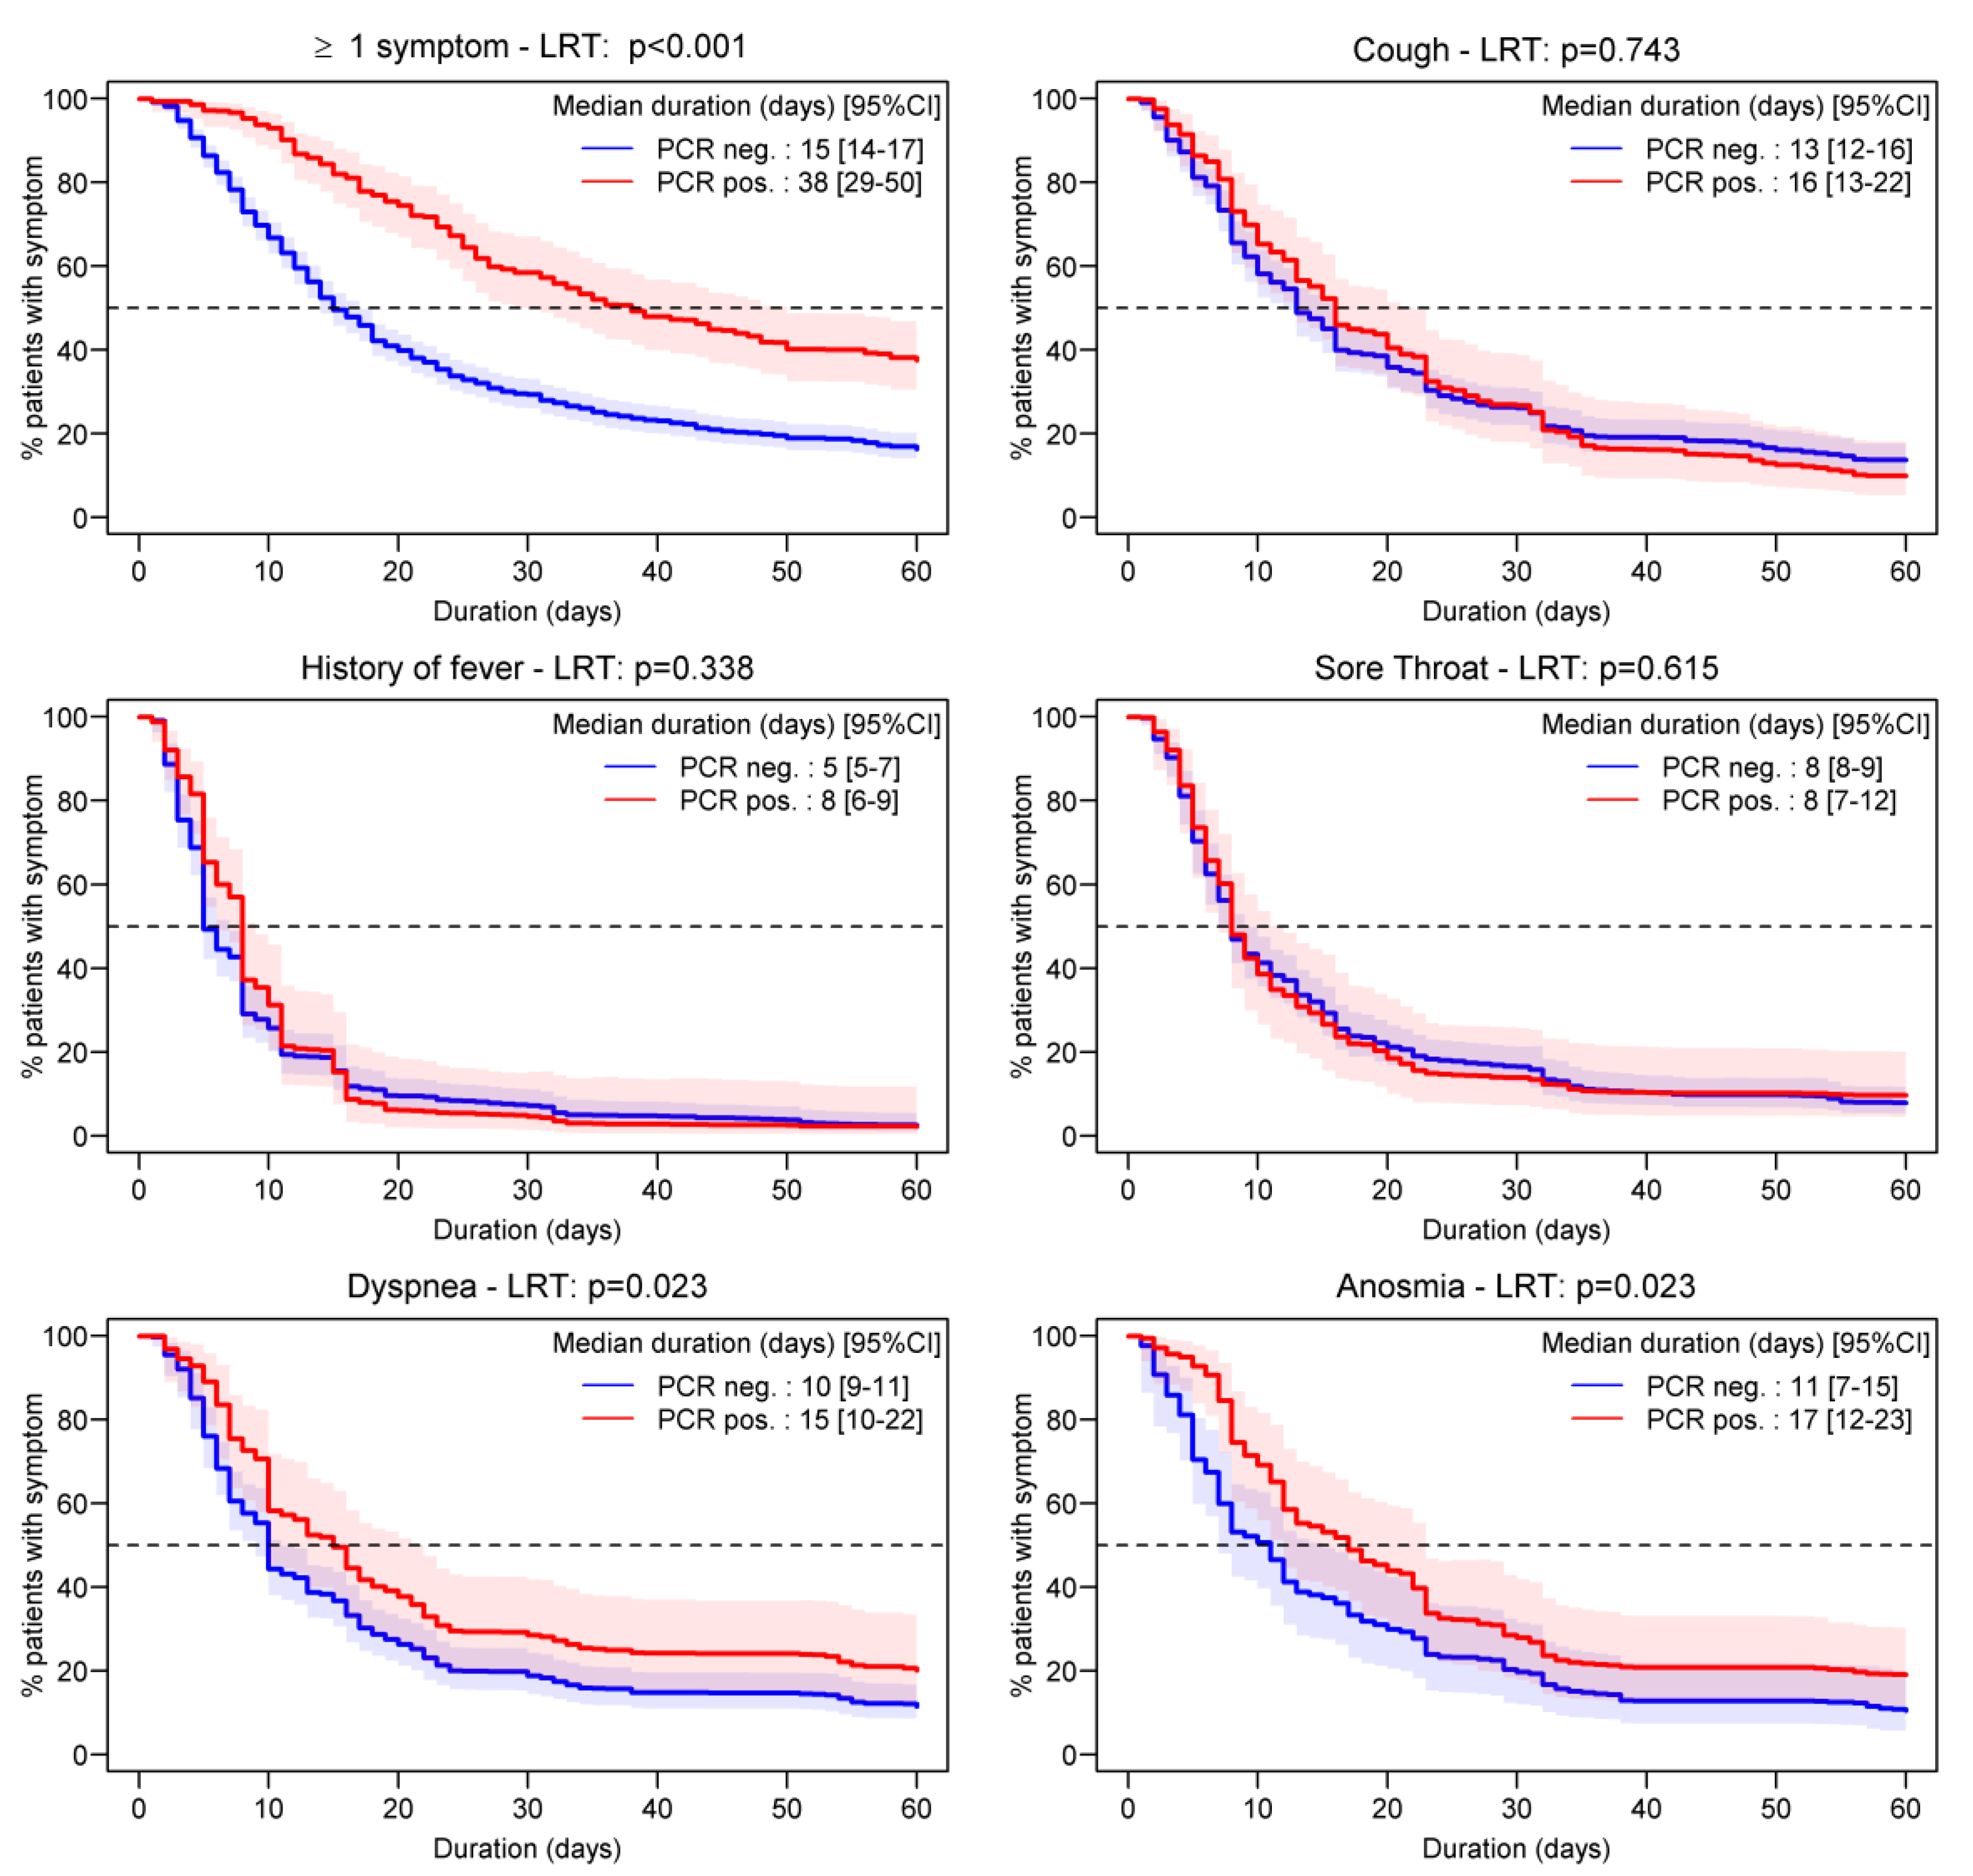
3.3. Symptom Duration
3.4. Factors Associated with Symptom Duration
4. Discussion
4.1. Main Findings
4.2. Comparison with Existing Literature
4.3. Strengths and Limitations
5. Conclusions
Supplementary Materials
Author Contributions
Funding
Institutional Review Board Statement
Informed Consent Statement
Data Availability Statement
Acknowledgments
Conflicts of Interest
References
- OFSP. COVID-19 Switzerland. Available online: https://www.covid19.admin.ch/ (accessed on 17 January 2023).
- Guan, W.J.; Ni, Z.Y.; Hu, Y.; Liang, W.H.; Ou, C.Q.; He, J.X.; Liu, L.; Shan, H.; Lei, C.L.; Hui, D.S.C.; et al. Clinical Characteristics of Coronavirus Disease 2019 in China. N. Engl. J. Med. 2020, 382, 1708–1720. [Google Scholar] [CrossRef] [PubMed]
- Lu, S.; Huang, X.; Liu, R.; Lan, Y.; Lei, Y.; Zeng, F.; Tang, X.; He, H. Comparison of COVID-19 Induced Respiratory Failure and Typical ARDS: Similarities and Differences. Front. Med. 2022, 9, 829771. [Google Scholar] [CrossRef] [PubMed]
- Nouchi, A.; Chastang, J.; Miyara, M.; Lejeune, J.; Soares, A.; Ibanez, G.; Saadoun, D.; Morélot-Panzini, C.; Similowski, T.; Amoura, Z.; et al. Prevalence of hyposmia and hypogeusia in 390 COVID-19 hospitalized patients and outpatients: A cross-sectional study. Eur. J. Clin. Microbiol. Infect. Dis. 2020, 40, 691–697. [Google Scholar] [CrossRef] [PubMed]
- Tudrej, B.; Sebo, P.; Lourdaux, J.; Cuzin, C.; Floquet, M.; Haller, D.M.; Maisonneuve, H. Self-Reported Loss of Smell and Taste in SARS-CoV-2 Patients: Primary Care Data to Guide Future Early Detection Strategies. J. Gen. Intern. Med. 2020, 35, 2502–2504. [Google Scholar] [CrossRef] [PubMed]
- Nextstrain. Genomic Epidemiology of SARS-CoV-2 with Subsampling Focused on Europe over the Past 6 Months. Available online: https://nextstrain.org/ncov/gisaid/global/6m (accessed on 17 January 2023).
- Wynants, L.; Van Calster, B.; Bonten, M.M.J.; Collins, G.S.; Debray, T.P.A.; De Vos, M.; Haller, M.C.; Heinze, G.; Moons, K.G.M.; Riley, R.D.; et al. Prediction models for diagnosis and prognosis of COVID-19 infection: Systematic review and critical appraisal. Bmj 2020, 369, m1328. [Google Scholar] [CrossRef]
- Menni, C.; Valdes Ana, M.; Freidin Maxim, B.; Sudre Carole, H.; Nguyen Long, H.; Drew David, A.; Ganesh, S.; Varsavsky, T.; Cardoso, M.J.; El-Sayed Moustafa, J.S.; et al. Real-time tracking of self-reported symptoms to predict potential COVID-19. Nature Medicine 2020, 26, 1037–1040. [Google Scholar] [CrossRef]
- Van Loon, N.; Verbrugghe, M.; Cartuyvels, R.; Ramaekers, D. Diagnosis of COVID-19 Based on Symptomatic Analysis of Hospital Healthcare Workers in Belgium. J. Occup. Environ. Med. 2020, 63, 27–31. [Google Scholar] [CrossRef]
- Struyf, T.; Deeks, J.J.; Dinnes, J.; Takwoingi, Y.; Davenport, C.; Leeflang, M.M.; Spijker, R.; Hooft, L.; Emperador, D.; Dittrich, S.; et al. Signs and symptoms to determine if a patient presenting in primary care or hospital outpatient settings has COVID-19 disease. Cochrane Database Syst. Rev. 2020, 7, Cd013665. [Google Scholar] [CrossRef]
- Struyf, T.; Deeks, J.J.; Dinnes, J.; Takwoingi, Y.; Davenport, C.; Leeflang, M.M.; Spijker, R.; Hooft, L.; Emperador, D.; Domen, J.; et al. Signs and symptoms to determine if a patient presenting in primary care or hospital outpatient settings has COVID-19. Cochrane Database Syst. Rev. 2021, 2, Cd013665. [Google Scholar] [CrossRef]
- Struyf, T.; Deeks, J.J.; Dinnes, J.; Takwoingi, Y.; Davenport, C.; Leeflang, M.M.; Spijker, R.; Hooft, L.; Emperador, D.; Domen, J.; et al. Signs and symptoms to determine if a patient presenting in primary care or hospital outpatient settings has COVID-19. Cochrane Database Syst. Rev. 2022, 5, CD013665. [Google Scholar] [CrossRef]
- Lechien, J.R.; Chiesa-Estomba, C.M.; Place, S.; Van Laethem, Y.; Cabaraux, P.; Mat, Q.; Huet, K.; Plzak, J.; Horoi, M.; Hans, S.; et al. Clinical and epidemiological characteristics of 1420 European patients with mild-to-moderate coronavirus disease 2019. J. Intern. Med. 2020, 288, 335–344. [Google Scholar] [CrossRef]
- Carvalho-Schneider, C.; Laurent, E.; Lemaignen, A.; Beaufils, E.; Bourbao-Tournois, C.; Laribi, S.; Flament, T.; Ferreira-Maldent, N.; Bruyere, F.; Stefic, K.; et al. Follow-up of adults with noncritical COVID-19 two months after symptom onset. Clin. Microbiol. Infect. 2021, 27, 258–263. [Google Scholar] [CrossRef]
- Tenforde, M.W.; Kim, S.S.; Lindsell, C.J.; Billig Rose, E.; Shapiro, N.I.; Files, D.C.; Gibbs, K.W.; Erickson, H.L.; Steingrub, J.S.; Smithline, H.A.; et al. Symptom Duration and Risk Factors for Delayed Return to Usual Health Among Outpatients with COVID-19 in a Multistate Health Care Systems Network-United States, March–June 2020. MMWR Morb. Mortal Wkly. Rep. 2020, 69, 993–998. [Google Scholar] [CrossRef]
- Yan, C.H.; Faraji, F.; Prajapati, D.P.; Boone, C.E.; DeConde, A.S. Association of chemosensory dysfunction and COVID-19 in patients presenting with influenza-like symptoms. Int. Forum. Allergy Rhinol. 2020, 10, 806–813. [Google Scholar] [CrossRef] [PubMed]
- Nehme, M.; Braillard, O.; Alcoba, G.; Aebischer Perone, S.; Courvoisier, D.; Chappuis, F.; Guessous, I.; Covicare, T. COVID-19 Symptoms: Longitudinal Evolution and Persistence in Outpatient Settings. Ann. Intern. Med. 2021, 174, 723–725. [Google Scholar] [CrossRef] [PubMed]
- Soriano, J.B.; Murthy, S.; Marshall, J.C.; Relan, P.; Diaz, J.V.; Condition, W.H.O.C.C.D.W.G.o.P.-C.-. A clinical case definition of post-COVID-19 condition by a Delphi consensus. Lancet Infect. Dis. 2022, 22, e102–e107. [Google Scholar] [CrossRef]
- OFSP. Critères de suspicion, de prélèvement d’échantillons et de déclaration. Available online: https://www.Criteres_de_suspicion_de_prelevement_d-echantillons_et_de_declaration.pdf/ (accessed on 17 January 2023).
- Harris, P.A.; Taylor, R.; Minor, B.L.; Elliott, V.; Fernandez, M.; O'Neal, L.; McLeod, L.; Delacqua, G.; Delacqua, F.; Kirby, J.; et al. The REDCap consortium: Building an international community of software platform partners. J. Biomed. Inform. 2019, 95, 103208. [Google Scholar] [CrossRef] [PubMed]
- Harris, P.A.; Taylor, R.; Thielke, R.; Payne, J.; Gonzalez, N.; Conde, J.G. Research electronic data capture (REDCap)—A metadata-driven methodology and workflow process for providing translational research informatics support. J. Biomed. Inform. 2009, 42, 377–381. [Google Scholar] [CrossRef] [PubMed]
- Petrovic, D.; Pivin, E.; Ponte, B.; Dhayat, N.; Pruijm, M.; Ehret, G.; Ackermann, D.; Guessous, I.; Younes, S.E.; Pechère-Bertschi, A.; et al. Sociodemographic, behavioral and genetic determinants of allostatic load in a Swiss population-based study. Psychoneuroendocrinology 2016, 67, 76–85. [Google Scholar] [CrossRef]
- Rubin, D. Multiple Imputation for Nonresponse in Surveys; Wiley: New York, NY, USA, 1987. [Google Scholar]
- Moscovici, J.; Ratitch, B. Combining Survival Analysis Results after Multiple Imputation of Censored Event Times. In Proceedings of the PharmaSUG, Baltimore, MD, USA, 14–17 May 2017. [Google Scholar]
- White, I.R.; Royston, P. Imputing missing covariate values for the Cox model. Stat. Med. 2009, 28, 1982–1998. [Google Scholar] [CrossRef] [Green Version]
- Morisot, A.; Bessaoud, F.; Landais, P.; Rebillard, X.; Tretarre, B.; Daures, J.P. Prostate cancer: Net survival and cause-specific survival rates after multiple imputation. BMC Med. Res. Methodol. 2015, 15, 54. [Google Scholar] [CrossRef] [PubMed]
- Marshall, A.; Altman, D.G.; Holder, R.L.; Royston, P. Combining estimates of interest in prognostic modelling studies after multiple imputation: Current practice and guidelines. BMC Med. Res. Methodol. 2009, 9, 57. [Google Scholar] [CrossRef] [PubMed]
- Enders, C.K. Applied Missing Data Analysis; The Guilford Press: New York, NY, USA, 2010. [Google Scholar]
- Peng, L.; Liu, K.Y.; Xue, F.; Miao, Y.F.; Tu, P.A.; Zhou, C. Improved Early Recognition of Coronavirus Disease-2019 (COVID-19): Single-Center Data from a Shanghai Screening Hospital. Arch. Iran. Med. 2020, 23, 272–276. [Google Scholar] [CrossRef]
- Sun, Y.; Koh, V.; Marimuthu, K.; Ng, O.T.; Young, B.; Vasoo, S.; Chan, M.; Lee, V.J.M.; De, P.P.; Barkham, T.; et al. Epidemiological and Clinical Predictors of COVID-19. Clin. Infect. Dis. 2020, 71, 786–792. [Google Scholar] [CrossRef]
- Healey, Q.; Sheikh, A.; Daines, L.; Vasileiou, E. Symptoms and signs of long COVID: A rapid review and meta-analysis. J. Glob. Health 2022, 12, 05014. [Google Scholar] [CrossRef]
- Raveendran, A.V.; Jayadevan, R.; Sashidharan, S. Long COVID: An overview. Diabetes Metab. Syndr. 2021, 15, 869–875. [Google Scholar] [CrossRef] [PubMed]
- Jarrom, D.; Elston, L.; Washington, J.; Prettyjohns, M.; Cann, K.; Myles, S.; Groves, P. Effectiveness of tests to detect the presence of SARS-CoV-2 virus, and antibodies to SARS-CoV-2, to inform COVID-19 diagnosis: A rapid systematic review. BMJ Evid.-Based Med. 2020, 27, 33–45. [Google Scholar] [CrossRef]


| Total (N = 883) | RT-PCR Positive (N = 123) | RT-PCR Negative (N = 606) | Not Tested (N = 154) | |
|---|---|---|---|---|
| Median age in years (IQR) | 38 (29–50) | 43 (31–56) | 38 (29–50) | 37 (29–45) |
| Female, n (%) | 522 (59.1) | 80 (65.0) | 367 (60.6) | 75 (48.7) |
| Study sites, n (%) | ||||
| Walk-in clinic «A» | 664 (75.2) | 96 (78.1) | 416 (68.7) | 152 (98.7) |
| Walk-in clinic «B» | 170 (19.3) | 18 (14.6) | 150 (24.8) | 2 (1.3) |
| Private practice | 49 (5.6) | 9 (7.3) | 40 (6.6) | 0 (0.0) |
| Professionally active in health care, n (%) | 278 (41.4) | 56 (45.5) | 198 (32.7) | 24 (15.6) |
| Education level, n (%; 34 missing) | ||||
| Low | 368 (43.4) | 67 (54.9) | 232 (40.5) | 69 (44.8) |
| Medium | 242 (28.5) | 35 (28.7) | 170 (29.7) | 37 (24.0) |
| High | 239 (28.2) | 20 (16.4) | 171 (29.8) | 48 (31.2) |
| Occupation level, n (%; 63 missing) | ||||
| Low | 136 (16.6) | 34 (28.6) | 80 (14.5) | 22 (14.8) |
| Medium | 617 (75.2) | 75 (63.9) | 421 (76.3) | 121 (81.2) |
| High | 67 (8.2) | 10 (8.4) | 51 (9.2) | 6 (4.0) |
| ≥1 risk factor *, n (%) | 190 (21.5) | 28 (22.8) | 135 (22.3) | 27 (17.5) |
| Current tobacco use, n (%) | 208 (25.1) | 17 (14.1) | 159 (26.7) | 41 (28.1) |
| NSAID use 7 days prior the first visit, n (%) | 119 (13.5) | 15 (12.2) | 78 (12.9) | 26 (16.9) |
| Hospitalized after the initial consultation, n (%) | 33 (3.7) | 11 (8.9) | 17 (2.8) | 5 (3.3) |
| Symptoms and Signs | Sensitivity | Specificity | PPV 2 | NPV 3 | c-Index | |||||
|---|---|---|---|---|---|---|---|---|---|---|
| % | 95%CI | % | 95%CI | % | 95%CI | % | 95%CI | % | 95%CI | |
| Cough | 80.5 | (72.4–87.1) | 34.1 | (30.3–38.0) | 19.9 | (16.5–23.7) | 89.6 | (84.9–93.2) | 0.57 | (0.53–0.61) |
| History of fever | 65.6 | (56.4–73.9) | 52.6 | (47.5–55.6) | 21.5 | (17.4–26.0) | 88.1 | (84.3–91.3) | 0.59 | (0.54–0.63) |
| Sore throat | 51.8 | (42.1–61.4) | 44.7 | (40.6–48.8) | 15 | (11.6–19.0) | 83.1 | (78.4–87.1) | 0.48 | (0.43–0.53) |
| Myalgia | 68.8 | (59.3–77.2) | 49.5 | (45.2–53.7) | 21.4 | (17.3–26.1) | 88.7 | (84.7–92.0) | 0.59 | (0.54–0.64) |
| Dyspnea | 40.2 | (31.4–49.4) | 60.8 | (56.8–64.7) | 17.2 | (13.0–22.1) | 83.4 | (79.6–86.7) | 0.51 | (0.46–0.55) |
| Headache | 49.5 | (39.6–59.5) | 57.1 | (52.3–61.8) | 21.9 | (16.8–27.8) | 82.3 | (77.5–86.4) | 0.53 | (0.48–0.59) |
| Fatigue | 40.6 | (30.9–50.8) | 62 | (57.1–66.8) | 21.1 | (15.6–27.6) | 80.6 | (75.8–84.9) | 0.51 | (0.46–0.57) |
| History of temperature ≥38 °C | 33.9 | (25.5–43.0) | 81.5 | (78.1–84.5) | 26.8 | (20.0–34.5) | 86 | (82.9–88.8) | 0.58 | (0.53–0.62) |
| Rhinorrhea | 32 | (23.2–42.0) | 69.1 | (64.5–73.4) | 19.8 | (14.0–26.6) | 81.1 | (76.7–84.9) | 0.51 | (0.46–0.56) |
| Chest pain | 20 | (12.7–29.2) | 70.7 | (66.0–75.1) | 14.4 | (9.0–21.3) | 78.2 | (73.6–82.3) | 0.45 | (0.41–0.50) |
| Hypo-/ageusia | 51.2 | (40.1–62.1) | 86.1 | (82.8–89.0) | 38.3 | (29.4–47.8) | 91.3 | (88.4–93.6) | 0.69 | (0.63–0.74) |
| Hypo-/anosmia | 47.1 | (36.3–58.1) | 88.3 | (85.1–90.9) | 40.6 | (30.9–50.8) | 90.7 | (87.8–93.1) | 0.68 | (0.62–0.73) |
| Digestive symptoms 1 | 21.9 | (14.4–31.0) | 77.6 | (73.4–81.5) | 19.5 | (12.8–27.8) | 80.1 | (75.9–83.8) | 0.5 | (0.45–0.54) |
| Chills | 10.5 | (5.2–18.5) | 86.6 | (82.9–89.8) | 15.9 | (7.9–27.3) | 80.1 | (76.0–83.8) | 0.49 | (0.45–0.52) |
| Abdominal pain | 8.2 | (3.6–15.5) | 86.5 | (82.7–89.7) | 13.3 | (5.9–24.6) | 78.7 | (74.5–82.5) | 0.47 | (0.44–0.51) |
| Dyspnea >4 days | 19.6 | (10.2–32.4) | 83.4 | (80.3–86.1) | 9 | (4.6–15.6) | 92.5 | (90.1–94.5) | 0.52 | (0.46–0.57) |
| Fever >4 days | 8.3 | (4.0–14.7) | 97.2 | (95.5–98.3) | 37 | (19.4–57.6) | 84.1 | (81.1–86.7) | 0.53 | (0.50–0.55) |
| Sweating | 9.5 | (4.4–17.2) | 94.6 | (91.7–96.6) | 31 | (15.3 -50.8) | 80.2 | (76.1–83.8) | 0.52 | (0.49–0.55) |
| Variable | ≥1 Symptom | Cough | History of Fever | Sore Throat | Dyspnea | Anosmia |
|---|---|---|---|---|---|---|
| Walk-in clinic «B» (vs. clinic «A») | 1.05 (p = 0.627) | 1.03 (p = 0.818) | 1.09 (p = 0.504) | 1.14 (p = 0.315) | 0.71 (p = 0.013) | 0.68 (p = 0.111) |
| Private practice (vs. clinic «A») | 0.69 (p = 0.031) | 0.83 (p = 0.314) | 0.84 (p = 0.471) | 0.79 (p = 0.301) | 0.67 (p = 0.182) | 0.65 (p = 0.341) |
| Positive RT-PCR test | 0.48 (p < 0.001) | 0.94 (p = 0.581) | 0.90 (p = 0.447) | 0.97 (p = 0.833) | 0.69 (p = 0.020) | 0.62 (p = 0.015) |
| ≥1 risk factor * | 1.03 (p = 0.810) | 0.90 (p = 0.333) | 0.96 (p = 0.782) | 1.12 (p = 0.359) | 0.86 (p = 0.260) | 0.83 (p = 0.378) |
| Age ≤ 40 years | 1.38 (p < 0.001) | 1.21 (p = 0.059) | 1.10 (p = 0.403) | 1.21 (p = 0.085) | 1.10 (p = 0.438) | 1.39 (p = 0.064) |
| Age > 65 years | 1.27 (p = 0.161) | 0.96 (p = 0.830) | 1.10 (p = 0.694) | 1.03 (p = 0.886) | 0.69 (p = 0.144) | 1.83 (p = 0.162) |
| BMI ≤ 20 kg/m2 | 0.96 (p = 0.752) | 0.94 (p = 0.678) | 0.89 (p = 0.483) | 0.95 (p = 0.772) | 1.19 (p = 0.351) | 0.84 (p = 0.545) |
| BMI > 25 kg/m2 | 0.91 (p = 0.312) | 1.06 (p = 0.581) | 0.94 (p = 0.606) | 0.88 (p = 0.268) | 1.07 (p = 0.584) | 1.27 (p = 0.201) |
| Female | 0.82 (p = 0.020) | 0.87 (p = 0.149) | 0.92 (p = 0.477) | 0.92 (p = 0.462) | 0.81 (p = 0.111) | 0.89 (p = 0.533) |
| Professionally active in health care | 1.20 (p = 0.050) | 1.28 (p = 0.018) | 1.21 (p = 0.121) | 1.25 (p = 0.052) | 1.09 (p = 0.550) | 0.83 (p = 0.335) |
| Current tobacco use | 0.96 (p = 0.658) | 0.85 (p = 0.147) | 1.06 (p = 0.642) | 0.82 (p = 0.130) | 0.90 (p = 0.487) | 0.96 (p = 0.844) |
| NSAID use 7 days prior the first visit | 0.80 (p = 0.054) | 0.90 (p = 0.423) | 0.86 (p = 0.333) | 0.69 (p = 0.009) | 1.16 (p = 0.337) | 0.83 (p = 0.495) |
Disclaimer/Publisher’s Note: The statements, opinions and data contained in all publications are solely those of the individual author(s) and contributor(s) and not of MDPI and/or the editor(s). MDPI and/or the editor(s) disclaim responsibility for any injury to people or property resulting from any ideas, methods, instructions or products referred to in the content. |
© 2023 by the authors. Licensee MDPI, Basel, Switzerland. This article is an open access article distributed under the terms and conditions of the Creative Commons Attribution (CC BY) license (https://creativecommons.org/licenses/by/4.0/).
Share and Cite
Savoy, M.; Kopp, B.; Chaouch, A.; Cohidon, C.; Gouveia, A.; Lombardo, P.; Maeder, M.; Payot, S.; Perdrix, J.; Schwarz, J.; et al. Diagnostic Performance of Individual Symptoms to Predict SARS-CoV-2 RT-PCR Positivity and Symptom Persistence among Suspects Presenting in Primary Care during the First Wave of COVID-19. Infect. Dis. Rep. 2023, 15, 112-124. https://doi.org/10.3390/idr15010012
Savoy M, Kopp B, Chaouch A, Cohidon C, Gouveia A, Lombardo P, Maeder M, Payot S, Perdrix J, Schwarz J, et al. Diagnostic Performance of Individual Symptoms to Predict SARS-CoV-2 RT-PCR Positivity and Symptom Persistence among Suspects Presenting in Primary Care during the First Wave of COVID-19. Infectious Disease Reports. 2023; 15(1):112-124. https://doi.org/10.3390/idr15010012
Chicago/Turabian StyleSavoy, Mona, Benoît Kopp, Aziz Chaouch, Christine Cohidon, Alexandre Gouveia, Patrick Lombardo, Muriel Maeder, Sylvie Payot, Jean Perdrix, Joëlle Schwarz, and et al. 2023. "Diagnostic Performance of Individual Symptoms to Predict SARS-CoV-2 RT-PCR Positivity and Symptom Persistence among Suspects Presenting in Primary Care during the First Wave of COVID-19" Infectious Disease Reports 15, no. 1: 112-124. https://doi.org/10.3390/idr15010012