
Sociodemographically Stratified Exploration of Pancreatic Cancer Incidence in Younger US Patients: Implication of Cannabis Exposure as a Risk Factor

Abstract
:1. Introduction
2. Methods
2.1. Pancreatic Cancer Rates
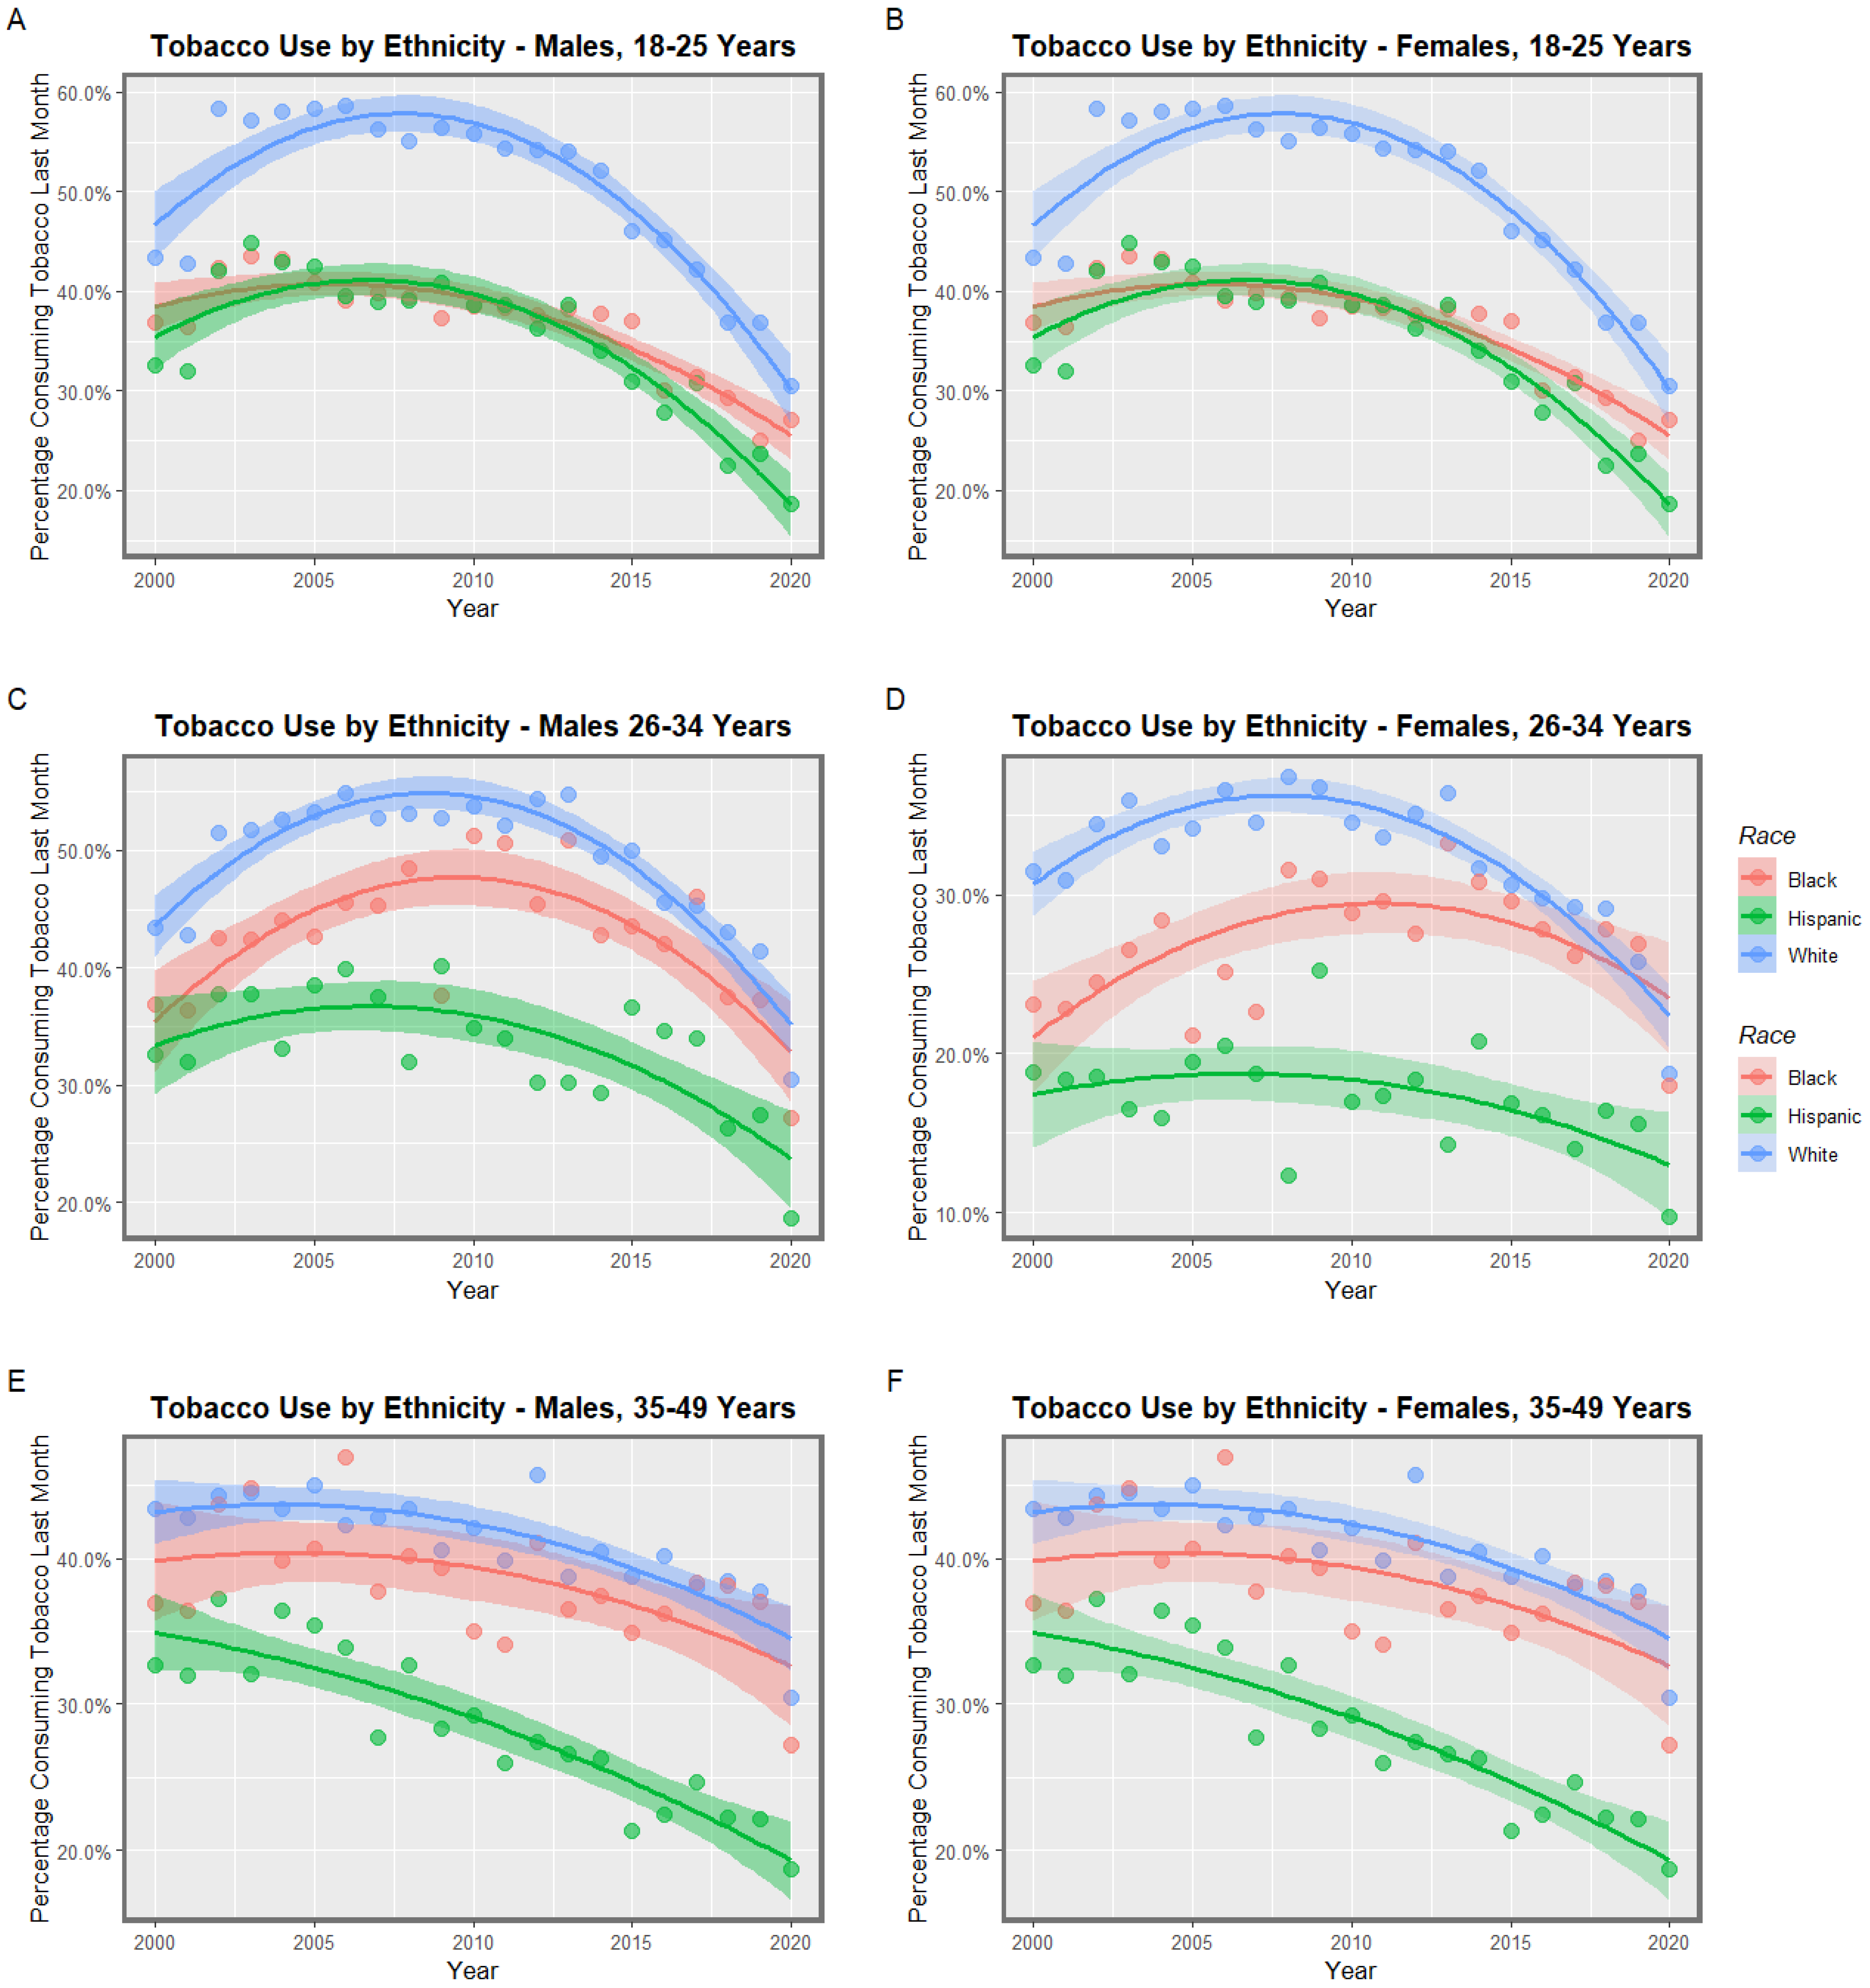
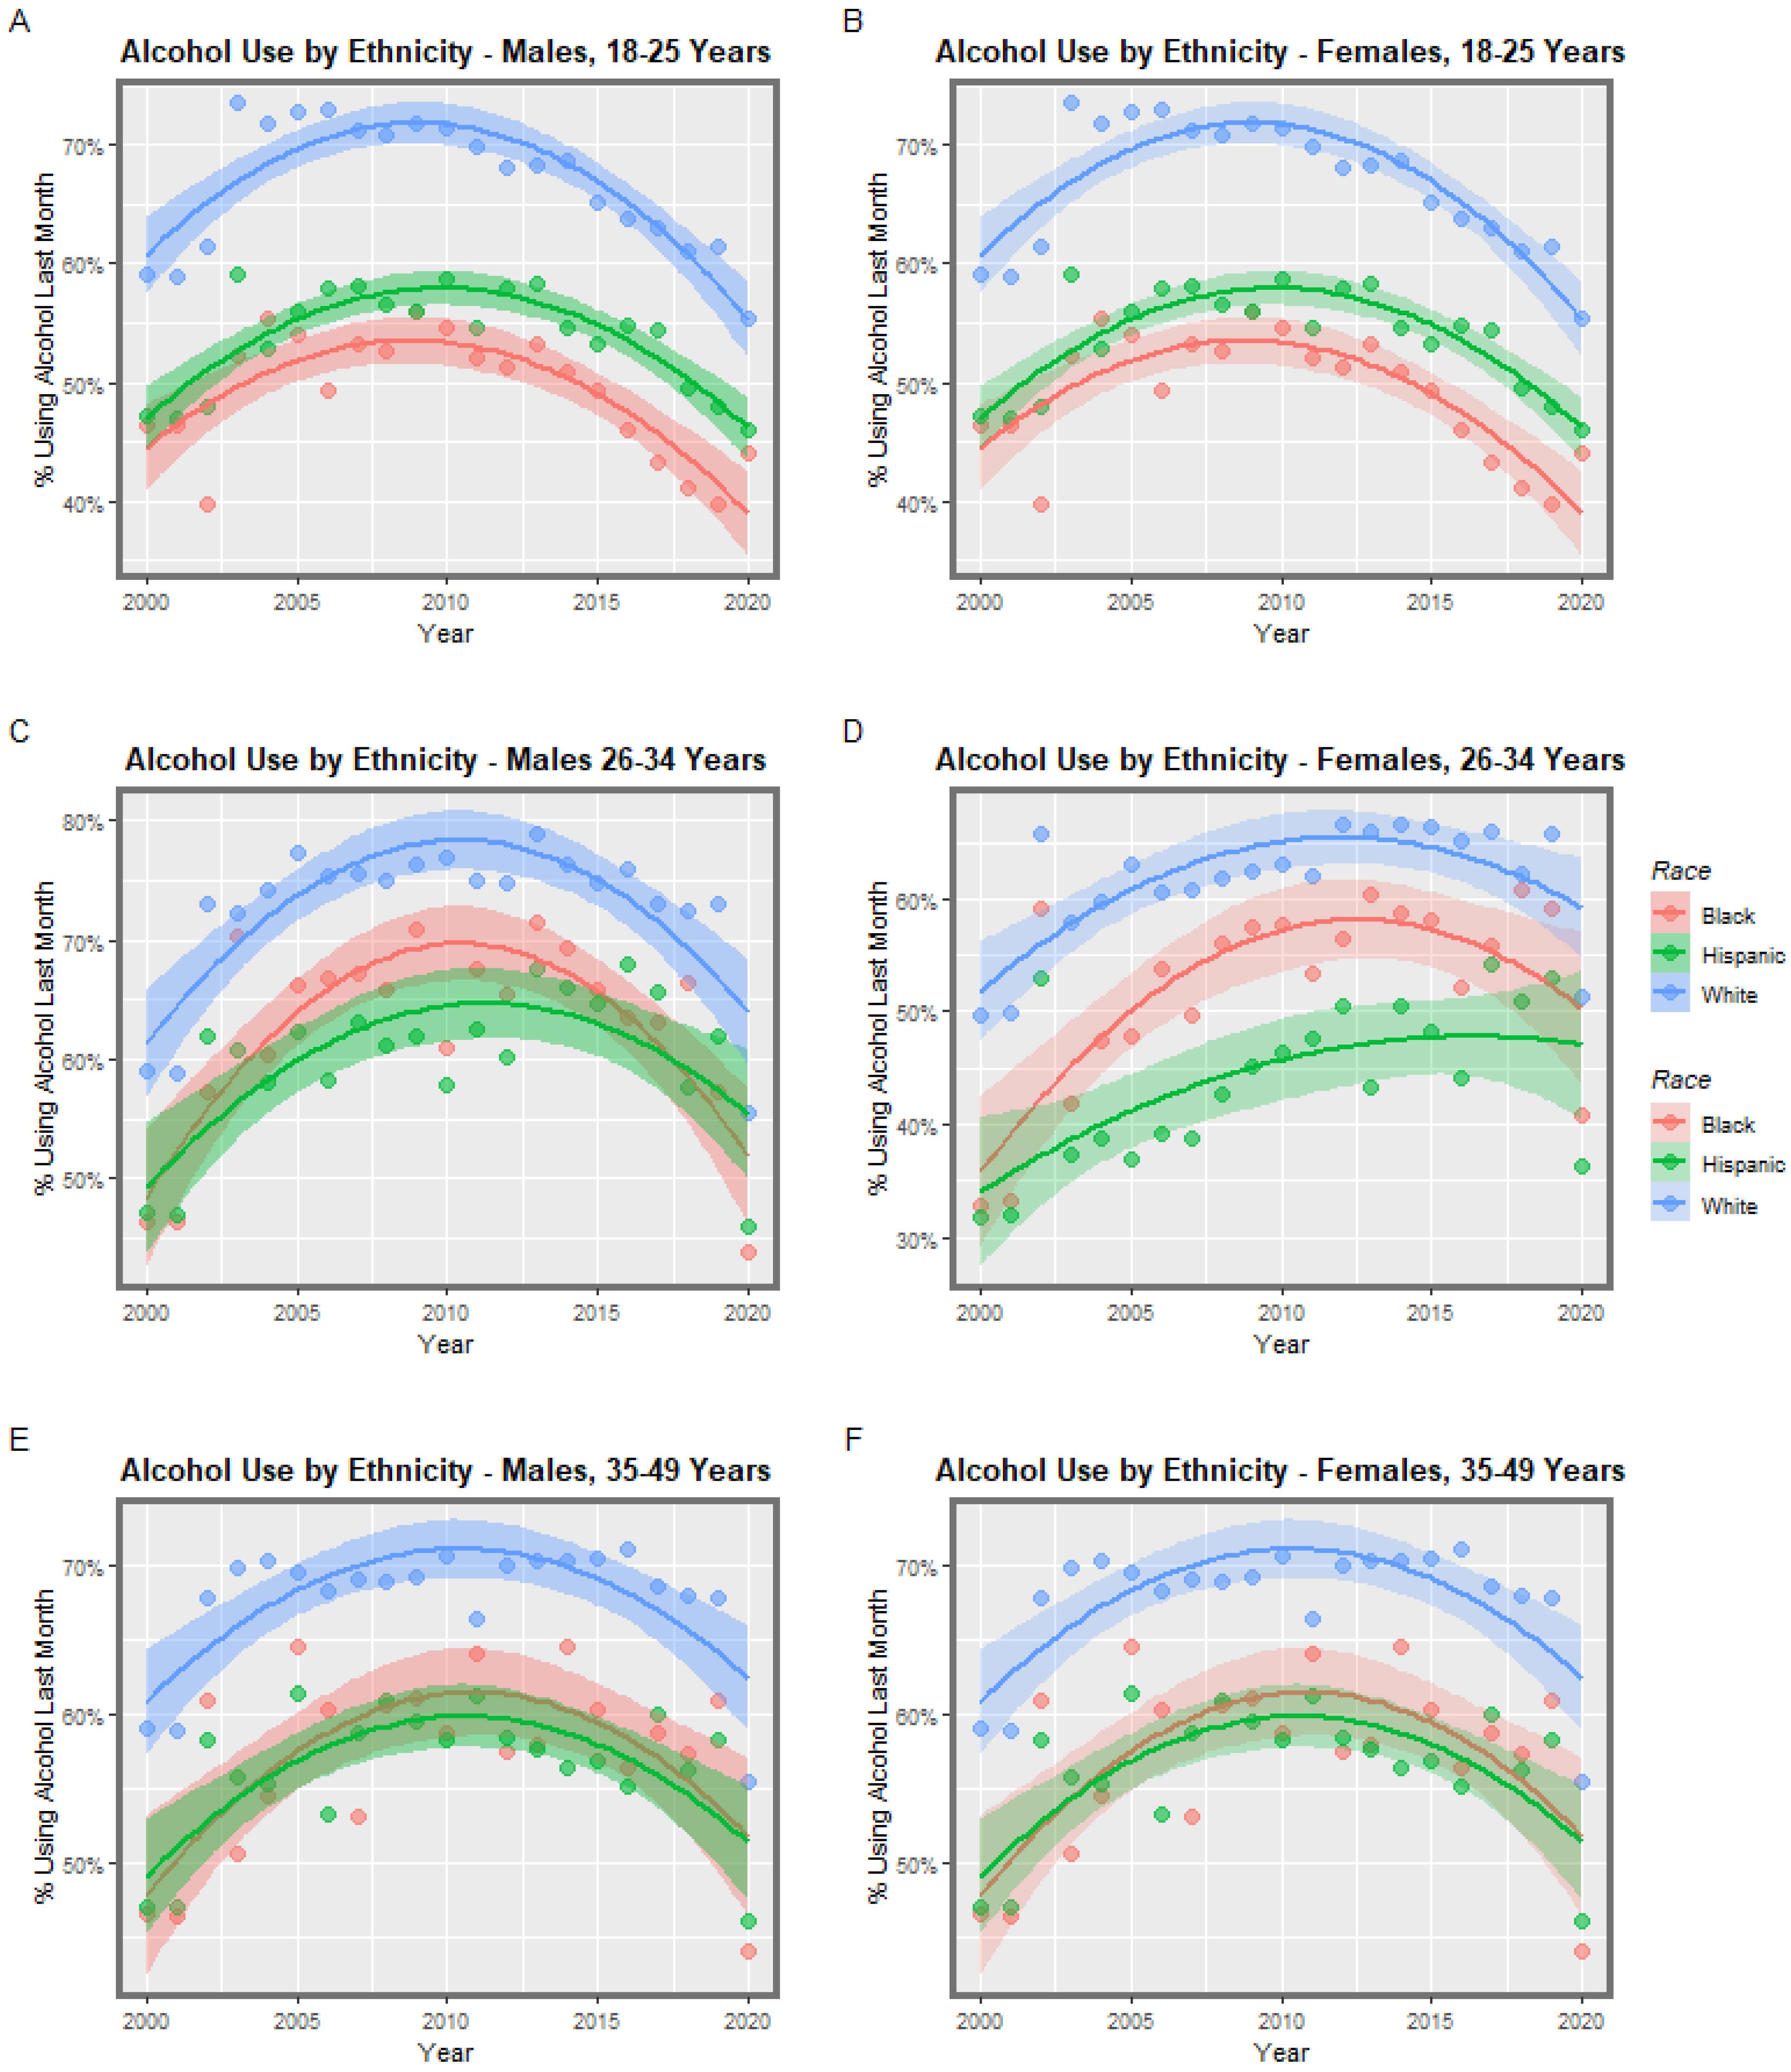
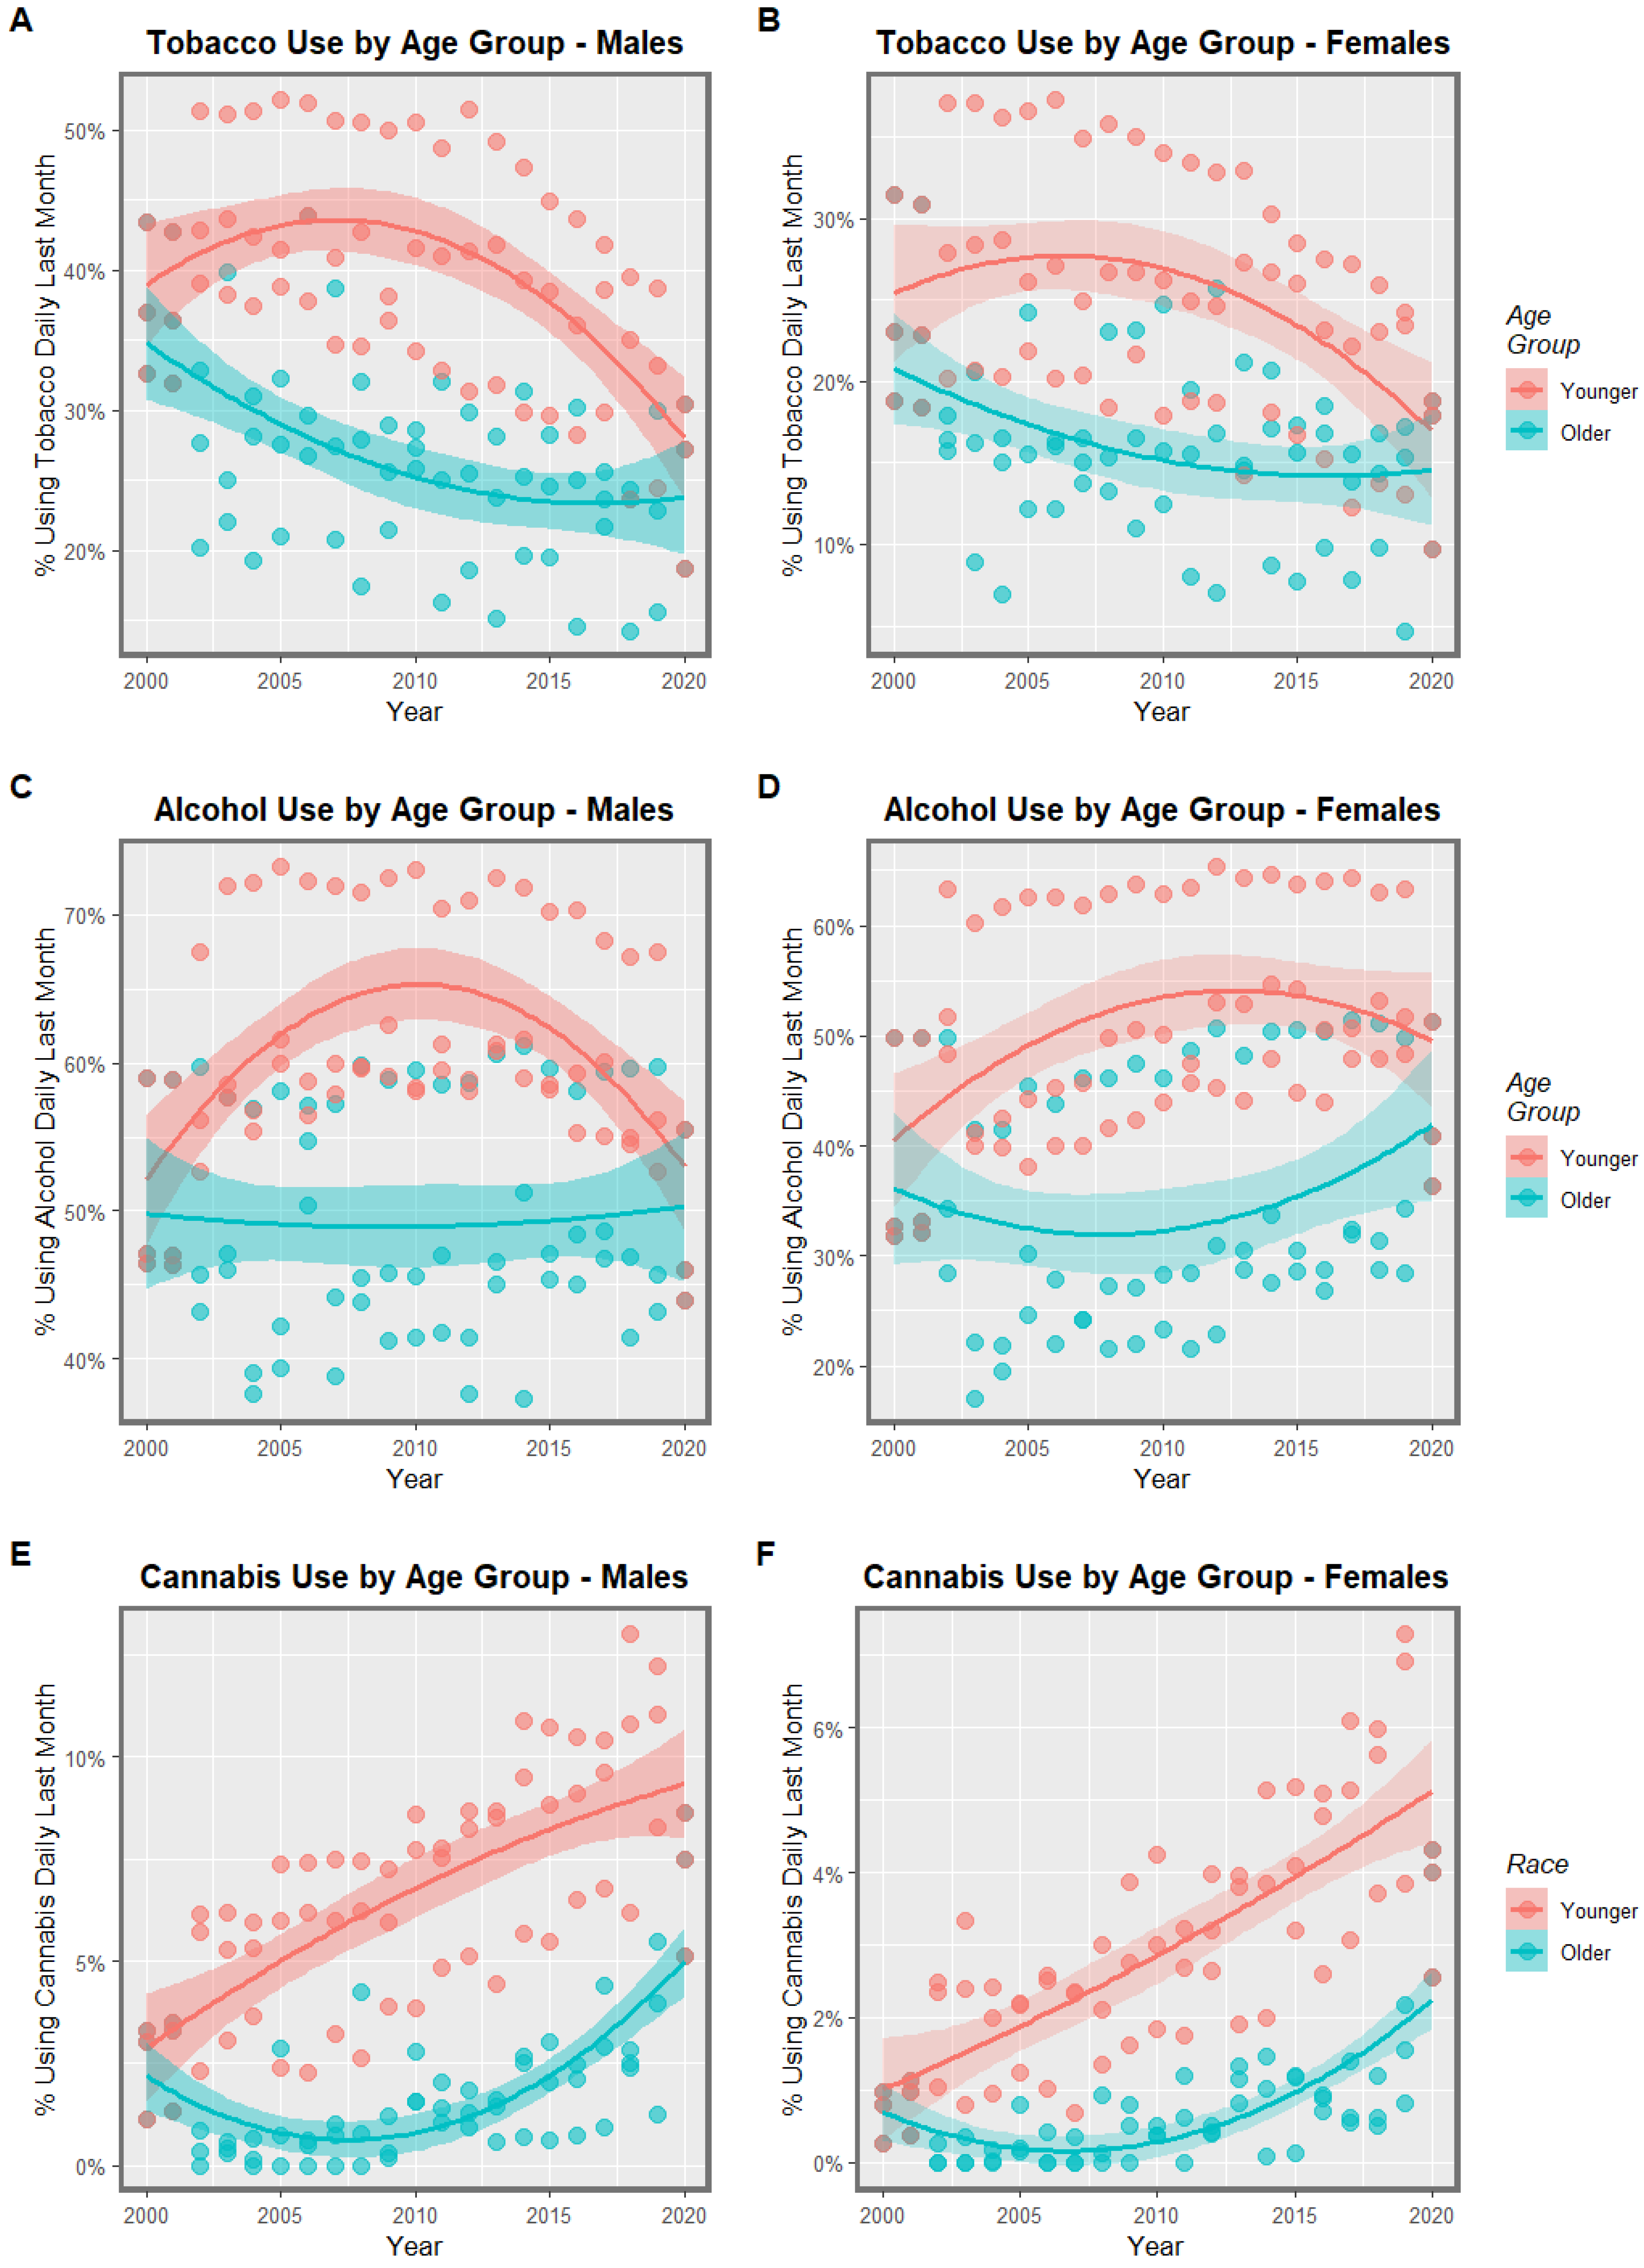
2.2. Drug Use Rates
2.3. Data Analysis
2.4. Data Extrapolation
3. Results
3.1. Input Data
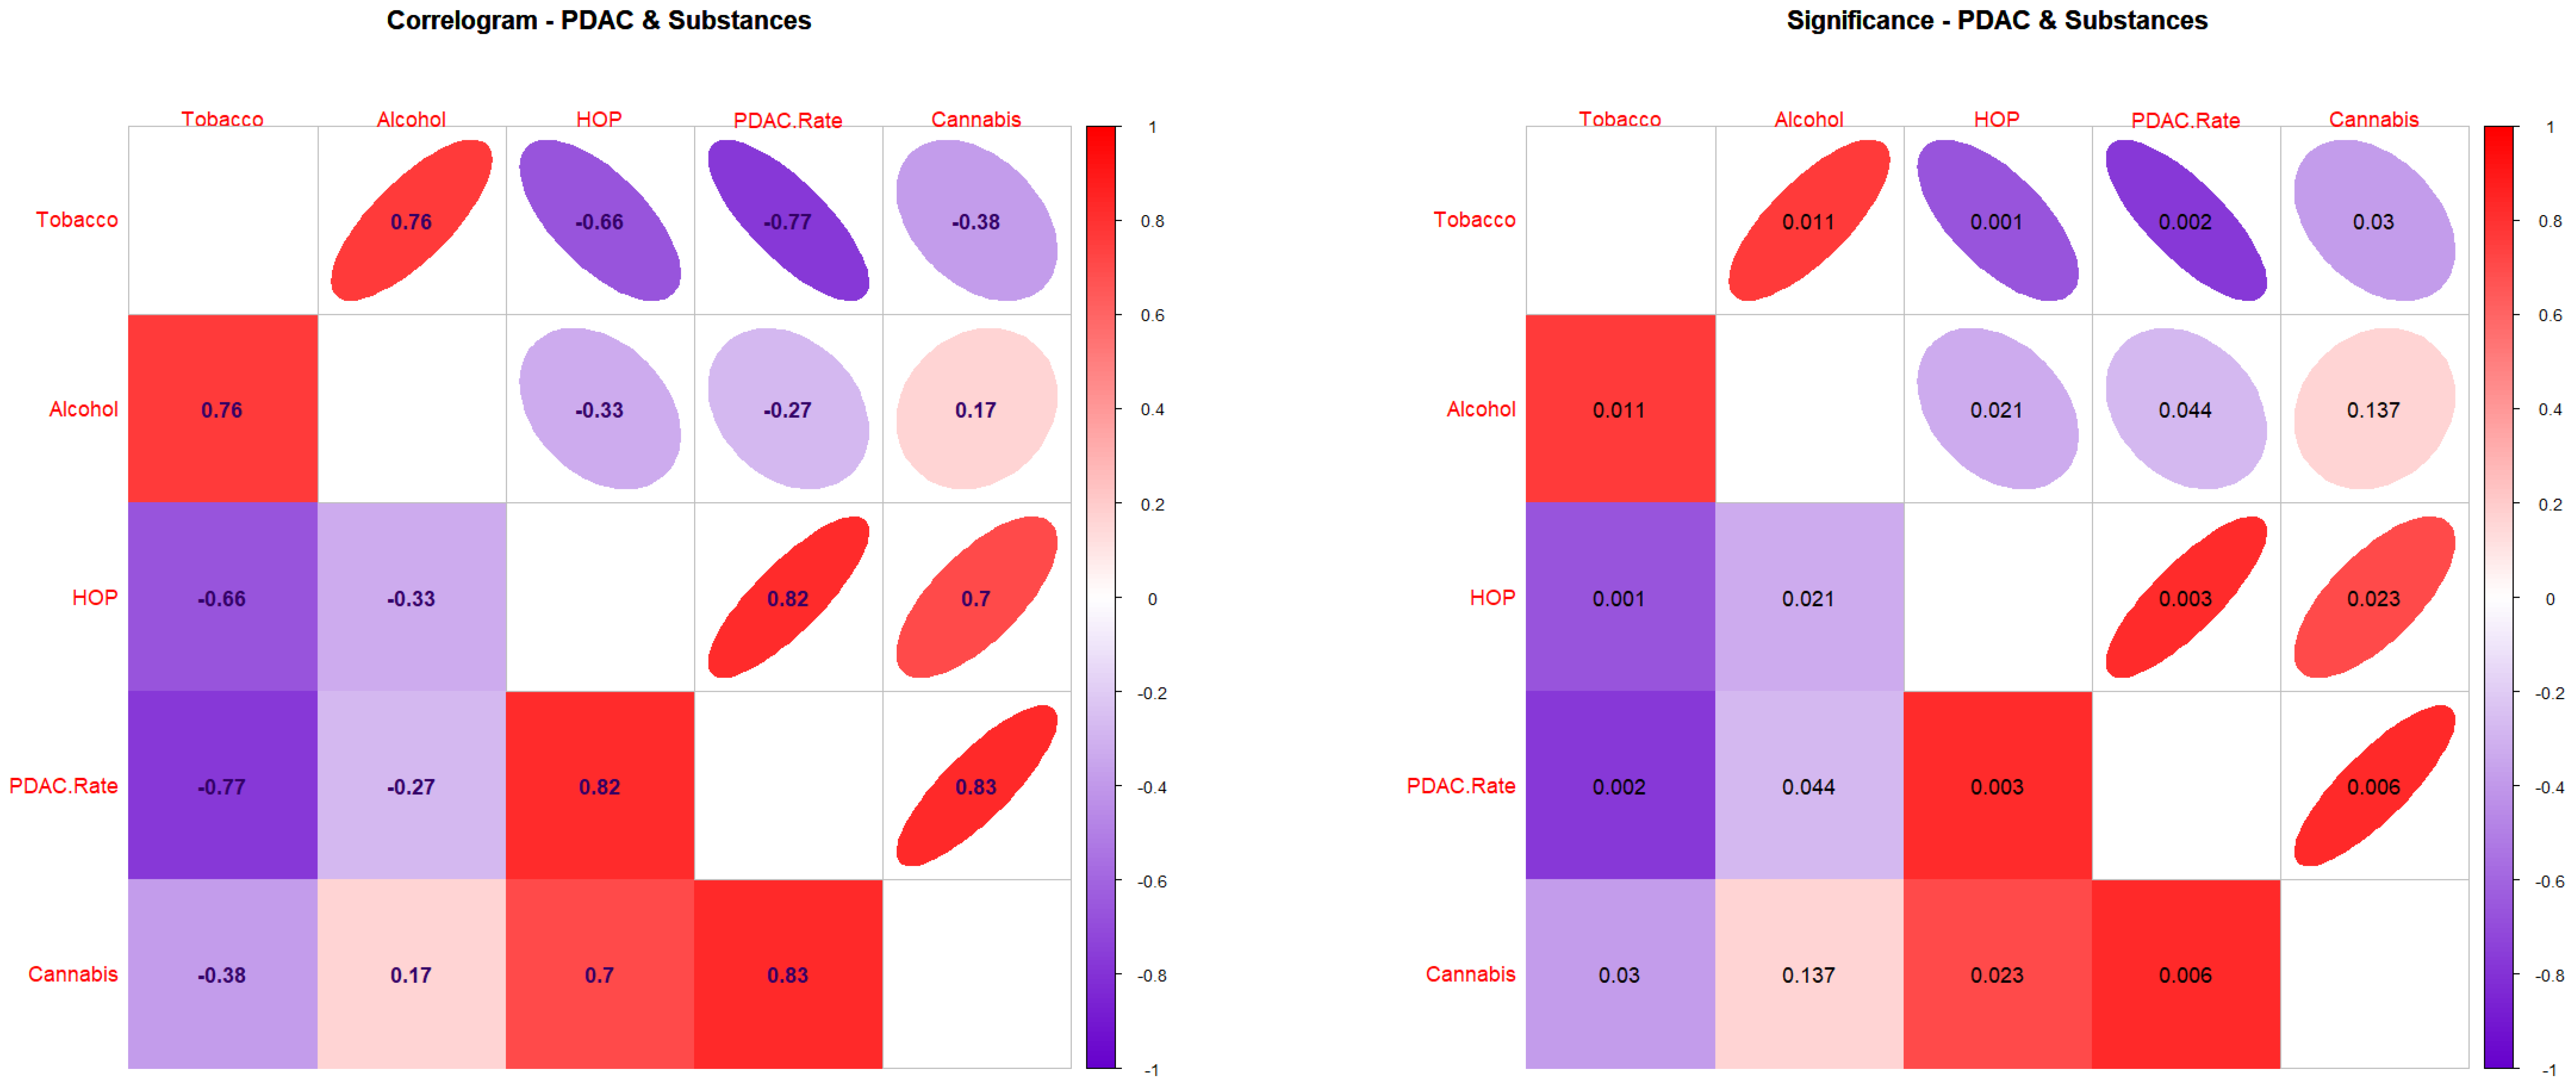
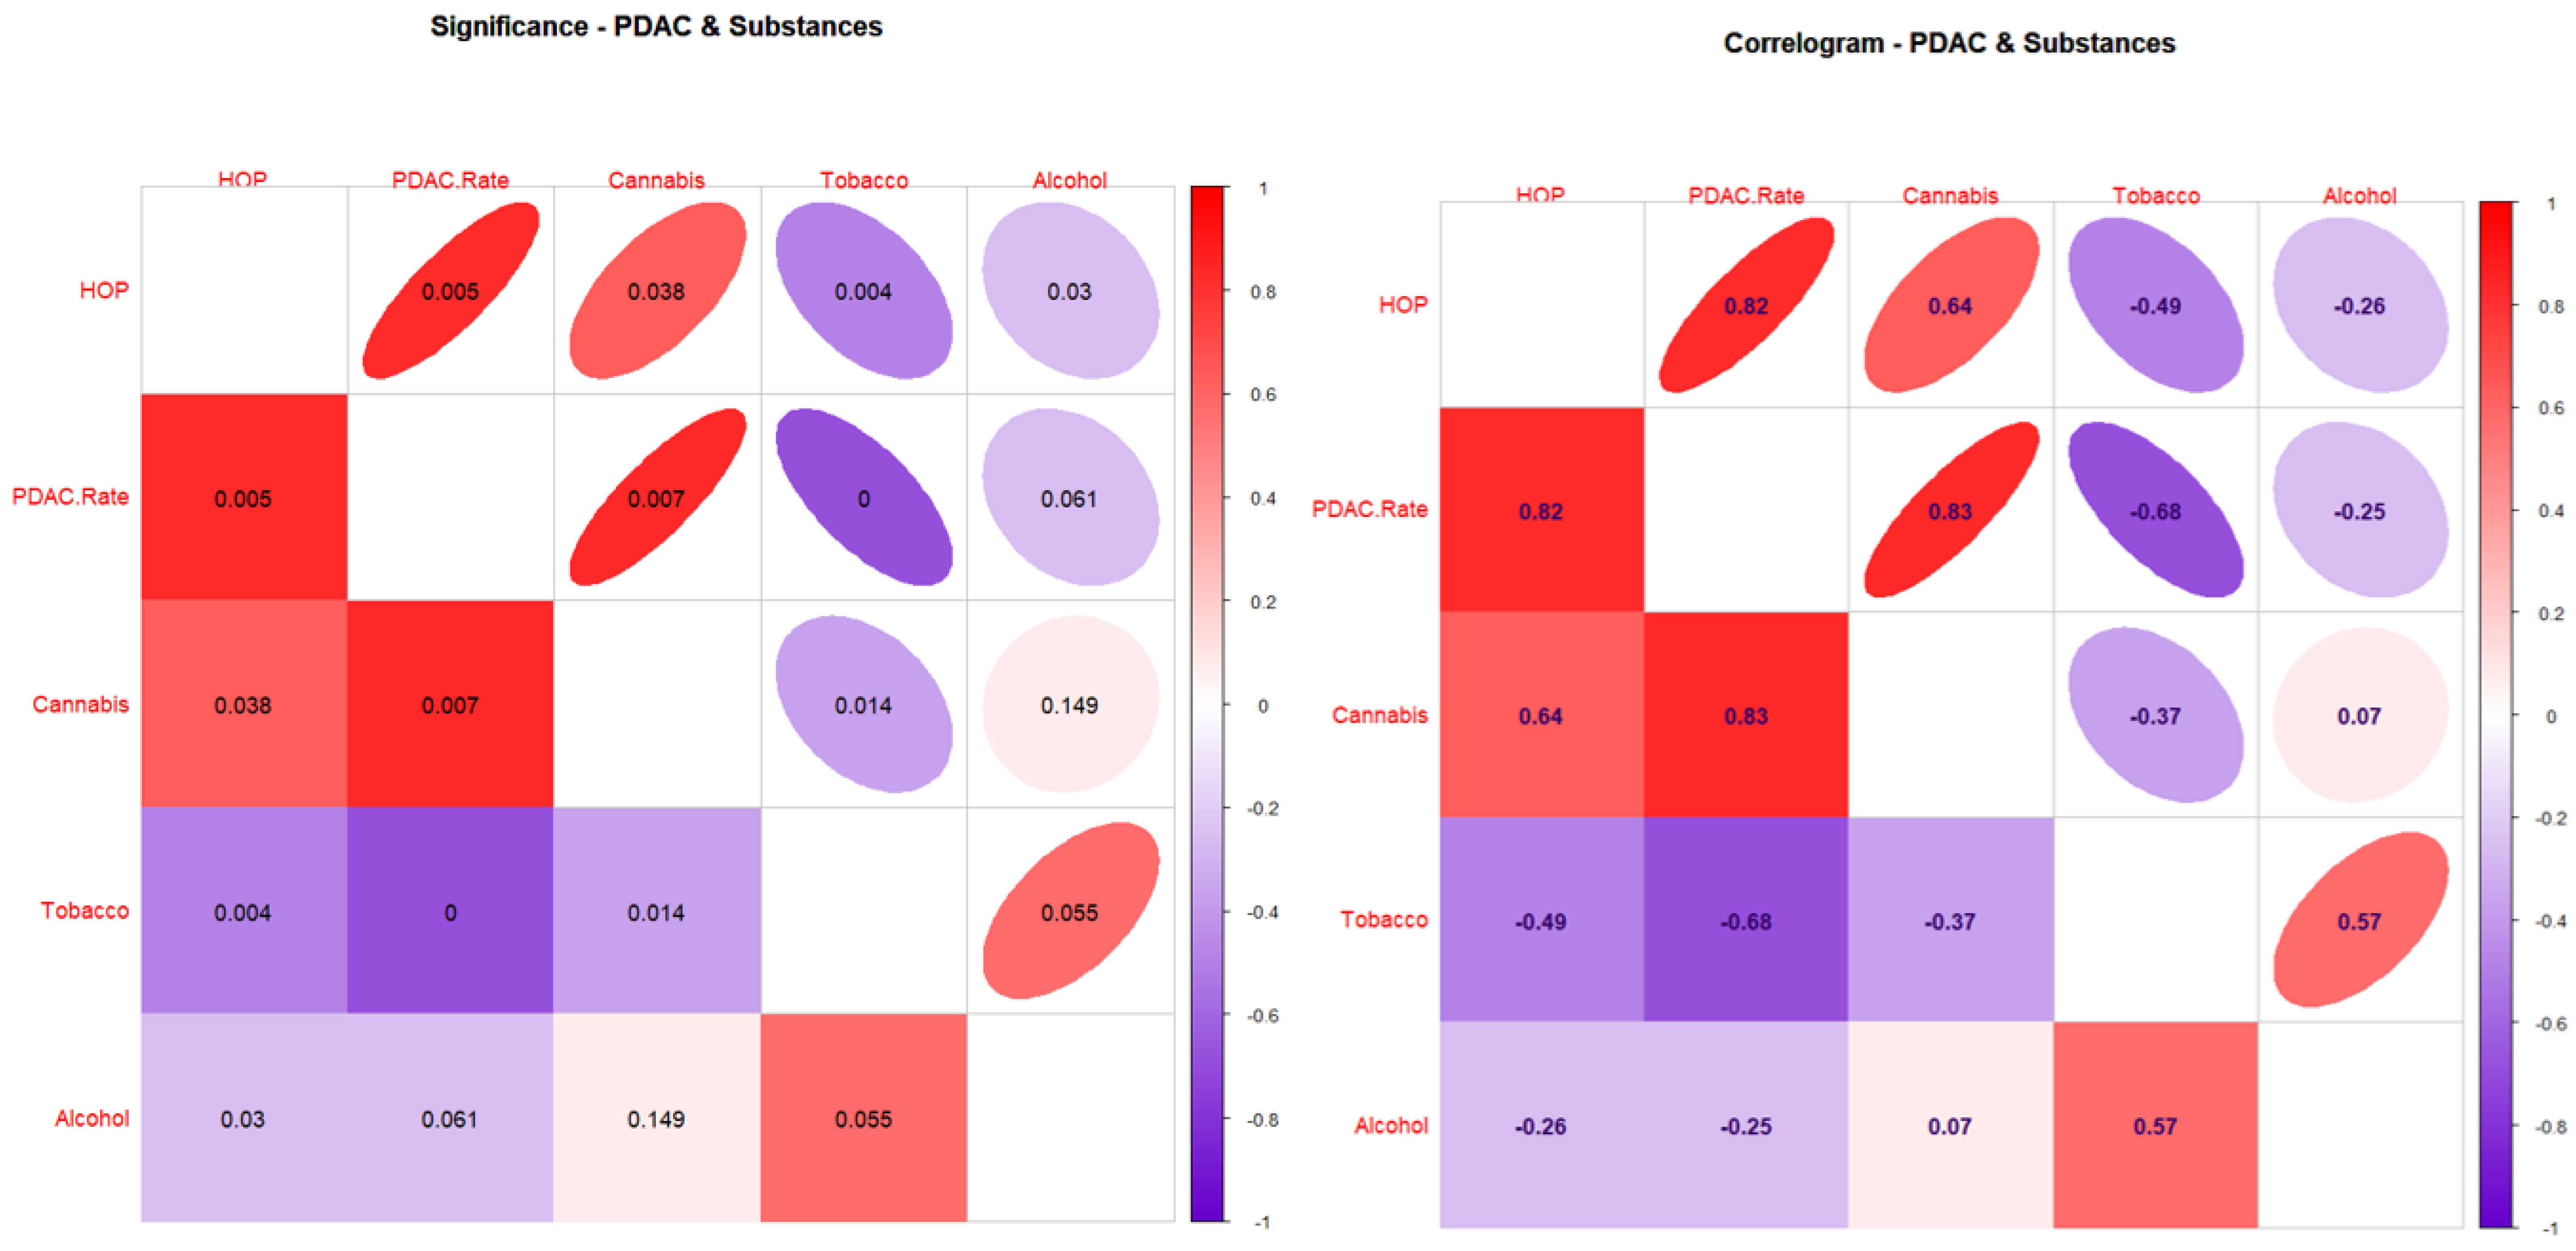
3.2. Correlations
3.3. Bivariate Regressions
3.4. Multivariable Regressions
4. Discussion
4.1. Main Results
4.2. Interpretation
4.3. Causal Inference
4.3.1. Qualitative Causal Inference
4.3.2. Quantitative Causal Inference
4.4. Mechanisms
4.4.1. Epigenomics
4.4.2. Alcohol: Cannabis Interaction
4.5. Future Research Directions
4.6. Generalizability
4.7. Strengths and Limitations
5. Conclusions
Supplementary Materials
Author Contributions
Funding
Institutional Review Board Statement
Informed Consent Statement
Data Availability Statement
Acknowledgments
Conflicts of Interest
References
- SEER Explorer. Available online: https://seer.cancer.gov/explorer/application.html (accessed on 19 February 2023).
- Ugai, T.; Sasamoto, N.; Lee, H.Y.; Ando, M.; Song, M.; Tamimi, R.M.; Kawachi, I.; Campbell, P.T.; Giovannucci, E.L.; Weiderpass, E.; et al. Is early-onset cancer an emerging global epidemic? Current evidence and future implications. Nat. Rev. Clin. Oncol. 2022, 19, 656–673. [Google Scholar] [CrossRef] [PubMed]
- Abboud, Y.; Samaan, J.S.; Oh, J.; Jiang, Y.; Randhawa, N.; Lew, D.; Ghaith, J.; Pala, P.; Leyson, C.; Watson, R.; et al. Increasing Pancreatic Cancer Incidence in Young Women in the US: A Population-Based Time-Trend Analysis, 2001–2018. Gastroenterology, 2023; in press. [Google Scholar]
- Reece, A.S.; Hulse, G.K. Geotemporospatial and Causal Inferential Epidemiological Overview and Survey of USA Cannabis, Cannabidiol and Cannabinoid Genotoxicity Expressed in Cancer Incidence 2003–2017: Part 1—Continuous Bivariate Analysis. Arch. Public. Health 2022, 80, 99–133. [Google Scholar] [CrossRef] [PubMed]
- Reece, A.S.; Hulse, G.K. Geotemporospatial and Causal Inferential Epidemiological Overview and Survey of USA Cannabis, Cannabidiol and Cannabinoid Genotoxicity Expressed in Cancer Incidence 2003–2017: Part 2—Categorical Bivariate Analysis and Attributable Fractions. Arch. Public. Health 2022, 80, 100–135. [Google Scholar] [CrossRef] [PubMed]
- Reece, A.S.; Hulse, G.K. Geotemporospatial and Causal Inferential Epidemiological Overview and Survey of USA Cannabis, Cannabidiol and Cannabinoid Genotoxicity Expressed in Cancer Incidence 2003–2017: Part 3—Spatiotemporal, Multivariable and Causal Inferential Pathfinding and Exploratory Analyses of Prostate and Ovarian Cancers. Arch. Public Health 2022, 80, 100–136. [Google Scholar] [CrossRef] [PubMed]
- Reece, A.S.; Hulse, G.K. Epidemiological Overview of Multidimensional Chromosomal and Genome Toxicity of Cannabis Exposure in Congenital Anomalies and Cancer Development. Sci. Rep. 2021, 11, 13892–13912. [Google Scholar] [CrossRef]
- Key Substance Use and Mental Health Indicators in the United States: Results from the 2020 National Survey on Drug Use and Health (NSDUH). Available online: https://www.samhsa.gov/data/sites/default/files/reports/rpt35325/NSDUHFFRPDFWHTMLFiles2020/2020NSDUHFFR1PDFW102121.pdf (accessed on 20 January 2023).
- United National Office of Drugs and Crime. World Drug Report 2019; World Health Organization Office of Drugs and Crime, Ed.; United National World Health Organization: Geneva, Switzerland, 2019; Volume 1–5, Available online: https://wdr.unodc.org/wdr2019/index.html (accessed on 20 January 2023).
- Patsenker, E.; Stickel, F. Cannabinoids in liver diseases. Clin. Liver Dis. 2016, 7, 21–25. [Google Scholar] [CrossRef]
- DiNieri, J.A.; Wang, X.; Szutorisz, H.; Spano, S.M.; Kaur, J.; Casaccia, P.; Dow-Edwards, D.; Hurd, Y.L. Maternal cannabis use alters ventral striatal dopamine D2 gene regulation in the offspring. Biol. Psychiatry 2011, 70, 763–769. [Google Scholar] [CrossRef]
- Ellis, R.J.; Bara, A.; Vargas, C.A.; Frick, A.L.; Loh, E.; Landry, J.; Uzamere, T.O.; Callens, J.E.; Martin, Q.; Rajarajan, P.; et al. Prenatal Δ(9)-Tetrahydrocannabinol Exposure in Males Leads to Motivational Disturbances Related to Striatal Epigenetic Dysregulation. Biol. Psychiatry 2021, 92, 127–138. [Google Scholar] [CrossRef]
- Szutorisz, H.; Hurd, Y.L. Epigenetic Effects of Cannabis Exposure. Biol. Psychiatry 2016, 79, 586–594. [Google Scholar] [CrossRef]
- Szutorisz, H.; DiNieri, J.A.; Sweet, E.; Egervari, G.; Michaelides, M.; Carter, J.M.; Ren, Y.; Miller, M.L.; Blitzer, R.D.; Hurd, Y.L. Parental THC exposure leads to compulsive heroin-seeking and altered striatal synaptic plasticity in the subsequent generation. Neuropsychopharmacology 2014, 39, 1315–1323. [Google Scholar] [CrossRef] [PubMed]
- Watson, C.T.; Szutorisz, H.; Garg, P.; Martin, Q.; Landry, J.A.; Sharp, A.J.; Hurd, Y.L. Genome-Wide DNA Methylation Profiling Reveals Epigenetic Changes in the Rat Nucleus Accumbens Associated with Cross-Generational Effects of Adolescent THC Exposure. Neuropsychopharmacology 2015, 40, 2993–3005. [Google Scholar] [CrossRef] [PubMed]
- Szutorisz, H.; Hurd, Y.L. High times for cannabis: Epigenetic imprint and its legacy on brain and behavior. Neurosci. Biobehav. Rev. 2018, 85, 93–101. [Google Scholar] [CrossRef] [PubMed]
- Schrott, R.; Murphy, S.K.; Modliszewski, J.L.; King, D.E.; Hill, B.; Itchon-Ramos, N.; Raburn, D.; Price, T.; Levin, E.D.; Vandrey, R.; et al. Refraining from use diminishes cannabis-associated epigenetic changes in human sperm. Environ. Epigenetics 2021, 7, dvab009. [Google Scholar] [CrossRef] [PubMed]
- Schrott, R.; Greeson, K.W.; King, D.; Symosko Crow, K.M.; Easley, C.A.T.; Murphy, S.K. Cannabis alters DNA methylation at maternally imprinted and autism candidate genes in spermatogenic cells. Syst. Biol. Reprod. Med. 2022, 68, 357–369. [Google Scholar] [CrossRef]
- Zykovich, A.; Hubbard, A.; Flynn, J.M.; Tarnopolsky, M.; Fraga, M.F.; Kerksick, C.; Ogborn, D.; MacNeil, L.; Mooney, S.D.; Melov, S. Genome-wide DNA methylation changes with age in disease-free human skeletal muscle. Aging Cell 2014, 13, 360–366. [Google Scholar] [CrossRef]
- Greenblatt, M.B.; Debnath, S. A stem-cell basis for skeletal ageing. Nature 2021, 597, 182–183. [Google Scholar] [CrossRef]
- Yang, J.H.; Hayano, M.; Griffin, P.T.; Amorim, J.A.; Bonkowski, M.S.; Apostolides, J.K.; Salfati, E.L.; Blanchette, M.; Munding, E.M.; Bhakta, M.; et al. Loss of epigenetic information as a cause of mammalian aging. Cell 2023, 186, 305–326.E27. [Google Scholar] [CrossRef]
- Childs, B.; van Deursen, J. Inhibition of ‘jumping genes’ promotes healthy ageing. Nature 2019, 566, 46–48. [Google Scholar] [CrossRef]
- Hoyt, S.J.; Storer, J.M.; Hartley, G.A.; Grady, P.G.S.; Gershman, A.; de Lima, L.G.; Limouse, C.; Halabian, R.; Wojenski, L.; Rodriguez, M.; et al. From telomere to telomere: The transcriptional and epigenetic state of human repeat elements. Science 2022, 376, eabk3112. [Google Scholar] [CrossRef]
- Stenchever, M.A.; Kunysz, T.J.; Allen, M.A. Chromosome breakage in users of marihuana. Am. J. Obs. Gynecol. 1974, 118, 106–113. [Google Scholar] [CrossRef] [PubMed]
- Russo, C.; Ferk, F.; Mišík, M.; Ropek, N.; Nersesyan, A.; Mejri, D.; Holzmann, K.; Lavorgna, M.; Isidori, M.; Knasmüller, S. Low doses of widely consumed cannabinoids (cannabidiol and cannabidivarin) cause DNA damage and chromosomal aberrations in human-derived cells. Arch. Toxicol. 2019, 93, 179–188. [Google Scholar] [CrossRef] [PubMed]
- Nahas, G.G.; Morishima, A.; Desoize, B. Effects of cannabinoids on macromolecular synthesis and replication of cultured lymphocytes. Fed. Proc. 1977, 36, 1748–1752. [Google Scholar] [PubMed]
- Dalterio, S.L.; de Rooij, D.G. Maternal cannabinoid exposure. Effects on spermatogenesis in male offspring. Int. J. Androl. 1986, 9, 250–258. [Google Scholar] [CrossRef] [PubMed]
- Leuchtenberger, C.; Leuchtenberger, R. Morphological and cytochemical effects of marijuana cigarette smoke on epithelioid cells of lung explants from mice. Nature 1971, 234, 227–229. [Google Scholar] [CrossRef]
- Leuchtenberger, C.; Leuchtenberger, R.; Schneider, A. Effects of marijuana and tobacco smoke on human lung physiology. Nature 1973, 241, 137–139. [Google Scholar] [CrossRef]
- Dalterio, S.; Badr, F.; Bartke, A.; Mayfield, D. Cannabinoids in male mice: Effects on fertility and spermatogenesis. Science 1982, 216, 315–316. [Google Scholar] [CrossRef]
- Hnisz, D.; Abraham, B.J.; Lee, T.I.; Lau, A.; Saint-Andre, V.; Sigova, A.A.; Hoke, H.A.; Young, R.A. Super-enhancers in the control of cell identity and disease. Cell 2013, 155, 934–947. [Google Scholar] [CrossRef]
- Hnisz, D.; Schuijers, J.; Lin, C.Y.; Weintraub, A.S.; Abraham, B.J.; Lee, T.I.; Bradner, J.E.; Young, R.A. Convergence of developmental and oncogenic signaling pathways at transcriptional super-enhancers. Mol. Cell 2015, 58, 362–370. [Google Scholar] [CrossRef]
- Kloetgen, A.; Thandapani, P.; Ntziachristos, P.; Ghebrechristos, Y.; Nomikou, S.; Lazaris, C.; Chen, X.; Hu, H.; Bakogianni, S.; Wang, J.; et al. Three-dimensional chromatin landscapes in T cell acute lymphoblastic leukemia. Nat. Genet. 2020, 52, 388–400. [Google Scholar] [CrossRef]
- Yang, H.; Zhang, H.; Luan, Y.; Liu, T.; Yang, W.; Roberts, K.G.; Qian, M.X.; Zhang, B.; Yang, W.; Perez-Andreu, V.; et al. Noncoding genetic variation in GATA3 increases acute lymphoblastic leukemia risk through local and global changes in chromatin conformation. Nat. Genet. 2022, 54, 170–179. [Google Scholar] [CrossRef] [PubMed]
- Xu, J.; Song, F.; Lyu, H.; Kobayashi, M.; Zhang, B.; Zhao, Z.; Hou, Y.; Wang, X.; Luan, Y.; Jia, B.; et al. Subtype-specific 3D genome alteration in acute myeloid leukaemia. Nature 2022, 611, 387–398. [Google Scholar] [CrossRef] [PubMed]
- Ishoey, M.; Chorn, S.; Singh, N.; Jaeger, M.G.; Brand, M.; Paulk, J.; Bauer, S.; Erb, M.A.; Parapatics, K.; Muller, A.C.; et al. Translation Termination Factor GSPT1 Is a Phenotypically Relevant Off-Target of Heterobifunctional Phthalimide Degraders. ACS Chem. Biol. 2018, 13, 553–560. [Google Scholar] [CrossRef] [PubMed]
- Duan, Q.; Mao, X.; Xiao, Y.; Liu, Z.; Wang, Y.; Zhou, H.; Zhou, Z.; Cai, J.; Xia, K.; Zhu, Q.; et al. Super enhancers at the miR-146a and miR-155 genes contribute to self-regulation of inflammation. Biochim. Biophys. Acta 2016, 1859, 564–571. [Google Scholar] [CrossRef]
- Ounzain, S.; Pedrazzini, T. Super-enhancer lncs to cardiovascular development and disease. Biochim. Biophys. Acta 2016, 1863, 1953–1960. [Google Scholar] [CrossRef] [PubMed]
- Kohnken, R.; Wen, J.; Mundy-Bosse, B.; McConnell, K.; Keiter, A.; Grinshpun, L.; Hartlage, A.; Yano, M.; McNeil, B.; Chakravarti, N.; et al. Diminished microRNA-29b level is associated with BRD4-mediated activation of oncogenes in cutaneous T-cell lymphoma. Blood 2018, 131, 771–781. [Google Scholar] [CrossRef] [PubMed]
- Ott, C.J.; Federation, A.J.; Schwartz, L.S.; Kasar, S.; Klitgaard, J.L.; Lenci, R.; Li, Q.; Lawlor, M.; Fernandes, S.M.; Souza, A.; et al. Enhancer Architecture and Essential Core Regulatory Circuitry of Chronic Lymphocytic Leukemia. Cancer Cell 2018, 34, 982–995.E7. [Google Scholar] [CrossRef]
- Yokoyama, Y.; Zhu, H.; Lee, J.H.; Kossenkov, A.V.; Wu, S.Y.; Wickramasinghe, J.M.; Yin, X.; Palozola, K.C.; Gardini, A.; Showe, L.C.; et al. BET Inhibitors Suppress ALDH Activity by Targeting ALDH1A1 Super-Enhancer in Ovarian Cancer. Cancer Res. 2016, 76, 6320–6330. [Google Scholar] [CrossRef]
- Whyte, W.A.; Orlando, D.A.; Hnisz, D.; Abraham, B.J.; Lin, C.Y.; Kagey, M.H.; Rahl, P.B.; Lee, T.I.; Young, R.A. Master transcription factors and mediator establish super-enhancers at key cell identity genes. Cell 2013, 153, 307–319. [Google Scholar] [CrossRef]
- Skoulidis, F.; Heymach, J.V.; Cascone, T. A STING operation to expose KRAS and STK11 co-mutated lung cancers. Cancer Cell 2022, 40, 1073–1076. [Google Scholar] [CrossRef]
- Kortlever, R.M.; Sodir, N.M.; Wilson, C.H.; Burkhart, D.L.; Pellegrinet, L.; Brown Swigart, L.; Littlewood, T.D.; Evan, G.I. Myc Cooperates with Ras by Programming Inflammation and Immune Suppression. Cell 2017, 171, 1301–1315.E14. [Google Scholar] [CrossRef] [PubMed]
- Neuhöfer, P.; Roake, C.M.; Kim, S.J.; Lu, R.J.; West, R.B.; Charville, G.W.; Artandi, S.E. Acinar cell clonal expansion in pancreas homeostasis and carcinogenesis. Nature 2021, 597, 715–719. [Google Scholar] [CrossRef] [PubMed]
- Park, W.; Chawla, A.; O’Reilly, E.M. Pancreatic Cancer: A Review. Jama 2021, 326, 851–862. [Google Scholar] [CrossRef] [PubMed]
- Lan, L.; Evan, T.; Li, H.; Hussain, A.; Ruiz, E.J.; Zaw Thin, M.; Ferreira, R.M.M.; Ps, H.; Riising, E.M.; Zen, Y.; et al. GREM1 is required to maintain cellular heterogeneity in pancreatic cancer. Nature 2022, 607, 163–168. [Google Scholar] [CrossRef]
- Del Poggetto, E.; Ho, I.L.; Balestrieri, C.; Yen, E.Y.; Zhang, S.; Citron, F.; Shah, R.; Corti, D.; Diaferia, G.R.; Li, C.Y.; et al. Epithelial memory of inflammation limits tissue damage while promoting pancreatic tumorigenesis. Science 2021, 373, eabj0486. [Google Scholar] [CrossRef]
- Klein, T.W.; Newton, C.; Larsen, K.; Lu, L.; Perkins, I.; Nong, L.; Friedman, H. The cannabinoid system and immune modulation. J. Leukoc. Biol. 2003, 74, 486–496. [Google Scholar] [CrossRef]
- Bindukumar, B.; Mahajan, S.D.; Reynolds, J.L.; Hu, Z.; Sykes, D.E.; Aalinkeel, R.; Schwartz, S.A. Genomic and proteomic analysis of the effects of cannabinoids on normal human astrocytes. Brain Res. 2008, 1191, 1–11. [Google Scholar] [CrossRef]
- Eisenstein, T.K.; Meissler, J.J. Effects of Cannabinoids on T-cell Function and Resistance to Infection. J. Neuroimmune Pharm. 2015, 10, 204–216. [Google Scholar] [CrossRef]
- Zumbrun, E.E.; Sido, J.M.; Nagarkatti, P.S.; Nagarkatti, M. Epigenetic Regulation of Immunological Alterations Following Prenatal Exposure to Marijuana Cannabinoids and its Long Term Consequences in Offspring. J. Neuroimmune Pharm. 2015, 10, 245–254. [Google Scholar] [CrossRef]
- Chiurchiu, V. Endocannabinoids and Immunity. Cannabis Cannabinoid Res. 2016, 1, 59–66. [Google Scholar] [CrossRef]
- Gallily, R.; Yekhtin, Z. Avidekel Cannabis extracts and cannabidiol are as efficient as Copaxone in suppressing EAE in SJL/J mice. Inflammopharmacology 2018, 27, 167–173. [Google Scholar] [CrossRef] [PubMed]
- Kaplan, B.L.F. Evaluation of Marijuana Compounds on Neuroimmune Endpoints in Experimental Autoimmune Encephalomyelitis. Curr. Protoc. Toxicol. 2018, 75, 11 25 11–11 25 22. [Google Scholar] [CrossRef] [PubMed]
- Allen, J.P.; Danoff, J.S.; Costello, M.A.; Hunt, G.L.; Hellwig, A.F.; Krol, K.M.; Gregory, S.G.; Giamberardino, S.N.; Sugden, K.; Connelly, J.J. Lifetime marijuana use and epigenetic age acceleration: A 17-year prospective examination. Drug Alcohol Depend. 2022, 233, 109363. [Google Scholar] [CrossRef] [PubMed]
- Phillips, K.T.; Pedula, K.L.; Choi, N.G.; Tawara, K.K.; Simiola, V.; Satre, D.D.; Owen-Smith, A.; Lynch, F.F.; Dickerson, J. Chronic health conditions, acute health events, and healthcare utilization among adults over age 50 in Hawai’i who use cannabis: A matched cohort study. Drug Alcohol Depend. 2022, 234, 109387. [Google Scholar] [CrossRef] [PubMed]
- Reece, A.S.; Norman, A.; Hulse, G.K. Cannabis exposure as an interactive cardiovascular risk factor and accelerant of organismal ageing: A longitudinal study. BMJ Open 2016, 6, e011891–e011901. [Google Scholar] [CrossRef] [PubMed]
- Forrester, M.B.; Merz, R.D. Risk of selected birth defects with prenatal illicit drug use, Hawaii, 1986–2002. J. Toxicol. Environ. Health 2007, 70, 7–18. [Google Scholar] [CrossRef]
- Reece, A.S.; Hulse, G.K. Cannabinoid- and Substance- Relationships of European Congenital Anomaly Patterns: A Space-Time Panel Regression and Causal Inferential Study. Environ. Epigenetics 2022, 8, dvab015. [Google Scholar] [CrossRef]
- Reece, A.S.; Hulse, G.K. Cannabinoid Genotoxicity and Congenital Anomalies: A Convergent Synthesis of European and USA Datasets. In Cannabis, Cannabinoids and Endocannabinoids; Preedy, V., Patel, V., Eds.; Elsevier: London, UK, 2022; Volume 1, in press. [Google Scholar]
- Reece, A.S.; Hulse, G.K. Congenital Anomaly Epidemiological Correlates of Δ8THC Across USA 2003–2016: Panel Regression and Causal Inferential Study. Environ. Epigenetics 2022, 8, dvac012. [Google Scholar] [CrossRef]
- Reece, A.S.; Hulse, G.K. European Epidemiological Patterns of Cannabis- and Substance- Related Congenital Body Wall Anomalies: Geospatiotemporal and Causal Inferential Study. Int. J. Environ. Res. Public Health 2022, 19, 9027. [Google Scholar] [CrossRef]
- Reece, A.S.; Hulse, G.K. Cannabis- and Substance- Related Epidemiological Patterns of Chromosomal Congenital Anomalies in Europe: Geospatiotemporal and Causal Inferential Study. Int. J. Environ. Res. Public Health 2022, 19, 11208. [Google Scholar] [CrossRef]
- Reece, A.S.; Hulse, G.K. European Epidemiological Patterns of Cannabis- and Substance- Related Congenital Cardiovascular Anomalies: Geospatiotemporal and Causal Inferential Study. Environ. Epigenetics 2022, 8, dvac015. [Google Scholar] [CrossRef]
- Reece, A.S.; Hulse, G.K. European Epidemiological Patterns of Cannabis- and Substance- Related Congenital Neurological Anomalies: Geospatiotemporal and Causal Inferential Study. Int. J. Environ. Res. Public Health 2022, 20, 441. [Google Scholar] [CrossRef]
- Reece, A.S.; Hulse, G.K. Effects of Cannabis on Congenital Limb Anomalies in 14 European Nations: A Geospatiotemporal and Causal Inferential Study. Environ. Epigenetics 2022, 8, dvac016. [Google Scholar] [CrossRef]
- Reece, A.S.; Hulse, G.K. European Epidemiological Patterns of Cannabis- and Substance- Related Congenital Uronephrological Anomalies: Geospatiotemporal and Causal Inferential Study. Int. J. Environ. Res. Public Health 2022, 19, 13769. [Google Scholar] [CrossRef]
- Reece, A.S.; Hulse, G.K. Geospatiotemporal and Causal Inferential Study of European Epidemiological Patterns of Cannabis- and Substance- Related Congenital Orofacial Anomalies. J. Xenobiotics 2023, 13, 42–74. [Google Scholar] [CrossRef]
- Reece, A.S.; Hulse, G.K. Congenital Gastrointestinal Anomalies in Europe 2010–2019: A Geospatiotemporal and Causal Inferential Study of Epidemiological Patterns in Relationship to Cannabis- and Substance- Exposure. Gastrointest. Insights 2023, 14, 64–109. [Google Scholar] [CrossRef]
- Reece, A.S.; Hulse, G.K. Patterns of Cannabis- and Substance- Related Congenital General Anomalies in Europe: A Geospatiotemporal and Causal Inferential Study. Pediatr. Rep. 2023, 15, 69–121. [Google Scholar] [CrossRef]
- Reece, A.S.; Hulse, G.K. Chapter 3: Geospatiotemporal and Causal Inferential Analysis of United States Congenital Anomalies as a Function of Multiple Cannabinoid- and Substance- Exposures: Phenocopying Thalidomide and Hundred Megabase-Scale Genotoxicity. In Epidemiology of Cannabis: Genotoxicity and Neurotoxicity, Epigenomics and Aging; Elsevier: New York, NY, USA, 2023; Volume 1, in press. [Google Scholar]
- Reece, A.S.; Hulse, G.K. Chromothripsis and epigenomics complete causality criteria for cannabis- and addiction-connected carcinogenicity, congenital toxicity and heritable genotoxicity. Mutat. Res. 2016, 789, 15–25. [Google Scholar] [CrossRef]
- Reece, A.S.; Hulse, G.K. Cannabis Teratology Explains Current Patterns of Coloradan Congenital Defects: The Contribution of Increased Cannabinoid Exposure to Rising Teratological Trends. Clin. Pediatr. 2019, 58, 1085–1123. [Google Scholar] [CrossRef]
- Reece, A.S.; Hulse, G.K. Canadian Cannabis Consumption and Patterns of Congenital Anomalies: An Ecological Geospatial Analysis. J. Addict. Med. 2020, 14, e195–e210. [Google Scholar] [CrossRef] [PubMed]
- Reece, A.S.; Hulse, G.K. Geotemporospatial and causal inference epidemiological analysis of US survey and overview of cannabis, cannabidiol and cannabinoid genotoxicity in relation to congenital anomalies 2001–2015. BMC Pediatr. 2022, 22, 47–124. [Google Scholar] [CrossRef] [PubMed]
- Reece, A.S.; Hulse, G.K. Epigenomic and Other Evidence for Cannabis-Induced Aging Contextualized in a Synthetic Epidemiologic Overview of Cannabinoid-Related Teratogenesis and Cannabinoid-Related Carcinogenesis. Int. J. Environ. Res. Public Health 2022, 19, 16721. [Google Scholar] [CrossRef]
- Reece, A.S.; Hulse, G.K. Clinical Epigenomic Explanation of the Epidemiology of Cannabinoid Genotoxicity Manifesting as Transgenerational Teratogenesis, Cancerogenesis and Aging Acceleration. Int. J. Environ. Res. Public Health 2023, 20, 3360. [Google Scholar] [CrossRef]
- Reece, A.S.; Hulse, G.K. Chapter 5: Multivalent Cannabinoid Epigenotoxicities and Multigenerational Aging. In Epidemiology of Cannabis: Genotoxicity, Neurotoxicity, Epigenomics and Aging; Elsevier: New York, NY, USA, 2023; Volume 1, in press. [Google Scholar]
- Reece, A.S. Disruption of Interlocking Synchrony between Metabolome and Epigenome Key to Understanding Widespread Embyrotoxicity and Carcinogenicity of Diverse Cannabinoids. Available online: https://www.bmj.com/content/377/bmj.o1567/rr-0 (accessed on 20 January 2023).
- Reece, A.S.; Hulse, G.K. Chapter 4: Geospatiotemporal and Causal Inferential Epidemiological Survey and Exploration of Cannabinoid- and Substance- Related Carcinogenesis in USA 2003–2017. In Epidemiology of Cannabis: Genotoxicity and Neurotoxicity, Epigenomics and Aging; Elsevier: New York, NY, USA, 2023; Volume 1, in press: 2500. [Google Scholar]
- Reece, A.S.; Hulse, G.K. Epidemiology of Δ8THC-Related Carcinogenesis in USA: A Panel Regression and Causal Inferential Study. Int. J. Environ. Res. Public Health 2022, 19, 7726. [Google Scholar] [CrossRef]
- Reece, A.S.; Hulse, G.K. State Trends of Cannabis Liberalization as a Causal Driver of Increasing Testicular Cancer Rates across the USA. Int. J. Environ. Res. Public Health 2022, 19, 12759. [Google Scholar] [CrossRef]
- Reece, A.S.; Hulse, G.K. Causal inference multiple imputation investigation of the impact of cannabinoids and other substances on ethnic differentials in US testicular cancer incidence. BMC Pharm. Toxicol. 2021, 22, 40–71. [Google Scholar] [CrossRef]
- Reece, A.S.; Hulse, G.K. Geospatiotemporal and Causal Inference Study of Cannabis and Other Drugs as Risk Factors for Female Breast Cancer USA 2003–2017. Environ. Epigenetics 2022, 8, dvac006. [Google Scholar] [CrossRef]
- Reece, A.S.; Hulse, G.K. Cannabinoid exposure as a major driver of pediatric acute lymphoid Leukaemia rates across the USA: Combined geospatial, multiple imputation and causal inference study. BMC Cancer 2021, 21, 984–1017. [Google Scholar] [CrossRef]
- Patsenker, E.; Stoll, M.; Millonig, G.; Agaimy, A.; Wissniowski, T.; Schneider, V.; Mueller, S.; Brenneisen, R.; Seitz, H.K.; Ocker, M.; et al. Cannabinoid receptor type I modulates alcohol-induced liver fibrosis. Mol. Med. 2011, 17, 1285–1294. [Google Scholar] [CrossRef]
- Mukhopadhyay, B.; Cinar, R.; Yin, S.; Liu, J.; Tam, J.; Godlewski, G.; Harvey-White, J.; Mordi, I.; Cravatt, B.F.; Lotersztajn, S.; et al. Hyperactivation of anandamide synthesis and regulation of cell-cycle progression via cannabinoid type 1 (CB1) receptors in the regenerating liver. Proc. Natl. Acad. Sci. USA 2011, 108, 6323–6328. [Google Scholar] [CrossRef] [PubMed]
- Mukhopadhyay, B.; Liu, J.; Osei-Hyiaman, D.; Godlewski, G.; Mukhopadhyay, P.; Wang, L.; Jeong, W.I.; Gao, B.; Duester, G.; Mackie, K.; et al. Transcriptional regulation of cannabinoid receptor-1 expression in the liver by retinoic acid acting via retinoic acid receptor-gamma. J. Biol. Chem. 2010, 285, 19002–19011. [Google Scholar] [CrossRef] [PubMed]
- Mukhopadhyay, B.; Schuebel, K.; Mukhopadhyay, P.; Cinar, R.; Godlewski, G.; Xiong, K.; Mackie, K.; Lizak, M.; Yuan, Q.; Goldman, D.; et al. Cannabinoid receptor 1 promotes hepatocellular carcinoma initiation and progression through multiple mechanisms. Hepatology 2015, 61, 1615–1626. [Google Scholar] [CrossRef]
- Reece, A.S.; Hulse, G.K. Cannabis Could be the Missing Environmental Pancreatic Carcinogen Hiding in Plain View. Gastroenterology, 2023; in press. [Google Scholar]
- WebDigitizer. Available online: https://automeris.io/WebPlotDigitizer/ (accessed on 20 January 2023).
- Wickham, H.; Averick, M.; Bryan, J.; Chang, W.; McGowan, L.D.; Francios, R.; Groelmund, G.; Hayes, A.; Henry, L.; Hester, J.; et al. Welcome to the Tidyverse. J. Open. Source Softw. 2019, 4, 1686–1691. [Google Scholar] [CrossRef]
- ggpubr: ‘ggplot2’ Based Publication Ready Plots. Available online: https://CRAN.R-project.org/package=ggpubr (accessed on 20 January 2023).
- Patchwork: The Composer of Plots_, R Package Version 1.1.2 CRAN. Available online: https://CRAN.R-project.org/package=patchwork (accessed on 20 January 2023).
- Broom.Mixed: Tidying Methods for Mixed Models. Available online: http://github.com/bbolker/broom.mixed (accessed on 20 January 2023).
- Broom: Convert Statistical Objects into Tidy Tibbles. Available online: https://CRAN.R-project.org/package=broom (accessed on 20 January 2023).
- VanderWeele, T.J.; Ding, P. Sensitivity Analysis in Observational Research: Introducing the E-Value. Ann. Intern. Med. 2017, 167, 268–274. [Google Scholar] [CrossRef]
- VanderWeele, T.J.; Martin, J.N.; Mathur, M.B. E-values and incidence density sampling. Epidemiology 2020, 31, e51–e52. [Google Scholar] [CrossRef]
- VanderWeele, T.J.; Ding, P.; Mathur, M. Technical Considerations in the Use of the E-Value. J. Causal Inference 2019, 7, 1–11. [Google Scholar] [CrossRef]
- R Package “Corrplot”: Visualization of a Correlation Matrix. Available online: https://github.com/taiyun/corrplot (accessed on 20 January 2023).
- Gaddam, S.; Abboud, Y.; Oh, J.; Samaan, J.S.; Nissen, N.N.; Lu, S.C.; Lo, S.K. Incidence of Pancreatic Cancer by Age and Sex in the US, 2000–2018. Jama 2021, 326, 2075–2077. [Google Scholar] [CrossRef]
- National Survey of Drug Use and Health (NSDUH 2018). Available online: https://www.datafiles.samhsa.gov/study/national-survey-drug-use-and-health-nsduh-2018-nid18757# (accessed on 20 January 2023).
- Vela, G.; Martin, S.; Garcia-Gil, L.; Crespo, J.A.; Ruiz-Gayo, M.; Fernandez-Ruiz, J.J.; Garcia-Lecumberri, C.; Pelaprat, D.; Fuentes, J.A.; Ramos, J.A.; et al. Maternal exposure to delta9-tetrahydrocannabinol facilitates morphine self-administration behavior and changes regional binding to central mu opioid receptors in adult offspring female rats. Brain Res. 1998, 807, 101–109. [Google Scholar] [CrossRef]
- Shoyama, Y.; Sugawa, C.; Tanaka, H.; Morimoto, S. Cannabinoids act as necrosis-inducing factors in Cannabis sativa. Plant. Signal. Behav. 2008, 3, 1111–1112. [Google Scholar] [CrossRef]
- Koller, V.J.; Auwarter, V.; Grummt, T.; Moosmann, B.; Misik, M.; Knasmuller, S. Investigation of the In Vitro toxicological properties of the synthetic cannabimimetic drug CP-47,497-C8. Toxicol. Appl. Pharmacol. 2014, 277, 164–171. [Google Scholar] [CrossRef] [PubMed]
- Koller, V.J.; Ferk, F.; Al-Serori, H.; Misik, M.; Nersesyan, A.; Auwarter, V.; Grummt, T.; Knasmuller, S. Genotoxic properties of representatives of alkylindazoles and aminoalkyl-indoles which are consumed as synthetic cannabinoids. Food Chem. Toxicol. 2015, 80, 130–136. [Google Scholar] [CrossRef] [PubMed]
- Fish, E.W.; Murdaugh, L.B.; Zhang, C.; Boschen, K.E.; Boa-Amponsem, O.; Mendoza-Romero, H.N.; Tarpley, M.; Chdid, L.; Mukhopadhyay, S.; Cole, G.J.; et al. Cannabinoids Exacerbate Alcohol Teratogenesis by a CB1-Hedgehog Interaction. Sci. Rep. 2019, 9, 16057–16075. [Google Scholar] [CrossRef]
- Hölzel, B.N.; Pfannkuche, K.; Allner, B.; Allner, H.T.; Hescheler, J.; Derichsweiler, D.; Hollert, H.; Schiwy, A.; Brendt, J.; Schaffeld, M.; et al. Following the adverse outcome pathway from micronucleus to cancer using H2B-eGFP transgenic healthy stem cells. Arch. Toxicol. 2020, 94, 3265–3280. [Google Scholar] [CrossRef]
- Tahir, S.K.; Zimmerman, A.M. Influence of marihuana on cellular structures and biochemical activities. Pharmacol. Biochem. Behav. 1991, 40, 617–623. [Google Scholar] [CrossRef]
- Sarafian, T.A.; Kouyoumjian, S.; Khoshaghideh, F.; Tashkin, D.P.; Roth, M.D. Delta 9-tetrahydrocannabinol disrupts mitochondrial function and cell energetics. Am. J. Physiol. 2003, 284, L298–L306. [Google Scholar] [CrossRef]
- Sarafian, T.A.; Habib, N.; Oldham, M.; Seeram, N.; Lee, R.P.; Lin, L.; Tashkin, D.P.; Roth, M.D. Inhaled marijuana smoke disrupts mitochondrial energetics in pulmonary epithelial cells In Vivo. Am. J. Physiol. 2006, 290, L1202–L1209. [Google Scholar] [CrossRef]
- Morimoto, S.; Tanaka, Y.; Sasaki, K.; Tanaka, H.; Fukamizu, T.; Shoyama, Y.; Shoyama, Y.; Taura, F. Identification and characterization of cannabinoids that induce cell death through mitochondrial permeability transition in Cannabis leaf cells. J. Biol. Chem. 2007, 282, 20739–20751. [Google Scholar] [CrossRef]
- Fisar, Z.; Singh, N.; Hroudova, J. Cannabinoid-induced changes in respiration of brain mitochondria. Toxicol. Lett. 2014, 231, 62–71. [Google Scholar] [CrossRef]
- Singh, N.; Hroudova, J.; Fisar, Z. Cannabinoid-Induced Changes in the Activity of Electron Transport Chain Complexes of Brain Mitochondria. J. Mol. Neurosci. 2015, 56, 926–931. [Google Scholar] [CrossRef]
- Pearl, J.; Mackenzie, D. The Book of Why: The New Science of Cause and Effect; Basic Books: New York, NY, USA, 2018; Volume 1. [Google Scholar]
- Reece, A.S.; Hulse, G.K. Novel Insights into Potential Cannabis-Related Cancerogenesis from Recent Key Whole Epigenome Screen of Cannabis Dependence and Withdrawal: Epidemiological Comment and Explication of Schrott et.al. Genes 2022, 14, 32. [Google Scholar] [CrossRef]
- Wang, J.; Yuan, W.; Li, M.D. Genes and pathways co-associated with the exposure to multiple drugs of abuse, including alcohol, amphetamine/methamphetamine, cocaine, marijuana, morphine, and/or nicotine: A review of proteomics analyses. Mol. Neurobiol. 2011, 44, 269–286. [Google Scholar] [CrossRef]
- de Pagter, M.S.; van Roosmalen, M.J.; Baas, A.F.; Renkens, I.; Duran, K.J.; van Binsbergen, E.; Tavakoli-Yaraki, M.; Hochstenbach, R.; van der Veken, L.T.; Cuppen, E.; et al. Chromothripsis in healthy individuals affects multiple protein-coding genes and can result in severe congenital abnormalities in offspring. Am. J. Hum. Genet. 2015, 96, 651–656. [Google Scholar] [CrossRef]
- Forment, J.V.; Kaidi, A.; Jackson, S.P. Chromothripsis and cancer: Causes and consequences of chromosome shattering. Nat. Rev. Cancer 2012, 12, 663–670. [Google Scholar] [CrossRef]
- Kloosterman, W.P.; Guryev, V.; van Roosmalen, M.; Duran, K.J.; de Bruijn, E.; Bakker, S.C.; Letteboer, T.; van Nesselrooij, B.; Hochstenbach, R.; Poot, M.; et al. Chromothripsis as a mechanism driving complex de novo structural rearrangements in the germline. Hum. Mol. Genet. 2011, 20, 1916–1924. [Google Scholar] [CrossRef]
- Kloosterman, W.P.; Hoogstraat, M.; Paling, O.; Tavakoli-Yaraki, M.; Renkens, I.; Vermaat, J.S.; van Roosmalen, M.J.; van Lieshout, S.; Nijman, I.J.; Roessingh, W.; et al. Chromothripsis is a common mechanism driving genomic rearrangements in primary and metastatic colorectal cancer. Genome Biol. 2011, 12, R103. [Google Scholar] [CrossRef]
- Liu, S.; Kwon, M.; Mannino, M.; Yang, N.; Renda, F.; Khodjakov, A.; Pellman, D. Nuclear envelope assembly defects link mitotic errors to chromothripsis. Nature 2018, 561, 551–555. [Google Scholar] [CrossRef]
- Shoshani, O.; Brunner, S.F.; Yaeger, R.; Ly, P.; Nechemia-Arbely, Y.; Kim, D.H.; Fang, R.; Castillon, G.A.; Yu, M.; Li, J.S.Z.; et al. Chromothripsis drives the evolution of gene amplification in cancer. Nature 2021, 591, 137–141. [Google Scholar] [CrossRef]
- Terradas, M.; Martín, M.; Genescà, A. Detection of Impaired DNA Replication and Repair in Micronuclei as Indicators of Genomic Instability and Chromothripsis. Methods Mol. Biol. 2018, 1769, 197–208. [Google Scholar] [CrossRef]
- Waldron, D. Genome stability: Chromothripsis and micronucleus formation. Nat. Rev. Genet. 2015, 16, 376–377. [Google Scholar] [CrossRef]
- Zhang, C.Z.; Spektor, A.; Cornils, H.; Francis, J.M.; Jackson, E.K.; Liu, S.; Meyerson, M.; Pellman, D. Chromothripsis from DNA damage in micronuclei. Nature 2015, 522, 179–184. [Google Scholar] [CrossRef] [PubMed]
- Mackenzie, K.J.; Carroll, P.; Martin, C.A.; Murina, O.; Fluteau, A.; Simpson, D.J.; Olova, N.; Sutcliffe, H.; Rainger, J.K.; Leitch, A.; et al. cGAS surveillance of micronuclei links genome instability to innate immunity. Nature 2017, 548, 461–465. [Google Scholar] [CrossRef] [PubMed]
- Zhang, C.; Shang, G.; Gui, X.; Zhang, X.; Bai, X.C.; Chen, Z.J. Structural basis of STING binding with and phosphorylation by TBK1. Nature 2019, 567, 394–398. [Google Scholar] [CrossRef] [PubMed]
- Zhang, X.; Bai, X.C.; Chen, Z.J. Structures and Mechanisms in the cGAS-STING Innate Immunity Pathway. Immunity 2020, 53, 43–53. [Google Scholar] [CrossRef] [PubMed]
- Domizio, J.D.; Gulen, M.F.; Saidoune, F.; Thacker, V.V.; Yatim, A.; Sharma, K.; Nass, T.; Guenova, E.; Schaller, M.; Conrad, C.; et al. The cGAS-STING pathway drives type I IFN immunopathology in COVID-19. Nature 2022, 603, 145–151. [Google Scholar] [CrossRef]
- Hong, C.; Schubert, M.; Tijhuis, A.E.; Requesens, M.; Roorda, M.; van den Brink, A.; Ruiz, L.A.; Bakker, P.L.; van der Sluis, T.; Pieters, W.; et al. cGAS-STING drives the IL-6-dependent survival of chromosomally instable cancers. Nature 2022, 607, 366–373. [Google Scholar] [CrossRef]
- Li, S.; Mirlekar, B.; Johnson, B.M.; Brickey, W.J.; Wrobel, J.A.; Yang, N.; Song, D.; Entwistle, S.; Tan, X.; Deng, M.; et al. STING-induced regulatory B cells compromise NK function in cancer immunity. Nature 2022, 610, 373–380. [Google Scholar] [CrossRef]
- Tang, F.; Xu, D.; Wang, S.; Wong, C.K.; Martinez-Fundichely, A.; Lee, C.J.; Cohen, S.; Park, J.; Hill, C.E.; Eng, K.; et al. Chromatin profiles classify castration-resistant prostate cancers suggesting therapeutic targets. Science 2022, 376, eabe1505. [Google Scholar] [CrossRef]
- Wan, D.; Jiang, W.; Hao, J. Research Advances in How the cGAS-STING Pathway Controls the Cellular Inflammatory Response. Front. Immunol. 2020, 11, 615. [Google Scholar] [CrossRef]
- Xiao, T.S.; Fitzgerald, K.A. The cGAS-STING pathway for DNA sensing. Mol. Cell 2013, 51, 135–139. [Google Scholar] [CrossRef]
- Yang, H.; Wang, H.; Ren, J.; Chen, Q.; Chen, Z.J. cGAS is essential for cellular senescence. Proc. Natl. Acad. Sci. USA 2017, 114, E4612–E4620. [Google Scholar] [CrossRef] [PubMed]
- Gluck, S.; Guey, B.; Gulen, M.F.; Wolter, K.; Kang, T.W.; Schmacke, N.A.; Bridgeman, A.; Rehwinkel, J.; Zender, L.; Ablasser, A. Innate immune sensing of cytosolic chromatin fragments through cGAS promotes senescence. Nat. Cell Biol. 2017, 19, 1061–1070. [Google Scholar] [CrossRef] [PubMed]
- Sladitschek-Martens, H.L.; Guarnieri, A.; Brumana, G.; Zanconato, F.; Battilana, G.; Xiccato, R.L.; Panciera, T.; Forcato, M.; Bicciato, S.; Guzzardo, V.; et al. YAP/TAZ activity in stromal cells prevents ageing by controlling cGAS-STING. Nature 2022, 607, 790–798. [Google Scholar] [CrossRef]
- Dou, Z.; Ghosh, K.; Vizioli, M.G.; Zhu, J.; Sen, P.; Wangensteen, K.J.; Simithy, J.; Lan, Y.; Lin, Y.; Zhou, Z.; et al. Cytoplasmic chromatin triggers inflammation in senescence and cancer. Nature 2017, 550, 402–406. [Google Scholar] [CrossRef] [PubMed]
- Wang, T.W.; Johmura, Y.; Suzuki, N.; Omori, S.; Migita, T.; Yamaguchi, K.; Hatakeyama, S.; Yamazaki, S.; Shimizu, E.; Imoto, S.; et al. Blocking PD-L1-PD-1 improves senescence surveillance and ageing phenotypes. Nature 2022, 611, 358–364. [Google Scholar] [CrossRef] [PubMed]
- Olivieri, F.; Bonafe, M.; Giovagnetti, S.; Stecconi, R.; Cardelli, M.; Cavallone, L.; Spazzafumo, L.; Marchegiani, F.; Carrieri, G.; Mugianesi, E.; et al. In Vitro IL-6 production by EBV-immortalized B lymphocytes from young and elderly people genotyped for -174 C/G polymorphism in IL-6 gene: A model to study the genetic basis of inflamm-aging. Mech. Ageing Dev. 2003, 124, 549–553. [Google Scholar] [CrossRef]
- Salvioli, S.; Capri, M.; Valensin, S.; Tieri, P.; Monti, D.; Ottaviani, E.; Franceschi, C. Inflamm-aging, cytokines and aging: State of the art, new hypotheses on the role of mitochondria and new perspectives from systems biology. Curr. Pharm. Des. 2006, 12, 3161–3171. [Google Scholar] [CrossRef]
- Chazaud, B.; Mouchiroud, G. Inflamm-aging: STAT3 signaling pushes muscle stem cells off balance. Cell Stem Cell 2014, 15, 401–402. [Google Scholar] [CrossRef]
- Morrisette-Thomas, V.; Cohen, A.A.; Fulop, T.; Riesco, E.; Legault, V.; Li, Q.; Milot, E.; Dusseault-Belanger, F.; Ferrucci, L. Inflamm-aging does not simply reflect increases in pro-inflammatory markers. Mech. Ageing Dev. 2014, 139, 49–57. [Google Scholar] [CrossRef]
- Kovtonyuk, L.V.; Fritsch, K.; Feng, X.; Manz, M.G.; Takizawa, H. Inflamm-Aging of Hematopoiesis, Hematopoietic Stem Cells, and the Bone Marrow Microenvironment. Front. Immunol. 2016, 7, 502. [Google Scholar] [CrossRef]
- Pangrazzi, L.; Meryk, A.; Naismith, E.; Koziel, R.; Lair, J.; Krismer, M.; Trieb, K.; Grubeck-Loebenstein, B. “Inflamm-aging” influences immune cell survival factors in human bone marrow. Eur. J. Immunol. 2016, 47, 481–492. [Google Scholar] [CrossRef] [PubMed]
- Bakhoum, S.F.; Ngo, B.; Laughney, A.M.; Cavallo, J.A.; Murphy, C.J.; Ly, P.; Shah, P.; Sriram, R.K.; Watkins, T.B.K.; Taunk, N.K.; et al. Chromosomal instability drives metastasis through a cytosolic DNA response. Nature 2018, 553, 467–472. [Google Scholar] [CrossRef] [PubMed]
- Donald, P.J. Marijuana smoking--possible cause of head and neck carcinoma in young patients. Otolaryngol. Head. Neck Surg. 1986, 94, 517–521. [Google Scholar] [CrossRef] [PubMed]
- Graef, S.; Choo, C.G.; Warfield, A.; Cullen, M.; Woolhouse, I. Small cell lung cancer in a 26-year-old man with significant Cannabis exposure. J. Thorac. Oncol. 2011, 6, 218–219. [Google Scholar] [CrossRef]
- Kothadia, J.P.; Chhabra, S.; Marcus, A.; May, M.; Saraiya, B.; Jabbour, S.K. Anterior mediastinal mass in a young marijuana smoker: A rare case of small-cell lung cancer. Case Rep. Med. 2012, 2012, 754231. [Google Scholar] [CrossRef]
- Van Hoozen, B.E.; Cross, C.E. Marijuana. Respiratory tract effects. Clin. Rev. Allergy Immunol. 1997, 15, 243–269. [Google Scholar] [CrossRef]
- Cabral, G.A.; Raborn, E.S.; Griffin, L.; Dennis, J.; Marciano-Cabral, F. CB(2) receptors in the brain: Role in central immune function. Br. J. Pharm. 2008, 153, 240–251. [Google Scholar] [CrossRef]
- De Meij, J.; Alfanek, Z.; Morel, L.; Decoeur, F.; Leyrolle, Q.; Picard, K.; Carrier, M.; Aubert, A.; Séré, A.; Lucas, C.; et al. Microglial Cannabinoid Type 1 Receptor Regulates Brain Inflammation in a Sex-Specific Manner. Cannabis Cannabinoid Res. 2021, 6, 488–507. [Google Scholar] [CrossRef]
- Ge, Q.; Maury, E.; Rycken, L.; Gerard, J.; Noel, L.; Detry, R.; Navez, B.; Brichard, S.M. Endocannabinoids regulate adipokine production and the immune balance of omental adipose tissue in human obesity. Int. J. Obes. 2013, 37, 874–880. [Google Scholar] [CrossRef]
- Mandolesi, G.; Bullitta, S.; Fresegna, D.; Gentile, A.; De Vito, F.; Dolcetti, E.; Rizzo, F.R.; Strimpakos, G.; Centonze, D.; Musella, A. Interferon-gamma causes mood abnormalities by altering cannabinoid CB1 receptor function in the mouse striatum. Neurobiol. Dis. 2017, 108, 45–53. [Google Scholar] [CrossRef]
- Pacher, P.; Steffens, S.; Hasko, G.; Schindler, T.H.; Kunos, G. Cardiovascular effects of marijuana and synthetic cannabinoids: The good, the bad, and the ugly. Nat. Rev. Cardiol. 2018, 15, 151–166. [Google Scholar] [CrossRef] [PubMed]
- Vujic, N.; Schlager, S.; Eichmann, T.O.; Madreiter-Sokolowski, C.T.; Goeritzer, M.; Rainer, S.; Schauer, S.; Rosenberger, A.; Woelfler, A.; Doddapattar, P.; et al. Monoglyceride lipase deficiency modulates endocannabinoid signaling and improves plaque stability in ApoE-knockout mice. Atherosclerosis 2016, 244, 9–21. [Google Scholar] [CrossRef] [PubMed]
- Mon, M.J.; Jansing, R.L.; Doggett, S.; Stein, J.L.; Stein, G.S. Influence of delta9-tetrahydrocannabinol on cell proliferation and macromolecular biosynthesis in human cells. Biochem. Pharmacol. 1978, 27, 1759–1765. [Google Scholar] [CrossRef] [PubMed]
- Mon, M.J.; Haas, A.E.; Stein, J.L.; Stein, G.S. Influence of psychoactive and nonpsychoactive cannabinoids on cell proliferation and macromolecular biosynthesis in human cells. Biochem. Pharmacol. 1981, 30, 31–43. [Google Scholar] [CrossRef] [PubMed]
- Mon, M.J.; Haas, A.E.; Stein, J.L.; Stein, G.S. Influence of psychoactive and nonpsychoactive cannabinoids on chromatin structure and function in human cells. Biochem. Pharmacol. 1981, 30, 45–58. [Google Scholar] [CrossRef]
- Blevins, R.D.; Regan, J.D. delta-9-Tetrahydrocannabinol: Effect on macromolecular synthesis in human and other mammalian cells. Arch. Toxicol. 1976, 35, 127–135. [Google Scholar] [CrossRef]
- McClean, D.K.; Zimmerman, A.M. Action of delta 9-tetrahydrocannabinol on cell division and macromolecular synthesis in division-synchronized protozoa. Pharmacology 1976, 14, 307–321. [Google Scholar] [CrossRef]
- Costa, B.; Colleoni, M. Changes in rat brain energetic metabolism after exposure to anandamide or Delta(9)-tetrahydrocannabinol. Eur. J. Pharmacol. 2000, 395, 1–7. [Google Scholar] [CrossRef]
- Rossato, M.; Ion Popa, F.; Ferigo, M.; Clari, G.; Foresta, C. Human sperm express cannabinoid receptor Cb1, the activation of which inhibits motility, acrosome reaction, and mitochondrial function. J. Clin. Endocrinol. Metab. 2005, 90, 984–991. [Google Scholar] [CrossRef]
- Badawy, Z.S.; Chohan, K.R.; Whyte, D.A.; Penefsky, H.S.; Brown, O.M.; Souid, A.K. Cannabinoids inhibit the respiration of human sperm. Fertil. Steril. 2009, 91, 2471–2476. [Google Scholar] [CrossRef]
- Volkow, N.D.; Baler, R.D.; Compton, W.M.; Weiss, S.R. Adverse Health Effects of Marijuana Use. N. Engl. J. Med. 2014, 371, 878–879. [Google Scholar] [CrossRef] [PubMed]
- Wolff, V.; Rouyer, O.; Schlagowski, A.; Zoll, J.; Raul, J.S.; Marescaux, C. Study of the effect of THC on mitochondrial respiration of the rat brain. Rev. Neurol. Neurol. Rev. 2014, 170, A19–A20. [Google Scholar] [CrossRef]
- Wolff, V.; Schlagowski, A.I.; Rouyer, O.; Charles, A.L.; Singh, F.; Auger, C.; Schini-Kerth, V.; Marescaux, C.; Raul, J.S.; Zoll, J.; et al. Tetrahydrocannabinol induces brain mitochondrial respiratory chain dysfunction and increases oxidative stress: A potential mechanism involved in cannabis-related stroke. Biomed. Res. Int. 2015, 2015, 323706. [Google Scholar] [CrossRef] [PubMed]
- Rupprecht, A.; Theisen, U.; Wendt, F.; Frank, M.; Hinz, B. The Combination of Δ(9)-Tetrahydrocannabinol and Cannabidiol Suppresses Mitochondrial Respiration of Human Glioblastoma Cells via Downregulation of Specific Respiratory Chain Proteins. Cancers 2022, 14, 3129. [Google Scholar] [CrossRef] [PubMed]
- Alasmari, F.; Assiri, M.A.; Ahamad, S.R.; Aljumayi, S.R.; Alotaibi, W.H.; Alhamdan, M.M.; Alhazzani, K.; Alharbi, M.; Alqahtani, F.; Alasmari, A.F. Serum Metabolomic Analysis of Male Patients with Cannabis or Amphetamine Use Disorder. Metabolites 2022, 12, 179. [Google Scholar] [CrossRef]
- Jimenez-Blasco, D.; Busquets-Garcia, A.; Hebert-Chatelain, E.; Serrat, R.; Vicente-Gutierrez, C.; Ioannidou, C.; Gómez-Sotres, P.; Lopez-Fabuel, I.; Resch-Beusher, M.; Resel, E.; et al. Glucose metabolism links astroglial mitochondria to cannabinoid effects. Nature 2020, 583, 603–608. [Google Scholar] [CrossRef]
- Magistretti, P.J. How lactate links cannabis to social behaviour. Nature 2020, 583, 526–527. [Google Scholar] [CrossRef]
- Zhou, X.; Zhang, N.; Zhang, J.; Gu, Q.; Dong, C.; Lin, B.; Zou, C. Microbiome and fermentation parameters in the rumen of dairy buffalo in response to ingestion associated with a diet supplemented with cysteamine and hemp seed oil. J. Anim. Physiol. Anim. Nutr. 2022, 106, 471–484. [Google Scholar] [CrossRef]
- Papadakis, D.P.; Michael, C.M.; Kephalas, T.A.; Miras, C.J. Effects of cannabis smoking in blood lactic acid and glucose in humans. Experientia 1974, 30, 1183–1184. [Google Scholar] [CrossRef]
- Li, X.; Yang, Y.; Zhang, B.; Lin, X.; Fu, X.; An, Y.; Zou, Y.; Wang, J.-X.; Wang, Z.; Yu, T. Lactate metabolism in human health and disease. Signal. Transduct. Target. Ther. 2022, 7, 305. [Google Scholar] [CrossRef]
- Yang, Z.; Yan, C.; Ma, J.; Peng, P.; Ren, X.; Cai, S.; Shen, X.; Wu, Y.; Zhang, S.; Wang, X.; et al. Lactylome analysis suggests lactylation-dependent mechanisms of metabolic adaptation in hepatocellular carcinoma. Nat. Metab. 2023, 5, 61–79. [Google Scholar] [CrossRef] [PubMed]
- Flores, A.; Schell, J.; Krall, A.S.; Jelinek, D.; Miranda, M.; Grigorian, M.; Braas, D.; White, A.C.; Zhou, J.L.; Graham, N.A.; et al. Lactate dehydrogenase activity drives hair follicle stem cell activation. Nat. Cell Biol. 2017, 19, 1017–1026. [Google Scholar] [CrossRef] [PubMed]
- Martin, L.J.; Cairns, E.A.; Heblinski, M.; Fletcher, C.; Krycer, J.R.; Arnold, J.C.; McGregor, I.S.; Bowen, M.T.; Anderson, L.L. Cannabichromene and Δ(9)-Tetrahydrocannabinolic Acid Identified as Lactate Dehydrogenase-A Inhibitors by In Silico and In Vitro Screening. J. Nat. Prod. 2021, 84, 1469–1477. [Google Scholar] [CrossRef] [PubMed]
- Stern, M. Evidence that a mitochondrial death spiral underlies antagonistic pleiotropy. Aging Cell 2017, 16, 435–443. [Google Scholar] [CrossRef] [PubMed]
- Goto, M. Inflammaging (inflammation + aging): A driving force for human aging based on an evolutionarily antagonistic pleiotropy theory? Biosci. Trends 2008, 2, 218–230. [Google Scholar]
- Lauc, G.; Huffman, J.E.; Pucic, M.; Zgaga, L.; Adamczyk, B.; Muzinic, A.; Novokmet, M.; Polasek, O.; Gornik, O.; Kristic, J.; et al. Loci associated with N-glycosylation of human immunoglobulin G show pleiotropy with autoimmune diseases and haematological cancers. PLoS Genet. 2013, 9, e1003225. [Google Scholar] [CrossRef]
- Waddington, C.H. Organizers and Genes; Cambridge University Press: Cambridge, UK, 1940; Volume 1. [Google Scholar]
- Andreeva, L.; Hiller, B.; Kostrewa, D.; Lassig, C.; de Oliveira Mann, C.C.; Jan Drexler, D.; Maiser, A.; Gaidt, M.; Leonhardt, H.; Hornung, V.; et al. cGAS senses long and HMGB/TFAM-bound U-turn DNA by forming protein-DNA ladders. Nature 2017, 549, 394–398. [Google Scholar] [CrossRef]
- Luecke, S.; Holleufer, A.; Christensen, M.H.; Jønsson, K.L.; Boni, G.A.; Sørensen, L.K.; Johannsen, M.; Jakobsen, M.R.; Hartmann, R.; Paludan, S.R. cGAS is activated by DNA in a length-dependent manner. EMBO Rep. 2017, 18, 1707–1715. [Google Scholar] [CrossRef]
- Ablasser, A.; Chen, Z.J. cGAS in action: Expanding roles in immunity and inflammation. Science 2019, 363, eaat8657. [Google Scholar] [CrossRef]
- Xia, P.; Wang, S.; Gao, P.; Gao, G.; Fan, Z. DNA sensor cGAS-mediated immune recognition. Protein Cell 2016, 7, 777–791. [Google Scholar] [CrossRef]
- Gumbs, A.A.; Gogol, M.; Spolverato, G.; Taher, H.; Chouillard, E.K. Systematic Review of the Integrative Medicine Recommendations for Patients with Pancreatic Cancer. Surgeries 2021, 2, 216–230. [Google Scholar] [CrossRef]
- Reece, A.S. Cannabinoid Epigenotoxicity and Genotoxicity. JAMA 2022, E3. [Google Scholar] [CrossRef]
- Reece, A.S.; Hulse, G.K. Extending the “Paracentral Dogma” of biology with the metabolome: Implications for understanding genomic-glycomic-metabolic-epigenomic synchronization. Engineering, 2022; in press. [Google Scholar] [CrossRef]
- Reece, A.S.; Hulse, G.K. Impacts of cannabinoid epigenetics on human development: Reflections on Murphy et al. ‘cannabinoid exposure and altered DNA methylation in rat and human sperm’ epigenetics 2018; 13: 1208–1221. Epigenetics 2019, 14, 1041–1056. [Google Scholar] [CrossRef]
- Reece, A.S.; Hulse, G.K. Epidemiology of Cannabis: Genotoxicity, Neurotoxicity, Epigenomics and Aging; Elsevier: New York, NY, USA, 2023; Volume 1. [Google Scholar]
- Reece, A.S.; Hulse, G.K. Cannabis, Cannabidiol, Cannabinoids and Multigenerational Policy. Engineering, 2022; in press. [Google Scholar] [CrossRef]


| Covariate | PDAC.Rate | HOP | Tobacco | Alcohol | Cannabis |
|---|---|---|---|---|---|
| Males, White | |||||
| PDAC.Rate | 1 | 0.8225 | −0.7732 | −0.2712 | 0.8308 |
| HOP | 0.8225 | 1 | −0.6628 | −0.3257 | 0.7015 |
| Tobacco | −0.7732 | −0.6628 | 1 | 0.7601 | −0.3816 |
| Alcohol | −0.2712 | −0.3257 | 0.7601 | 1 | 0.1657 |
| Cannabis | 0.8308 | 0.7015 | −0.3816 | 0.1657 | 1 |
| Males, Black | |||||
| PDAC.Rate | 1 | 0.8225 | −0.6820 | −0.2524 | 0.8312 |
| HOP | 0.8225 | 1 | −0.4851 | −0.2569 | 0.6359 |
| Tobacco | −0.6820 | −0.4851 | 1 | 0.5705 | −0.3691 |
| Alcohol | −0.2524 | −0.2569 | 0.5705 | 1 | 0.0738 |
| Cannabis | 0.8312 | 0.6359 | −0.3691 | 0.0738 | 1 |
| Males, Hispanic | |||||
| PDAC.Rate | 1 | 0.8225 | −0.8191 | 0.1464 | 0.8980 |
| HOP | 0.8225 | 1 | −0.7125 | 0.1052 | 0.7840 |
| Tobacco | −0.8191 | −0.7125 | 1 | 0.2834 | −0.6757 |
| Alcohol | 0.1464 | 0.1052 | 0.2834 | 1 | 0.3221 |
| Cannabis | 0.8980 | 0.7840 | −0.6757 | 0.3221 | 1 |
| Females, White | |||||
| PDAC.Rate | 1 | 0.9350 | −0.8865 | 0.3475 | 0.9309 |
| HOP | 0.9350 | 1 | −0.8052 | 0.4427 | 0.9040 |
| Tobacco | −0.8865 | −0.8052 | 1 | 0.0211 | −0.7555 |
| Alcohol | 0.3475 | 0.4427 | 0.0211 | 1 | 0.5538 |
| Cannabis | 0.9309 | 0.9040 | −0.7555 | 0.5538 | 1 |
| Females, Black | |||||
| PDAC.Rate | 1 | 0.9350 | −0.3878 | 0.4460 | 0.8539 |
| HOP | 0.9350 | 1 | −0.2896 | 0.5253 | 0.8421 |
| Tobacco | −0.3878 | −0.2896 | 1 | 0.3687 | −0.1939 |
| Alcohol | 0.4460 | 0.5253 | 0.3687 | 1 | 0.5877 |
| Cannabis | 0.8539 | 0.8421 | −0.1939 | 0.5877 | 1 |
| Females, Hispanic | |||||
| PDAC.Rate | 1 | 0.9350 | −0.8151 | 0.6311 | 0.8982 |
| HOP | 0.9350 | 1 | −0.7138 | 0.6912 | 0.9133 |
| Tobacco | −0.8151 | −0.7138 | 1 | −0.4312 | −0.6870 |
| Alcohol | 0.6311 | 0.6912 | −0.4312 | 1 | 0.7699 |
| Cannabis | 0.8982 | 0.9133 | −0.6870 | 0.7699 | 1 |
| Covariate | PDAC.Rate | HOP | Tobacco | Alcohol | Cannabis |
|---|---|---|---|---|---|
| Males, White | |||||
| PDAC.Rate | 0 | 0.0029 | 0.0023 | 0.0439 | 0.0063 |
| HOP | 0.0029 | 0 | 0.0015 | 0.0210 | 0.0229 |
| Tobacco | 0.0023 | 0.0015 | 0 | 0.0115 | 0.0303 |
| Alcohol | 0.0439 | 0.0210 | 0.0115 | 0 | 0.1369 |
| Cannabis | 0.0063 | 0.0229 | 0.0303 | 0.1369 | 0 |
| Males, Black | |||||
| PDAC.Rate | 0 | 0.0052 | 0.0002 | 0.0607 | 0.0068 |
| HOP | 0.0052 | 0 | 0.0041 | 0.0304 | 0.0376 |
| Tobacco | 0.0002 | 0.0041 | 0 | 0.0553 | 0.0139 |
| Alcohol | 0.0607 | 0.0304 | 0.0553 | 0 | 0.1487 |
| Cannabis | 0.0068 | 0.0376 | 0.0139 | 0.1487 | 0 |
| Males, Hispanic | |||||
| PDAC.Rate | 0 | 0.0028 | 0.0014 | 0.6334 | 0.0009 |
| HOP | 0.0028 | 0 | 0.0021 | 0.5626 | 0.0068 |
| Tobacco | 0.0014 | 0.0021 | 0 | 0.4703 | 0.0073 |
| Alcohol | 0.6334 | 0.5626 | 0.4703 | 0 | 0.7493 |
| Cannabis | 0.0009 | 0.0068 | 0.0073 | 0.7493 | 0 |
| Females, White | |||||
| PDAC.Rate | 0 | 0.0002 | 0.0010 | 0.4540 | 0.0008 |
| HOP | 0.0002 | 0 | 0.0028 | 0.4089 | 0.0005 |
| Tobacco | 0.0010 | 0.0028 | 0 | 0.6000 | 0.0068 |
| Alcohol | 0.4540 | 0.4089 | 0.6000 | 0 | 0.3435 |
| Cannabis | 0.0008 | 0.0005 | 0.0068 | 0.3435 | 0 |
| Females, Black | |||||
| PDAC.Rate | 0 | 0.0003 | 0.0013 | 0.8324 | 0.0051 |
| HOP | 0.0003 | 0 | 0.0038 | 0.7778 | 0.0056 |
| Tobacco | 0.0013 | 0.0038 | 0 | 0.9841 | 0.0147 |
| Alcohol | 0.8324 | 0.7778 | 0.9841 | 0 | 0.6839 |
| Cannabis | 0.0051 | 0.0056 | 0.0147 | 0.6839 | 0 |
| Females, Hispanic | |||||
| PDAC.Rate | 0 | 0.0001 | 0.0000 | 0.0344 | 0.0008 |
| HOP | 0.0001 | 0 | 0.0002 | 0.0280 | 0.0005 |
| Tobacco | 0.0000 | 0.0002 | 0 | 0.0351 | 0.0010 |
| Alcohol | 0.0344 | 0.0280 | 0.0351 | 0 | 0.0166 |
| Cannabis | 0.0008 | 0.0005 | 0.0010 | 0.0166 | 0 |
| Subs | Race | Sex | β-Estimate (S.E.) | p-Value | P.Adj.Holm | P.Adj.FDR | E-Value Estimate | E-Value Lower Bound |
|---|---|---|---|---|---|---|---|---|
| Cannabis | White | Female | 29.05 (22.7, 35.4) | 7.00 × 10⁻⁸ | 1.19 × 10⁻⁶ | 6.30 × 10⁻⁷ | 3.46 × 1053 | 8.41 × 1041 |
| Cannabis | Hispanic | Female | 32.1 (24.45, 39.75) | 2.50 × 10⁻⁷ | 4.00 × 10⁻⁶ | 1.50 × 10⁻⁶ | 1.32 × 1055 | 1.20 × 1042 |
| Cannabis | Black | Female | 19.67 (13.71, 25.63) | 5.80 × 10⁻⁶ | 6.96 × 10⁻⁵ | 1.49 × 10⁻⁵ | 2.04 × 1028 | 6.88 × 10¹⁹ |
| Alcohol | Hispanic | Female | 6.28 (2.62, 9.94) | 0.0037 | 0.0296 | 0.0060 | 3.19 × 10⁶ | 785.71 |
| Alcohol | Black | Female | 4.76 (0.84, 8.68) | 0.0292 | 0.1750 | 0.0404 | 3.26 × 10⁴ | 10.81 |
| Alcohol | White | Female | 6.01 (−0.36, 12.37) | 0.0817 | 0.4087 | 0.1051 | 2.20 × 10⁵ | 1.00 |
| Tobacco | Black | Female | −6.67 (−16.72, 3.38) | 0.2107 | 0.8428 | 0.2529 | 4.53 × 10⁵ | - |
| Tobacco | Hispanic | Female | −12.6 (−17.52, −7.69) | 1.04 × 10⁻⁴ | 1.04 × 10⁻³ | 2.08 × 10⁻⁴ | 3.27 × 10¹⁵ | - |
| Tobacco | White | Female | −8.37 (−10.83, −5.91) | 3.97 × 10⁻⁶ | 5.16 × 10⁻⁵ | 1.19 × 10⁻⁵ | 3.02 × 10¹² | - |
| Cannabis | Hispanic | Male | 15.44 (12.28, 18.6) | 3.00 × 10⁻⁸ | 5.40 × 10⁻⁷ | 5.40 × 10⁻⁷ | 2.97 × 1038 | 4.73 × 1030 |
| Cannabis | White | Male | 14.66 (10.68, 18.64) | 1.43 × 10⁻⁶ | 2.15 × 10⁻⁵ | 6.44 × 10⁻⁶ | 1.64 × 1029 | 2.42 × 10²¹ |
| Cannabis | Black | Male | 11.35 (8.05, 14.64) | 3.43 × 10⁻⁶ | 4.80 × 10⁻⁵ | 1.19 × 10⁻⁵ | 3.74 × 10²¹ | 2.53 × 10¹⁵ |
| Alcohol | Hispanic | Male | 2.57 (−2.55, 7.7) | 0.3389 | 1.0000 | 0.3813 | 770.9897 | 1.00 |
| Alcohol | Black | Male | −1.09 (−4.91, 2.73) | 0.5838 | 1.0000 | 0.5838 | 23.24 | - |
| Alcohol | White | Male | −1.82 (−6.48, 2.83) | 0.4530 | 1.0000 | 0.4797 | 129.86 | - |
| Tobacco | Black | Male | −6.21 (−9.93, −2.49) | 0.0045 | 0.0315 | 0.0067 | 1.14 × 10⁸ | - |
| Tobacco | White | Male | −4.83 (−7.1, −2.56) | 6.47 × 10⁻⁴ | 0.0058 | 0.0012 | 1.02 × 10⁷ | - |
| Tobacco | Hispanic | Male | −6.51 (−8.83, −4.2) | 3.72 × 10⁻⁵ | 0.0004 | 8.36 × 10⁻⁵ | 8.94 × 10¹⁰ | - |
| Substance | Race | Sex | β-Estimate (S.E.) | p-Value | P.Adj.Holm | P.Adj.FDR | E-Value Estimate | E-Value Lower Bound |
|---|---|---|---|---|---|---|---|---|
| Cannabis | Hispanic | Female | 24.47 (18.25, 30.69) | 6.00 × 10⁻⁷ | 1.08 × 10⁻⁵ | 1.08 × 10⁻⁵ | 5.10 × 1051 | 4.63 × 1038 |
| Cannabis | White | Female | 21.48 (15.68, 27.29) | 1.34 × 10⁻⁶ | 2.28 × 10⁻⁵ | 1.21 × 10⁻⁵ | 2.41 × 1043 | 5.86 × 1031 |
| Cannabis | Black | Female | 14.69 (9.72, 19.66) | 2.15 × 10⁻⁵ | 0.0003 | 0.0001 | 2.56 × 1025 | 8.62 × 10¹⁶ |
| Alcohol | Hispanic | Female | 5.16 (2.46, 7.86) | 0.0016 | 0.0179 | 0.0037 | 1.59 × 10⁷ | 3.91 × 10³ |
| Alcohol | Black | Female | 4.23 (1.36, 7.09) | 0.0101 | 0.0707 | 0.0152 | 2.61 × 10⁵ | 90.28 |
| Alcohol | White | Female | 5.73 (1.07, 10.38) | 0.0275 | 0.1648 | 0.0380 | 7.45 × 10⁶ | 34.35 |
| Tobacco | Black | Female | −3.32 (−11.31, 4.67) | 0.4267 | 0.9056 | 0.4518 | 4.51 × 10³ | - |
| Tobacco | Hispanic | Female | −8.13 (−12.71, −3.56) | 0.0028 | 0.0254 | 0.0051 | 7.14 × 10¹⁰ | - |
| Tobacco | White | Female | −5.64 (−8.06, −3.22) | 2.76 × 10⁻⁴ | 0.0039 | 0.0010 | 4.34 × 10⁸ | - |
| Cannabis | Hispanic | Male | 7.06 (4.35, 9.77) | 8.74 × 10⁻⁵ | 0.0013 | 0.0004 | 4.62 × 10²⁰ | 7.36 × 10¹² |
| Cannabis | White | Male | 6.37 (3.28, 9.47) | 8.60 × 10⁻⁴ | 0.0103 | 0.0022 | 2.84 × 10¹⁶ | 4.20 × 10⁸ |
| Cannabis | Black | Male | 4.49 (1.84, 7.15) | 0.0041 | 0.0330 | 0.0067 | 5.60 × 10¹⁰ | 3.79 × 10⁴ |
| Alcohol | Hispanic | Male | 0.56 (−2.27, 3.39) | 0.7032 | 0.9056 | 0.7032 | 20.3545 | 1.00 |
| Alcohol | Black | Male | −1.09 (−3.11, 0.92) | 0.3019 | 0.9056 | 0.3396 | 223.3997 | - |
| Alcohol | White | Male | −1.79 (−4.2, 0.62) | 0.1645 | 0.6580 | 0.1974 | 5.40 × 10³ | - |
| Tobacco | Black | Male | −2.61 (−4.85, −0.36) | 0.0361 | 0.1805 | 0.0464 | 4.95 × 10⁵ | - |
| Tobacco | White | Male | −2.42 (−3.73, −1.11) | 0.0021 | 0.0211 | 0.0042 | 1.35 × 10⁶ | - |
| Tobacco | Hispanic | Male | −3.23 (−4.64, −1.82) | 3.28 × 10⁻⁴ | 0.0043 | 0.0010 | 8.74 × 10⁸ | - |
| Race | Sex | Substance | β-Estimate (S.E.) | p-Value | P.Adj.Holm | P.Adj.FDR | E-Value Estimate | E-Value Lower Bound |
|---|---|---|---|---|---|---|---|---|
| Black | Female | Cannabis | 18.17 (7.87, 28.46) | 0.0038 | 0.0461 | 0.0099 | 5.59 × 1025 | 2.27 × 10¹¹ |
| Black | Female | Alcohol | 1.36 (−2.59, 5.31) | 0.5105 | 1 | 0.5743 | 1.60 × 10² | 1.00 |
| Black | Female | Tobacco | −5.37 (−12.79, 2.04) | 0.1775 | 0.8876 | 0.2282 | 6.77 × 10⁷ | - |
| Hispanic | Female | Cannabis | 27.84 (13.14, 42.54) | 0.0023 | 0.0325 | 0.0084 | 4.81 × 1050 | 1.34 × 1024 |
| Hispanic | Female | Alcohol | −0.77 (−3.99, 2.44) | 0.6443 | 1.0000 | 0.6822 | 4.99 × 101 | - |
| Hispanic | Female | Tobacco | −4.95 (−9.64, −0.27) | 0.0572 | 0.5147 | 0.1029 | 1.85 × 10⁹ | - |
| White | Female | Cannabis | 14.28 (−1.19, 29.76) | 0.0919 | 0.7350 | 0.1393 | 9.44 × 1037 | 1.00 |
| White | Female | Alcohol | 2.71 (−1.74, 7.17) | 0.2523 | 1 | 0.3028 | 2.88 × 10⁷ | 1.00 |
| White | Female | Tobacco | −5.99 (−9.58, −2.39) | 0.0057 | 0.0624 | 0.0128 | 1.23 × 10¹⁶ | - |
| Black | Male | Cannabis | 9.63 (6.34, 12.91) | 5.14 × 10⁻⁵ | 9.24 × 10⁻⁴ | 4.63 × 10⁻⁴ | 4.20 × 10²¹ | 2.26 × 10¹⁴ |
| Black | Male | Alcohol | 0.11 (−2.17, 2.39) | 0.9284 | 1 | 0.9284 | 2.83 × 100 | 1.00 |
| Black | Male | Tobacco | −3.96 (−7.09, −0.84) | 0.0262 | 0.2617 | 0.0523 | 1.19 × 10⁹ | - |
| Hispanic | Male | Cannabis | 8.97 (4.05, 13.89) | 0.0031 | 0.0399 | 0.0092 | 1.33 × 1031 | 1.75 × 10¹⁴ |
| Hispanic | Male | Alcohol | 2.16 (−0.28, 4.6) | 0.1047 | 0.7350 | 0.1449 | 5.25 × 10⁷ | 1.00 |
| Hispanic | Male | Tobacco | −4.38 (−6.53, −2.23) | 0.0013 | 0.0202 | 0.0060 | 2.24 × 10¹⁵ | - |
| White | Male | Cannabis | 9.9 (6.52, 13.29) | 0.0001 | 0.0009 | 0.0005 | 2.84 × 1038 | 2.80 × 1025 |
| White | Male | Alcohol | 2.65 (−0.23, 5.53) | 0.0929 | 0.73497576 | 0.1393 | 3.23 × 10¹⁰ | 1.00 |
| White | Male | Tobacco | −5.18 (−7.37, −2.99) | 3.81 × 10⁻⁴ | 0.0060976 | 0.0023 | 1.83 × 10²⁰ | - |
| Race | Sex | ß-Estimate (S.E.) | p-Value | P.Adj.Holm | P.Adj.FDR | E-Value Estimate | E-Value Lower Bound |
|---|---|---|---|---|---|---|---|
| Black | Female | 37.76 (25.24, 50.28) | 2.19 × 10⁻⁵ | 6.57 × 10⁻⁵ | 3.29 × 10⁻⁵ | 1.60 × 1054 | 2.33 × 1036 |
| Hispanic | Female | 61.97 (45.04, 78.9) | 2.21 × 10⁻⁶ | 8.84 × 10⁻⁶ | 4.42 × 10⁻⁶ | 1.26 × 10102 | 2.20 × 1074 |
| White | Female | 48.15 (37.05, 59.26) | 2.50 × 10⁻⁷ | 1.50 × 10⁻⁶ | 1.41 × 10⁻⁶ | 5.70 × 1090 | 8.62 × 1069 |
| Black | Male | 17.46 (10.63, 24.29) | 1.28 × 10⁻⁴ | 2.56 × 10⁻⁴ | 1.38 × 10⁻⁴ | 8.62 × 1028 | 5.71178 × 10¹⁷ |
| Hispanic | Male | 25.9 (19.63, 32.17) | 4.70 × 10⁻⁷ | 2.35 × 10⁻⁶ | 1.41 × 10⁻⁶ | 1.38 × 1060 | 4.84 × 1045 |
| White | Male | 18.26 (11.07, 25.46) | 1.38 × 10⁻⁴ | 2.56 × 10⁻⁴ | 1.38 × 10⁻⁴ | 1.32 × 1030 | 2.48 × 10¹⁸ |
| Race | Sex | ß-Estimate (S.E.) | p-Value | P.Adj.Holm | P.Adj.FDR | E-Value Estimate | E-Value Lower Bound |
|---|---|---|---|---|---|---|---|
| Black | Female | 27.2 (18.43, 35.98) | 1.24 × 10⁻⁵ | 4.94 × 10⁻⁵ | 2.47 × 10⁻⁵ | 1.98 × 1048 | 6.99 × 1032 |
| Hispanic | Female | 46.53 (34.52, 58.54) | 7.40 × 10⁻⁷ | 4.44 × 10⁻⁶ | 3.09 × 10⁻⁶ | 7.76 × 1096 | 1.02 × 1072 |
| White | Female | 32.85 (24.15, 41.54) | 1.03 × 10⁻⁶ | 5.15 × 10⁻⁶ | 3.09 × 10⁻⁶ | 1.59 × 1067 | 3.41 × 1049 |
| Black | Male | 6.94 (1.77, 12.11) | 0.0174 | 0.0174 | 0.0174 | 1.67 × 10¹⁵ | 1.37 × 10⁴ |
| Hispanic | Male | 11.95 (7.33, 16.57) | 9.42 × 10⁻⁵ | 2.83 × 10⁻⁴ | 1.41 × 10⁻⁴ | 4.26 × 1034 | 2.46 × 10²¹ |
| White | Male | 8.14 (3.28, 12.99) | 0.0044 | 0.0087 | 0.0052 | 1.44 × 10¹⁹ | 8.63 × 10⁷ |
Disclaimer/Publisher’s Note: The statements, opinions and data contained in all publications are solely those of the individual author(s) and contributor(s) and not of MDPI and/or the editor(s). MDPI and/or the editor(s) disclaim responsibility for any injury to people or property resulting from any ideas, methods, instructions or products referred to in the content. |
© 2023 by the authors. Licensee MDPI, Basel, Switzerland. This article is an open access article distributed under the terms and conditions of the Creative Commons Attribution (CC BY) license (https://creativecommons.org/licenses/by/4.0/).
Share and Cite
Reece, A.S.; Hulse, G.K. Sociodemographically Stratified Exploration of Pancreatic Cancer Incidence in Younger US Patients: Implication of Cannabis Exposure as a Risk Factor. Gastroenterol. Insights 2023, 14, 204-235. https://doi.org/10.3390/gastroent14020016
Reece AS, Hulse GK. Sociodemographically Stratified Exploration of Pancreatic Cancer Incidence in Younger US Patients: Implication of Cannabis Exposure as a Risk Factor. Gastroenterology Insights. 2023; 14(2):204-235. https://doi.org/10.3390/gastroent14020016
Chicago/Turabian StyleReece, Albert Stuart, and Gary Kenneth Hulse. 2023. "Sociodemographically Stratified Exploration of Pancreatic Cancer Incidence in Younger US Patients: Implication of Cannabis Exposure as a Risk Factor" Gastroenterology Insights 14, no. 2: 204-235. https://doi.org/10.3390/gastroent14020016