
Gut Health and Its Association with Wellbeing and Nutrient Intake in Community-Dwelling Older Adults
 , , ,
, , ,  ,
,
Abstract
:1. Introduction
2. Materials and Methods
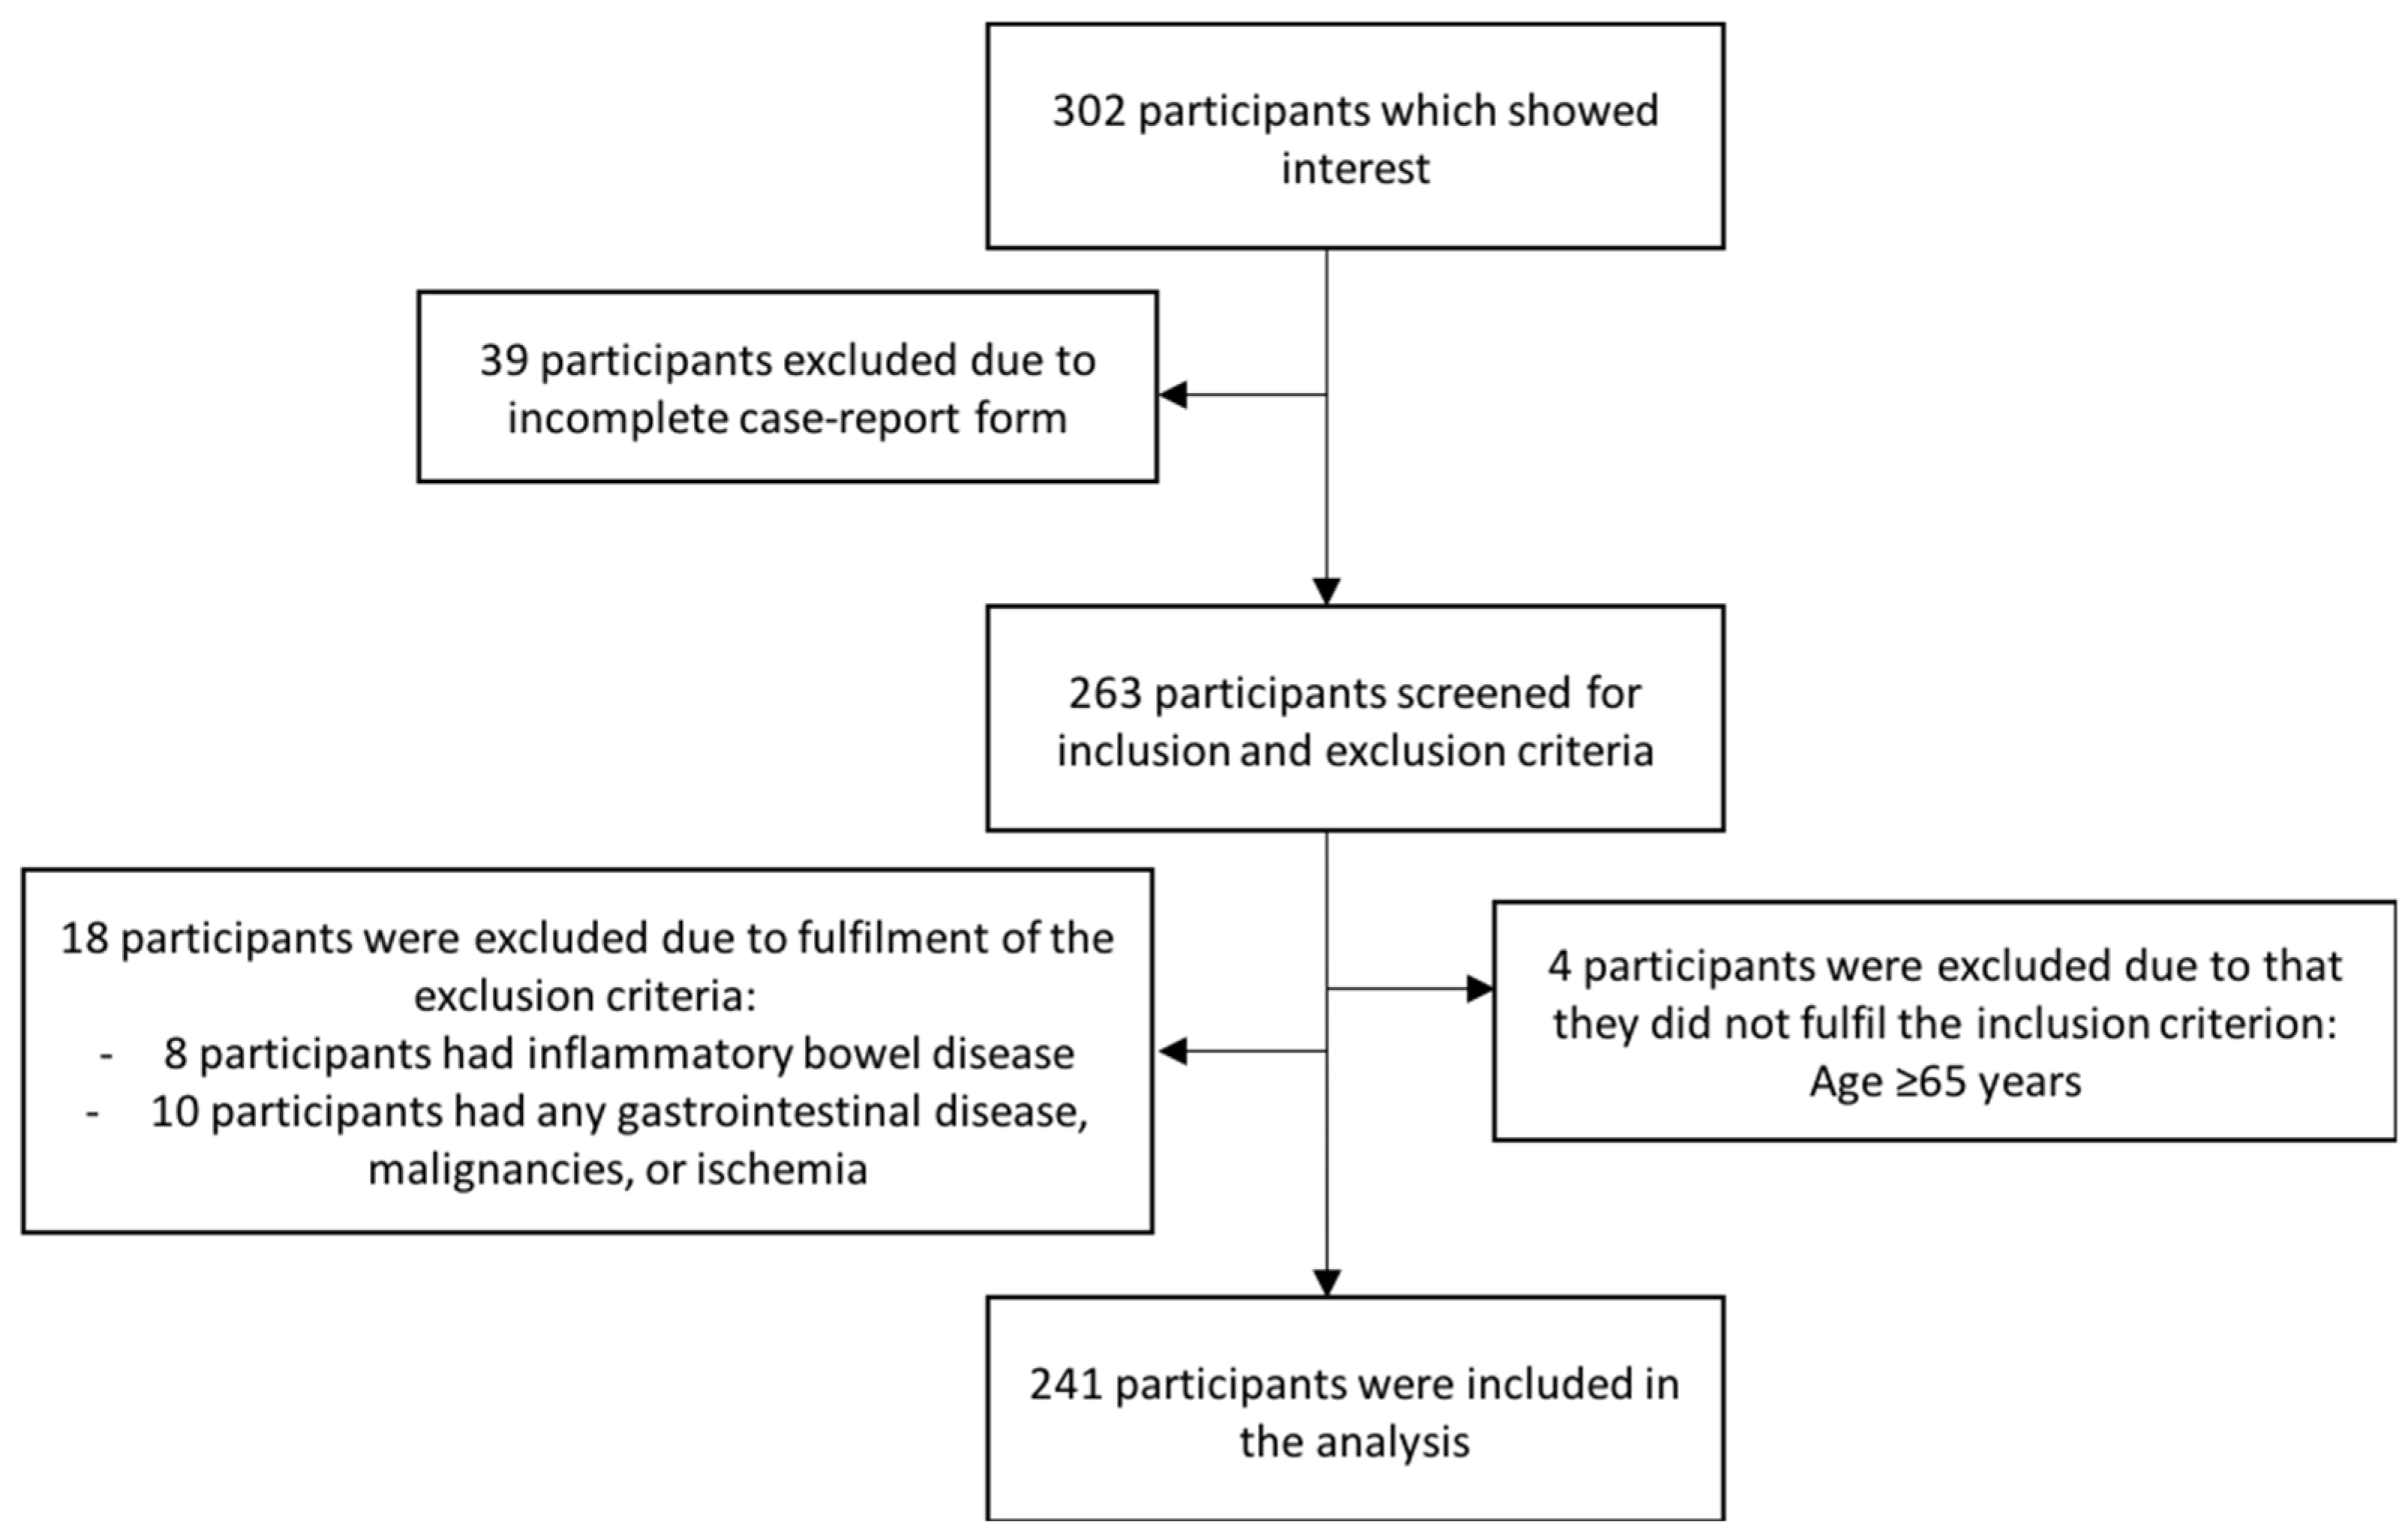
2.1. Study Participants
2.2. Data Collection
2.2.1. Gastrointestinal Symptoms
2.2.2. Wellbeing
2.2.3. Nutrient Intake
2.3. Data Analysis and Statistics
3. Results
3.1. Demographic Data
3.2. Gastrointestinal Symptoms
3.3. Nutrient Intake
3.4. Wellbeing
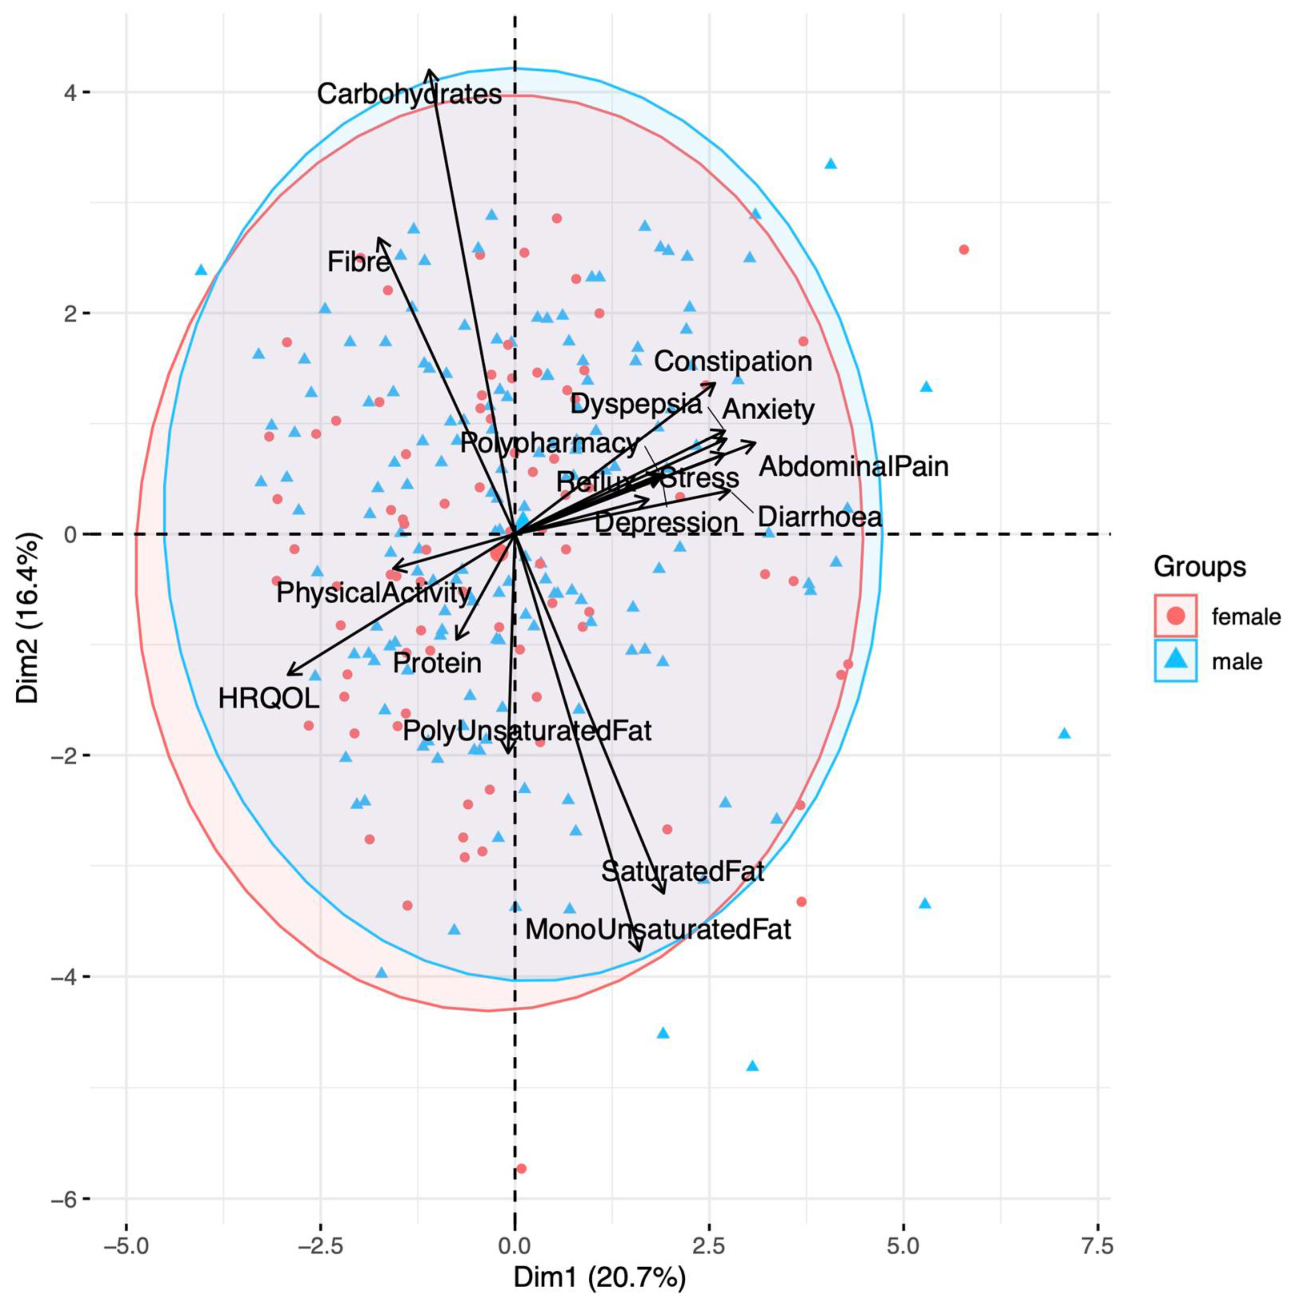
3.5. Correlations
4. Discussion
5. Conclusions
Supplementary Materials
Author Contributions
Funding
Institutional Review Board Statement
Informed Consent Statement
Data Availability Statement
Conflicts of Interest
References
- World Health Organisation. Active ageing: A policy framework. Aging Male 2002, 5, 1–37. [Google Scholar] [CrossRef]
- Cohen, J.E. Human population: The next half century. Science 2003, 302, 1172–1175. [Google Scholar] [CrossRef] [PubMed]
- Algilani, S.; Östlund-Lagerström, L.; Schoultz, I.; Brummer, R.J.; Kihlgren, A. Increasing the qualitative understanding of optimal functionality in older adults: A focus group based study. BMC Geriatr. 2016, 16, 70. [Google Scholar] [CrossRef] [PubMed] [Green Version]
- Algilani, S.; Ostlund-Lagerstrom, L.; Kihlgren, A.; Blomberg, K.; Brummer, R.J.; Schoultz, I. Exploring the concept of optimal functionality in old age. J. Multidiscip. Healthc. 2014, 7, 69–79. [Google Scholar] [CrossRef] [PubMed] [Green Version]
- Knowles, S.R.; Graff, L.A.; Wilding, H.; Hewitt, C.; Keefer, L.; Mikocka-Walus, A. Quality of Life in Inflammatory Bowel Disease: A Systematic Review and Meta-analyses-Part I. Inflamm. Bowel. Dis. 2018, 24, 742–751. [Google Scholar] [CrossRef]
- El-Serag, H.B.; Olden, K.; Bjorkman, D. Health-related quality of life among persons with irritable bowel syndrome: A systematic review. Aliment. Pharmacol. Ther. 2002, 16, 1171–1185. [Google Scholar] [CrossRef]
- Ganda Mall, J.-P.; Östlund-Lagerström, L.; Lindqvist, C.M.; Algilani, S.; Rasoal, D.; Repsilber, D.; Brummer, R.J.; Keita, Å.V.; Schoultz, I. Are self-reported gastrointestinal symptoms among older adults associated with increased intestinal permeability and psychological distress? BMC Geriatr. 2018, 18, 75. [Google Scholar] [CrossRef] [Green Version]
- Britton, E.; McLaughlin, J.T. Ageing and the gut. Proc. Nutr. Soc. 2013, 72, 173–177. [Google Scholar] [CrossRef] [Green Version]
- Soenen, S.; Rayner, C.K.; Jones, K.L.; Horowitz, M. The ageing gastrointestinal tract. Curr. Opin. Clin. Nutr. Metab. Care 2016, 19, 12–18. [Google Scholar] [CrossRef]
- Tran, L.; Greenwood-Van Meerveld, B. In a non-human primate model, aging disrupts the neural control of intestinal smooth muscle contractility in a region-specific manner. Neurogastroenterol. Motil. 2014, 26, 410–418. [Google Scholar] [CrossRef]
- Roberts, S.B.; Rosenberg, I. Nutrition and aging: Changes in the regulation of energy metabolism with aging. Physiol. Rev. 2006, 86, 651–667. [Google Scholar] [CrossRef] [PubMed]
- Ganda Mall, J.P.; Löfvendahl, L.; Lindqvist, C.M.; Brummer, R.J.; Keita, Å.V.; Schoultz, I. Differential effects of dietary fibres on colonic barrier function in elderly individuals with gastrointestinal symptoms. Sci. Rep. 2018, 8, 13404. [Google Scholar] [CrossRef] [PubMed] [Green Version]
- Claesson, M.J.; Jeffery, I.B.; Conde, S.; Power, S.E.; O’Connor, E.M.; Cusack, S.; Harris, H.M.; Coakley, M.; Lakshminarayanan, B.; O’Sullivan, O.; et al. Gut microbiota composition correlates with diet and health in the elderly. Nature 2012, 488, 178–184. [Google Scholar] [CrossRef] [PubMed]
- Mitsou, E.K.; Kakali, A.; Antonopoulou, S.; Mountzouris, K.C.; Yannakoulia, M.; Panagiotakos, D.B.; Kyriacou, A. Adherence to the Mediterranean diet is associated with the gut microbiota pattern and gastrointestinal characteristics in an adult population. Br. J. Nutr. 2017, 117, 1645–1655. [Google Scholar] [CrossRef] [Green Version]
- Lewis, J.D.; Abreu, M.T. Diet as a Trigger or Therapy for Inflammatory Bowel Diseases. Gastroenterology 2017, 152, 398–414.e396. [Google Scholar] [CrossRef]
- Chan, M.M.H.; Zarate-Lopez, N.; Martin, L. Group education on the low FODMAP diet improves gastrointestinal symptoms but neither anxiety or depression in irritable bowel syndrome. J. Hum. Nutr. Diet. 2021, 35, 425–434. [Google Scholar] [CrossRef]
- Ostlund-Lagerstrom, L.; Kihlgren, A.; Repsilber, D.; Bjorksten, B.; Brummer, R.J.; Schoultz, I. Probiotic administration among free-living older adults: A double blinded, randomized, placebo-controlled clinical trial. Nutr. J. 2016, 15, 80. [Google Scholar] [CrossRef] [Green Version]
- Hutchinson, A.N.; Bergh, C.; Kruger, K.; Sűsserová, M.; Allen, J.; Améen, S.; Tingö, L. The Effect of Probiotics on Health Outcomes in the Elderly: A Systematic Review of Randomized, Placebo-Controlled Studies. Microorganisms 2021, 9, 1344. [Google Scholar] [CrossRef]
- Ganda Mall, J.P.; Fart, F.; Sabet, J.A.; Lindqvist, C.M.; Nestestog, R.; Hegge, F.T.; Keita, Å.V.; Brummer, R.J.; Schoultz, I. Effects of Dietary Fibres on Acute Indomethacin-Induced Intestinal Hyperpermeability in the Elderly: A Randomised Placebo Controlled Parallel Clinical Trial. Nutrients 2020, 12, 1954. [Google Scholar] [CrossRef]
- Talley, N.J.; O’Keefe, E.A.; Zinsmeister, A.R.; Melton, L.J., 3rd. Prevalence of gastrointestinal symptoms in the elderly: A population-based study. Gastroenterology 1992, 102, 895–901. [Google Scholar] [CrossRef]
- Frändin, K.; Grimby, G. Assessment of physical activity, fitness and performance in 76-year-olds. Scand. J. Med. Sci. Sports 1994, 4, 41–46. [Google Scholar] [CrossRef]
- Svedlund, J.; Sjodin, I.; Dotevall, G. GSRS—A clinical rating scale for gastrointestinal symptoms in patients with irritable bowel syndrome and peptic ulcer disease. Dig. Dis. Sci. 1988, 33, 129–134. [Google Scholar] [CrossRef] [PubMed]
- Rabin, R.; de Charro, F. EQ-5D: A measure of health status from the EuroQol Group. Ann. Med. 2001, 33, 337–343. [Google Scholar] [CrossRef] [PubMed]
- Roberts, M.H.; Fletcher, R.B.; Merrick, P.L. The validity and clinical utility of the hospital anxiety and depression scale (HADS) with older adult New Zealanders. Int. Psychogeriatr. 2014, 26, 325–333. [Google Scholar] [CrossRef] [PubMed]
- Ezzati, A.; Jiang, J.; Katz, M.J.; Sliwinski, M.J.; Zimmerman, M.E.; Lipton, R.B. Validation of the Perceived Stress Scale in a community sample of older adults. Int. J. Geriatr. Psychiatry 2014, 29, 645–652. [Google Scholar] [CrossRef] [PubMed] [Green Version]
- Johansson, I.; Hallmans, G.; Wikman, A.; Biessy, C.; Riboli, E.; Kaaks, R. Validation and calibration of food-frequency questionnaire measurements in the Northern Sweden Health and Disease cohort. Public Health Nutr. 2002, 5, 487–496. [Google Scholar] [CrossRef] [PubMed]
- Nordic Council of Minsters. Nordic Nutrition Recommendations 2012: Integrating Nutrition and Physical Activity; Nordic Council of Minsters: Copenhagen, Denmark, 2014. [Google Scholar]
- Black, A.E. The sensitivity and specificity of the Goldberg cut-off for EI:BMR for identifying diet reports of poor validity. Eur. J. Clin. Nutr. 2000, 54, 395–404. [Google Scholar] [CrossRef] [PubMed] [Green Version]
- Escourrou, E.; Durrieu, F.; Chicoulaa, B.; Dupouy, J.; Oustric, S.; Andrieu, S.; Gardette, V. Cognitive, functional, physical, and nutritional status of the oldest old encountered in primary care: A systematic review. BMC Fam. Pract. 2020, 21, 58. [Google Scholar] [CrossRef]
- Kydd, A.; Fleming, A.; Gardner, S.; Hafford-Letchfield, T. Ageism in the Third Age. In Contemporary Perspectives on Ageism; Ayalon, L., Tesch-Römer, C., Eds.; Springer International Publishing: Cham, Switzerland, 2018; pp. 115–130. [Google Scholar]
- World Health Organization. Men, Ageing and Health: Achieving Health Across the Life Span; World Health Organization: Geneva, Switzerland, 2001. [Google Scholar]
- World Health Organization. World Report on Ageing and Health; World Health Organization: Geneva, Switzerland, 2015. [Google Scholar]
- Engelheart, S.; Akner, G. Dietary intake of energy, nutrients and water in elderly people living at home or in nursing home. J. Nutr. Health Aging 2015, 19, 265–272. [Google Scholar] [CrossRef]
- Ax, E.; Warensjö Lemming, E.; Becker, W.; Andersson, A.; Lindroos, A.K.; Cederholm, T.; Sjögren, P.; Fung, T.T. Dietary patterns in Swedish adults; results from a national dietary survey. Br. J. Nutr. 2016, 115, 95–104. [Google Scholar] [CrossRef]
- Kay, L.; Jorgensen, T.; Schultz-Larsen, K. Abdominal pain in a 70-year-old Danish population. An epidemiological study of the prevalence and importance of abdominal pain. J. Clin. Epidemiol. 1992, 45, 1377–1382. [Google Scholar] [CrossRef]
- Glia, A.; Lindberg, G. Quality of life in patients with different types of functional constipation. Scand. J. Gastroenterol. 1997, 32, 1083–1089. [Google Scholar] [CrossRef] [PubMed]
- Barkun, A.; Leontiadis, G. Systematic review of the symptom burden, quality of life impairment and costs associated with peptic ulcer disease. Am. J. Med. 2010, 123, 358–366.e352. [Google Scholar] [CrossRef] [PubMed]
- Mohammad, S.; Chandio, B.; Soomro, A.A.; Lakho, S.; Ali, Z.; Ali Soomro, Z.; Shaukat, F. Depression and Anxiety in Patients with Gastroesophageal Reflux Disorder With and Without Chest Pain. Cureus 2019, 11, e6103. [Google Scholar] [CrossRef] [Green Version]
- Choi, J.M.; Yang, J.I.; Kang, S.J.; Han, Y.M.; Lee, J.; Lee, C.; Chung, S.J.; Yoon, D.H.; Park, B.; Kim, Y.S. Association Between Anxiety and Depression and Gastroesophageal Reflux Disease: Results From a Large Cross-sectional Study. J. Neurogastroenterol. Motil. 2018, 24, 593–602. [Google Scholar] [CrossRef] [Green Version]
- van Kerkhoven, L.A.; Eikendal, T.; Laheij, R.J.; van Oijen, M.G.; Jansen, J.B. Gastrointestinal symptoms are still common in a general Western population. Neth. J. Med. 2008, 66, 18–22. [Google Scholar]
- Alameel, T.; Basheikh, M.; Andrew, M.K. Digestive symptoms in older adults: Prevalence and associations with institutionalization and mortality. Can. J. Gastroenterol. 2012, 26, 881–884. [Google Scholar] [CrossRef]
- Tielemans, M.M.; Jaspers Focks, J.; van Rossum, L.G.M.; Eikendal, T.; Jansen, J.B.M.J.; Laheij, R.J.F.; van Oijen, M.G.H. Gastrointestinal Symptoms are Still Prevalent and Negatively Impact Health-Related Quality of Life: A Large Cross-Sectional Population Based Study in The Netherlands. PLoS ONE 2013, 8, e69876. [Google Scholar] [CrossRef] [Green Version]
- Quigley, E.M.; Locke, G.R.; Mueller-Lissner, S.; Paulo, L.G.; Tytgat, G.N.; Helfrich, I.; Schaefer, E. Prevalence and management of abdominal cramping and pain: A multinational survey. Aliment. Pharmacol. Ther. 2006, 24, 411–419. [Google Scholar] [CrossRef]
- Peppas, G.; Alexiou, V.G.; Mourtzoukou, E.; Falagas, M.E. Epidemiology of constipation in Europe and Oceania: A systematic review. BMC Gastroenterol. 2008, 8, 5. [Google Scholar] [CrossRef] [Green Version]
- Dent, J.; El-Serag, H.B.; Wallander, M.A.; Johansson, S. Epidemiology of gastro-oesophageal reflux disease: A systematic review. Gut 2005, 54, 710–717. [Google Scholar] [CrossRef]
- El-Serag, H.B.; Talley, N.J. Systemic review: The prevalence and clinical course of functional dyspepsia. Aliment. Pharmacol. Ther. 2004, 19, 643–654. [Google Scholar] [CrossRef] [PubMed]
- Pilotto, A.; Franceschi, M.; Vitale, D.; Zaninelli, A.; Di Mario, F.; Seripa, D.; Rengo, F. The prevalence of diarrhea and its association with drug use in elderly outpatients: A multicenter study. Am. J. Gastroenterol. 2008, 103, 2816–2823. [Google Scholar] [CrossRef] [PubMed]
- Henchoz, Y.; Bula, C.; Guessous, I.; Rodondi, N.; Goy, R.; Demont, M.; Santos-Eggimann, B. Chronic symptoms in a representative sample of community-dwelling older people: A cross-sectional study in Switzerland. BMJ Open 2017, 7, e014485. [Google Scholar] [CrossRef] [PubMed] [Green Version]
- Suares, N.C.; Ford, A.C. Prevalence of, and risk factors for, chronic idiopathic constipation in the community: Systematic review and meta-analysis. Am. J. Gastroenterol. 2011, 106, 1582–1591, quiz 1581, 1592. [Google Scholar] [CrossRef]
- Kim, Y.; Je, Y.; Giovannucci, E.L. Association between dietary fat intake and mortality from all-causes, cardiovascular disease, and cancer: A systematic review and meta-analysis of prospective cohort studies. Clin. Nutr. 2021, 40, 1060–1070. [Google Scholar] [CrossRef]
- Ricci, C.; Baumgartner, J.; Zec, M.; Kruger, H.S.; Smuts, C.M. Type of dietary fat intakes in relation to all-cause and cause-specific mortality in US adults: An iso-energetic substitution analysis from the American National Health and Nutrition Examination Survey linked to the US mortality registry. Br. J. Nutr. 2018, 119, 456–463. [Google Scholar] [CrossRef] [Green Version]
- Yang, J.; Wang, H.P.; Zhou, L.; Xu, C.F. Effect of dietary fiber on constipation: A meta analysis. World J. Gastroenterol. 2012, 18, 7378–7383. [Google Scholar] [CrossRef]
- Ananthakrishnan, A.N.; Khalili, H.; Konijeti, G.G.; Higuchi, L.M.; de Silva, P.; Korzenik, J.R.; Fuchs, C.S.; Willett, W.C.; Richter, J.M.; Chan, A.T. A prospective study of long-term intake of dietary fiber and risk of Crohn’s disease and ulcerative colitis. Gastroenterology 2013, 145, 970–977. [Google Scholar] [CrossRef] [Green Version]
- Deutz, N.E.; Bauer, J.M.; Barazzoni, R.; Biolo, G.; Boirie, Y.; Bosy-Westphal, A.; Cederholm, T.; Cruz-Jentoft, A.; Krznaric, Z.; Nair, K.S.; et al. Protein intake and exercise for optimal muscle function with aging: Recommendations from the ESPEN Expert Group. Clin. Nutr. 2014, 33, 929–936. [Google Scholar] [CrossRef] [Green Version]
- Scott, D.; Blizzard, L.; Fell, J.; Giles, G.; Jones, G. Associations Between Dietary Nutrient Intake and Muscle Mass and Strength in Community-Dwelling Older Adults: The Tasmanian Older Adult Cohort Study. J. Am. Geriatr. Soc. 2010, 58, 2129–2134. [Google Scholar] [CrossRef]
- Bauer, J.; Biolo, G.; Cederholm, T.; Cesari, M.; Cruz-Jentoft, A.J.; Morley, J.E.; Phillips, S.; Sieber, C.; Stehle, P.; Teta, D.; et al. Evidence-based recommendations for optimal dietary protein intake in older people: A position paper from the PROT-AGE Study Group. J. Am. Med. Dir. Assoc. 2013, 14, 542–559. [Google Scholar] [CrossRef]
- Pesce, M.; Cargiolli, M.; Cassarano, S.; Polese, B.; De Conno, B.; Aurino, L.; Mancino, N.; Sarnelli, G. Diet and functional dyspepsia: Clinical correlates and therapeutic perspectives. World J. Gastroenterol. 2020, 26, 456–465. [Google Scholar] [CrossRef] [PubMed]
- Duncanson, K.R.; Talley, N.J.; Walker, M.M.; Burrows, T.L. Food and functional dyspepsia: A systematic review. J. Hum. Nutr. Diet. 2018, 31, 390–407. [Google Scholar] [CrossRef] [PubMed]
- Santos, P.R.; Silveira Monteiro, D.L.; de Paula, P.H.; Lopes Monte Neto, V.; Ponte Monte Coelho, M.L.; Costa Arcanjo, C.; Lopes Ponte Neto, F.; Lopes Lima, M.; Campos Arriaga, N.; Mendes Vieira Coêlho, L.; et al. Dyspepsia is Associated with Low Protein and Caloric Intake among End-Stage Renal Disease Patients. Int. J. Vitam. Nutr. Res. 2015, 85, 112–118. [Google Scholar] [CrossRef] [PubMed]
- Wu, P.; Zhao, X.H.; Ai, Z.S.; Sun, H.H.; Chen, Y.; Jiang, Y.X.; Tong, Y.L.; Xu, S.C. Dietary intake and risk for reflux esophagitis: A case-control study. Gastroenterol. Res.Pract. 2013, 2013, 691026. [Google Scholar] [CrossRef] [PubMed] [Green Version]
- Zenebe, Y.; Akele, B.; W/Selassie, M.; Necho, M. Prevalence and determinants of depression among old age: A systematic review and meta-analysis. Ann. Gen. Psychiatry 2021, 20, 55. [Google Scholar] [CrossRef]
- Girgus, J.S.; Yang, K.; Ferri, C.V. The Gender Difference in Depression: Are Elderly Women at Greater Risk for Depression Than Elderly Men? Geriatrics 2017, 2, 35. [Google Scholar] [CrossRef] [Green Version]
- Abrams, L.R.; Mehta, N.K. Changes in depressive symptoms over age among older Americans: Differences by gender, race/ethnicity, education, and birth cohort. SSM-Popul. Health 2019, 7, 100399. [Google Scholar] [CrossRef]
- Johansson, I.; Van Guelpen, B.; Hultdin, J.; Johansson, M.; Hallmans, G.; Stattin, P. Validity of food frequency questionnaire estimated intakes of folate and other B vitamins in a region without folic acid fortification. Eur. J. Clin. Nutr. 2010, 64, 905–913. [Google Scholar] [CrossRef] [Green Version]
- Shim, J.S.; Oh, K.; Kim, H.C. Dietary assessment methods in epidemiologic studies. Epidemiol. Health 2014, 36, e2014009. [Google Scholar] [CrossRef] [PubMed]


| Parameter | All Participants n = 241 | Males n = 82 | Females n = 159 | p-Value |
|---|---|---|---|---|
| Age | ||||
| Years, median (IQR) | 72 (69–76) | 72 (69–78) | 71 (69–75) | 0.227 |
| Have a live-in partner/married | ||||
| Yes % (n) | 56% (136) | 72% (59) | 48% (77) | 0.001 |
| Have higher education | ||||
| Yes % (n) | 42% (99) | 48% (38) | 39% (61) | 0.211 |
| Born in Sweden | ||||
| Yes % (n) | 95% (229) | 94% (77) | 96% (150) | 0.582 |
| Smoking | ||||
| Smokers % (n) | 5% (11) | 4% (3) | 5% (8) | 0.629 |
| Physical activity | ||||
| Score, median (IQR) | 3.5 (3.0–4.0) | 3.5 (3.0–4.0) | 3.5 (3.0–4.0) | 0.976 |
| Polypharmacy | ||||
| ≥5 medications % (n) | 16% (39) | 15% (12) | 17% (27) | 0.625 |
| Number of medicines | ||||
| Median (IQR) | 2.0 (1.0–4.0) | 2.0 (0.8–3.3) | 2.0 (1.0–4.0) | 0.299 |
| GI symptoms | ||||
| Score, median (IQR) | ||||
| Dyspepsia Constipation Abdominal pain Diarrhoea Reflux Total mean score Cut-off (>2), % (n) Dyspepsia Constipation Abdominal pain Diarrhoea Reflux Have a GI symptom | 2.0 (1.5–3.0) 1.7 (1.0–2.7) 1.3 (1.0–2.0) 1.3 (1.0–2.3) 1.0 (1.0–2.0) 1.7 (1.3–2.3) 47% (113) 31% (74) 23% (55) 26% (61) 15% (35) 65% (155) | 2.0 (1.3–2.6) 1.3 (1.0–2.0) 1.3 (1.0–1.7) 1.3 (1.0–2.2) 1.0 (1.0–1.8) 1.6 (1.2–2.2) 43% (35) 20% (16) 14% (11) 25% (20) 16% (13) 62% (50) | 2.0 (1.5–3.0) 1.7 (1.3–3.0) 1.7 (1.0–2.3) 1.3 (1.0–2.3) 1.0 (1.0–2.0) 1.8 (1.4–2.5) 49% (78) 37% (58) 28% (44) 26% (41) 14% (22) 67% (105) | 0.068 0.003 0.002 0.306 0.936 0.016 0.391 0.006 0.014 0.790 0.646 0.392 |
| Depression | ||||
| Score, median (IQR) Cut-off (>7), % (n) | 2 (1–3) 4% (9) | 2 (1–4) 9% (7) | 1 (1–3) 1% (2) | 0.059 0.004 |
| Anxiety | ||||
| Score, median (IQR) Cut-off (>7), % (n) | 3 (1–5) 10% (23) | 3 (1–5) 8% (6) | 3 (1–5) 11% (17) | 0.421 0.438 |
| Stress | ||||
| Score, median (IQR) | 10 (6–14) | 9 (6–13) | 10 (6–15) | 0.370 |
| Quality of life | ||||
| Median (IQR) | ||||
| EQ-index EQ-VAS | 0.8 (0.8–1.0) 80 (75–90) | 0.9 (0.8–1.0) 80 (75–90) | 0.8 (0.8–0.9) 80 (70–90) | 0.047 0.709 |
| Parameter | All Participants n = 241 | Younger Older Adults (Age 65–79) n = 202 | Oldest Old (Age ≥ 80) n = 39 | p-Value |
|---|---|---|---|---|
| Age | ||||
| Years, median (IQR) | 72 (69–76) | 70 (68–74) | 84 (81–89) | <0.001 |
| Sex | ||||
| Females, % (n) | 66% (159) | 68% (138) | 54% (21) | 0.081 |
| Have a live-in partner/married | ||||
| Yes % (n) | 56% (136) | 61% (124) | 31% (12) | 0.001 |
| Have higher education | ||||
| Yes % (n) | 42% (99) | 42% (82) | 46% (17) | 0.717 |
| Born in Sweden | ||||
| Yes % (n) | 95% (229) | 97% (195) | 87% (34) | 0.014 |
| Smoking | ||||
| Smokers % (n) | 5% (11) | 5% (10) | 3% (1) | 0.513 |
| Physical activity | ||||
| Score, median (IQR) | 3.5 (3.0–4.0) | 3.5 (3.0–4.0) | 3.0 (2.5–4.0) | 0.007 |
| Polypharmacy | ||||
| ≥5 medications, % (n) | 16% (39) | 11% (23) | 41% (16) | <0.001 |
| Number of medicines | ||||
| Median (IQR) | 2 (1–4) | 2 (1–3) | 4 (2–6) | <0.001 |
| GI symptoms | ||||
| Score, median (IQR) | ||||
| Dyspepsia Constipation Abdominal pain Diarrhoea Reflux Total mean score Cut-off (>2), % (n) Dyspepsia Constipation Abdominal pain Diarrhoea Reflux Have a GI symptom | 2.0 (1.5–3.0) 1.7 (1.0–2.7) 1.3 (1.0–2.0) 1.3 (1.0–2.3) 1.0 (1.0–2.0) 1.7 (1.3–2.3) 47% (113) 31% (74) 23% (55) 26% (61) 15% (35) 65% (155) | 2.0 (1.5–3.0) 1.7 (1.0–2.7) 1.3 (1.0–2.0) 1.3 (1.0–2.0) 1.0 (1.0–2.0) 1.7 (1.3–2.3) 48% (96) 29% (58) 23% (46) 23% (45) 14% (28) 64% (127) | 2.0 (1.3–3.0) 1.7 (1.3–3.8) 1.3 (1.0–2.1) 2.0 (1.3–3.0) 1.0 (1.0–1.6) 2.1 (1.5–2.4) 45% (17) 42% (16) 24% (9) 42% (16) 18% (7) 74% (28) | 0.952 0.062 0.331 0.009 0.678 0.110 0.752 0.114 0.902 0.012 0.465 0.241 |
| Depression | ||||
| Score, median (IQR) Cut-off (>7), % (n) | 2 (1–3) 4% (9) | 1 (1–3) 4% (7) | 2 (1–5) 6% (2) | 0.023 0.562 |
| Anxiety | ||||
| Score, median (IQR) Cut-off (>7), % (n) | 3 (1–5) 10% (23) | 3.0 (1–5) 10% (19) | 3 (1–6) 11% (4) | 0.748 0.779 |
| Stress | ||||
| Score, median (IQR) | 10 (6–14) | 9 (6–14) | 11 (8–15) | 0.100 |
| Quality of life | ||||
| Median (IQR) | ||||
| EQ-index EQ-VAS | 0.8 (0.8–1.0) 80 (75–90) | 0.9 (0.8–1.0) 85 (75–90) | 0.8 (0.7–0.9) 75 (60–85) | 0.001 0.001 |
| Macronutrient Intake | Recommended Intake * | All Participants n = 225 | Males n = 77 | Females n = 148 | p-Value |
|---|---|---|---|---|---|
| Total energy intake MJ/day (median, IQR) | Male: 6.1 Female: 5.0 | 5.6 (4.6–7.3) | 7.9 (6.1–9.8) | 4.9 (4.2–5.9) | <0.001 |
| Protein, E% E% (median, IQR) Below minimum recommendation, % (n) | 15–20 E% | 14.5 (12.8–16.4) 55% (120) | 13.6 (12.4–15.3) 70% (54) | 15.1 (13.3–16.8) 47% (70) | 0.001 0.001 |
| Fibre, g/MJ g/MJ (median, IQR) Below minimum recommendation, % (n) | >3 g/MJ | 2.8 (2.3–3.4) 57% (129) | 2.7 (2.1–3.2) 65% (46) | 3.0 (2.5–3.5) 53% (79) | 0.005 0.096 |
| Saturated fat, E% E% (median, IQR) Above maximum recommendation, % (n) | <10 E% | 14.7 (12.9–17.3) 97% (218) | 15.6 (13.3–17.8) 96% (74) | 14.1 (12.3–16.9) 97% (144) | 0.022 0.625 |
| Monounsaturated fat, E% E% (median, IQR) Below minimum recommendation, % (n) | 10–20 E% | 11 (9.6–12.3) 30% (67) | 10.8 (9.4–12.0) 32% (25) | 11.2 (9.7–12.4) 28% (42) | 0.111 0.525 |
| Polyunsaturated fat, E% E% (median, IQR) Below minimum recommendation, % (n) | 5–10 E% | 5.0 (4.0–6.1) 50% (113) | 4.9 (3.9–6.0) 52% (40) | 5.0 (4.0–6.2) 49% (73) | 0.570 0.709 |
| Carbohydrates, E% E% (median, IQR) | 45–60 E% | 48.0 (42.8–51.7) | 46.1 (40.5–51.2) | 48.7 (43.6–52.6) | 0.066 |
| Probable under-reporters Energy intake < eBMR †, % (n) | – | 45% (99) | 29% (22) | 53% (77) | 0.001 |
| Macronutrient Intake | Recommended Intake * | All Participants n = 225 | Younger Older Adults (Age 65–79) n = 190 | Oldest Old (Age ≥ 80) n = 35 | p-Value |
|---|---|---|---|---|---|
| Total energy intake MJ/day for males and females, median, (IQR) | Male: 6.1 Female: 5.0 | 7.9 (6.1–9.8) 4.9 (4.2–5.9) | 7.8 (6.1–9.8) 4.8 (4.2–5.9) | 7.9 (6.5–10.3) 5.2 (4.7–5.8) | 0.446 0.461 |
| Protein E% (median, IQR) Below minimum recommendation, % (n) | 15–20 E% | 14.5 (12.8–16.4) 55% (120) | 14.9 (13.0–16.6) 52% (98) | 13.6 (12.3–15.1) 74% (26) | 0.033 0.013 |
| Fibre, g/MJ g/MJ (median, IQR) Below minimum recommendation, % (n) | >3 g/MJ | 2.8 (2.3–3.4) 57% (129) | 2.9 (2.3–3.4) 57% (108) | 2.6 (2.3–3.6) 60% (21) | 0.518 0.729 |
| Saturated fat, E% E% (median, IQR) Above maximum recommendation, % (n) | <10 E% | 14.7 (12.9–17.3) 97% (218) | 14.7 (13.0–17.4) 97% (184) | 14.2 (12.3–16.9) 97% (34) | 0.657 0.925 |
| Monounsaturated fat, E% E% (median, IQR) Below minimum recommendation, % (n) | 10–20 E% | 11 (9.6–12.3) 30% (67) | 11.0 (9.8–12.3) 52 (27%) | 10.7 (8.5–12.2) 43% (15) | 0.208 0.066 |
| Polyunsaturated fat, E% E% (median, IQR) Below minimum recommendation, % (n) | 5–10 E% | 5.0 (4.0–6.1) 50% (113) | 5.1 (4.1–6.2) 48% (91) | 4.4 (3.7–5.6) 63% (22) | 0.057 0.104 |
| Carbohydrates, E% E% (median, IQR) | 45–60 E% | 48.0 (42.8–51.7) | 47.6 (42.3–51.7) | 48.8 (44.3–54.6) | 0.172 |
| Probable under-reporters Energy intake < eBMR †, % (n) | - | 45% (99) | 48% (89) | 29% (10) | 0.038 |
Publisher’s Note: MDPI stays neutral with regard to jurisdictional claims in published maps and institutional affiliations. |
© 2022 by the authors. Licensee MDPI, Basel, Switzerland. This article is an open access article distributed under the terms and conditions of the Creative Commons Attribution (CC BY) license (https://creativecommons.org/licenses/by/4.0/).
Share and Cite
Fart, F.; Tingö, L.; Engelheart, S.; Lindqvist, C.M.; Brummer, R.J.; Kihlgren, A.; Schoultz, I. Gut Health and Its Association with Wellbeing and Nutrient Intake in Community-Dwelling Older Adults. Gastroenterol. Insights 2022, 13, 349-364. https://doi.org/10.3390/gastroent13040035
Fart F, Tingö L, Engelheart S, Lindqvist CM, Brummer RJ, Kihlgren A, Schoultz I. Gut Health and Its Association with Wellbeing and Nutrient Intake in Community-Dwelling Older Adults. Gastroenterology Insights. 2022; 13(4):349-364. https://doi.org/10.3390/gastroent13040035
Chicago/Turabian StyleFart, Frida, Lina Tingö, Stina Engelheart, Carl Mårten Lindqvist, Robert J. Brummer, Annica Kihlgren, and Ida Schoultz. 2022. "Gut Health and Its Association with Wellbeing and Nutrient Intake in Community-Dwelling Older Adults" Gastroenterology Insights 13, no. 4: 349-364. https://doi.org/10.3390/gastroent13040035