
Sensory Motor Function Disturbances in Mice Prenatally Exposed to Low Dose of Ethanol: A Neurobehavioral Study in Postnatal and Adult Stages
 , ,
, , 
Abstract
:1. Introduction
2. Materials and Methods
2.1. Chemicals
2.2. Animals
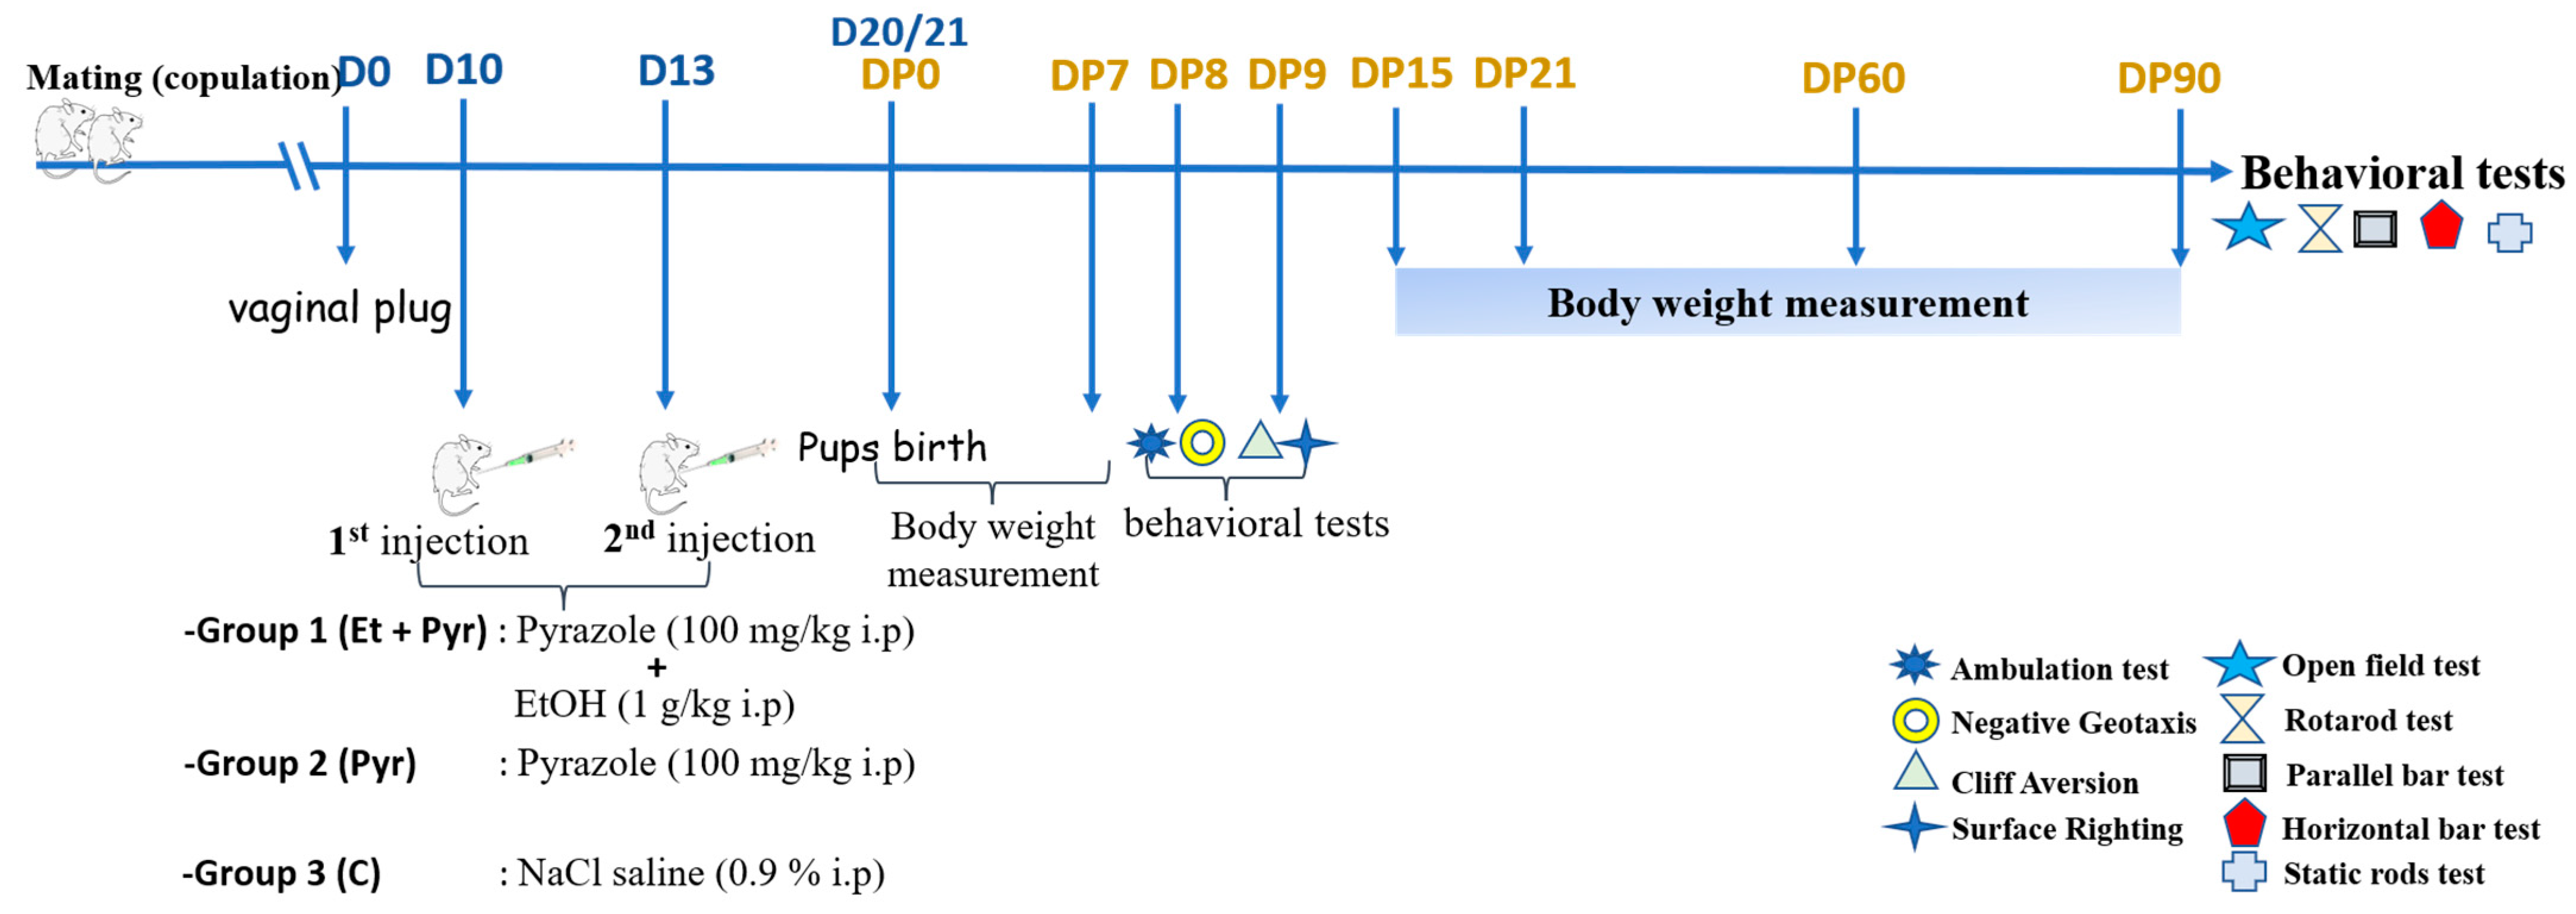
2.3. Treatments
2.4. Morphometric and Behavioral Tests
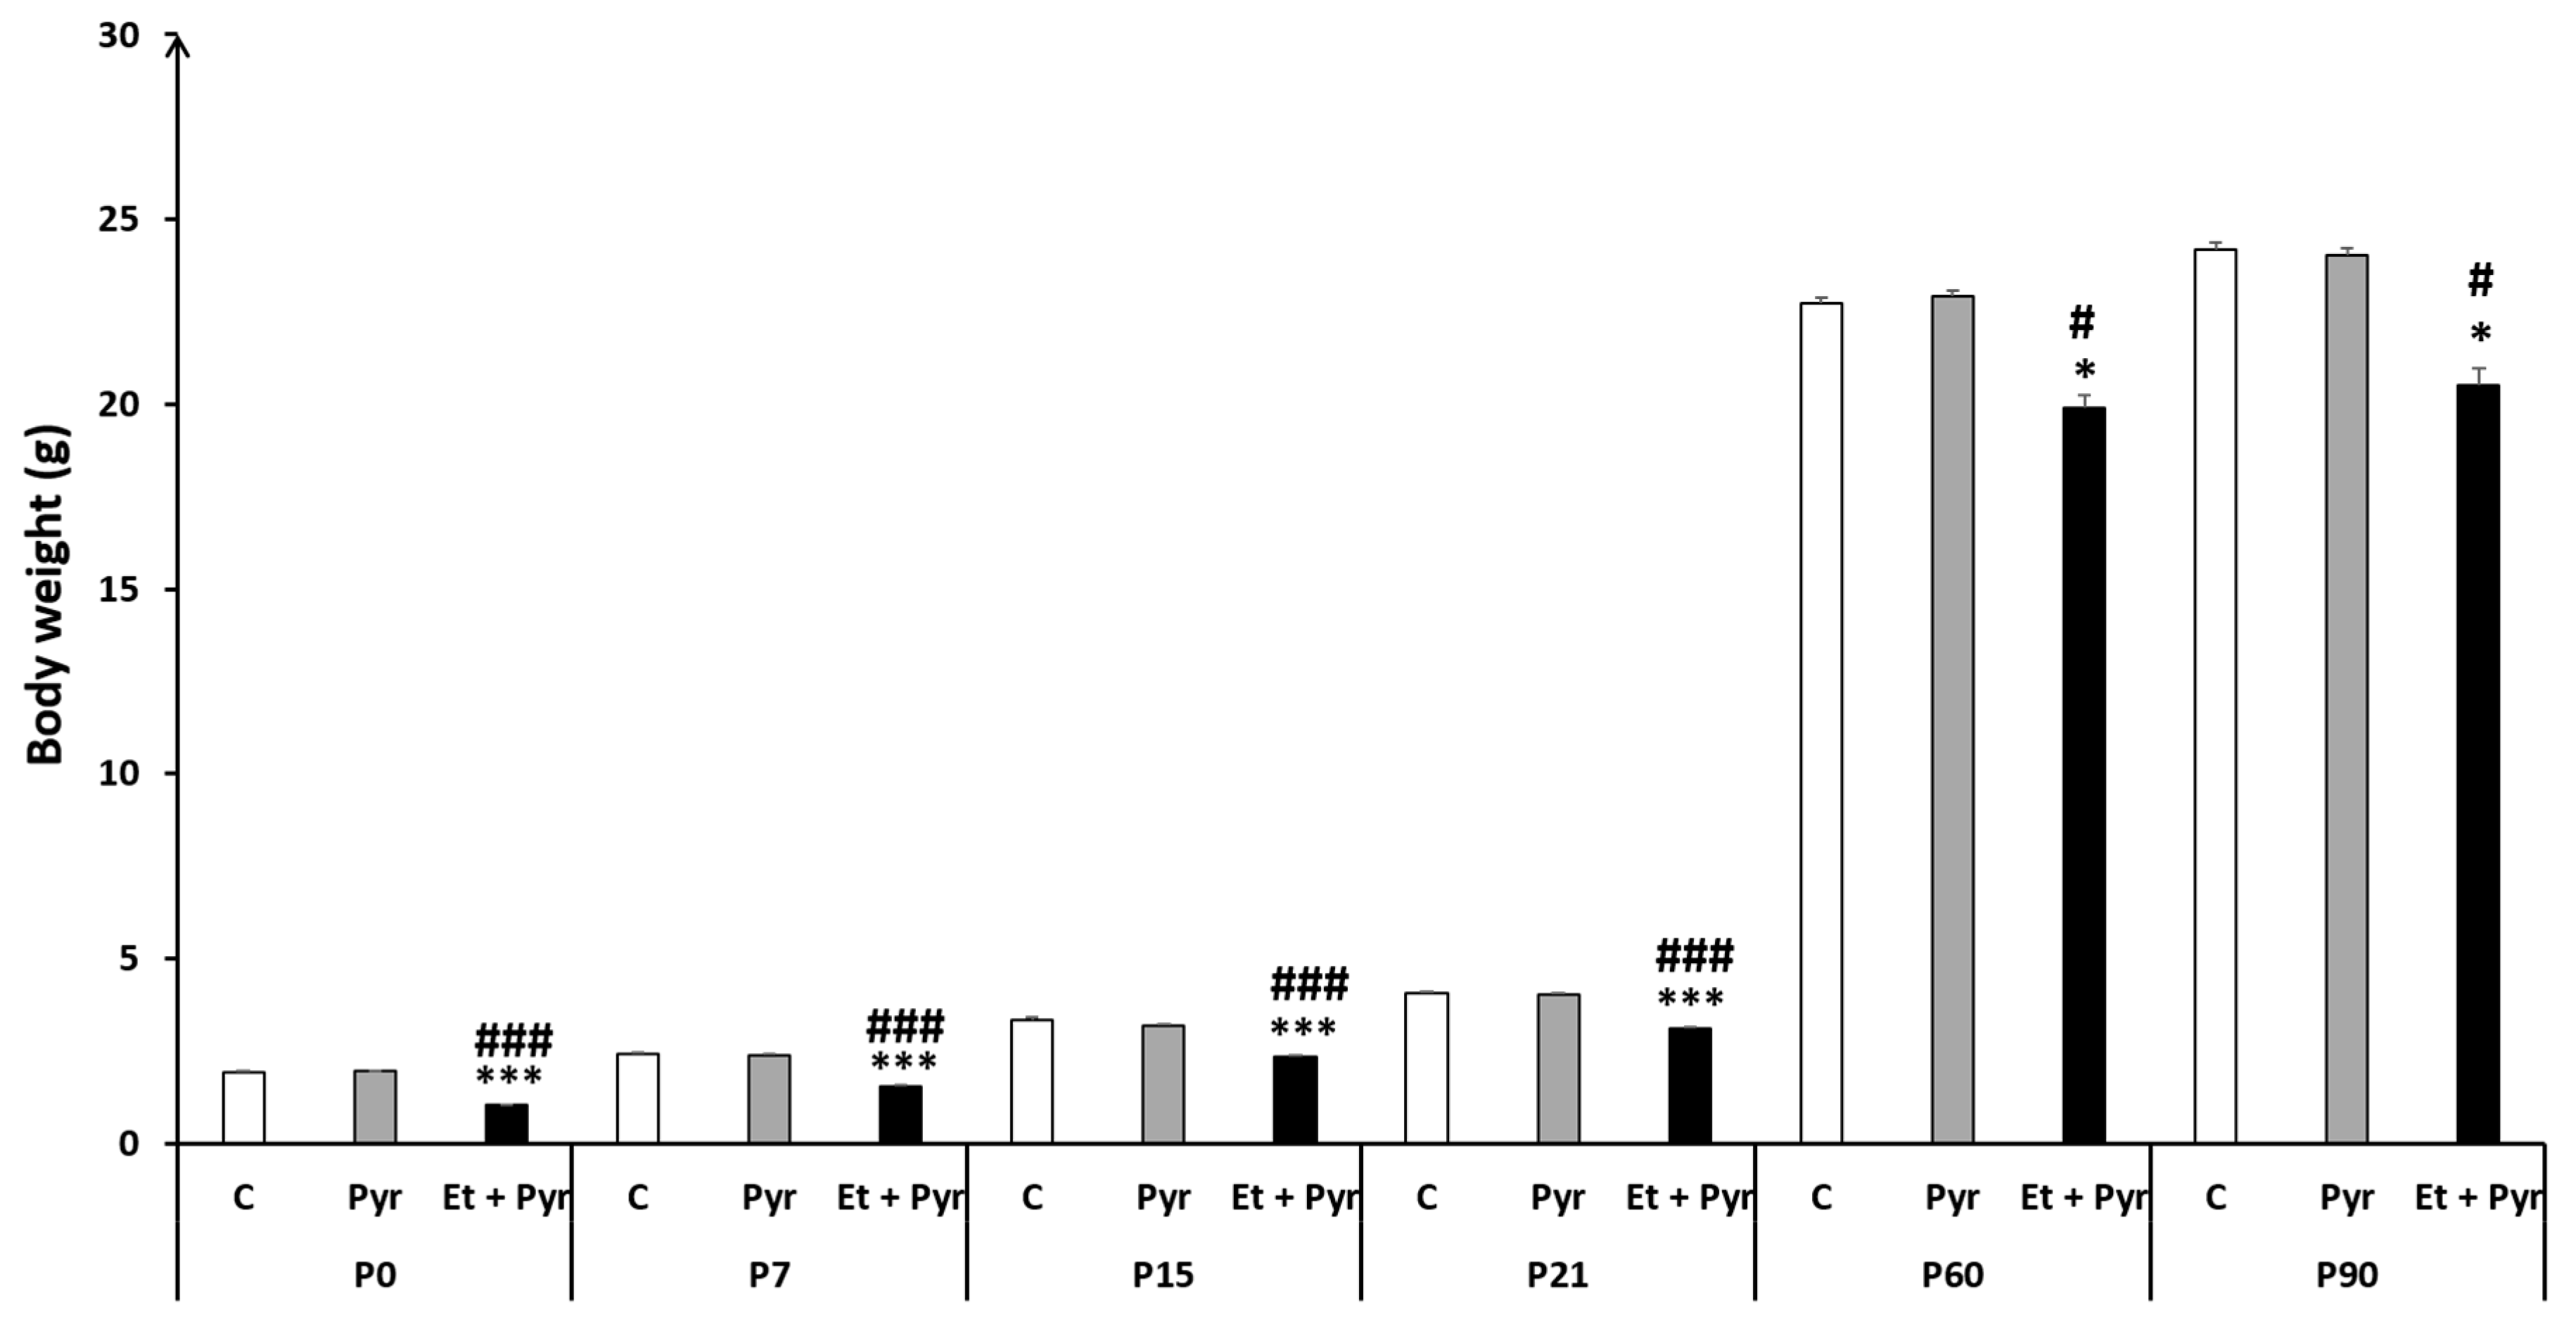
2.4.1. Body Weight Measurement
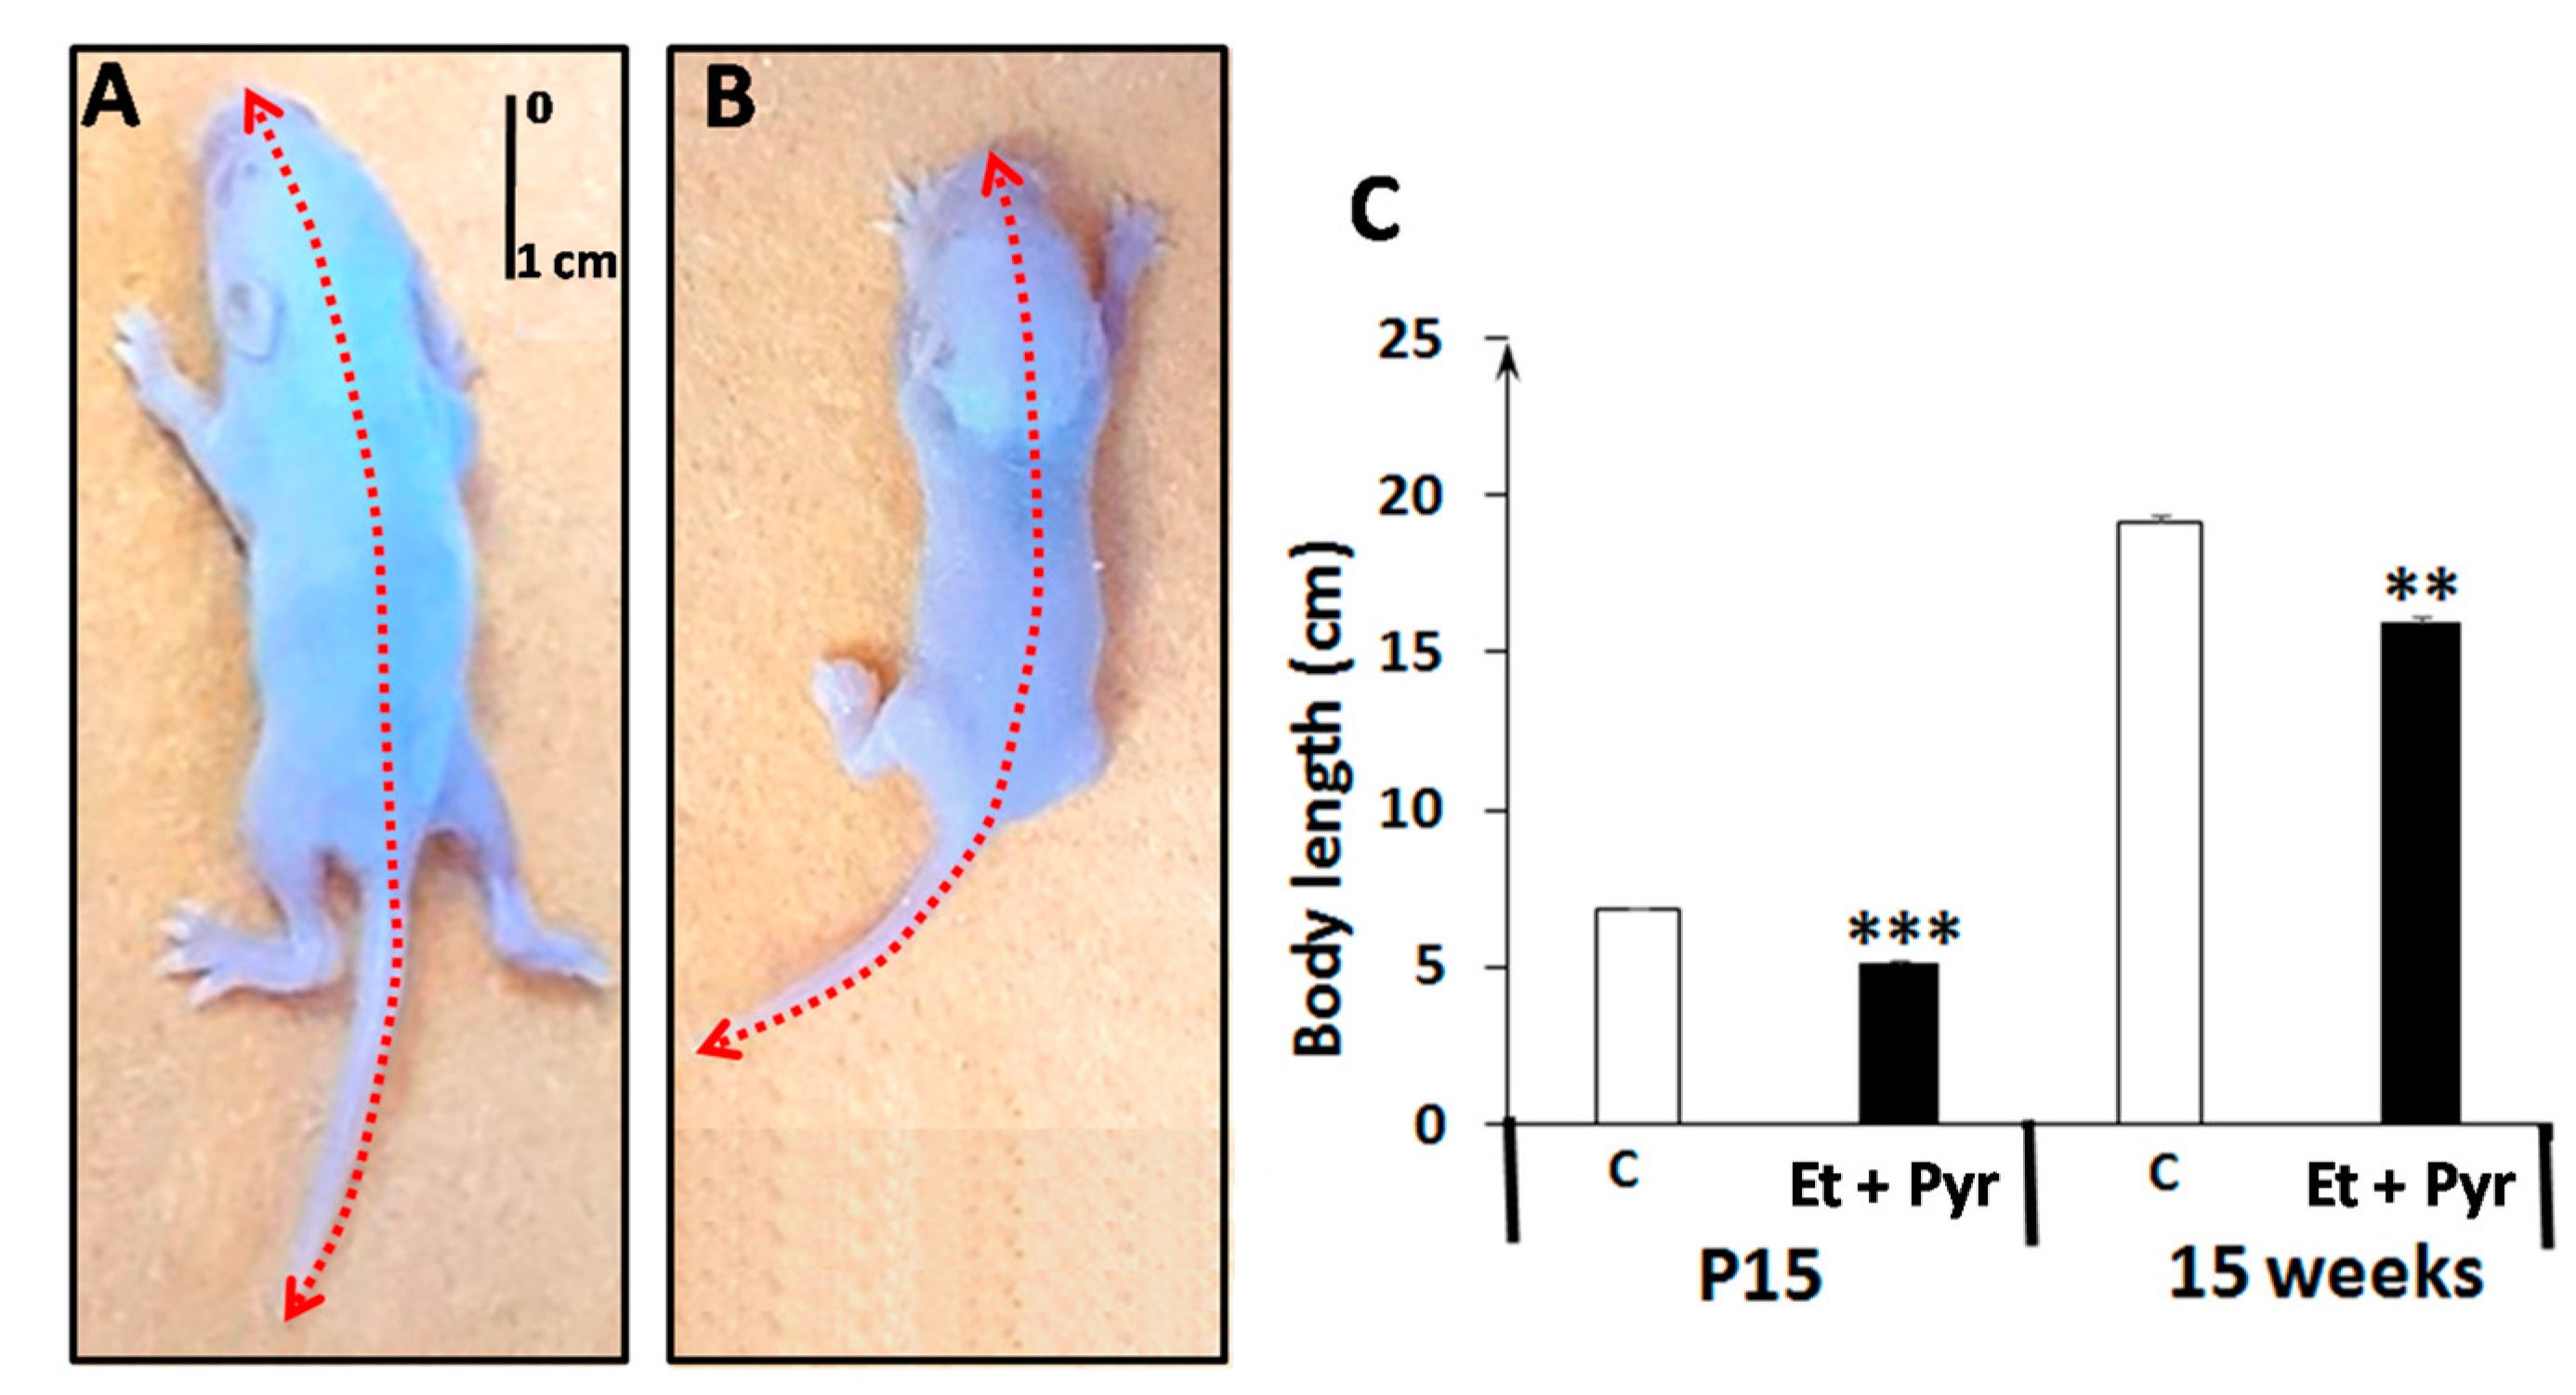
2.4.2. Body Length Measurement
2.4.3. Behavioral Tests
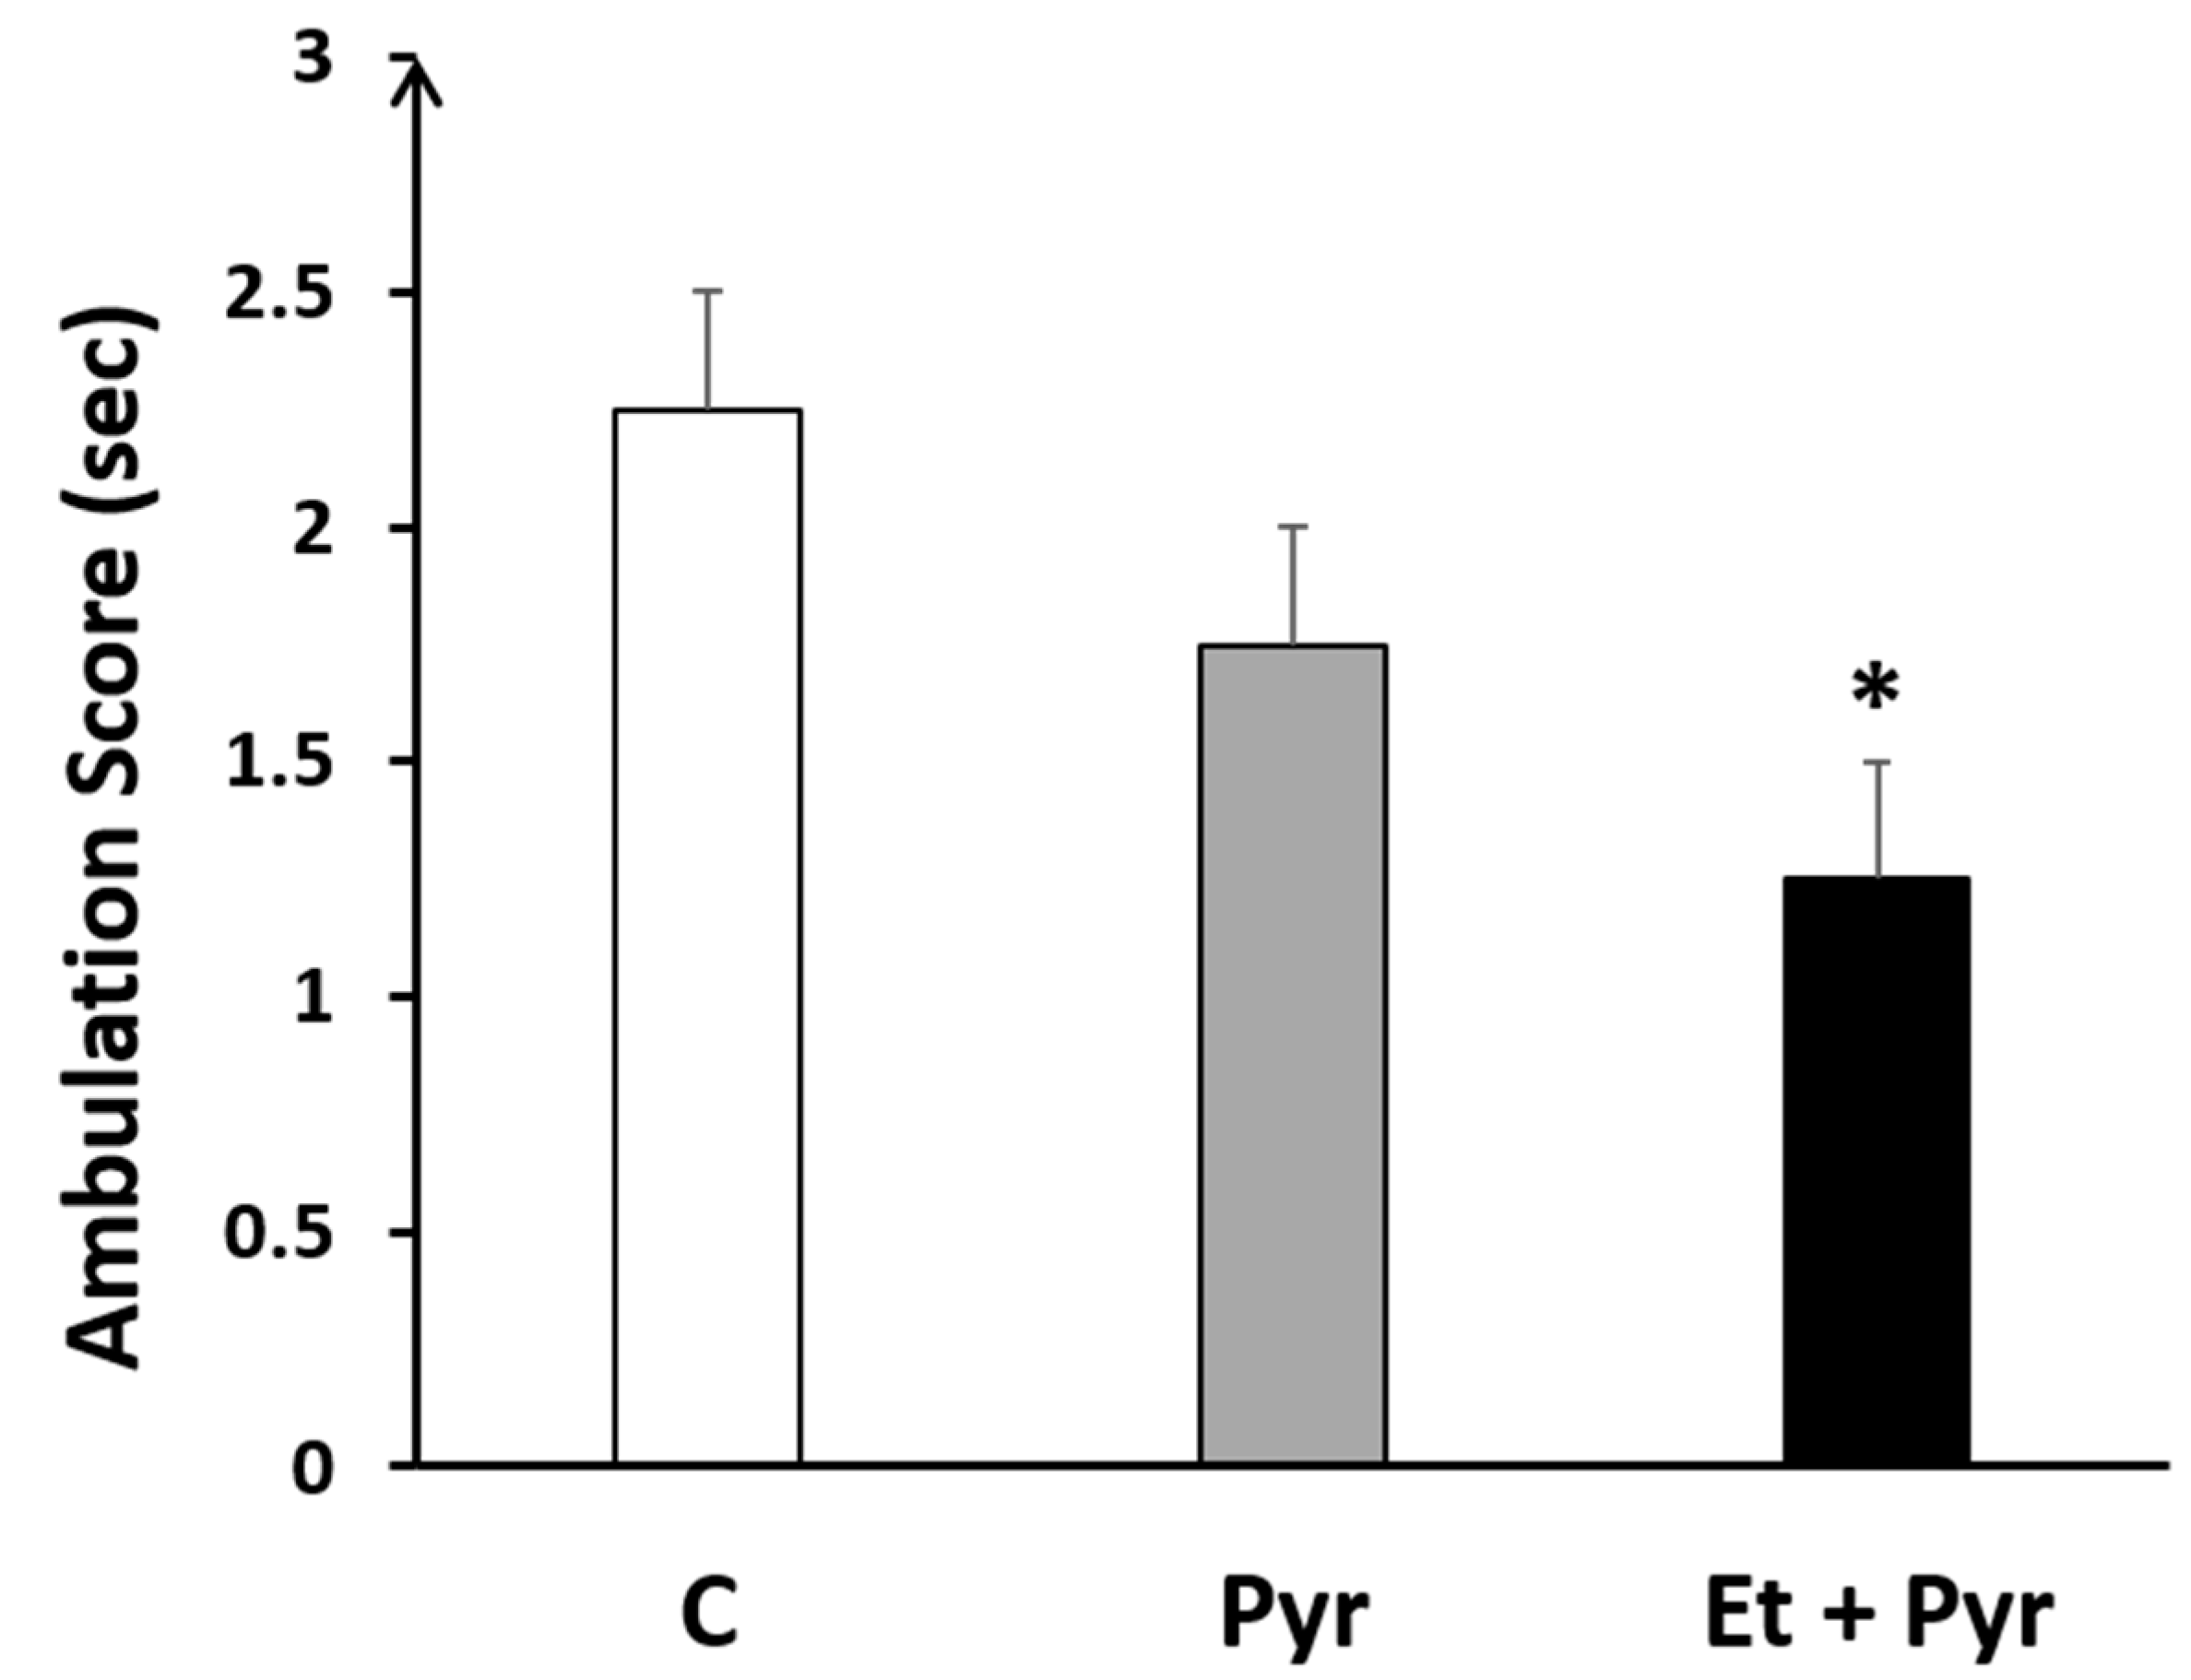
Ambulation Test
Negative Geotaxis
Cliff Aversion
Surface Righting
Open Field Test
Rotarod Test
Parallel Bar Test
Horizontal Bars Test
Static Rods Test
Statistical Analysis
3. Results
3.1. Body Weight Measurement
3.2. Body Length Measurement
3.3. Neurobehavioral Study
3.3.1. Ambulation Test
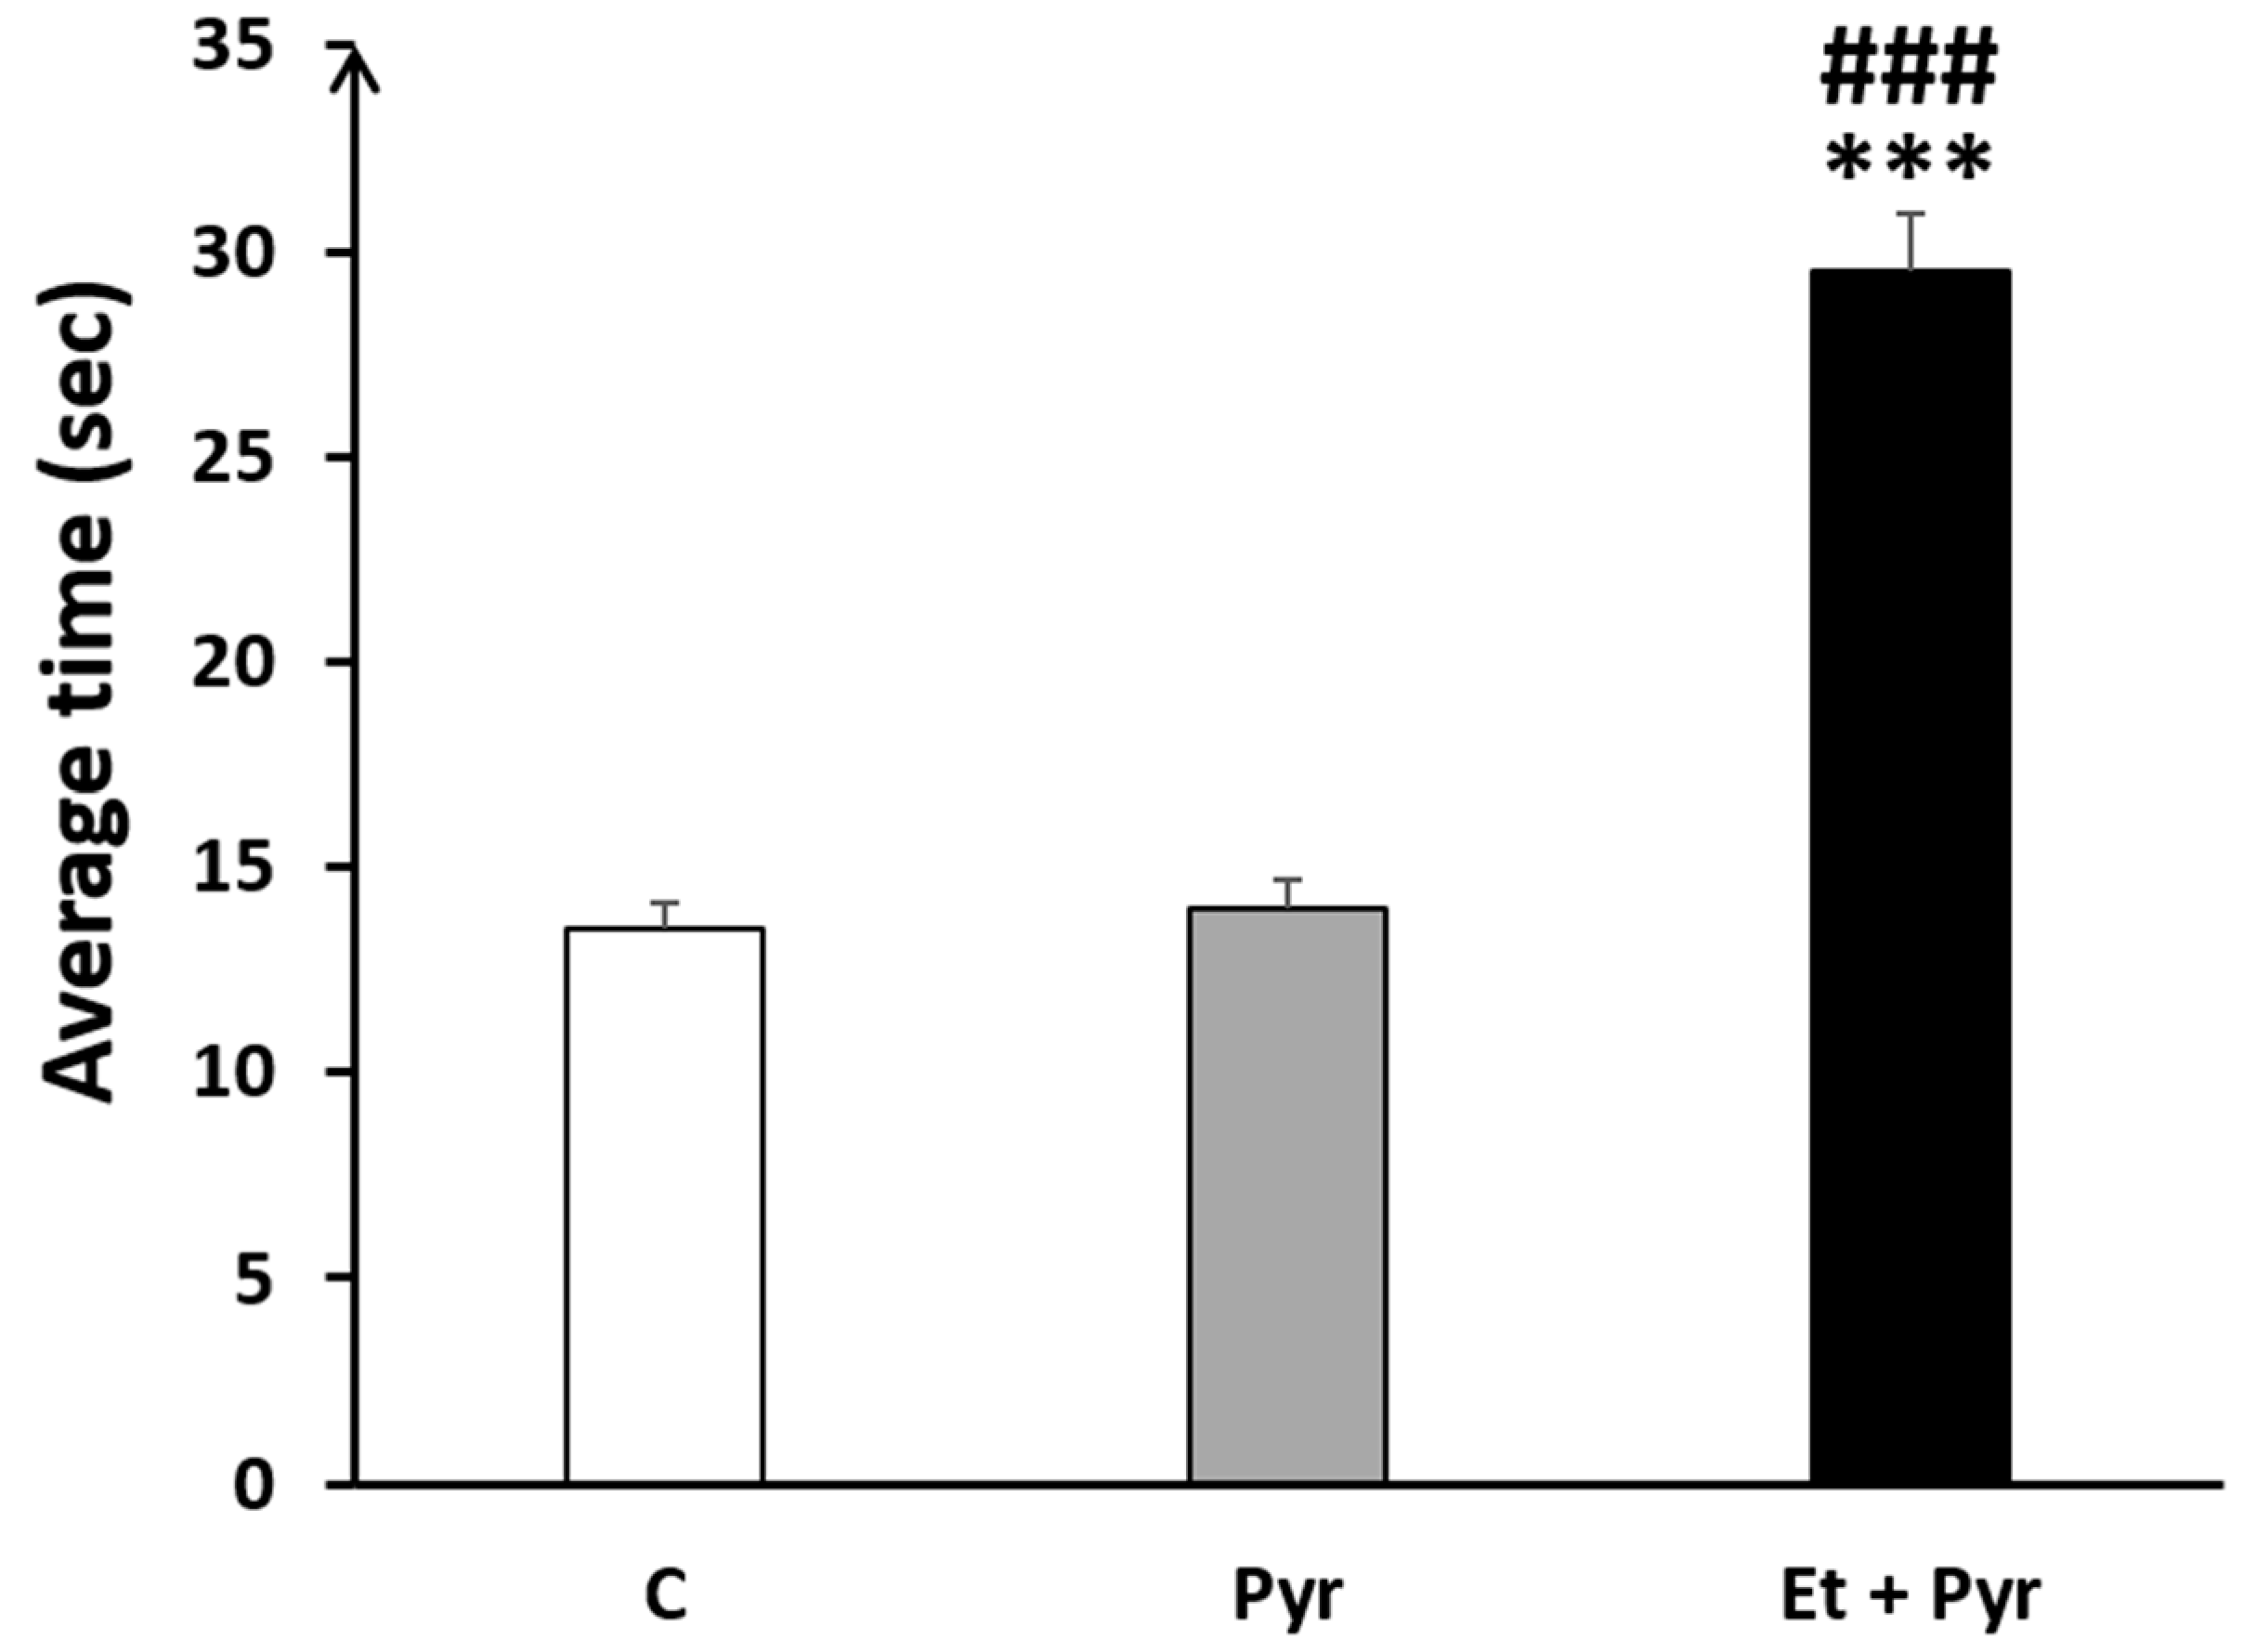
3.3.2. Negative Geotaxis Test
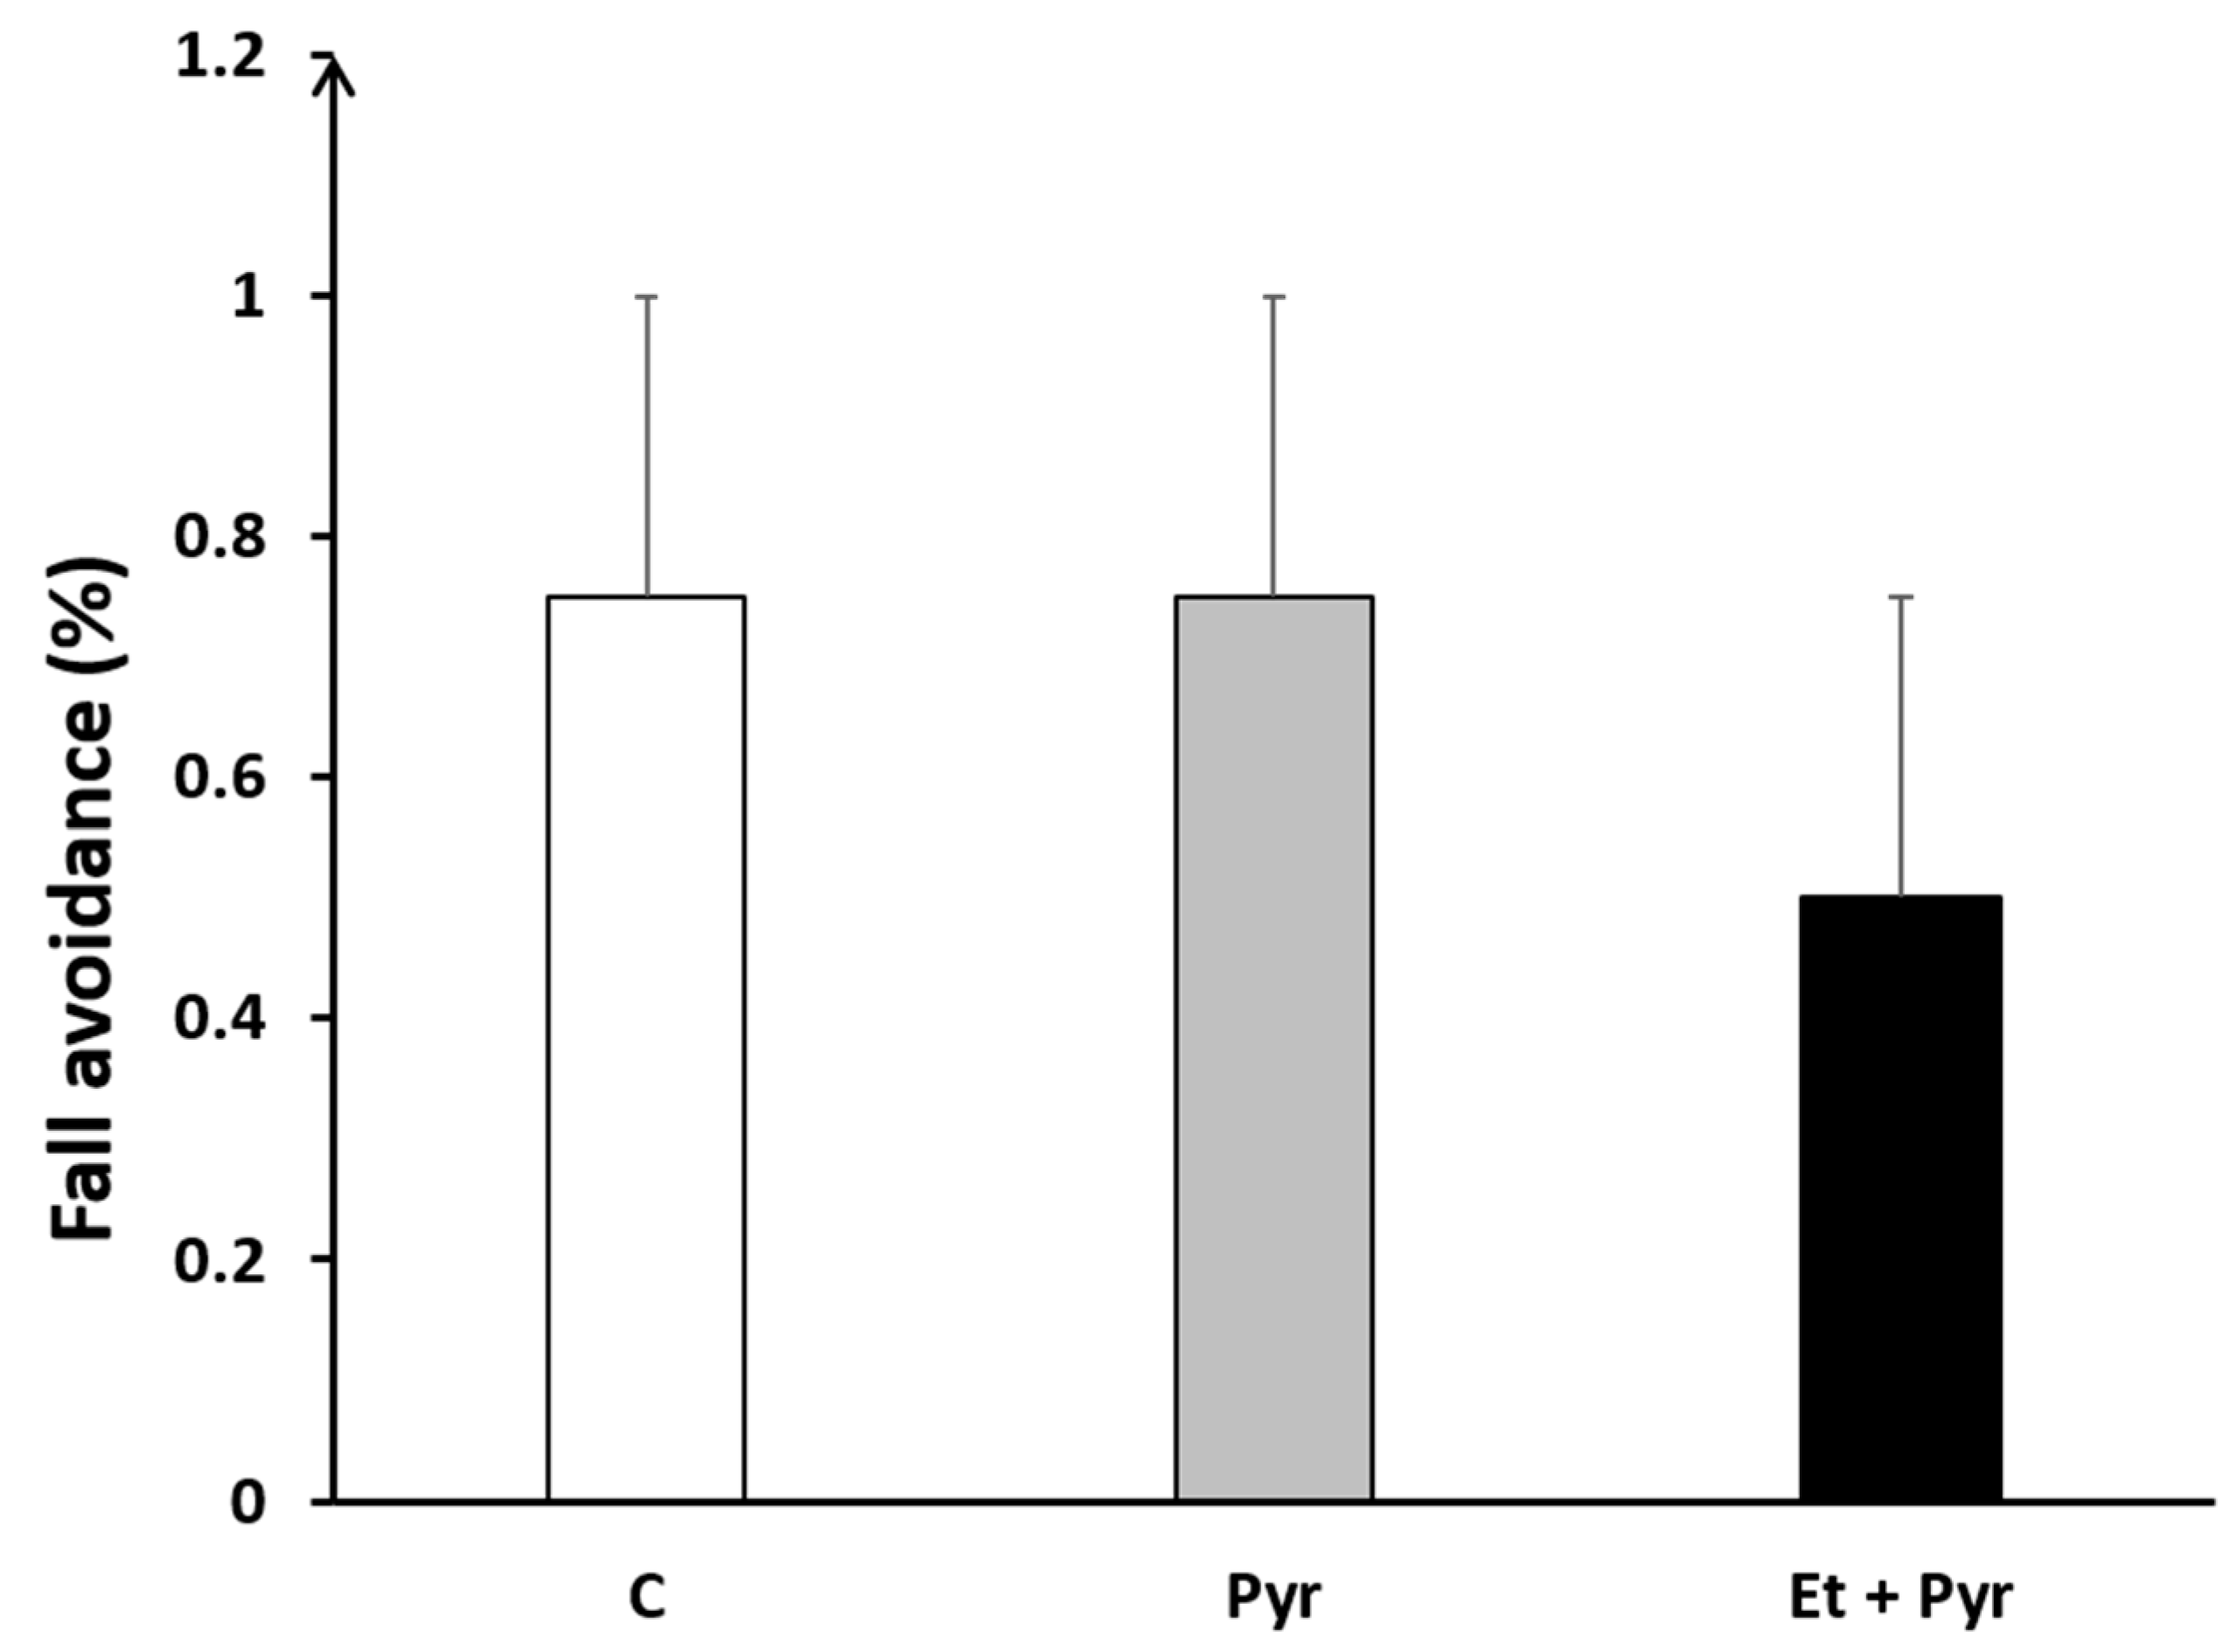
3.3.3. Fall Avoidance Test
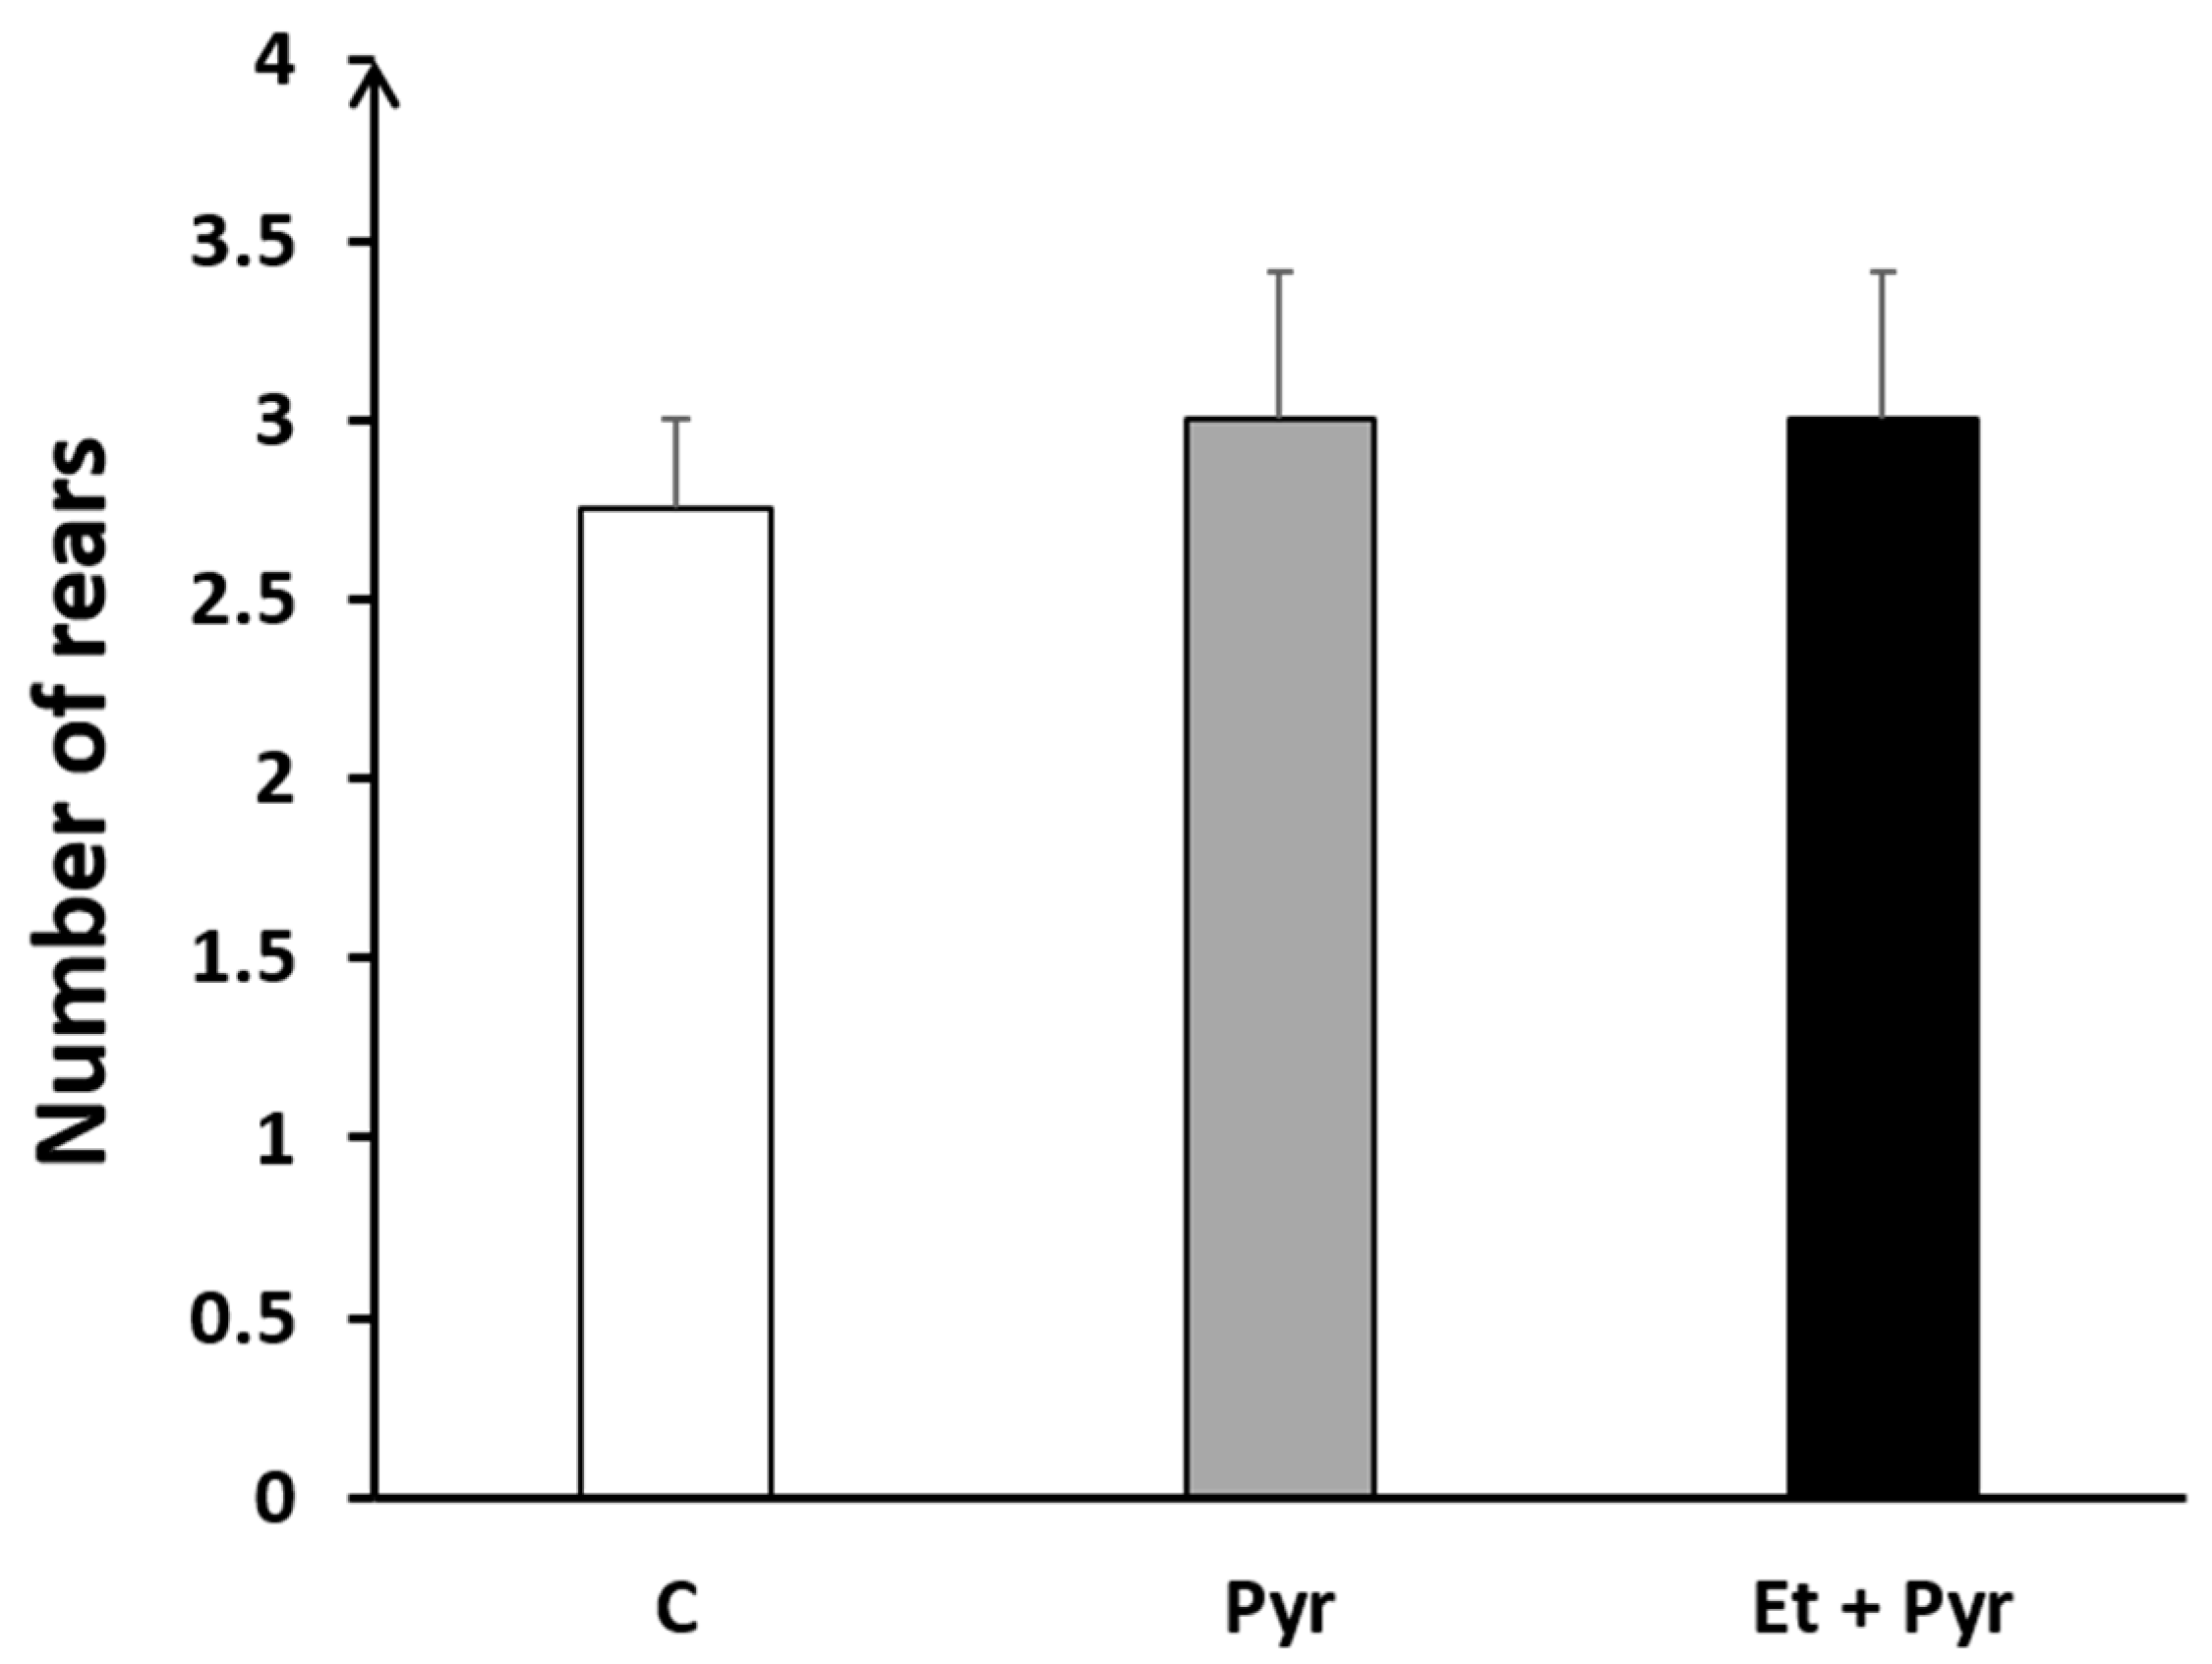
3.3.4. Rears Test
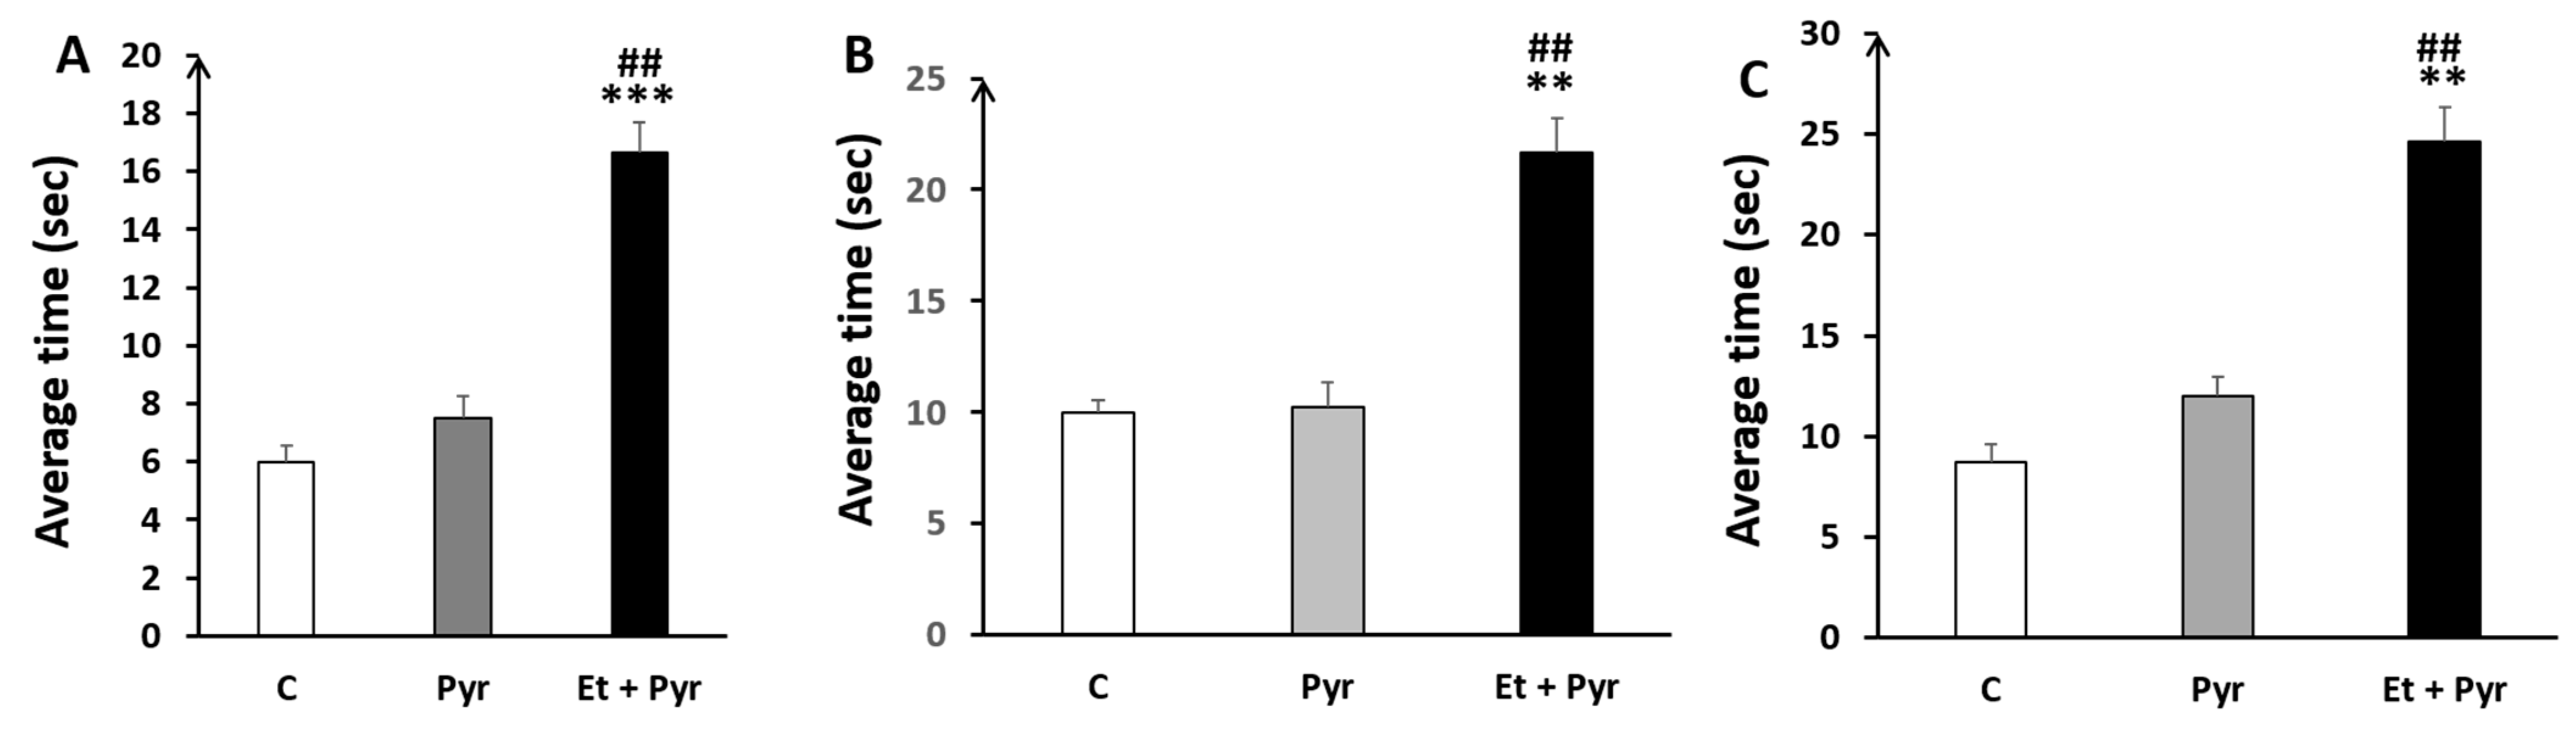
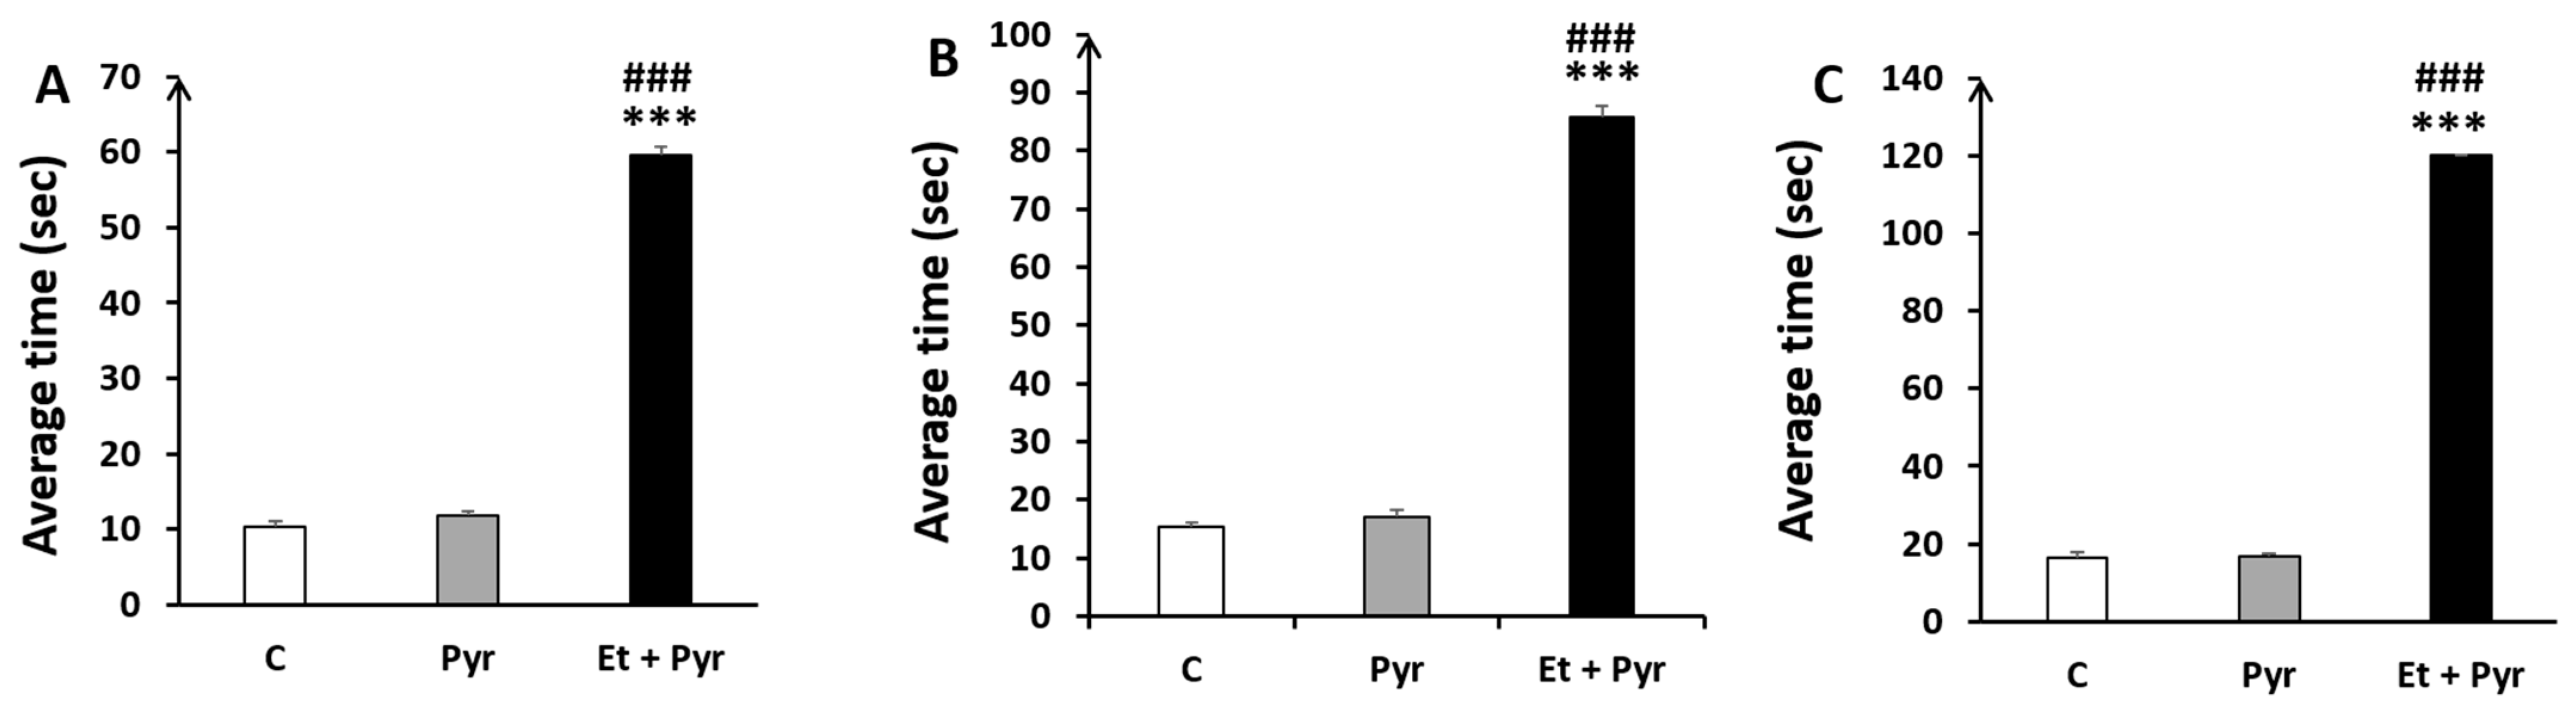
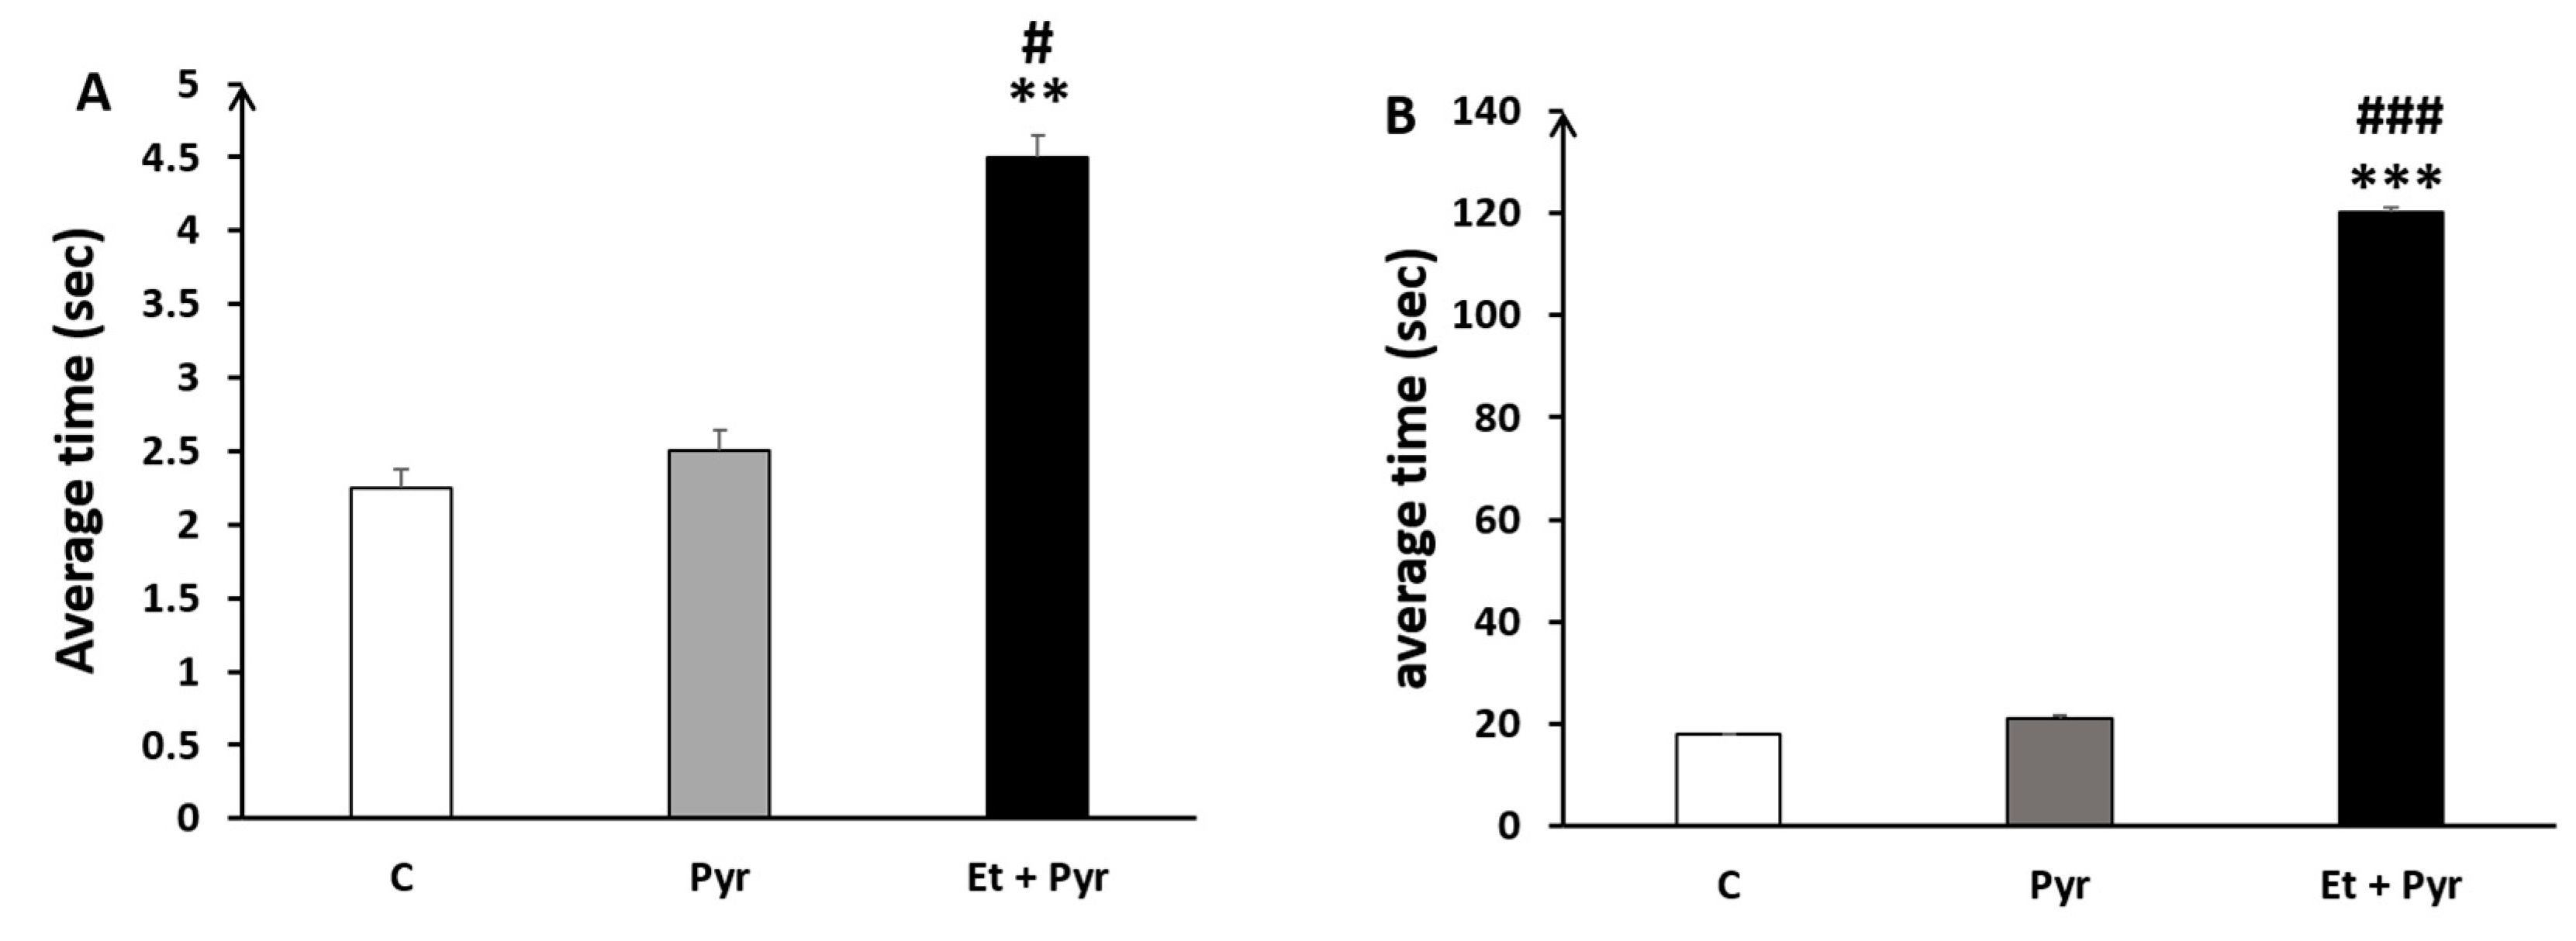
3.3.5. Static Rods Test
- ✓
- Average time to turn 180°
- ✓
- Time to reach the end of the rods
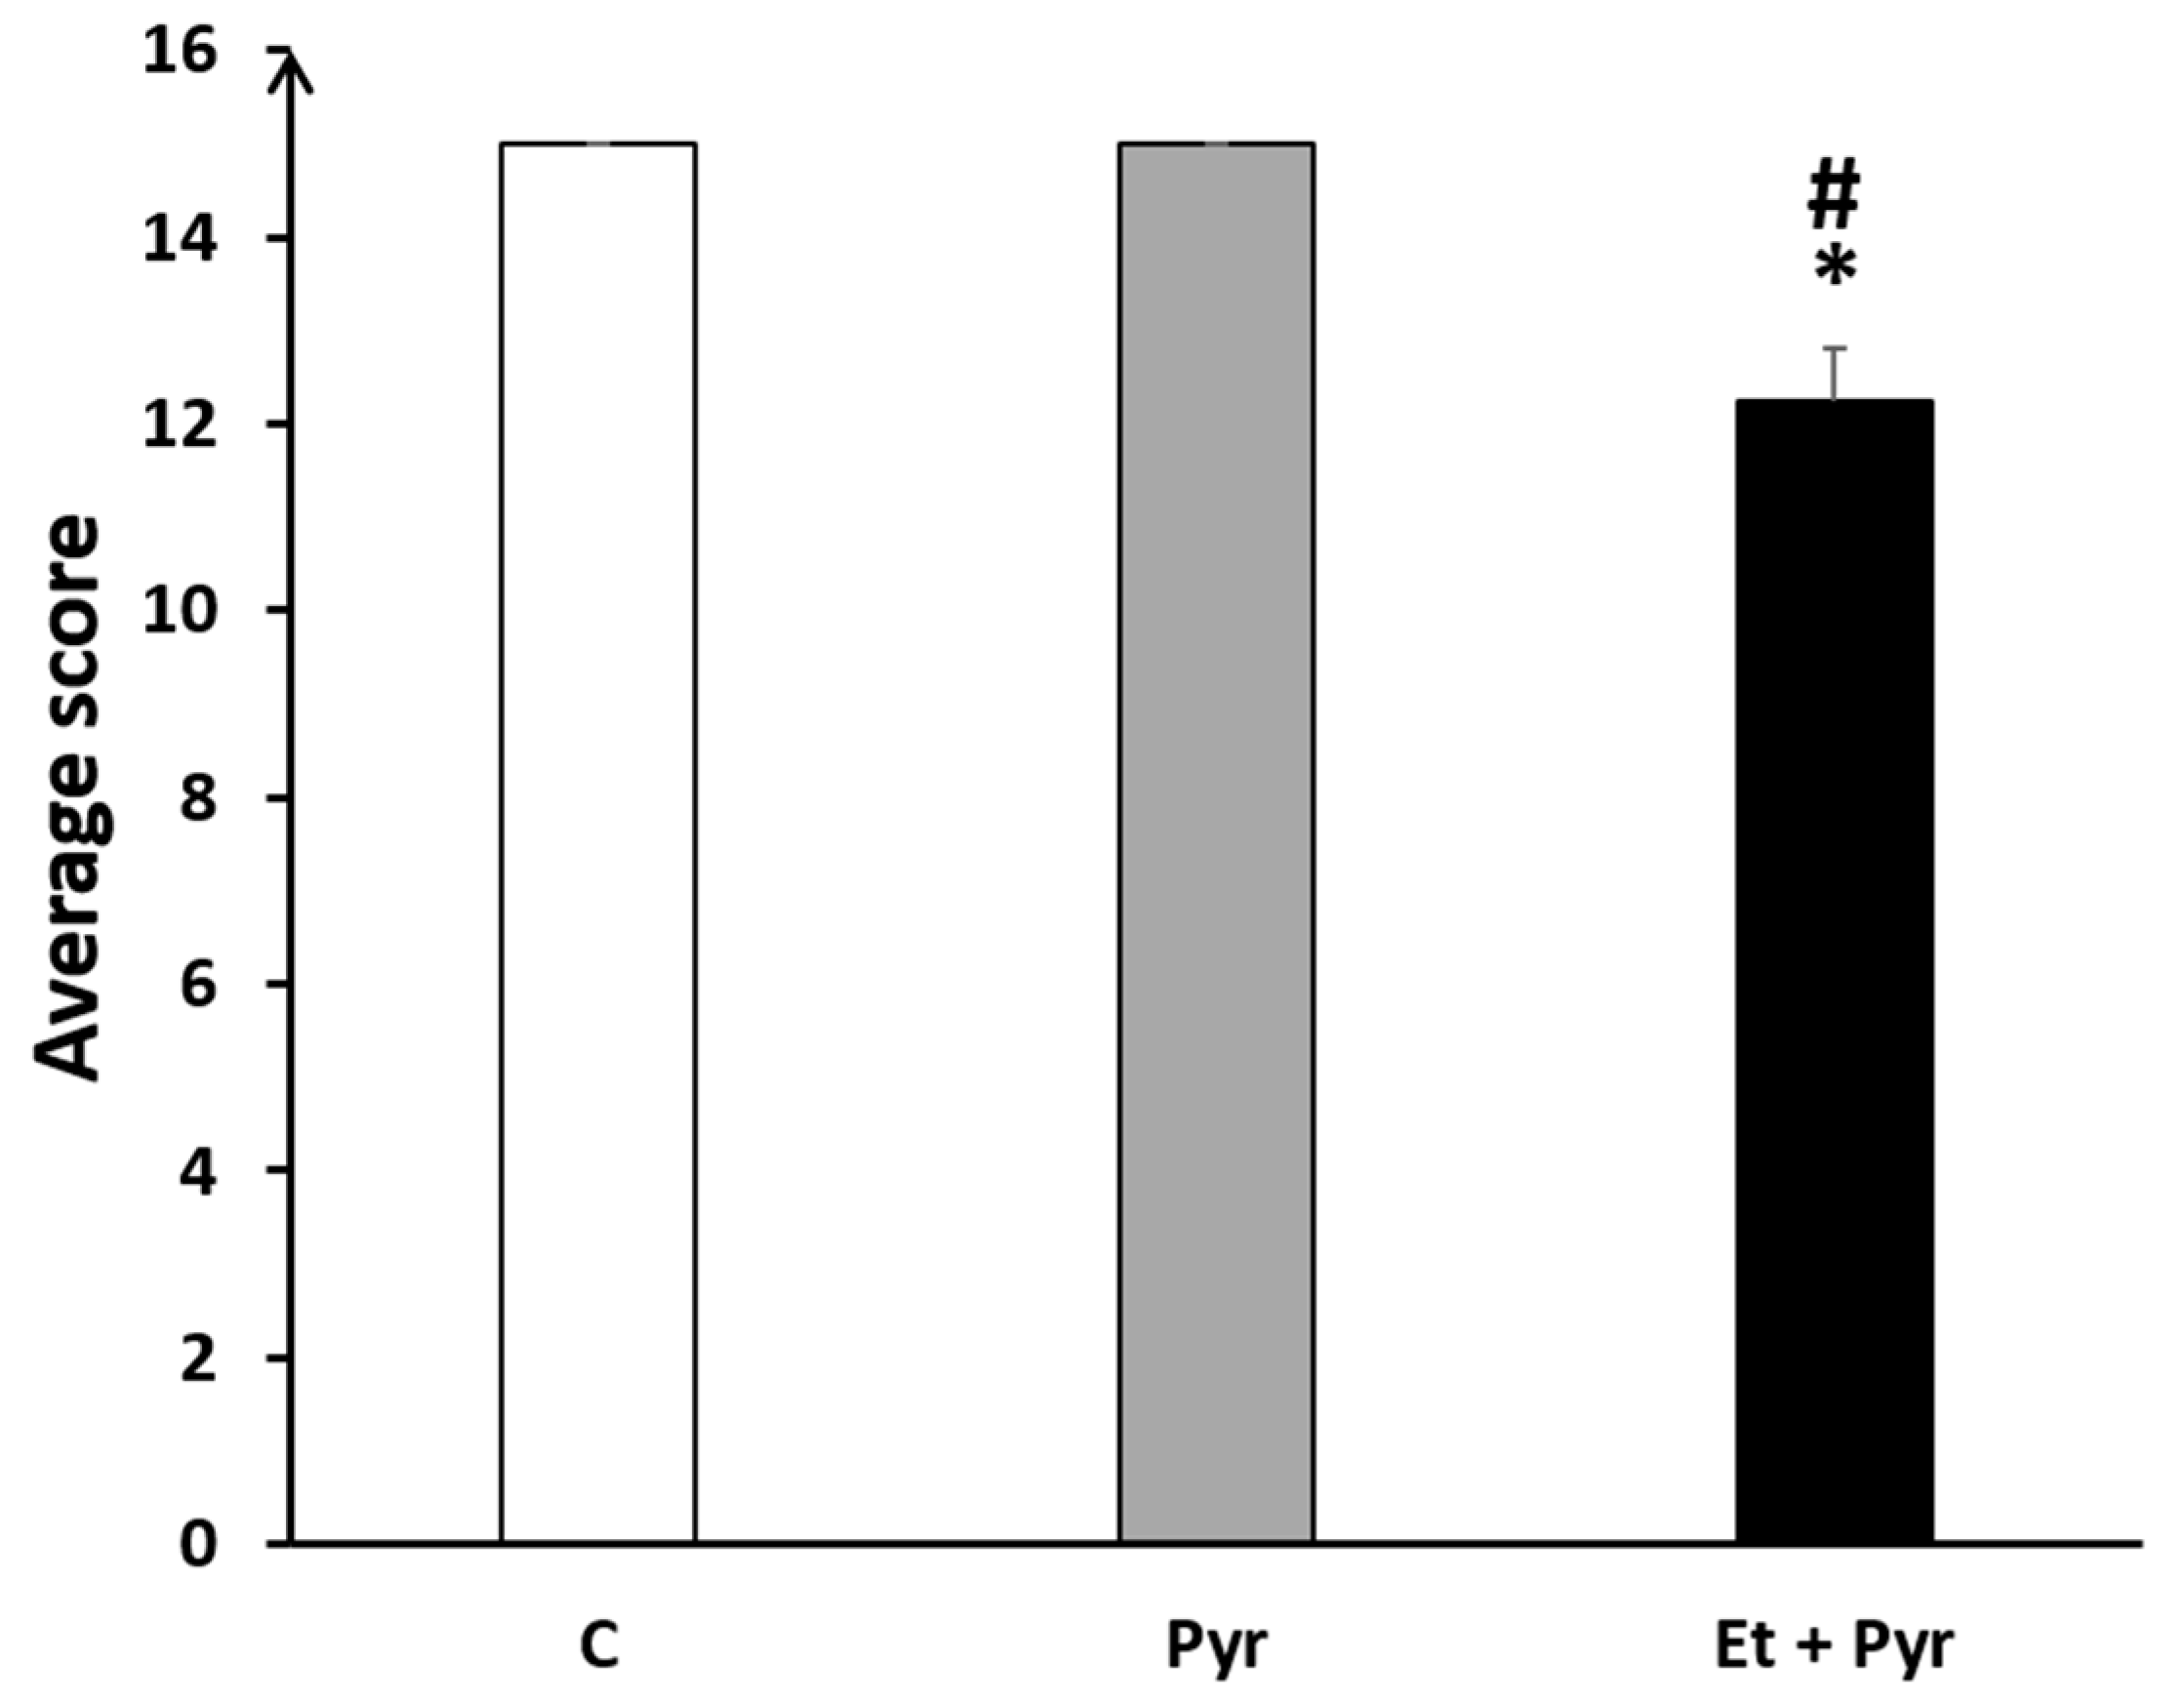
3.3.6. Parallel Bars
3.3.7. Horizontal Bars
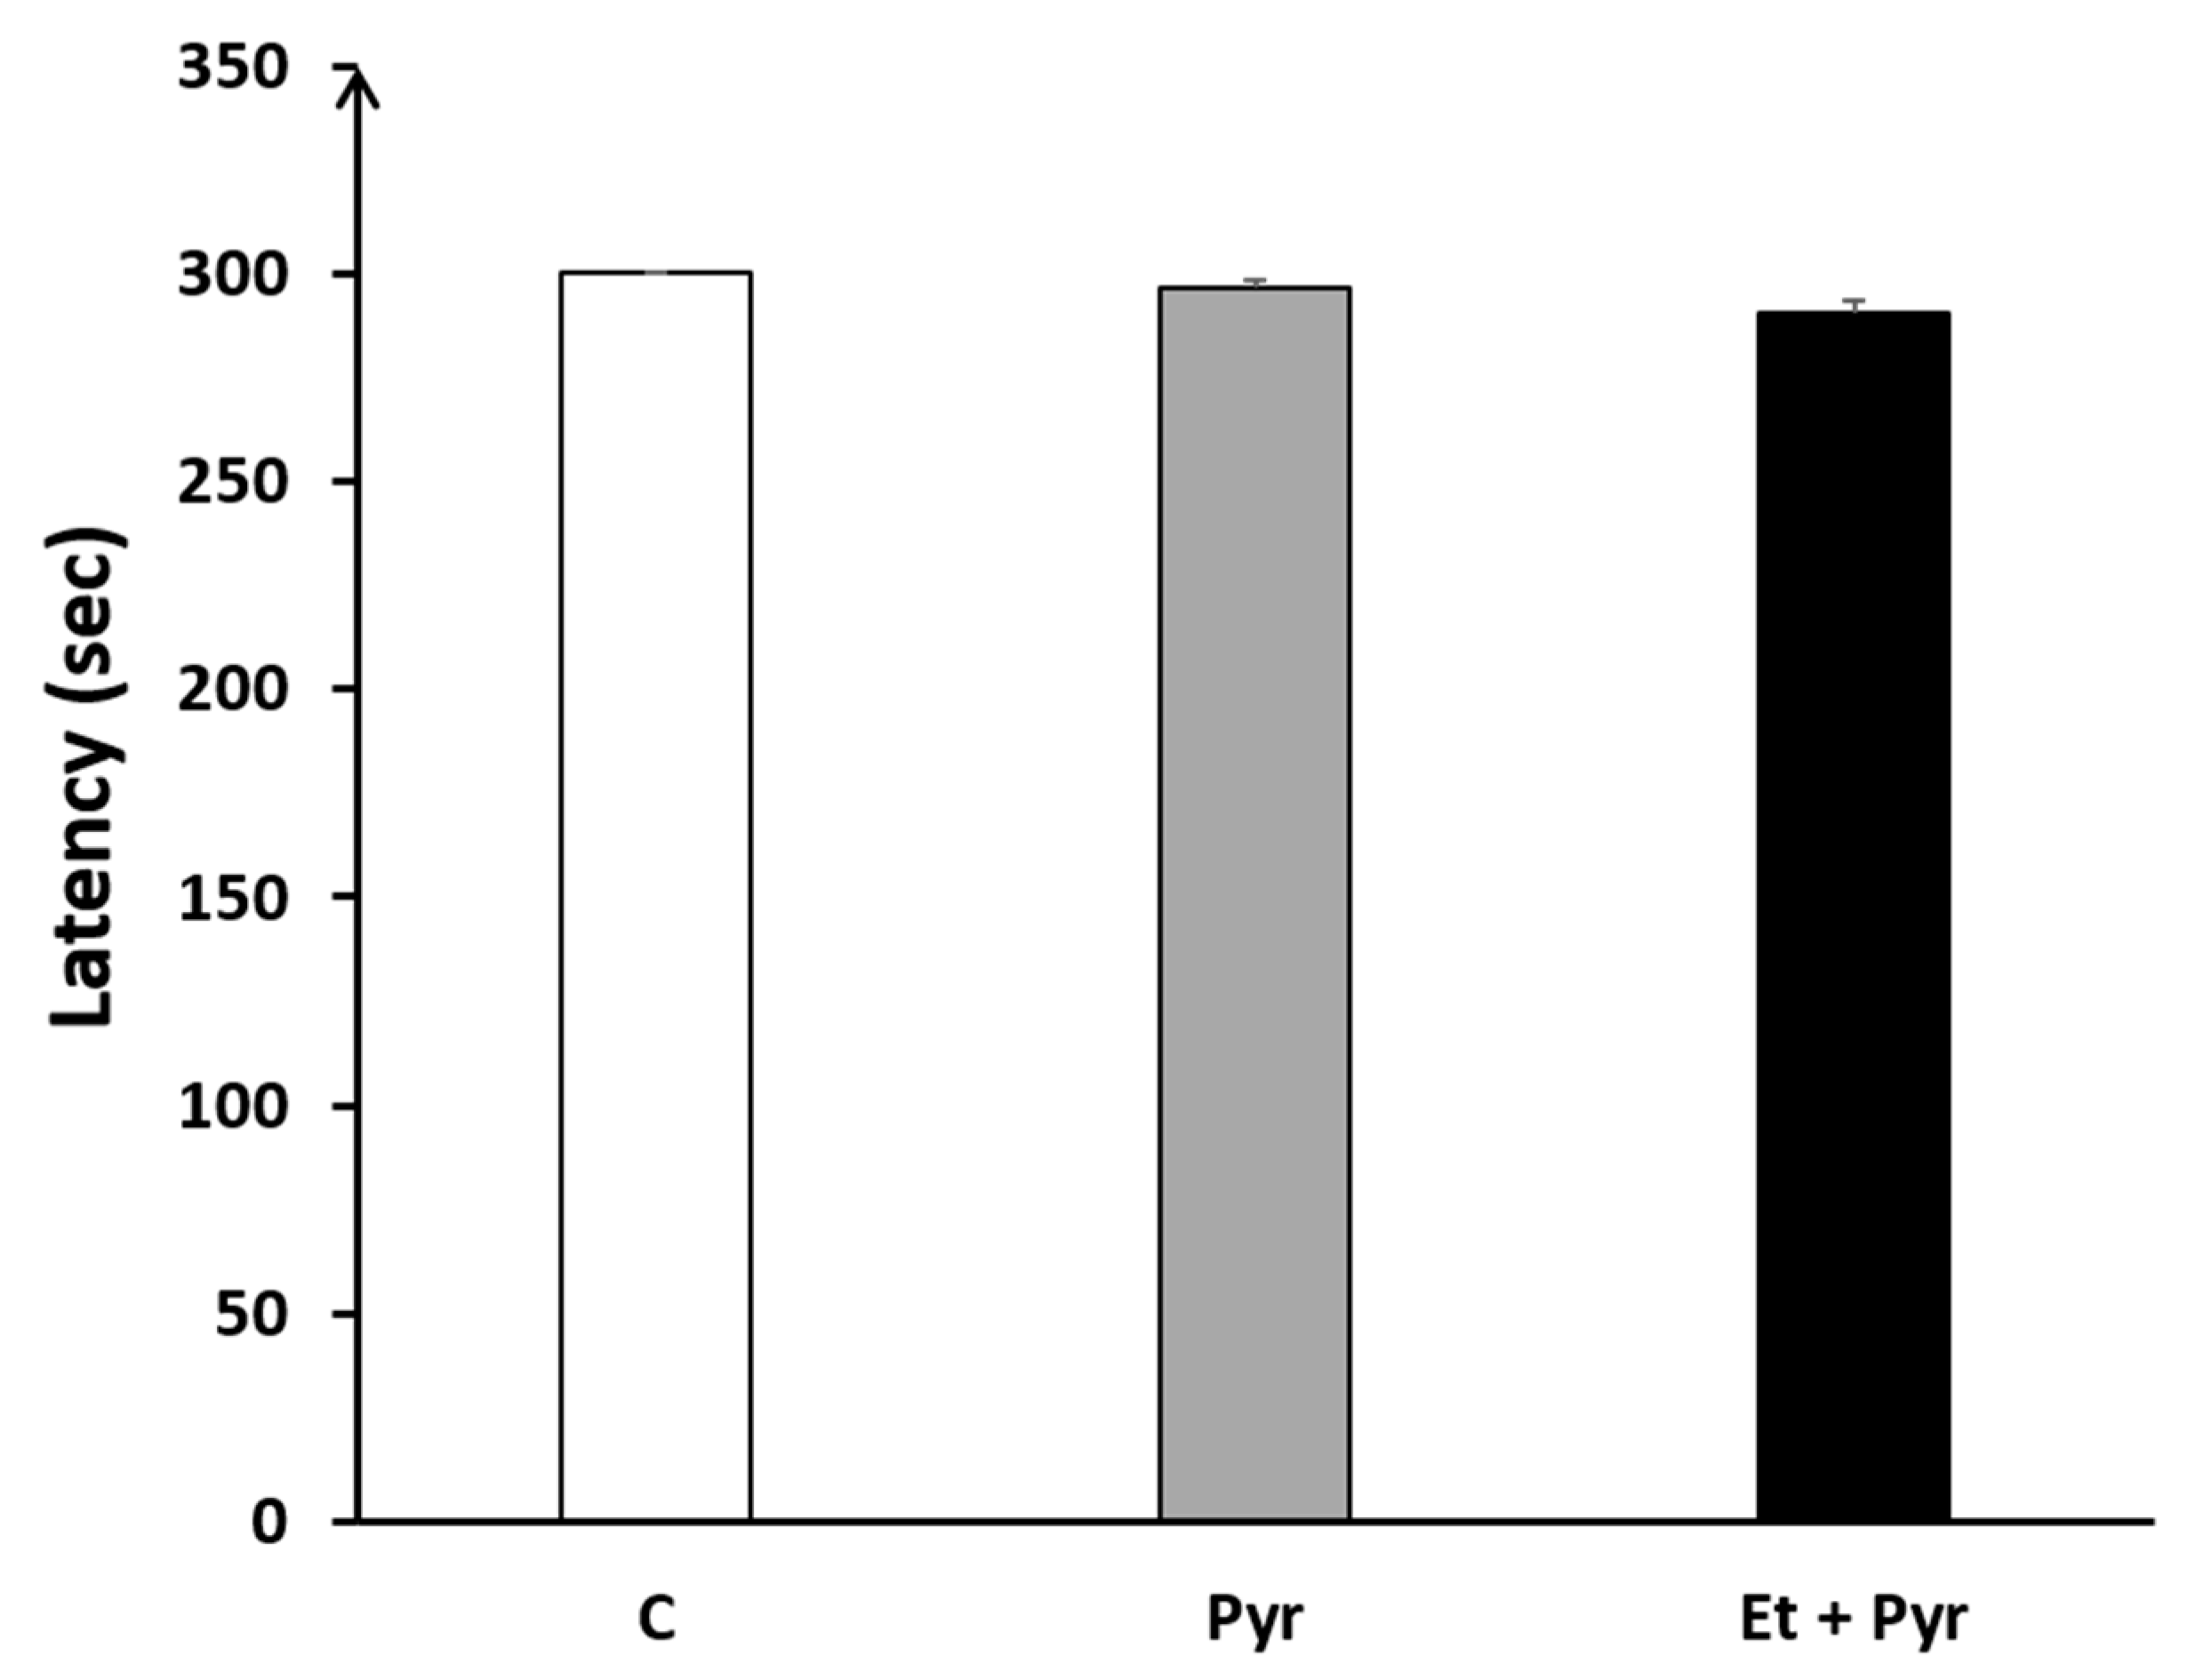
3.3.8. Rotarod
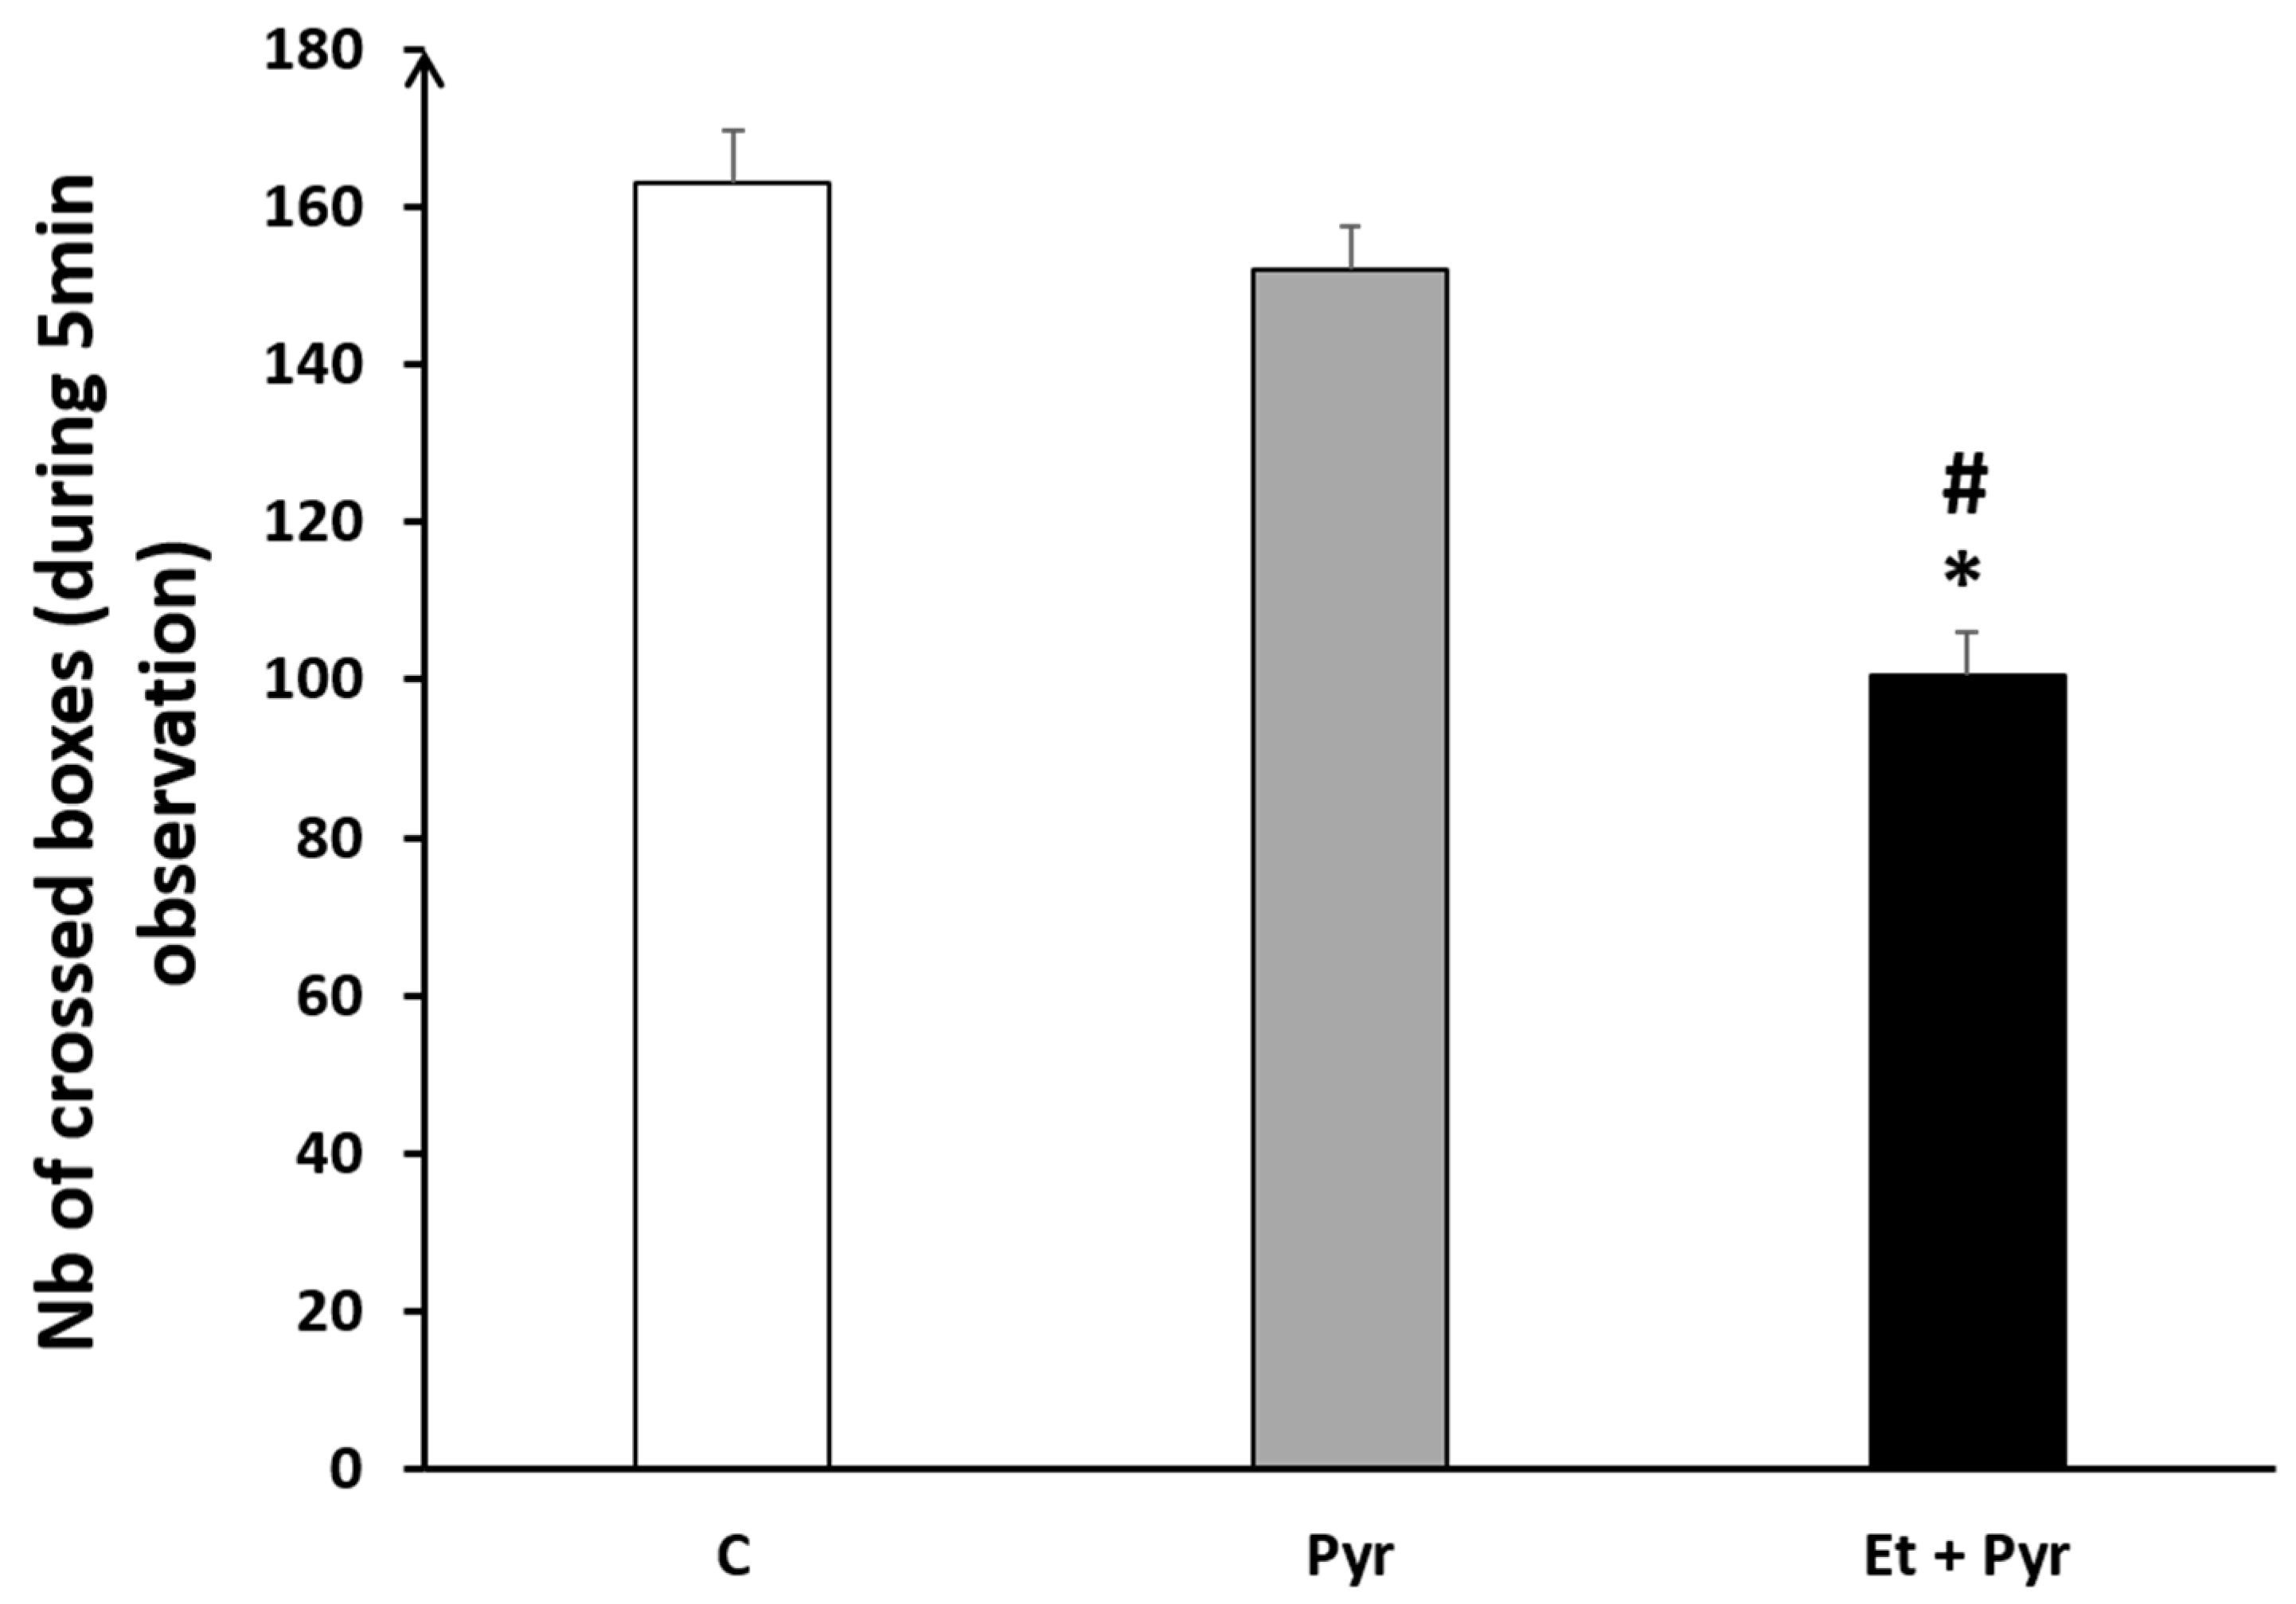
3.3.9. Open Field Test
4. Discussion
5. Conclusions
Author Contributions
Funding
Institutional Review Board Statement
Data Availability Statement
Conflicts of Interest
References
- May, P.A.; Chambers, C.D.; Kalberg, W.O.; Zellner, J.; Feldman, H.; Buckley, D.; Kopald, D.; Hasken, J.M.; Xu, R.; Honerkamp-Smith, G. Prevalence of fetal alcohol spectrum disorders in 4 US communities. JAMA 2018, 319, 474–482. [Google Scholar] [CrossRef]
- Lange, S.; Probst, C.; Gmel, G.; Rehm, J.; Burd, L.; Popova, S. Global prevalence of fetal alcohol spectrum disorder among children and youth: A systematic review and meta-analysis. JAMA Pediatr. 2017, 171, 948–956. [Google Scholar] [CrossRef]
- Hoyme, H.E.; Kalberg, W.O.; Elliott, A.J.; Blankenship, J.; Buckley, D.; Marais, A.-S.; Manning, M.A.; Robinson, L.K.; Adam, M.P.; Abdul-Rahman, O. Updated clinical guidelines for diagnosing fetal alcohol spectrum disorders. Pediatr. 2016, 138, e20154256. [Google Scholar] [CrossRef] [PubMed]
- Rangmar, J.; Hjern, A.; Vinnerljung, B.; Strömland, K.; Aronson, M.; Fahlke, C. Psychosocial outcomes of fetal alcohol syndrome in adulthood. Pediatrics 2015, 135, e52–e58. [Google Scholar] [CrossRef] [PubMed]
- Govindugari, V.L.; Golla, S.; Reddy, S.D.M.; Chunduri, A.; Nunna, L.S.; Madasu, J.; Shamshabad, V.; Bandela, M. and Suryadevara, V. Thwarting Alzheimer’s Disease through Healthy Lifestyle Habits: Hope for the Future. Neurol. Int. 2023, 15, 162–187. [Google Scholar] [CrossRef] [PubMed]
- Edinoff, A.N.; Nix, C.A.; Hollier, J.; Sagrera, C.E.; Delacroix, B.M.; Abubakar, T.; Cornett, E.M.; Kaye, A.M.; Kaye, A.D. Benzodiazepines: Uses, Dangers, and Clinical Considerations. Neurol. Int. 2021, 13, 594–607. [Google Scholar] [CrossRef]
- Alfonso-Loeches, S.; Pascual-Lucas, M.; Blanco, A.M.; Sanchez-Vera, I.; Guerri, C. Pivotal role of TLR4 receptors in alcohol-induced neuroinflammation and brain damage. J. Neurosci. 2010, 30, 8285–8295. [Google Scholar] [CrossRef]
- Andersen, S.L. Trajectories of brain development: Point of vulnerability or window of opportunity? Neurosci. Biobehav. Rev. 2003, 27, 3–18. [Google Scholar] [CrossRef]
- Roebuck, T.M.; Simmons, R.W.; Mattson, S.N.; Riley, E.P. Prenatal exposure to alcohol affects the ability to maintain postural balance. Alcohol. Clin. Exp. Res. 1998, 22, 252–258. [Google Scholar] [CrossRef]
- Kyllerman, M.; Aronson, M.; Sabel, K.; Karlberg, E.; Sandin, B.; Olegård, R. Children of alcoholic mothers: Growth and motor performance compared to matched controls. Acta Pædiatrica 1985, 74, 20–26. [Google Scholar] [CrossRef]
- Barr, H.M.; Streissguth, A.P.; Darby, B.L.; Sampson, P.D. Prenatal exposure to alcohol, caffeine, tobacco, and aspirin: Effects on fine and gross motor performance in 4-year-old children. Dev. Psychol. 1990, 26, 339. [Google Scholar] [CrossRef]
- Autti-Rämö, I.; Granström, M.-L. The psychomotor development during the first year of life of infants exposed to intrauterine alcohol of various duration*-fetal alcohol exposure and development. Neuropediatrics 1991, 22, 59–64. [Google Scholar] [CrossRef] [PubMed]
- Forrest, F.; Florey, C.D.; Taylor, D.; McPherson, F.; Young, J.A. Reported social alcohol consumption during pregnancy and infants’ development at 18 months. Br. Med. J. 1991, 303, 22–26. [Google Scholar] [CrossRef] [PubMed]
- Marcus, J.C. Neurological findings in the fetal alcohol syndrome. Neuropediatrics 1987, 18, 158–160. [Google Scholar] [CrossRef]
- Olegård, R.; Sabel, K.; Aronsson, M.; Sandin, B.; Johansson, P.R.; Carlsson, C.; Kyllerman, M.; Iversen, K.; Hrbek, A. Effects on the child of alcohol abuse during pregnancy: Retrospective and prospective studies. Acta Paediatr. 1979, 68, 112–121. [Google Scholar] [CrossRef] [PubMed]
- Conry, J. Neuropsychological deficits in fetal alcohol syndrome and fetal alcohol effects. Alcohol. Clin. Exp. Res. 1990, 14, 650–655. [Google Scholar] [CrossRef] [PubMed]
- Dursun, I.; Jakubowska-Doǧru, E.; Uzbay, T. Effects of prenatal exposure to alcohol on activity, anxiety, motor coordination, and memory in young adult Wistar rats. Pharmacol. Biochem. Behav. 2006, 85, 345–355. [Google Scholar] [CrossRef]
- Norman, A.L.; Crocker, N.; Mattson, S.N.; Riley, E.P. Neuroimaging and fetal alcohol spectrum disorders. Dev. Disabil. Res. Rev. 2009, 15, 209–217. [Google Scholar] [CrossRef]
- Mattson, S.N.; Riley, E.P.; Jernigan, T.L.; Garcia, A.; Kaneko, W.M.; Ehlers, C.L.; Jones, K.L. A decrease in the size of the basal ganglia following prenatal alcohol exposure: A preliminary report. Neurotoxicol. Teratol. 1994, 16, 283–289. [Google Scholar] [CrossRef]
- Napper, R.M.A.; West, J.R. Permanent neuronal cell loss in the cerebellum of rats exposed to continuous low blood alcohol levels during the brain growth spurt: A stereological investigation. J. Comp. Neurol. 1995, 362, 283–292. [Google Scholar] [CrossRef]
- Maier, S.E.; Miller, J.A.; Blackwell, J.M.; West, J.R. Fetal alcohol exposure and temporal vulnerability: Regional differences in cell loss as a function of the timing of binge-like alcohol exposure during brain development. Alcohol. Clin. Exp. Res. 1999, 23, 726–734. [Google Scholar] [CrossRef] [PubMed]
- Crawley, J.N.; Paylor, R. A proposed test battery and constellations of specific behavioral paradigms to investigate the behavioral phenotypes of transgenic and knockout mice. Horm. Behav. 1997, 31, 197–211. [Google Scholar] [CrossRef]
- Brown, R.E. Behavioural phenotyping of transgenic mice. Can. J. Exp. Psychol. Can. Psychol. Exp. 2007, 61, 328. [Google Scholar] [CrossRef]
- Gallo, P.V.; Weinberg, J. Neuromotor development and response inhibition following prenatal ethanol exposure. Neurobehav. Toxicol. Teratol. 1982, 4, 502–513. [Google Scholar]
- Hellemans, K.G.C.; Verma, P.; Yoon, E.; Yu, W.K.; Young, A.H.; Weinberg, J. Prenatal alcohol exposure and chronic mild stress differentially alter depressive-and anxiety-like behaviors in male and female offspring. Alcohol. Clin. Exp. Res. 2010, 34, 633–645. [Google Scholar] [CrossRef] [PubMed]
- Osborn, J.A.; Kim, C.K.; Steiger, J.; Weinberg, J. Prenatal ethanol exposure differentially alters behavior in males and females on the elevated plus maze. Alcohol. Clin. Exp. Res. 1998, 22, 685–696. [Google Scholar] [CrossRef] [PubMed]
- Tran, T.D.; Cronise, K.; Marino, M.D.; Jenkins, W.J.; Kelly, S.J. Critical periods for the effects of alcohol exposure on brain weight, body weight, activity and investigation. Behav. Brain Res. 2000, 116, 99–110. [Google Scholar] [CrossRef] [PubMed]
- Berman, R.F.; Hannigan, J.H. Effects of prenatal alcohol exposure on the hippocampus: Spatial behavior, electrophysiology, and neuroanatomy. Hippocampus 2000, 10, 94–110. [Google Scholar] [CrossRef]
- Kleiber, M.L.; Wright, E.; Singh, S.M. Maternal voluntary drinking in C57BL/6J mice: Advancing a model for fetal alcohol spectrum disorders. Behav. Brain Res. 2011, 223, 376–387. [Google Scholar] [CrossRef]
- Feierman, D.E.; Cederbaum, A.I. Oxidation of the alcohol dehydrogenase inhibitor pyrazole to 4-hydroxypyrazole by microsomes. Effect of cytochrome P-450 inducing agents. Drug Metab. Dispos. 1987, 15, 634–639. [Google Scholar]
- Feather-Schussler, D.N.; Ferguson, T.S. A battery of motor tests in a neonatal mouse model of cerebral palsy. J. Vis. Exp. 2016, 2016, 53569. [Google Scholar] [CrossRef]
- Amendola, J.; Verrier, B.; Roubertoux, P.; Durand, J. Altered sensorimotor development in a transgenic mouse model of amyotrophic lateral sclerosis. Eur. J. Neurosci. 2004, 20, 2822–2826. [Google Scholar] [CrossRef] [PubMed]
- Seibenhener, M.L.; Wooten, M.C. Use of the open field maze to measure locomotor and anxiety-like behavior in mice. J. Vis. Exp. 2015, 96, e52434. [Google Scholar] [CrossRef]
- El Fari, R.; Abbaoui, A.; Bourziq, A.; Zroudi, M.; Draoui, A.; El Khiat, A.; Belkouch, M.; Elgot, A.; Gamrani, H. Neuroprotective effects of docosahexaenoic acid against sub-acute manganese intoxication induced dopaminergic and motor disorders in mice. J. Chem. Neuroanat. 2019, 102, 101686. [Google Scholar] [CrossRef] [PubMed]
- Swain, M.G.; Beck, P.; Rious, K.; Le, T. Augmented interleukin-1β-induced depression of locomotor activity in cholestatic rats. Hepatology 1998, 28, 1561–1565. [Google Scholar] [CrossRef] [PubMed]
- Carter, R.J.; Morton, J.; Dunnett, S.B. Motor Coordination and Balance in Rodents. Curr. Protoc. Neurosci. 2001, 15, 8–12. [Google Scholar] [CrossRef] [PubMed]
- Deacon, R.M.J. Measuring motor coordination in mice. J. Vis. Exp. 2013, 15, e2609. [Google Scholar] [CrossRef]
- Adeniyi, P.A.; Ishola, A.O.; Laoye, B.J.; Olatunji, B.P.; Bankole, O.O.; Shallie, P.D.; Ogundele, O.M. Neural and behavioural changes in male periadolescent mice after prolonged nicotine-MDMA treatment. Metab. Brain Dis. 2016, 31, 93–107. [Google Scholar] [CrossRef]
- Chappell, T.D.; Margret, C.P.; Li, C.X.; Waters, R.S. Long-term effects of prenatal alcohol exposure on the size of the whisker representation in juvenile and adult rat barrel cortex. Alcohol 2007, 41, 239–251. [Google Scholar] [CrossRef]
- Margret, C.P.; Li, C.X.; Elberger, A.J.; Matta, S.G.; Chappell, T.D.; Waters, R.S. Prenatal alcohol exposure alters the size, but not the pattern, of the whisker representation in neonatal rat barrel cortex. Exp. Brain Res. 2005, 165, 167–178. [Google Scholar] [CrossRef]
- May, P.A.; Hamrick, K.J.; Corbin, K.D.; Hasken, J.M.; Marais, A.S.; Brooke, L.E.; Blankenship, J.; Hoyme, H.E.; Gossage, J.P. Dietary intake, nutrition, and fetal alcohol spectrum disorders in the Western Cape Province of South Africa. Reprod. Toxicol. 2014, 46, 31–39. [Google Scholar] [CrossRef] [PubMed]
- Abbott, C.W.; Kozanian, O.O.; Kanaan, J.; Wendel, K.M.; Huffman, K.J. The Impact of Prenatal Ethanol Exposure on Neuroanatomical and Behavioral Development in Mice. Alcohol. Clin. Exp. Res. 2016, 40, 122–133. [Google Scholar] [CrossRef] [PubMed]
- Middaugh, L.D.; Randall, C.L.; Favara, J.P. Prenatal ethanol exposure in C57 mice: Effects on pregnancy and offspring development. Neurotoxicol. Teratol. 1988, 10, 175–180. [Google Scholar] [CrossRef] [PubMed]
- Hausknecht, K.; Haj-Dahmane, S.; Shen, Y.L.; Vezina, P.; Dlugos, C.; Shen, R.Y. Excitatory synaptic function and plasticity is persistently altered in ventral tegmental area dopamine neurons after prenatal ethanol exposure. Neuropsychopharmacology 2015, 40, 893–905. [Google Scholar] [CrossRef] [PubMed]
- Savage, D.D.; Becher, M.; De la Torre, A.J.; Sutherland, R.J. Dose-dependent effects of prenatal ethanol exposure on synaptic plasticity and learning in mature offspring. Alcohol. Clin. Exp. Res. 2002, 26, 1752–1758. [Google Scholar] [CrossRef] [PubMed]
- Cullen, C.L.; Burne, T.H.J.; Lavidis, N.A.; Moritz, K.M. Low dose prenatal alcohol exposure does not impair spatial learning and memory in two tests in adult and aged rats. PLoS ONE 2014, 9, e101482. [Google Scholar] [CrossRef]
- Choi, I.Y.; Allan, A.M.; Cunningham, L.A. Moderate fetal alcohol exposure impairs the neurogenic response to an enriched environment in adult mice. Alcohol. Clin. Exp. Res. 2005, 29, 2053–2062. [Google Scholar] [CrossRef]
- Brady, M.L.; Allan, A.M.; Caldwell, K.K. A Limited Access Mouse Model of Prenatal Alcohol Exposure that Produces Long-Lasting Deficits in Hippocampal-Dependent Learning and Memory. Alcohol. Clin. Exp. Res. 2012, 36, 457–466. [Google Scholar] [CrossRef]
- Barbier, E.; Houchi, H.; Warnault, V.; Pierrefiche, O.; Daoust, M.; Naassila, M. Effects of prenatal and postnatal maternal ethanol on offspring response to alcohol and psychostimulants in long evans rats. Neuroscience 2009, 161, 427–440. [Google Scholar] [CrossRef]
- Allan, A.M.; Chynoweth, J.; Tyler, L.A.; Caldwell, K.K. A Mouse Model of Prenatal Ethanol Exposure Using a Voluntary Drinking Paradigm. Alcohol. Clin. Exp. Res. 2003, 27, 2009–2016. [Google Scholar] [CrossRef]
- Cantacorps, L.; Alfonso-Loeches, S.; Moscoso-Castro, M.; Cuitavi, J.; Gracia-Rubio, I.; López-Arnau, R.; Escubedo, E.; Guerri, C.; Valverde, O. Maternal alcohol binge drinking induces persistent neuroinflammation associated with myelin damage and behavioural dysfunctions in offspring mice. Neuropharmacology 2017, 123, 368–384. [Google Scholar] [CrossRef] [PubMed]
- Mohammad, S.; Page, S.J.; Wang, L.; Ishii, S.; Li, P.; Sasaki, T.; Basha, A.; Salzberg, A.; Quezado, Z.; Imamura, F.; et al. Kcnn2 blockade reverses learning deficits in a mouse model of fetal alcohol spectrum disorders. Nat. Neurosci. 2020, 23, 533–543. [Google Scholar] [CrossRef] [PubMed]
- Heck, D.H.; Roy, S.; Xie, N.; Waters, R.S. Prenatal alcohol exposure delays acquisition and use of skilled reaching movements in juvenile rats. Physiol. Behav. 2008, 94, 540–544. [Google Scholar] [CrossRef] [PubMed]
- Servais, L.; Hourez, R.; Bearzatto, B.; Gall, D.; Schiffmann, S.N.; Cheron, G. Purkinje cell dysfunction and alteration of long-term synaptic plasticity in fetal alcohol syndrome. Proc. Natl. Acad. Sci. USA 2007, 104, 9858–9863. [Google Scholar] [CrossRef] [PubMed]
- Marzban, H.; Del Bigio, M.R.; Alizadeh, J.; Ghavami, S.; Zachariah, R.M.; Rastegar, M. Cellular commitment in the developing cerebellum. Front. Cell. Neurosci. 2015, 8, e450. [Google Scholar] [CrossRef] [PubMed]
- Parnell, S.E.; O’Leary-Moore, S.K.; Godin, E.A.; Dehart, D.B.; Johnson, B.W.; Allan Johnson, G.; Styner, M.A.; Sulik, K.K. Magnetic resonance microscopy defines ethanol-induced brain abnormalities in prenatal mice: Effects of acute insult on gestational day 8. Alcohol. Clin. Exp. Res. 2009, 33, 1001–1011. [Google Scholar] [CrossRef]
- Pierce, D.R.; Goodlett, C.R.; West, J.R. Differential neuronal loss following early postnatal alcohol exposure. Teratology 1989, 40, 113–126. [Google Scholar] [CrossRef]


Disclaimer/Publisher’s Note: The statements, opinions and data contained in all publications are solely those of the individual author(s) and contributor(s) and not of MDPI and/or the editor(s). MDPI and/or the editor(s) disclaim responsibility for any injury to people or property resulting from any ideas, methods, instructions or products referred to in the content. |
© 2023 by the authors. Licensee MDPI, Basel, Switzerland. This article is an open access article distributed under the terms and conditions of the Creative Commons Attribution (CC BY) license (https://creativecommons.org/licenses/by/4.0/).
Share and Cite
Smimih, K.; El-Mansoury, B.; Saad, F.E.-Z.; Khanouchi, M.; El Amine, S.; Aimrane, A.; Zouhairi, N.; Ferssiwi, A.; Bitar, A.; Merzouki, M.; et al. Sensory Motor Function Disturbances in Mice Prenatally Exposed to Low Dose of Ethanol: A Neurobehavioral Study in Postnatal and Adult Stages. Neurol. Int. 2023, 15, 580-594. https://doi.org/10.3390/neurolint15020036
Smimih K, El-Mansoury B, Saad FE-Z, Khanouchi M, El Amine S, Aimrane A, Zouhairi N, Ferssiwi A, Bitar A, Merzouki M, et al. Sensory Motor Function Disturbances in Mice Prenatally Exposed to Low Dose of Ethanol: A Neurobehavioral Study in Postnatal and Adult Stages. Neurology International. 2023; 15(2):580-594. https://doi.org/10.3390/neurolint15020036
Chicago/Turabian StyleSmimih, Kamal, Bilal El-Mansoury, Fatima Ez-Zahraa Saad, Manal Khanouchi, Souad El Amine, Abdelmohcine Aimrane, Nadia Zouhairi, Abdessalam Ferssiwi, Abdelali Bitar, Mohamed Merzouki, and et al. 2023. "Sensory Motor Function Disturbances in Mice Prenatally Exposed to Low Dose of Ethanol: A Neurobehavioral Study in Postnatal and Adult Stages" Neurology International 15, no. 2: 580-594. https://doi.org/10.3390/neurolint15020036