Article

A Two-Stage Pillar Feature-Encoding Network for Pillar-Based 3D Object Detection

1
School of Electrical Engineering and Automation, Anhui University, Hefei 230601, China
2
Hefei Institutes of Physical Science, Chinese Academy of Sciences, Hefei 230031, China
*
Author to whom correspondence should be addressed.
World Electr. Veh. J. 2023, 14(6), 146; https://doi.org/10.3390/wevj14060146
Submission received: 6 May 2023 / Revised: 1 June 2023 / Accepted: 2 June 2023 / Published: 3 June 2023
(This article belongs to the Special Issue Recent Advance in Intelligent Vehicle)

Abstract

:
Three-dimensional object detection plays a vital role in the field of environment perception in autonomous driving, and its results are crucial for the subsequent processes. Pillar-based 3D object detection is a method to detect objects in 3D by dividing point cloud data into pillars and extracting features from each pillar. However, the current pillar-based 3D object-detection methods suffer from problems such as “under-segmentation” and false detections in overlapping and occluded scenes. To address these challenges, we propose an improved pillar-based 3D object-detection network with a two-stage pillar feature-encoding (Ts-PFE) module that considers both inter- and intra-relational features among and in the pillars. This novel approach enhances the model’s ability to identify the local structure and global distribution of the data, which improves the distinction between objects in occluded and overlapping scenes and ultimately reduces under-segmentation and false detection problems. Furthermore, we use the attention mechanism to improve the backbone and make it focus on important features. The proposed approach is evaluated on the KITTI dataset. The experimental results show that the detection accuracy of the proposed approach are significantly improved on the benchmarks of BEV and 3D. The improvement of AP for car, pedestrian, and cyclist 3D detection are 1.1%, 3.78%, and 2.23% over PointPillars.

1. Introduction

With expanding application scenarios such as autonomous driving, intelligent robotics, and virtual reality, 3D object-detection technology has emerged as an important research direction in the realm of computer vision [1]. The main task of point cloud 3D object detection is to detect various objects, such as cars, pedestrians, and cyclists, from 3D point cloud data [2]. Unlike traditional image-based object detection, point cloud 3D object detection needs to deal with disordered point cloud data and consider the 3D information of the objects [3,4]. Therefore, the key challenge of this task is how to extract the information concerned, such as the object’s position, size, orientation, and so on, from the point cloud data [5]. To solve this problem, researchers usually employ deep learning techniques to build point cloud 3D object-detection models and optimize the performance of the models by training on a large amount of point cloud data [6,7].
Regarding point cloud representation methods, current 3D object -detection techniques can be divided into three categories: range image-based, point-based, and voxel-based methods [8]. The range image-based method is a technique that involves the projection of point cloud data onto a plane to generate a depth image, which is then utilized for object detection. This method can process large-scale point cloud data efficiently and be easily integrated with 2D image-processing algorithms. Nevertheless, at greater distances or lower resolutions, this method may be prone to inaccuracies [9,10]. The point-based methods, represented by PointNet [11], directly process the raw data and treat the point cloud as a disordered set of points. It processes each point independently, then aggregates the features of the points to obtain the entire point cloud’s feature representation. The improved PointNet++ [12] can better manage point cloud local information. However, processing all point clouds leads to a huge computation complexity and high hardware requirements. In contrast, the voxel-based method first converts the point cloud data into a 3D voxel grid form, then processes and extracts the features of each voxel [13]. The pillar-based method is a special voxel-based method which simplifies voxels further by disregarding the z dimension, thereby turning the 3D problem into a 2D problem and reducing the computation complexity to a certain extent. However, it leads to a loss of information, such as the features of spatial location and relative position of each element [14]. PointPillars [15] is a typical 3D object-detection network of a pillar-based method which relies solely on point-wise aggregated features to represent pillar characteristics. This approach fails to accurately represent the features of the pillar itself and the relationship between pillars and the entire point cloud. This absence may give rise to several challenges. Firstly, in the presence of mutually occluded and overlapping objects, it could lead to the under-segmentation phenomenon, where the pillars of distinct objects are incorrectly classified as belonging to the same entity [16]. Secondly, these issues could significantly undermine the accuracy and reliability of object detection and localization, leading to missed or false detection [17]. Additionally, changes of the relative relationships between the pillars and the overall point cloud in different datasets or scenarios can lead to the increased instability of detection results [18]. Therefore, it is crucial to consider the features of the pillar itself and the relationship between the pillars and the overall point cloud.
In this paper, we propose an improved pillar-based network for 3D object detection based on pillars. It comprises three essential components: the pillar feature-encoding module, a backbone consisting of a region proposal network (RPN), squeeze-and-excitation networks (SeNet) for feature extraction, and a head for 3D boxes’ regression.For pillar feature encoding, we propose a two-stage pillar feature-encoding (Ts-PFE) module that considers both inter- and intra-relational features among and in the pillars which can help the model better understand the spatial location and relative position of each pillar. On one hand, the model can better identify the local structure and global distribution of the pillars, thus improving the distinction between objects and reducing the under-segmentation phenomenon that arises in the presence of mutually occluded and overlapping objects. On the other hand, more accurate detection and localization can alleviate the issue of missed and false detections. Moreover, the stability and generalization capabilities of the model in different datasets or scenarios are enhanced. Additionally, we have incorporated SeNet into the backbone module for improved performance. This module enhances key features in pseudo-images and suppresses irrelevant features through attention mechanism, thereby bolstering the network’s ability to extract important features of objects for detection.
The experimental evaluation on the KITTI dataset demonstrates the effectiveness of the proposed approach. Specifically, our method achieves significant improvements in object-detection performance while reducing under-segmentation problems in occluded and overlapping scenes. Our contributions can be summarized as follows:
  • To solve the problem of under-segmentation due to missing features, compared with other pillar-based approaches that only consider the intra-relational features, we propose Ts-PFE, a feature-encoding network which considers both inter- and intra-relational features among and in the pillars. It improves the distinction between objects and reduces the under-segmentation problems in occluded and overlapping scenes.
  • We improved the backbone by integrating SeNet, enhancing key features in pseudo-images, and suppressing irrelevant information to enhance the network’s ability to extract important features of objects to be detected. By leveraging the power of SeNet, the proposed approach exhibits superior performance in object detection compared to prior works.
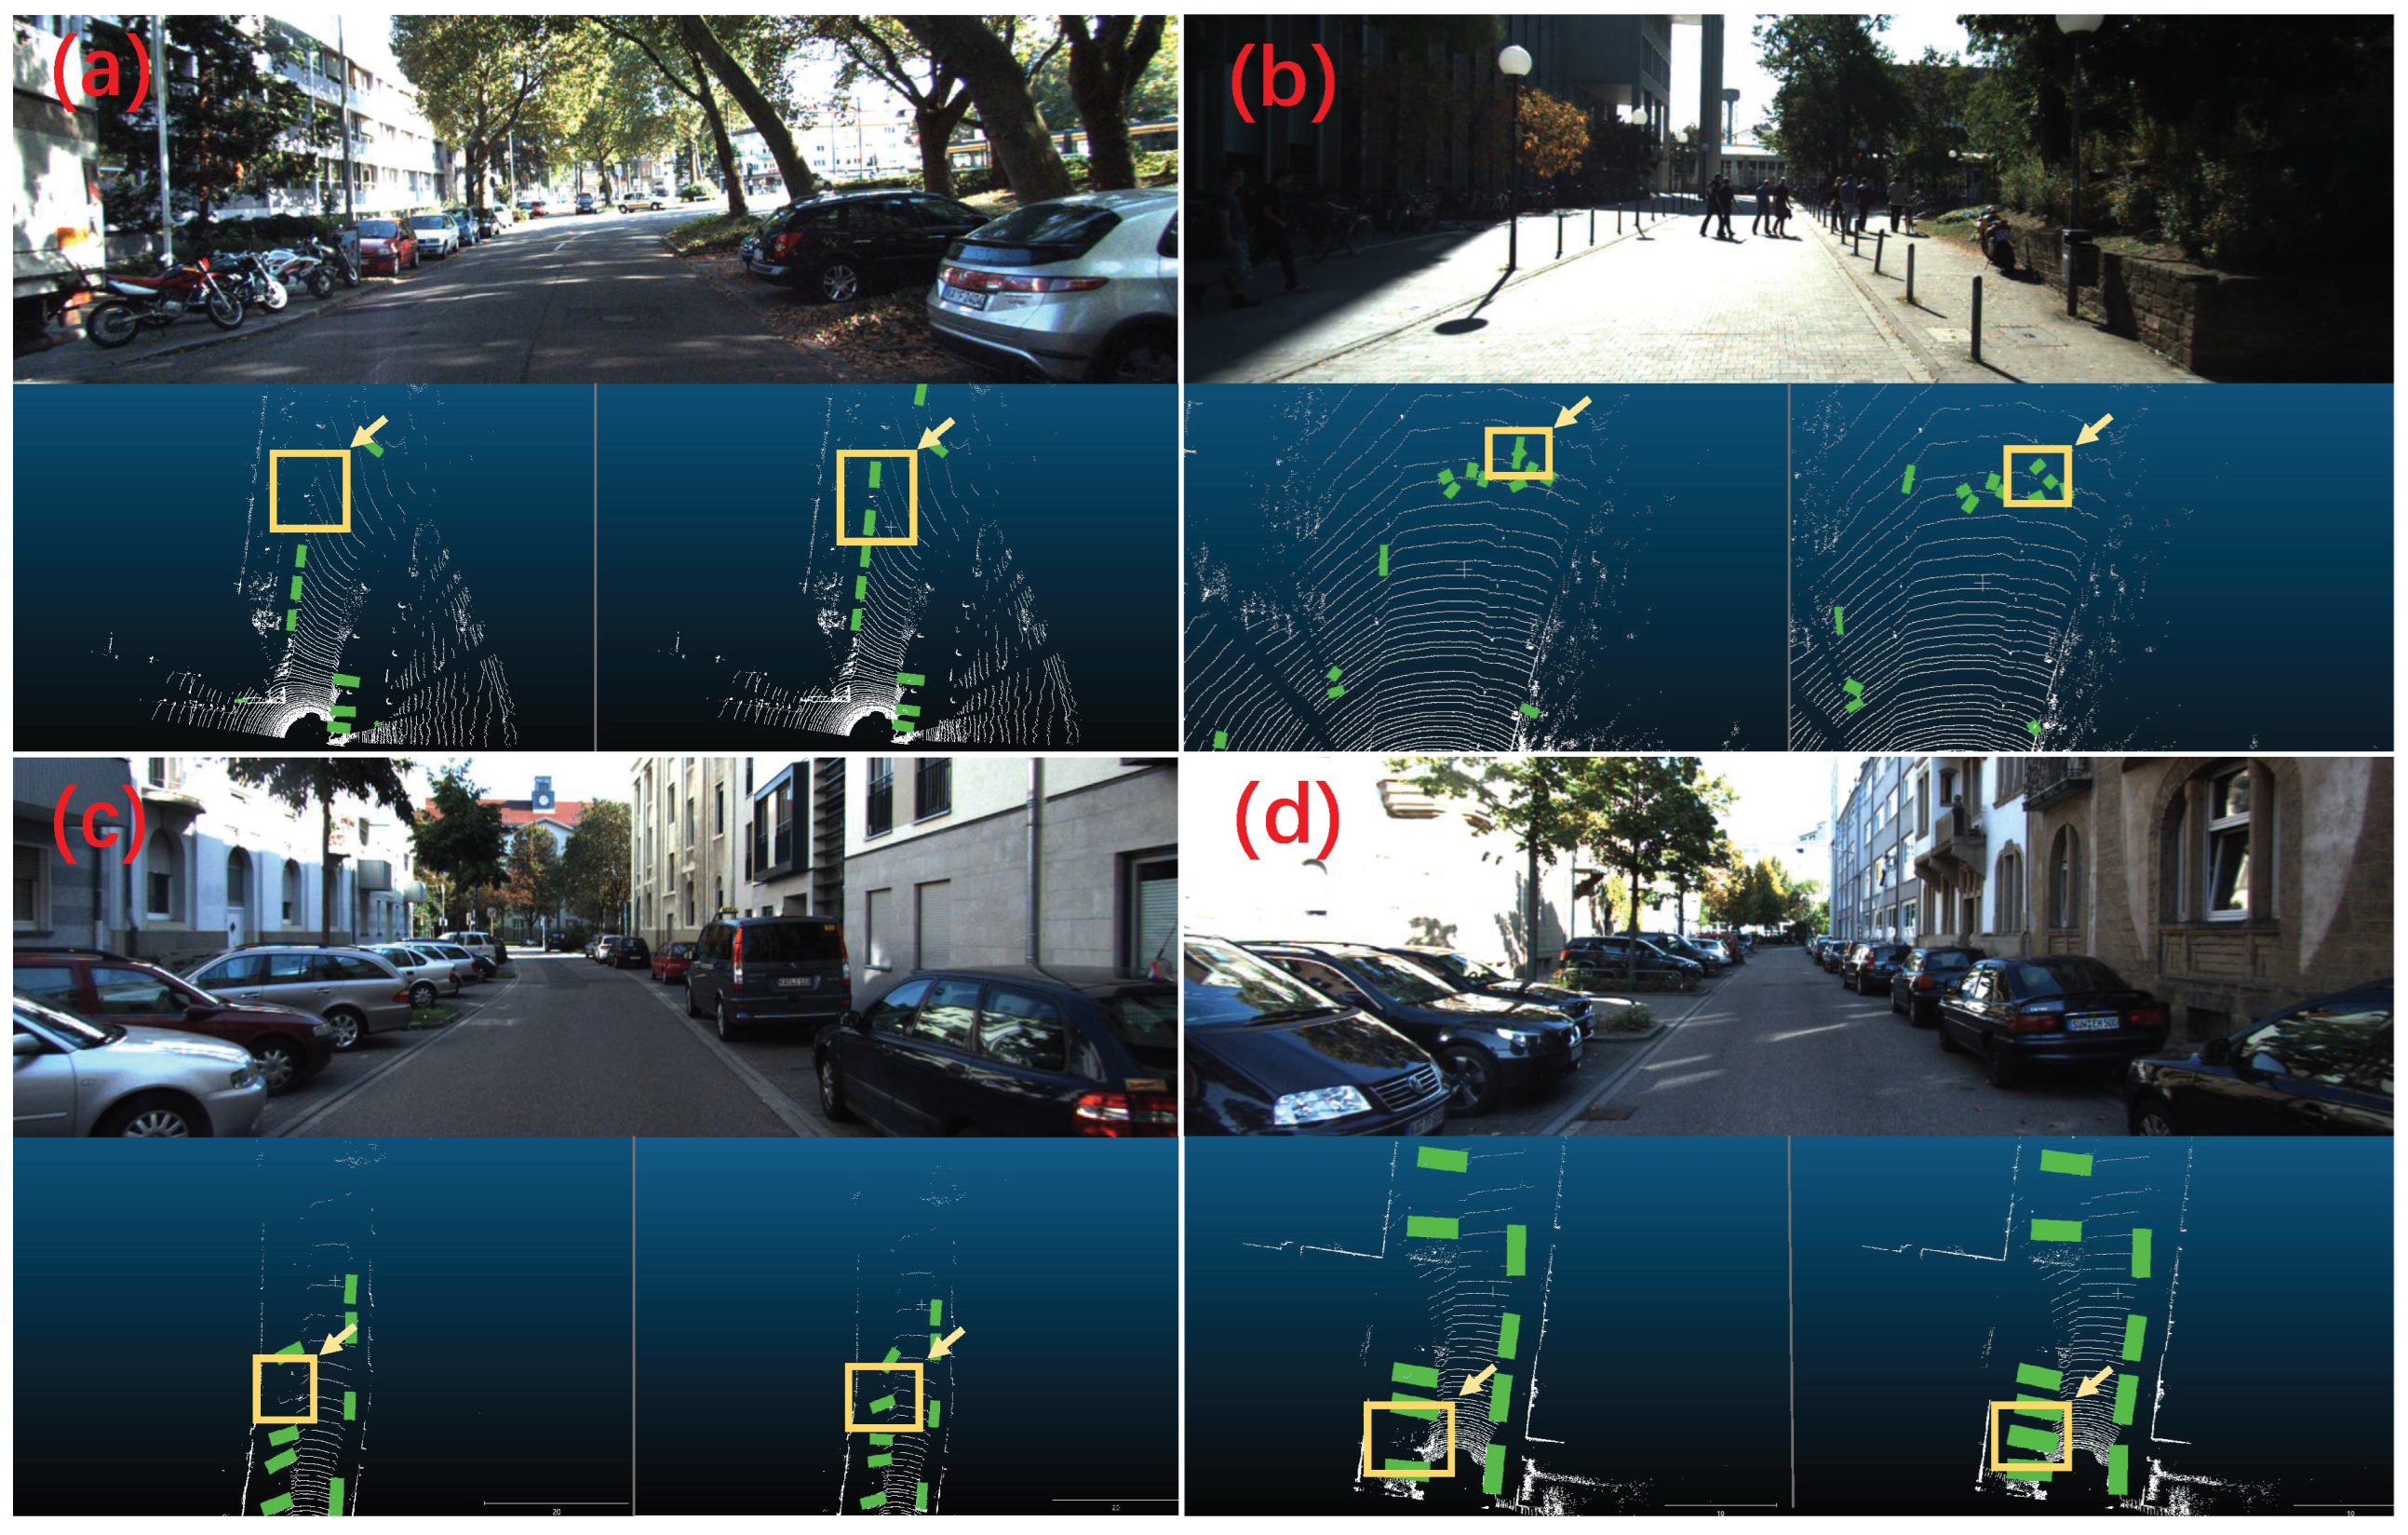
  • Evaluated on the KITTI dataset, the experiments show that the detection accuracy of the proposed approach are significantly improved; the improvement of AP for car, pedestrian, and cyclist 3D detection are 1.1%, 3.78%, and 2.23% over the baseline. The results of qualitative evaluation show that the under-segmentation problem is reduced in the occlusion and overlapping scenes.

2. Related Work

2.1. 3D Object Detection from Point Cloud Based on Voxel/Pillar

In recent years, voxel- and pillar-based methods have been widely developed and applied. These methods first transform the point cloud into fixed-shaped voxels or pillars, followed by feature extraction using 2D/3D convolution, and then implement object-detection tasks through classification and regression [19]. This approach provides significant computational advantages over processing each point individually, making it particularly suitable for real-time applications such as autonomous driving [15]. VoxelNet [13] is among the pioneering works in this field, which innovatively uses voxel feature encoding (VFE) and 3D convolution to encode and extract features from the voxels. However, the huge number of voxels lead to a large computation of 3D convolution and a slow inference speed. To address this issue, SECOND [20] proposed 3D sparse convolution to accelerate the training and inference process by eliminating the empty voxels. Despite its improved efficiency, sparse convolution is not deployment friendly. PointPillars [15], instead of using the traditional voxel-based method, simplify the voxel representation by generating a pseudo-image that can be processed by 2D convolution neural networks. This approach has efficient computational performance and became one of the dominant methods in practice. More recently, CenterPoint [21] was proposed, which converts the point cloud into a voxel network, predicts the object center, size, and orientation at the center of each voxel, and uses a 2D convolutional network to extract local features, which achieves a good balance between accuracy and speed, and can also handle small targets with high detection accuracy.
The voxel/pillar-based algorithm, while effective in some regards, has some notable limitations [19]. First, the uniform voxelization method can result in a loss of point cloud information and uneven sampling [22]. Secondly, when dealing with some small objects or dense point cloud, there may be a high rate of false detection and missed detection [23]. In addition, ignoring the relationship between the local and the global feature can lead to the under-segmentation issue [24]. To overcome these limitations, several improvements have been proposed, including improvements to voxelization methods, attention mechanisms, multi-scale features, and data-enhancement methods. For instance, in SCNet [25], each grid is divided into smaller sub-grids to preserve more point cloud information and alleviate the under- and over-segmentation. SA-Det3D [26] proposes two variants of self-attention for contextual modeling in 3D object detection by adding convolutional features and self-attentive features to model in 3D object detection. PV-RCNN [27] uses a voxel feature-encoding network to extract features of voxels, and then fuses the voxel features with point cloud features, which can better handle objects of different sizes and shapes.

2.2. Attention Mechanisms in Object Detection

As a crucial technique in neural networks, the attention mechanism has been heavily employed in computer vision, including tasks such as classification, detection, and segmentation [28]. Through this mechanism, the attention of the network is directed to key details and focusing more on the region or feature of interest, thus improving detection accuracy and robustness [29].
The attention mechanism has also been widely applied in the field of point cloud object detection. The commonly used methods are channel attention, spatial attention, and their combination. Spatial attention allows the network to prioritize information from certain locations in the point cloud, while channel attention means that the network can pay more attention to the features of certain channels [30]. The self-attention method [31], transformer [32], and SeNet [33], etc., are other types of attention mechanisms. Ref. [34] delves into the role of attention mechanisms in 3D point cloud object detection and shows that self-attention modules are not preferable in processing 3D point cloud data, and that SE and CBAM enable the effectiveness and efficiency of 3D point cloud feature refinement. In [35], three modified attention mechanisms (SOCA, SOPA, and SAPI) are used to improve the effectiveness of feature extraction. Ref. [26] proposed two self-attention variants, FSA and DSA, for contextual modeling in 3D object detection, incorporating convolutional and self-attentive features in the model. Moreover, the attention mechanism can be used for point cloud segmentation, as seen in [36], where the network structure is based on the point-attention mechanism, effectively improving point cloud segmentation performance.

3. Our Approach

In this section, we introduce our approach, the pillar-based 3D object-detection network using a two-stage feature encoding module. The network architecture is illustrated in Figure 1. It comprises three components: the pillar feature-encoding module, a backbone which contains RPN and SeNet for feature extraction, and a head for 3D boxes’ regression.We provide a detailed description of each block in the remainder of this section.

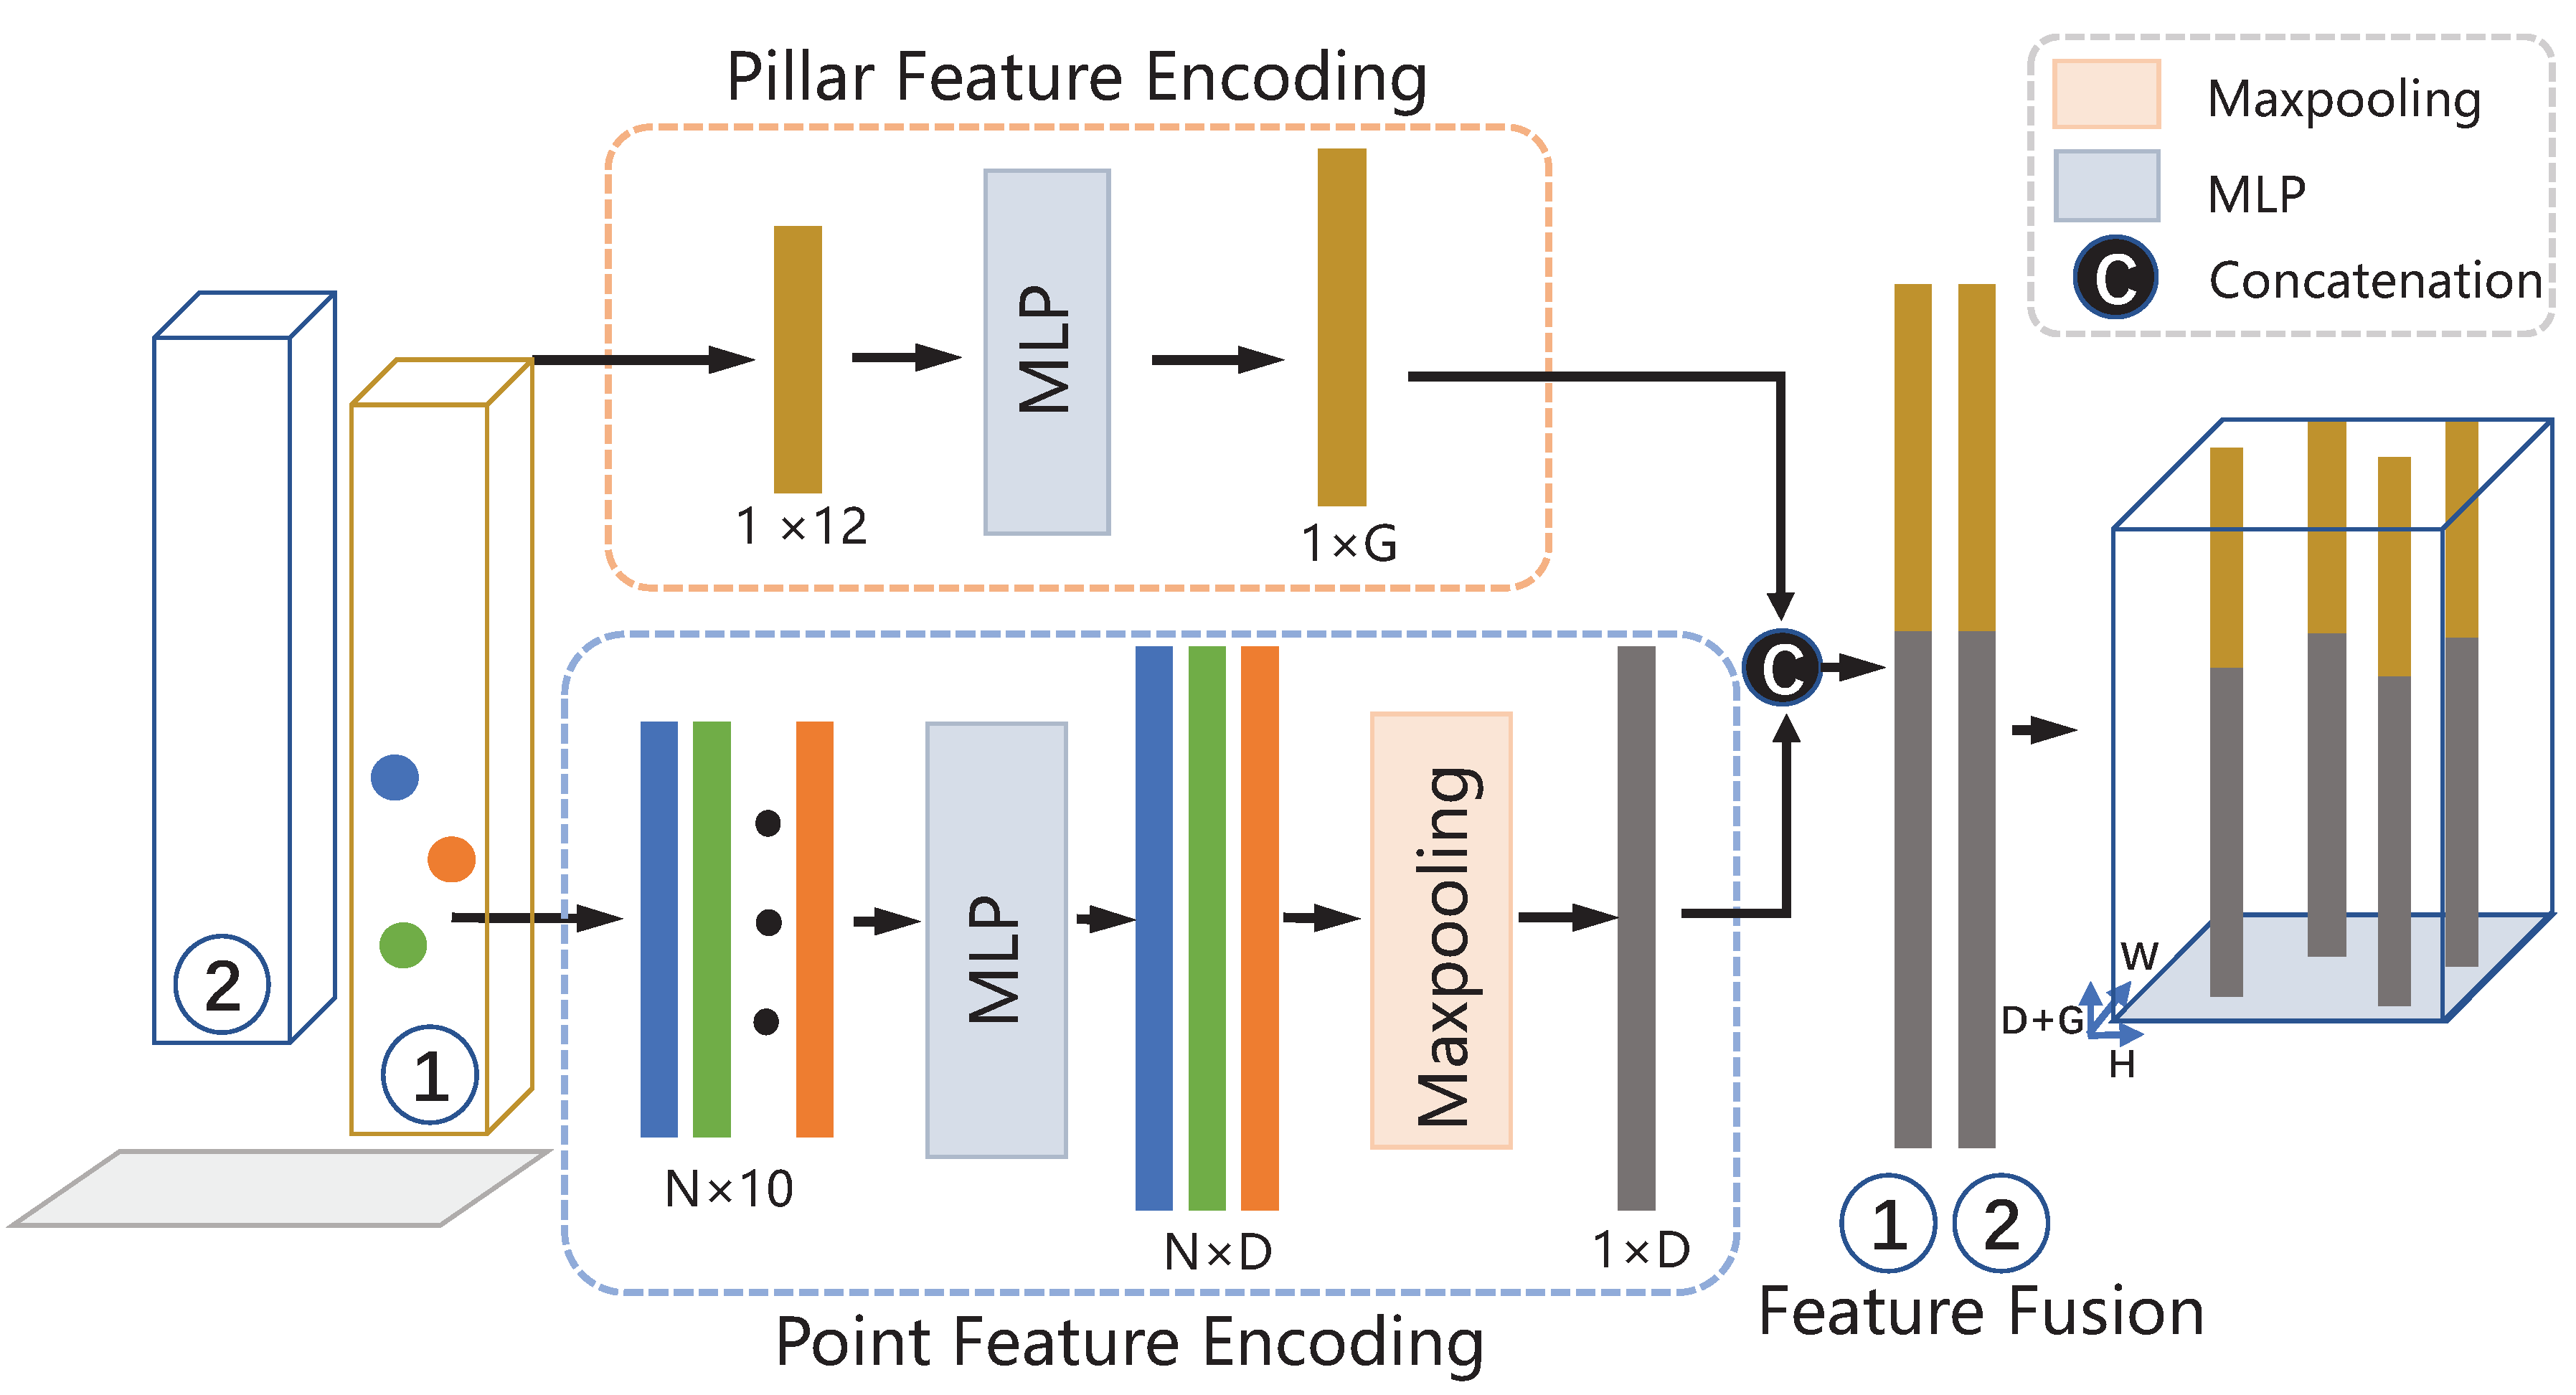
3.1. Two-Stage Pillar Feature Encoding

The voxel and pillar encoding approach has significantly impacted the development of 3D object detection based on point cloud by redefining the organization and processing of point clouds. By employing aggregated features to characterize voxel and pillar features, it has substantially reduced computational requirements while increasing operational speed [13]. However, this approach has a limitation; it only captures local features, failing to accurately represent the features of the pillar itself and the relationship between pillars and the entire point cloud [15]. In this paper, we propose a novel two-stage pillar feature-encoding (Ts-PFE) module as a solution to this issue. It considers both inter- and intra-relational features among and in the pillars, which can help the model better identify the local structure and global distribution of the pillars, thus improving the distinction between objects and reducing the under-segmentation problems in the presence of mutually occluded and overlapping objects. In addition, more accurate detection and localization can reduce the problems of missed and false detections. Furthermore, the inclusion of a wider range of features enhances the model’s expressiveness and generalization capabilities. As shown in Figure 2, the proposed Ts-PFE module consists of three units: (1) the point feature-encoding unit, (2) the pillar feature-encoding unit, (3) the feature-fusion unit.
We first pillarize the point cloud data by considering only the X , Y direction and ignoring the information in the Z axis direction. Specifically, the point cloud P in 3D space has a range of L , W , and H along the X , Y , and Z axes, and is divided into a set of pillars of size v L , v W , and H. Each pillar is represented by v = { p i = x i , y i , z i , r i R N × 4 } . x i , y i , and z i denote the coordinates of each point along X, Y, and Z axes, respectively, while r i represents the laser reflection intensity.

3.1.1. Point Feature Encoding

In this unit, we aggregate the features of the points to represent the features of the pillars. First, the four-dimensional feature vector of the points is expanded to a ten-dimensional vector, p i n = { x i , y i , z i , r i , x i c , y i c , z i c , x i p , y i p , z i p R N × 10 } . Here, x i , y i , z i , r i represent the coordinates and reflectance of the points, while x i c , y i c , z i c represent the distance to the arithmetic mean of all points in the pillar, and x i p , y i p , z i p is the offset of each point from the pillar center. Subsequently, the feature is enhanced and mapped to a higher dimension by an MLP layer network, which is defined as
p i m = m ( p i n ; w m )
where the function m ( · ) signifies a stack of multiple MLP layers which contain batch normalization (BN) layers and rectified linear unit (ReLU) layers, w m represents the learnable weights, and p i m R N × D is the point-wise feature. Next, max-pooling is used to aggregate the features of all points in pillar j into a single-feature vector used to characterize the information of this pillar. It is given by
p j m = M A X ( p i m )
where M A X ( · ) denotes the max-pooling operation across these points’ features, and p j m R D is the resultant feature vector for the pillar j.

3.1.2. Pillar Feature Encoding

It is not enough to obtain the features of the pillar aggregated from the points. Therefore, we utilize the second-stage feature encoding, which is the pillar feature-encoding unit, to encode the pillar’s inherent features and its relationship with the entire point cloud.
First, we use the arithmetic mean x j c , y j c , z j c of all the points in pillar j to represent the center of gravity of the pillar, and the center value x j p , y j p , z j p of pillar j as the pillar’s center. Next, we find the arithmetic mean x ¯ j c , y ¯ j c , z ¯ j c of all points as the center of gravity of the overall point cloud, and the coordinates x ¯ j p , y ¯ j p , z ¯ j p of the center pillar as the pillar center of the overall point cloud, and then we can obtain the offset x j c x ¯ j c , y j c y ¯ j c , z j c z ¯ j c from each pillar to the center of gravity and the offset x j p x ¯ j p , y j p y ¯ j p , z j p z ¯ j p from each pillar to the pillar center of the overall pillar. At this time, we have the following features: v j n = { [ x j c , y j c , z j c , x j p , y j p , z j p , x j c x ¯ j c , y j c y ¯ j c , z j c z ¯ j c , x j p x ¯ j p , y j p y ¯ j p , z j p z ¯ j p ] R 12 } . Then, the features are augmented and mapped to a higher dimension by an MLP layer network. The equation is
v j m = m ( v j n ; w m )
where the function m ( · ) is a stack of multiple MLP layers which contain batch normalization (BN) layers and rectified linear unit (ReLU) layers, w m represents the learnable weights, and v j m R G is the pillar-wise feature, which contains the features of the pillar itself, the relationship between the pillars, and the overall point cloud.

3.1.3. Feature Fusion

The aforementioned features can be categorized into two types: the former is extracted from the points and the latter is calculated using the pillar’s own features. They are both vectors used to characterize the features of the pillar. In this fusion module, we fuse the two types of features to obtain the complete features of the pillar. Its formula is as follows:
V j c = f u s i o n ( p j m ; v j m )
where f u s i o n ( · ) is the feature concatenation function and V j c R D + G is the fused pillar feature. After obtaining the fused features, we only need to map each pillar to a plane according to the coordinates of the pillar to obtain a pseudo-image U whose dimension is H × W × ( D + G ) . For convenience, we consider ( D + G ) as C.

3.2. Backbone

After obtaining the pseudo-image, the following part is a convolutional network which is used for feature extraction. We improved the backbone with SeNet, which can highlight the key information while ignoring the irrelevant information; its structure is as illustrated in Figure 1. The backbone consists of two parts: one of them is the SeNet and the other is an RPN connected in series behind.

3.2.1. SeNet

Squeeze-and-excitation networks (SeNet) are a channel-based feature-attention module proposed by [37] in 2017. This module enhanced the network’s ability to extract vital features of the object to be detected by modeling each feature channel, distinguishing the importance of different channels, and enhancing key features while suppressing irrelevant information. Incorporating this attention mechanism in practical applications can greatly improve model performance, enabling it to better capture the details and features in the image. Therefore, we utilize SeNet to process the pseudo-images obtained from PointPillars for feature learning and attention weights’ calculation. The resulting weighted features are then mapped onto the original point cloud data to further enhance the accuracy and robustness of object detection. By combining the strengths of PointPillars with SeNet, we can generate a more expressive and generalizable feature representation.
In the preceding steps, we obtain the feature map U with dimensions H × W × C . Following the feature-map processing transformation, two separate operations are performed. Firstly, the new feature map U undergoes global average pooling, compressing the height and width dimensions into a vector of size 1 × 1 × C while preserving channel information, which we denote as z. To calculate the cth element of z, we use the formula
z c = F s q ( u c ) = 1 H × W i = 1 H j = 1 W u c ( i , j )
where F s q is the compression operation, u c is the feature vector after feature extraction, and i and j are the positions of the cth element on the corresponding feature map. Through global average pooling, the input feature map undergoes compression, and output features z c are obtained to learn feature weights for each channel. Then z c are sequentially passed through the fully connected layer, the ReLU layer, and sigmoid layers to complete the excitation and achieve a comprehensive dependency capture between channels, calculated as
s = F e x ( z , W ) σ ( g ( z , W ) ) σ ( W 2 δ ( W 1 z ) )
where W 1 and W 2 are the two weight matrices to be learned, σ ( · ) is the sigmoid activation function, δ ( · ) is the ReLU activation function, and s is the feature matrix obtained after the excitation operation. Finally, the obtained feature matrix is weighted with the feature matrix u. The weighting formula is
x ˜ = F s c a l e ( u c , s c )
where x ˜ is the final feature matrix obtained by the dot product weighting operation of the feature matrix u c and s c .

3.2.2. RPN

Similarly to [13], this unit follows a strategy showcased in Figure 1. We employ the RPN (region proposal network) to process the feature map obtained from the previous step, aiming to enhance the detection capability of objects across various sizes with multi-scale receptive field. The unit consists of three convolutional layers, each serving a specific purpose. The initial layer within each block downsamples the feature map by half, accomplished through a convolution operation with a stride size of 2. Subsequently, a series of convolutions with a stride of 1 are applied, complemented by BN (batch normalization) and ReLU operations after each convolutional layer. These features from different scales are then concatenated together and used for the final detection.

3.3. Detection Head

We employ the single shot detector (SSD) [38] to achieve 3D object detection, which exhibits exceptional capabilities in terms of rapid detection speed and real-time performance. Moreover, it showcases its versatility by enabling various detection head configurations, allowing for adaptation to specific tasks.

3.4. Loss Function

We use the similar loss function as in [15]. We parameterize a 3D bounding box of the ground truth as ( x , y , z , w , l , h , θ ) , where ( x , y , z ) are the center location, and ( w , l , h ) and θ represent the size and orientation angle of the bounding box, respectively. The regression residuals between the ground truth and the anchors are as follows
Δ x = x g t x a d a , Δ y = y g t y a d a , Δ z = z g t z a h a
Δ w = log w g t w a , Δ l = log l g t l a , Δ h = log h g t h a
Δ θ = sin ( θ g t θ a )
where x g t denotes ground truth and x a is the anchor box, with d a = ( l a ) 2 + ( w a ) 2 . The location loss is denoted as
L l o c = b ( x , y , z , w , l , h , θ ) S m o o t h L 1 ( Δ b )
For the classification loss, we use the focal loss [39]
L c l s = a ( 1 p ) r log p
where p represents the probability of an anchor. We use the settings of r = 2 and a = 0.25 . Moreover, the heading direction loss L d i r is measured by a softmax classification loss on discretized directions. Adding up all the losses to the total loss of the whole network, the total loss function is defined as
L = 1 N p o s ( β l o c L l o c + β c l s L c l s + β d i r L d i r )
where N p o s is the number of positive anchors. β l o c , β c l s and β d i r are weighting coefficients for the localization loss, classification loss, and direction loss, respectively. We use the settings of β l o c = 2 , β c l s = 1 , β d i r = 0.2 .

4. Experiment

4.1. Dataset

All experimental results are evaluated on KITTI’s official evaluation test metrics, which include both bird’s-eye view (BEV) and 3D. KITTI dataset are divided into easy, moderate, and hard categories according to object size, occlusion level, and truncation. The main metric of interest is average precision (AP) with intersection over union (IoU) thresholds, where a 3D bounding box overlap of 0.7 for cars is considered reasonable, whereas an overlap of 0.5 is required for pedestrians and cyclists. Notably, the official KITTI leaderboard is ranked based on performance on the moderate category, with performance being measured as the mean average precision (mAP) on KITTI validation. The experiments are conducted on the KITTI 3D object-detection benchmark dataset, which consists of 7481 training samples and 7518 test samples. The KITTI benchmark requires the detection of specific categories [40], including cars, pedestrians and cyclists. We also follow the widely used training–validation split, which comprises 3712 training samples and 3769 validation samples.

4.2. Implementation Details

Here, the detection range of the point cloud is [ 0 , 70.4 ] m, [ 40 , 40 ] m, and [ 3 , 1 ] m along the X , Y , Z axes, and we set the X , Y , Z pillar resolution of ( 0.16 , 0.16 , 4 ) m. The maximum number of points per pillar is 32 and maximum number of pillars is 16,000. When performing feature encoding, the dimensions of the point-wise feature D and pillar-wise feature G after MLP are both 32. The proposed approach is based on the PyTorch framework, with all networks trained on the NVIDIA GTX3090 computing platform. The model is trained for 160 epochs with an initial learning rate of 2 × 10 3 and decrease by 0.8 every 15 epochs with Adam [41] optimizer.

4.3. Result

In this unit, we present the evaluation results of the proposed network using Ts-PFE and the SeNet backbone on the KITTI dataset. Our analysis comprises both quantitative and qualitative assessments, aimed at providing a comprehensive evaluation of the network’s performance.

4.3.1. Quantitative Evaluation

All detection results are measured using the official KITTI evaluation detection metrics of both BEV and 3D detection. We use an IoU threshold of 0.7 for the car category and 0.5 for the pedestrian and cyclist categories to calculate an average precision.
Compared with other similar algorithms, the proposed algorithm achieves promising results. Table 1 and Table 2 show the results of comparison under BEV and 3D settings. The proposed method achieves BEV mAP scores of 84.95%, 53.24%, and 64.86%, and 3D mAP scores of 76.09%, 47.31%, and 61.30% for the moderate level of car, pedestrian, and cyclist detection, respectively. In particular, the improvement over PointPillars is 1.1%, 3.78%, and 2.23% under a moderately difficult level of 3D detection for the car, pedestrian, and cyclist categories, respectively. This improvement can be attributed to the utilization of Ts-PFE, which effectively captures the relationship between individual pillars and the overall point cloud, as well as the use of SeNet backbone.

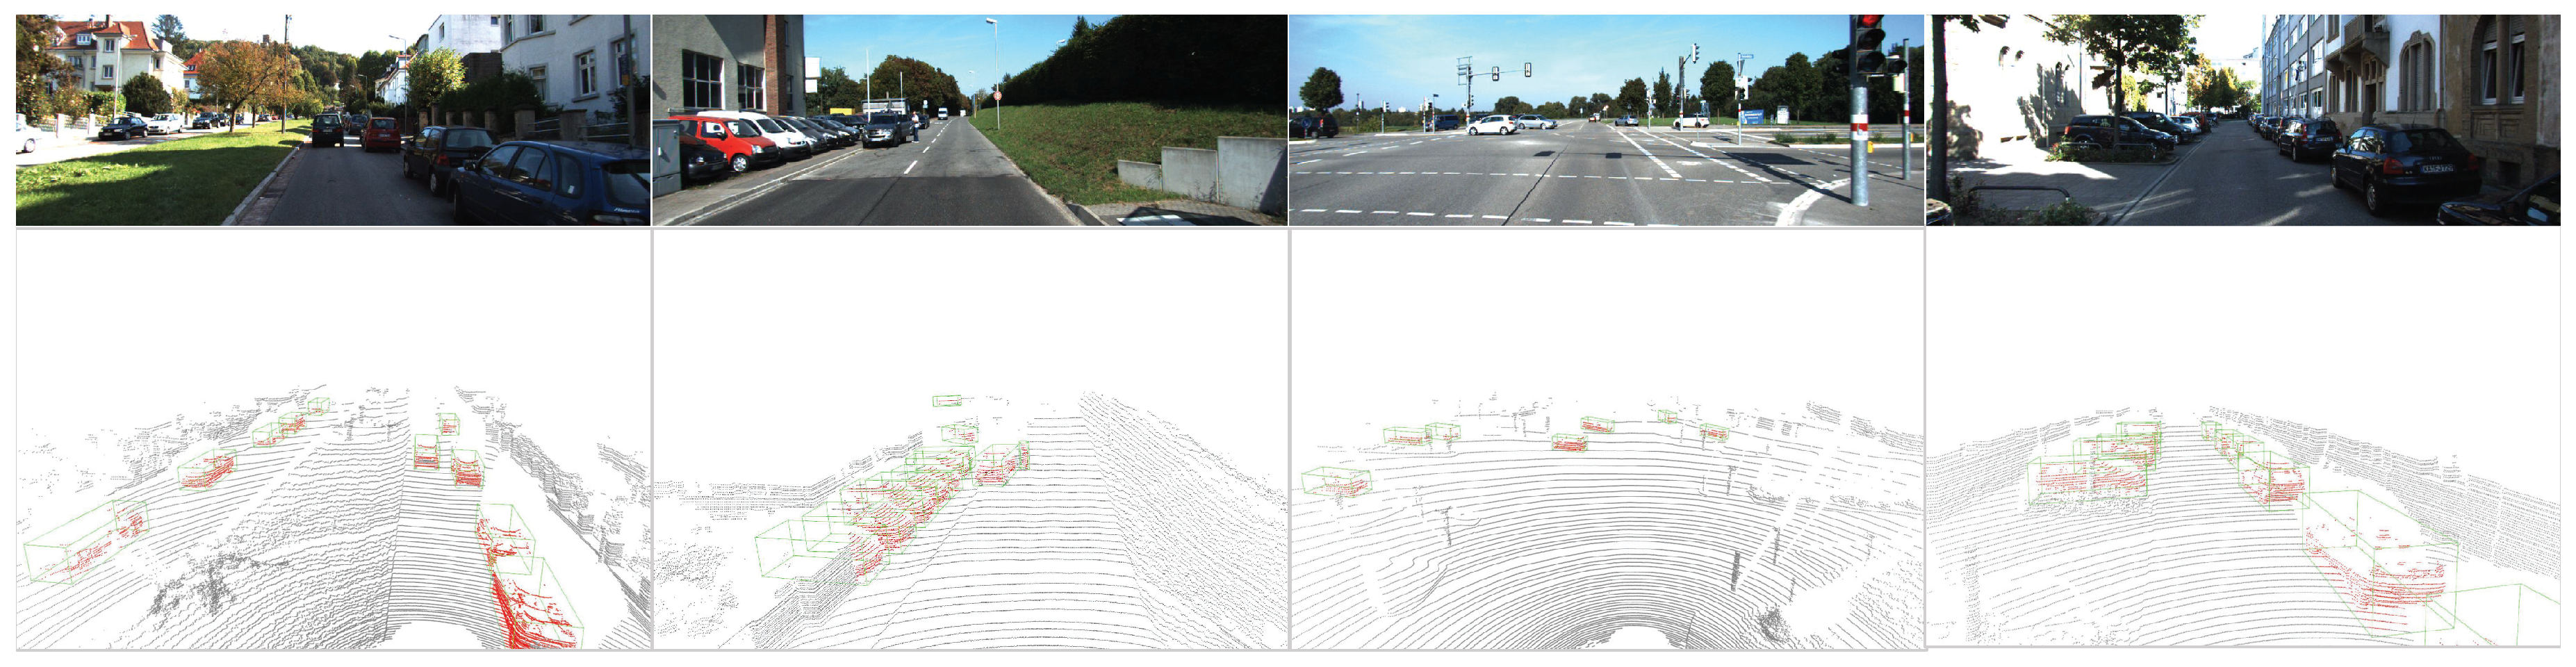
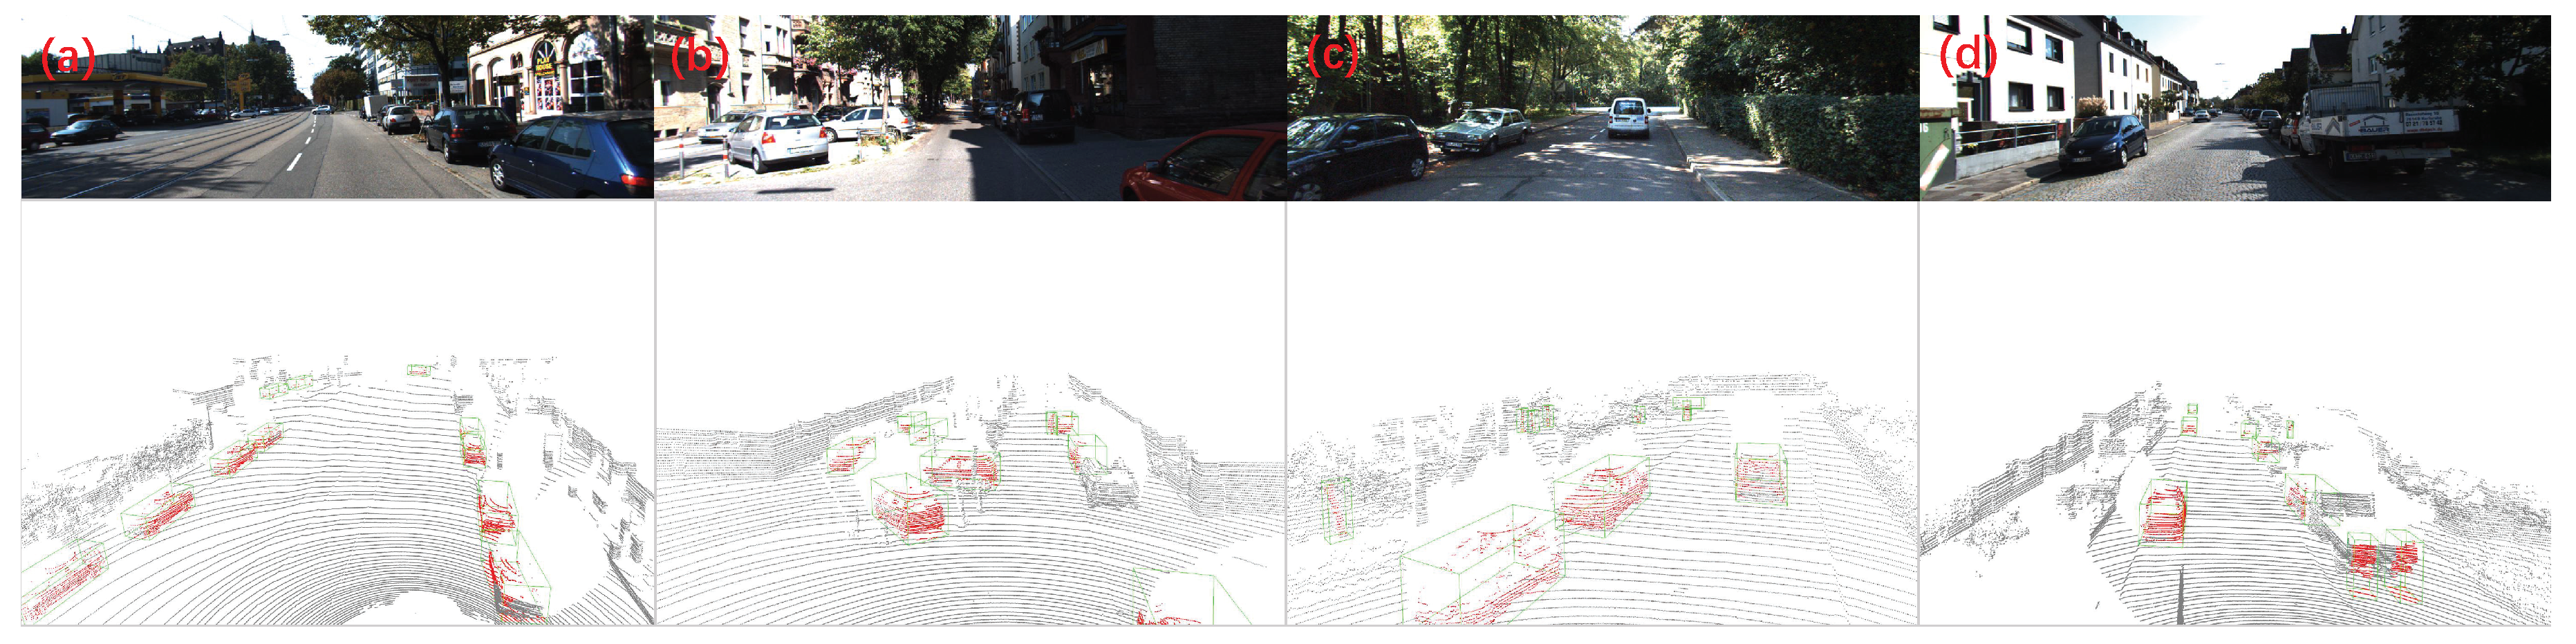
4.3.2. Qualitative Evaluation

In order to qualitatively evaluate the performance of the network, we utilize it to predict the results on the validation set and visualize it under a 3D view, as shown in Figure 3 and Figure 4.
Typical object-detection results are shown in Figure 3, indicating that the proposed model can accurately detect targets in the scene, even at longer distances or in instances of occlusion or overlap. Conversely, Figure 4 shows the individual failure examples. For example, it can be difficult to accurately identify objects that are not labeled in the data, such as trucks (as seen in Figure 4a). Additionally, certain instances produce missed detections (as shown in Figure 4b). The model may also mistakenly classify vertical objects such as poles, garbage cans, or trees as pedestrians or cyclists (as seen in Figure 4c). In some cases, there may be a slight over-segmentation, where the model detects one object as two (as seen in Figure 4d).

4.4. Ablation Experiments

We conducted some ablation experiments to evaluate the importance and contribution of each component within the proposed network. These experiments are performed on the KITTL validation dataset, with PointPillars serving as the baseline.

4.4.1. SeNet Backbone Module Analysis

The results of “with SeNet” in Table 3 and Table 4 demonstrate the effect of adding only the SeNet module. This module serves to focus on key features in the pseudo-images, which highlights important information while ignoring irrelevant information. The results in the tables indicate a discernible improvement in performance, with increases of 2.25% and 1.65% under moderate and hard levels of BEV detection for pedestrian category, as well as 0.86% and 3.19% improvement under moderate and hard levels of BEV detection for cyclist category. These findings firmly attest to the beneficial impact of the SeNet backbone module.

4.4.2. Ts-PFE Module Analysis

The results of “with Ts-PFE” in Table 3 and Table 4 show the effect of integrating only the Ts-PFE module in the main architecture. By considering both inter- and intra-relational features among and in the pillars, the Ts-PFE module achieves noteworthy performance gains across various metrics. Specifically, the improvement is 4.31% under the easy level of 3D detection for the car category, and 3.06% and 1.5% under the moderate and hard level of 3D detection for pedestrian category, respectively. For the cyclist category, we observe an improvement of 1.24% under the hard level of 3D detection. These findings demonstrate the crucial role played by Ts-PFE in enhancing the network’s performance.

4.4.3. Ts-PFE and SeNet Backbone Analysis

According to the findings presented in Table 3 and Table 4 of “with both”, the impact of incorporating both SeNet backbone and Ts-PFE is examined. Remarkably, the results reveal that the performance of the models is consistently improved with the addition of both modules, surpassing the baseline and outperforming the networks with individual module.
The preceding discussion presents ablation experiments conducted at the data level. Furthermore, it is feasible to evaluate the network’s performance pre- and post-improvement through visualization, as shown in Figure 5. We utilize the accompanying figures to compare the visualization outputs, with and without the integration of the improved module. The baseline network fails to account for the relationship between pillars and the overall point cloud, which can lead to under-segmentation in case of overlap or occlusion and missed detection, as shown in the left part of Figure 5a–d. In contrast, due to the application of Ts-PFE in the proposed network, the relational features will be taken into account to reduce the occurrence of error cases. As observed in the right portion of Figure 5a–d, the improved network effectively detects occluded objects.

5. Conclusions

In conclusion, we have proposed an improved pillar-based 3D object-detection network that incorporates a two-stage pillar feature-encoding (Ts-PFE) module and a backbone with SeNet. The utilization of the Ts-PFE module as the feature-encoding network in pillar-based 3D object-detection network greatly enhances the network’s capability to handle detection tasks under occlusion or overlapping scenes, while the backbone with SeNet makes the network more focused on key features. The experiments on the KITTI dataset show that the proposed method achieves superior detection accuracy compared to existing methods. The improvement of AP for car, pedestrian, and cyclist 3D detection are 1.1%, 3.78%, and 2.23% over the baseline. More importantly, the ablation experiments also show the significance of the proposed Ts-PFE module for performance improvement. Additionally, the results of qualitative evaluation show that the proposed approach improve the under-segmentation and missed detection problems in occluded or overlapping scenes. These findings demonstrate the potential of the proposed approach in improving pillar-based 3D object detection. However, it should be noted that the proposed method lacks the evaluation in different levels of occlusion and overlap; further validation experiments are needed in various occlusion scenarios. Additionally, our evaluation has been limited to a single dataset, and future work should involve testing on a broader range of datasets to assess the algorithm’s generalizability.

Author Contributions

Conceptualization, H.X. and B.Y.; methodology, H.X. and B.Y.; software, H.X. and X.D.; validation, H.X. and W.W.; formal analysis, W.W.; investigation, H.X. and X.D.; data curation, H.X. and W.W.; writing—original draft preparation, H.X.; writing—review and editing, B.Y.; visualization, H.X.; supervision, B.Y. and X.D.; project administration, X.D. and H.Z.; funding acquisition, X.D. and B.Y. All authors have read and agreed to the published version of the manuscript.

Funding

This work was partially supported by the National Key Research and Development Project Monitoring and Prevention of Major Natural Disasters Special Program (Grant No. 2020YFC1512202); the National Natural Science Foundation of China (Grant No. 62273342); and the Youth Innovation Promotion Association of the Chinese Academy of Sciences (Grant No. Y2021115).

Institutional Review Board Statement

Not applicable.

Informed Consent Statement

Not applicable.

Data Availability Statement

All data generated or analyzed during this study are included in this published article.

Conflicts of Interest

The authors declare no conflict of interest.

References

  1. Li, F.; Jin, W.; Fan, C.; Zou, L.; Chen, Q.; Li, X.; Jiang, H.; Liu, Y. PSANet: Pyramid splitting and aggregation network for 3D object detection in point cloud. Sensors 2020, 21, 136. [Google Scholar] [CrossRef]
  2. Bai, Z.; Wu, G.; Barth, M.J.; Liu, Y.; Sisbot, E.A.; Oguchi, K. Pillargrid: Deep learning-based cooperative perception for 3d object detection from onboard-roadside lidar. In Proceedings of the 2022 IEEE 25th International Conference on Intelligent Transportation Systems (ITSC), Macau, China, 8–12 October 2022; pp. 1743–1749. [Google Scholar]
  3. Wang, B.; Zhu, M.; Lu, Y.; Wang, J.; Gao, W.; Wei, H. Real-time 3D object detection from point cloud through foreground segmentation. IEEE Access 2021, 9, 84886–84898. [Google Scholar] [CrossRef]
  4. He, C.; Zeng, H.; Huang, J.; Hua, X.S.; Zhang, L. Structure aware single-stage 3d object detection from point cloud. In Proceedings of the IEEE/CVF Conference on Computer Vision and Pattern Recognition, Seattle, WA, USA, 13–19 June 2020; pp. 11873–11882. [Google Scholar]
  5. Wang, Q.; Chen, J.; Deng, J.; Zhang, X. 3D-CenterNet: 3D object detection network for point clouds with center estimation priority. Pattern Recognit. 2021, 115, 107884. [Google Scholar] [CrossRef]
  6. Bello, S.A.; Yu, S.; Wang, C.; Adam, J.M.; Li, J. Deep learning on 3D point clouds. Remote Sens. 2020, 12, 1729. [Google Scholar] [CrossRef]
  7. Yang, B.; Luo, W.; Urtasun, R. Pixor: Real-time 3d object detection from point clouds. In Proceedings of the IEEE Conference on Computer Vision and Pattern Recognition, Salt Lake City, UT, USA, 18–23 June 2018; pp. 7652–7660. [Google Scholar]
  8. Alaba, S.Y.; Ball, J.E. A survey on deep-learning-based lidar 3d object detection for autonomous driving. Sensors 2022, 22, 9577. [Google Scholar] [CrossRef] [PubMed]
  9. Liang, Z.; Zhang, Z.; Zhang, M.; Zhao, X.; Pu, S. Rangeioudet: Range image based real-time 3d object detector optimized by intersection over union. In Proceedings of the IEEE/CVF Conference on Computer Vision and Pattern Recognition, Nashville, TN, USA, 20–25 June 2021; pp. 7140–7149. [Google Scholar]
  10. Fan, L.; Xiong, X.; Wang, F.; Wang, N.; Zhang, Z. Rangedet: In defense of range view for lidar-based 3d object detection. In Proceedings of the IEEE/CVF International Conference on Computer Vision, Montreal, QC, Canada, 10–17 October 2021; pp. 2918–2927. [Google Scholar]
  11. Qi, C.R.; Su, H.; Mo, K.; Guibas, L.J. Pointnet: Deep learning on point sets for 3d classification and segmentation. In Proceedings of the IEEE Conference on Computer Vision and Pattern Recognition, Honolulu, HI, USA, 21–26 July 2017; pp. 652–660. [Google Scholar]
  12. Qi, C.R.; Yi, L.; Su, H.; Guibas, L.J. Pointnet++: Deep hierarchical feature learning on point sets in a metric space. Adv. Neural Inf. Process. Syst. 2017, 30, 1–14. [Google Scholar]
  13. Zhou, Y.; Tuzel, O. Voxelnet: End-to-end learning for point cloud based 3d object detection. In Proceedings of the IEEE Conference on Computer Vision and Pattern Recognition, Salt Lake City, UT, USA, 18–23 June 2018; pp. 4490–4499. [Google Scholar]
  14. Xie, J.; Zheng, Z.; Gao, R.; Wang, W.; Zhu, S.C.; Wu, Y.N. Generative VoxelNet: Learning energy-based models for 3D shape synthesis and analysis. IEEE Trans. Pattern Anal. Mach. Intell. 2020, 44, 2468–2484. [Google Scholar] [CrossRef] [PubMed]
  15. Lang, A.H.; Vora, S.; Caesar, H.; Zhou, L.; Yang, J.; Beijbom, O. Pointpillars: Fast encoders for object detection from point clouds. In Proceedings of the IEEE/CVF Conference on Computer Vision and Pattern Recognition, Long Beach, CA, USA, 15–20 June 2019; pp. 12697–12705. [Google Scholar]
  16. Liang, N.; Sun, S.; Zhou, L.; Zhao, N.; Taha, M.F.; He, Y.; Qiu, Z. High-throughput instance segmentation and shape restoration of overlapping vegetable seeds based on sim2real method. Measurement 2023, 207, 112414. [Google Scholar] [CrossRef]
  17. Wang, Y.; Jiang, Z.; Li, Y.; Hwang, J.N.; Xing, G.; Liu, H. RODNet: A real-time radar object detection network cross-supervised by camera-radar fused object 3D localization. IEEE J. Sel. Top. Signal Process. 2021, 15, 954–967. [Google Scholar] [CrossRef]
  18. Qi, C.R.; Liu, W.; Wu, C.; Su, H.; Guibas, L.J. Frustum pointnets for 3d object detection from rgb-d data. In Proceedings of the IEEE Conference on Computer Vision and Pattern Recognition, Salt Lake City, UT, USA, 18–23 June 2018; pp. 918–927. [Google Scholar]
  19. Fernandes, D.; Silva, A.; Névoa, R.; Simões, C.; Gonzalez, D.; Guevara, M.; Novais, P.; Monteiro, J.; Melo-Pinto, P. Point-cloud based 3D object detection and classification methods for self-driving applications: A survey and taxonomy. Inf. Fusion 2021, 68, 161–191. [Google Scholar] [CrossRef]
  20. Yan, Y.; Mao, Y.; Li, B. Second: Sparsely embedded convolutional detection. Sensors 2018, 18, 3337. [Google Scholar] [CrossRef] [PubMed] [Green Version]
  21. Yin, T.; Zhou, X.; Krahenbuhl, P. Center-based 3d object detection and tracking. In Proceedings of the IEEE/CVF Conference on Computer Vision and Pattern Recognition, Nashville, TN, USA, 20–25 June 2021; pp. 11784–11793. [Google Scholar]
  22. Li, J.; Chen, B.M.; Lee, G.H. So-net: Self-organizing network for point cloud analysis. In Proceedings of the IEEE Conference on Computer Vision and Pattern Recognition, Salt Lake City, UT, USA, 18–23 June 2018; pp. 9397–9406. [Google Scholar]
  23. Wang, S.; Lu, K.; Xue, J.; Zhao, Y. DA-Net: Density-Aware 3D Object Detection Network for Point Clouds. IEEE Trans. Multimed. 2023. [Google Scholar] [CrossRef]
  24. Li, C.; Gao, F.; Han, X.; Zhang, B. A New Density-Based Clustering Method Considering Spatial Distribution of Lidar Point Cloud for Object Detection of Autonomous Driving. Electronics 2021, 10, 2005. [Google Scholar] [CrossRef]
  25. Wang, Z.; Fu, H.; Wang, L.; Xiao, L.; Dai, B. SCNet: Subdivision coding network for object detection based on 3D point cloud. IEEE Access 2019, 7, 120449–120462. [Google Scholar] [CrossRef]
  26. Bhattacharyya, P.; Huang, C.; Czarnecki, K. Sa-det3d: Self-attention based context-aware 3d object detection. In Proceedings of the IEEE/CVF International Conference on Computer Vision, Nashville, TN, USA, 20–25 June 2021; pp. 3022–3031. [Google Scholar]
  27. Shi, S.; Guo, C.; Jiang, L.; Wang, Z.; Shi, J.; Wang, X.; Li, H. Pv-rcnn: Point-voxel feature set abstraction for 3d object detection. In Proceedings of the IEEE/CVF Conference on Computer Vision and Pattern Recognition, Seattle, WA, USA, 13–19 June 2020; pp. 10529–10538. [Google Scholar]
  28. Guo, M.H.; Xu, T.X.; Liu, J.J.; Liu, Z.N.; Jiang, P.T.; Mu, T.J.; Zhang, S.H.; Martin, R.R.; Cheng, M.M.; Hu, S.M. Attention mechanisms in computer vision: A survey. Comput. Vis. Media 2022, 8, 331–368. [Google Scholar] [CrossRef]
  29. Wu, C.; Zhang, F.; Xia, J.; Xu, Y.; Li, G.; Xie, J.; Du, Z.; Liu, R. Building damage detection using U-Net with attention mechanism from pre-and post-disaster remote sensing datasets. Remote Sens. 2021, 13, 905. [Google Scholar] [CrossRef]
  30. Zhai, Z.; Wang, Q.; Pan, Z.; Gao, Z.; Hu, W. Muti-Frame Point Cloud Feature Fusion Based on Attention Mechanisms for 3D Object Detection. Sensors 2022, 22, 7473. [Google Scholar] [CrossRef]
  31. Wang, G.; Zhai, Q.; Liu, H. Cross self-attention network for 3D point cloud. Knowl.-Based Syst. 2022, 247, 108769. [Google Scholar] [CrossRef]
  32. Han, J.; Zeng, L.; Du, L.; Ye, X.; Ding, W.; Feng, J. Modify Self-Attention via Skeleton Decomposition for Effective Point Cloud Transformer. In Proceedings of the AAAI Conference on Artificial Intelligence, Held Virtually, 22 February–1 March 2022; pp. 808–816. [Google Scholar]
  33. Zhao, X.; Liu, Z.; Hu, R.; Huang, K. 3D object detection using scale invariant and feature reweighting networks. In Proceedings of the AAAI Conference on Artificial Intelligence, Honolulu, HI, USA, 27 January–1 February 2019; pp. 9267–9274. [Google Scholar]
  34. Qiu, S.; Wu, Y.; Anwar, S.; Li, C. Investigating attention mechanism in 3d point cloud object detection. In Proceedings of the 2021 International Conference on 3D Vision (3DV), London, UK, 1–3 December 2021; pp. 403–412. [Google Scholar]
  35. Li, X.; Liang, B.; Huang, J.; Peng, Y.; Yan, Y.; Li, J.; Shang, W.; Wei, W. Pillar-Based 3D Object Detection from Point Cloud with Multiattention Mechanism. Wirel. Commun. Mob. Comput. 2023, 2023, 5603123. [Google Scholar] [CrossRef]
  36. Chen, S.; Miao, Z.; Chen, H.; Mukherjee, M.; Zhang, Y. Point-attention Net: A graph attention convolution network for point cloud segmentation. Appl. Intell. 2022, 53, 11344–11356. [Google Scholar] [CrossRef]
  37. Hu, J.; Shen, L.; Sun, G. Squeeze-and-excitation networks. In Proceedings of the IEEE Conference on Computer Vision and Pattern Recognition, Salt Lake City, UT, USA, 18–23 June 2018; pp. 7132–7141. [Google Scholar]
  38. Liu, W.; Anguelov, D.; Erhan, D.; Szegedy, C.; Reed, S.; Fu, C.Y.; Berg, A.C. Ssd: Single shot multibox detector. In Proceedings of the Computer Vision–ECCV 2016: 14th European Conference, Amsterdam, The Netherlands, 11–14 October 2016; pp. 21–37. [Google Scholar]
  39. Lin, T.Y.; Goyal, P.; Girshick, R.; He, K.; Dollár, P. Focal loss for dense object detection. In Proceedings of the IEEE International Conference on Computer Vision, Venice, Italy, 22–29 October 2017; pp. 2980–2988. [Google Scholar]
  40. Geiger, A.; Lenz, P.; Urtasun, R. Are we ready for autonomous driving? The kitti vision benchmark suite. In Proceedings of the 2012 IEEE Conference on Computer Vision and Pattern Recognition, Providence, RI, USA, 16–21 June 2012; pp. 3354–3361. [Google Scholar]
  41. Kingma, D.P.; Ba, J. Adam: A method for stochastic optimization. arXiv 2014, arXiv:1412.6980. [Google Scholar]
  42. Liu, Z.; Zhao, X.; Huang, T.; Hu, R.; Zhou, Y.; Bai, X. Tanet: Robust 3d object detection from point clouds with triple attention. In Proceedings of the AAAI Conference on Artificial Intelligence, New York, NY, USA, 7–12 February 2020; pp. 11677–11684. [Google Scholar]
  43. Brekke, A.; Vatsendvik, F.; Lindseth, F. Multimodal 3d object detection from simulated pretraining. In Proceedings of the Nordic Artificial Intelligence Research and Development: Third Symposium of the Norwegian AI Society, Trondheim, Norway, 27–28 May 2019; pp. 102–113. [Google Scholar]
  44. Cao, P.; Chen, H.; Zhang, Y.; Wang, G. Multi-view frustum pointnet for object detection in autonomous driving. In Proceedings of the 2019 IEEE International Conference on Image Processing (ICIP), Taipei, Taiwan, 22–25 September 2019; pp. 3896–3899. [Google Scholar]
  45. Yang, B.; Liang, M.; Urtasun, R. Hdnet: Exploiting hd maps for 3d object detection. In Proceedings of the Conference on Robot Learning, Zürich, Switzerland, 29–31 October 2018; pp. 146–155. [Google Scholar]
  46. Desheng, X.; Youchun, X.; Feng, L.; Shiju, P. Real-time Detection of 3D Objects Based on Multi-Sensor Information Fusion. Autom. Eng. 2022, 44, 3. [Google Scholar]
  47. Wang, L.; Song, Z.; Zhang, X.; Wang, C.; Zhang, G.; Zhu, L.; Li, J.; Liu, H. SAT-GCN: Self-attention graph convolutional network-based 3D object detection for autonomous driving. Knowl.-Based Syst. 2023, 259, 110080. [Google Scholar] [CrossRef]
Figure 1. The overall network architecture of the proposed approach. The main components of the network are a pillar feature-encoding module, a backbone, and a detection head. The raw point cloud is converted to pillars. The encoder uses the pillars to learn a set of features that can be scattered back to a 2D pseudo-image for a convolutional neural network. The features from the backbone are used by the detection head to predict 3D bounding boxes for objects.
Wevj 14 00146 g001
Figure 2. The Two-stage Pillar Feature Encoding (Ts-PFE) module architecture. It consists of three units: the point feature-encoding unit, the pillar feature-encoding unit, and the feature-fusion unit. The point feature encoding is used to obtain the point-wise aggregated features. The pillar feature encoding is used to obtain the pillar-wise features. Finally, the fusion unit concatenates the features together.
Wevj 14 00146 g002
Figure 3. Qualitative analysis on the KITTI validation dataset. The results are only from LiDAR. For each sample, the upper part is the image and the lower part is a representative view of the corresponding point cloud with 3D bounding box.
Wevj 14 00146 g003
Figure 4. Failure cases on the KITTI validation dataset. Same visualized setup from Figure 3 but focusing on several common failure examples. (a). It can be difficult to accurately identify objects that are not labeled in the data, such as trucks. (b). Certain instances produce missed detections. (c). The model may also mistakenly classify vertical objects such as poles, garbage cans, or trees as pedestrians or cyclists. (d). In some cases, there may be a slight over-segmentation, where the model detects one object as two.
Wevj 14 00146 g004
Figure 5. Qualitative improvement of the model with Ts-PFE module (without SeNet) over the baseline PointPillars for 3D detection. The results are shown under BEV in different scenes, with boxes and arrows indicating key differences for a better comparison. The left part of each scene is the result of the baseline, and the right part is the result of the proposed approach. (a,c,d) show improvements for the missed detection problem, and (b) shows improvement for the under-segmentation problem.
Wevj 14 00146 g005
Table 1. Results on the KITTI test BEV detection benchmark (in %). The bold number indicates the best result in a table.
ModelCarPedestrianCyclist
EasyMod.HardEasyMod.HardEasyMod.Hard
PointPillars [15]88.3586.1079.8358.6650.2347.1979.1462.2556.00
SECOND [20]88.0779.3777.9555.1046.2744.7673.6756.0448.78
VoxelNet [13]89.3579.2677.3946.1340.7438.1166.7054.7650.55
TANet [42]91.5886.5481.1960.5851.3847.5479.1663.7756.21
AVODFPN [43]88.5383.7977.9058.7551.5047.5468.0957.4850.77
FPointNet [44]88.7084.0075.3358.0950.2247.2075.3861.9654.68
HDNET [45]89.1486.5778.32N/AN/AN/AN/AN/AN/A
PRGBNet [46]91.3985.7380.6838.0729.3226.9473.0957.5951.78
Ours89.6284.9579.5359.5053.2449.1383.0764.8660.74
Table 2. Results on the KITTI test 3D detection benchmark (in %). The bold number indicates the best result in a table.
ModelCarPedestrianCyclist
EasyMod.HardEasyMod.HardEasyMod.Hard
PointPillars [15]79.0574.9968.3052.0843.5341.4975.7859.0752.92
SECOND [20]83.1373.6666.2051.0742.5637.2970.5153.8546.90
VoxelNet [13]77.4765.1157.7339.4833.6931.5061.2248.3644.37
TANet [42]84.3975.9468.8253.7244.3440.4975.7059.4452.53
AVODFPN [43]81.9471.8866.3850.8042.8140.8864.0052.1846.61
FPointNet [44]81.2070.3962.1951.2144.8940.2371.9656.7750.39
SATGCN [47]83.2076.0471.1744.6337.3734.9275.2461.7055.32
PRGBNet [46]83.9973.4968.5634.7726.4024.0367.0552.1546.78
Ours83.5276.0973.8853.9947.3142.9881.2361.3057.57
Table 3. Results on the KITTI test BEV detection benchmark (in %). The bold number indicates the best result in a table.
ModelCarPedestrianCyclist
EasyMod.HardEasyMod.HardEasyMod.Hard
PointPillars [15]88.3586.1079.8358.6650.2349.1979.1462.2556.00
withSeNet90.0386.3579.8358.2152.4848.8479.3763.1159.19
withTsPFE89.5086.4379.7458.2952.5149.0180.7961.7159.27
withboth89.6284.9579.5359.5053.2449.1383.0764.8660.74
Table 4. Results on the KITTI test 3D detection benchmark (in %). The bold number indicates the best result in a table.
ModelCarPedestrianCyclist
EasyMod.HardEasyMod.HardEasyMod.Hard
PointPillars [15]79.0574.9968.3052.0843.5341.4975.7859.0752.92
withSeNet83.8576.0969.0652.0246.9742.5476.2859.1455.51
withTsPFE83.3675.7468.9052.6446.5942.9975.9858.2854.16
withboth83.5276.0973.8853.9947.3142.9881.2361.3057.57
Disclaimer/Publisher’s Note: The statements, opinions and data contained in all publications are solely those of the individual author(s) and contributor(s) and not of MDPI and/or the editor(s). MDPI and/or the editor(s) disclaim responsibility for any injury to people or property resulting from any ideas, methods, instructions or products referred to in the content.

