
Optimizing Structural Parameters of PEMFC Based on Taguchi Method

School of Energy and Power Engineering, Shandong University, Jinan 250061, China
*
Author to whom correspondence should be addressed.
World Electr. Veh. J. 2023, 14(3), 76; https://doi.org/10.3390/wevj14030076
Submission received: 2 February 2023
/
Revised: 7 March 2023
/
Accepted: 14 March 2023
/
Published: 20 March 2023
Abstract
:Proton exchange membrane fuel cell (PEMFC) has become one of the new energy vehicle powertrains due to its special advantages, such as no pollution to the environment, high energy efficiency and power density. In order to improve the performance, a three-dimensional simulation model of the actual PEMFC is constructed. Combined with the mathematical models such as the electrochemical model and current conservation model, the model is calibrated by experiments. When the working voltage is 0.64 V, the error of the simulation results is 0.73%, compared with the experimental data. Then, the Taguchi method is used to design a multi-factor and multi-level orthogonal experimental scheme of PEMFC. Based on the orthogonal experimental table, the effects of different anode wave channel distortion, gas diffusion layer thickness and gas diffusion layer porosity on the current density are studied with a simulation experiment. The influence of the above factors on the orthogonal experiment results is analyzed by the signal-to-noise ratio. The regression equation is obtained by calculating the orthogonal experimental data. The t-test results are greater than 3.49, which indicates that each independent variable in the regression equation is important. R2 test is 0.915, and the F test is 53.508, indicating that the regression equation is significant and the optimal and worst structural parameter combinations are predicted. The current density reaches 14,190.18 under the optimal structure combination, which is 6.14% higher than the calibrated model. Single factor experiments are carried out on these three different structural parameters to verify the effectiveness of the Taguchi method, and the best combination of structural parameters is obtained.
1. Introduction
Proton exchange membrane fuel cell (PEMFC) has practical significance for improving energy structure, alleviating fossil energy shortage and environmental pollution [1]. PEMFC has been applied in many industries, such as vehicles [2,3], electric trains [4], unmanned aerial vehicles [5], E-scooter [6] and achieved good results. Because the internal reaction of the fuel cell is very complex, involving the coupling of many physical fields such as electrochemistry [7], heat and mass transfer and gas-liquid flow [8], how to obtain high efficiency under different conditions is the focus of recent research [9,10].
At present, researchers mainly use computational simulation and experimental methods to study the influence of many factors on performance [11,12]. In particular, due to its flexible application and convenience, computational simulation is more widely favored and used. Salva et al. [13] tested the operating conditions, such as cathode stoichiometry, anode and cathode relative humidity, and working pressure, and verified the accuracy of the one-dimensional model of PEMFC. The three-dimensional simulation model is more effective for optimizing PEMFC. Li et al. [14] established a three-dimensional two-phase fluid calculation model and studied the influence of assembly pressure on non-uniform geometric deformation, transport characteristics distribution, local distribution of oxygen density, current density, polarization curve and net power density of PEMFC. Based on the results of neutron imaging experiments, Penga et al. [15] improved the multiphase flow model in CFD to accurately predict the distribution of liquid water in PEMFC under different working conditions. Zhang et al. [16] proposed the Euler-Euler model to the three-dimensional multiphase model, which solved the gas-liquid two-phase flow in the channel and the porous electrode. With the progress of numerical technology, the generation of liquid water in gas flow channel [17], the change of contact thermal resistance caused by surface roughness of parts [18] can be simulated by CFD technology.
Optimizing the structural parameters is an effective means to improve the performance of PEMFC. Different flow channel styles, coupling channels and rib channels [19], u-shaped channels [20], serpentine flow channel/mesh flow channel/OPCF flow channel [21] are optimized and the performance of PEMFC is significantly improved. Furthermore, Liao et al. [22] studied the influence of the zigzag parallel flow field (ZPFF)and straight parallel flow field (SPFF) of reverse anode/cathode arrangement (ZFFCA) on battery performance by numerical simulation. Model predictions showed that the flow fields designed by ZFFCA and ZPFF provide more uniform distributions of oxygen, water content, temperature and current density than those designed by SPFF. Zhang et al. [23] proposed a single-channel PEMFC with wedge-shaped fins and explored the effects of a number of fins and the porosity of the gas diffusion layer on performance. (Modified: More advanced intelligent methods are also used for structural optimization. An artificial neural network is used to predict the performance of wave serpentine flow channels [24] and optimize block channels [25] of PEMFC).
As an effective method of arranging experiments, the Taguchi method has been widely used in various fields [26,27]. Taguchi method can optimize the performance of PEMFC fewer times than single factor experiment. Based on the simulation model, different factors and levels’ combinations of temperature/pressure/relative humidity [28], gas diffusion layer porosity/hydrogen mass fraction/nitrogen mass fraction/water saturation [29], hydrogen flow rate/ humidification condition/fuel cell stack temperature [30], the porosity of GDL/catalyst layer in a single cell [31] and the design of a fuel cell stack inlet and outlet channels with different geometric sizes [32] are optimized by Taguchi method.
Based on the content of the above literature, a three-dimensional simulation model of fuel cell based on Ansys Fluent is constructed and calibrated by experiments. The Taguchi experiment scheme is constructed for three structural factors affecting the performance of PEMFC, including the distortion of the anode wave channel, the thickness of the gas diffusion layer and the porosity of the gas diffusion layer. The structure factors matching optimization is predicted, and the single factor experiments are carried out respectively to verify the effectiveness of this method and the optimal combination is obtained).
The research contents of this paper are as follows. Section 1 summarizes the literature on PEMFC performance improvement and the Taguchi method. Section 2 constructs a three-dimensional calibration model of PEMFC. Section 3 describes the process of improving the performance of PEMFC by the Taguchi method and single factor experiment method. Finally, Section 4 presents the conclusion of this paper.
2. Constructing Simulation Model of PEMFC
2.1. Mathematical Model of PEMFC
When using fluent software to build a fuel cell simulation model, it is necessary to solve the gas phase control equation and the liquid phase control equation, respectively. It mainly includes mass conservation, momentum conservation equation, energy equation, component diffusion equation, charge conservation equation, liquid phase solution equation and liquid water transport equation [33,34]. The above equation is explained in many pieces of the literature, and the parameters of the charge conservation equation need to be calibrated by experiments, so only this equation is described in detail below.
2.1.1. Electrochemical Model
The core of electrochemistry is to calculate the reaction rates of hydrogen and oxygen at the anode and cathode, respectively. Formula (1) explains the electron transport through solid conductive materials, and Formula (2) represents proton () transport.
where, is the conductivity of the solid material, in units of ; is the potential of the solid material, in units of ; is the volume current density of the solid material, in units of ; is the conductivity in the catalytic layer and the membrane, in units of ; the potential in the catalytic layer and the membrane, in units of ; is the volume current density in the catalytic layer and membrane, the unit is .
and are non-zero in the catalyst layer. The potential equation for the solid phase is shown in Formula (3), and the membrane phase’s potential equation is shown in Formula (4).
where, the source term and also known as the exchange current density are generally defined as Formulas (5) and (6) as follows:
where, is the reference exchange current density of the anode, is the reference exchange current density of the cathode, the unit is ; is the anode side specific effective surface area, is the cathode side specific effective surface area, the unit is ; is the species concentration on the anode side, is the species concentration on the cathode side, is the reference species concentration on the anode side, is the reference species concentration on the cathode side, the unit is ; is the anode side concentration correlation coefficient, is the cathode side concentration correlation coefficient; and are anodic transfer coefficients, and are cathodic transfer coefficients, and are general gas constants; is temperature, unit is ; is the Faraday constant, and its value is .
Where, and represent the molar concentration of the substance respectively.
and depends on the temperature, as shown in Formulas (7) and (8) as follows:
where, is the anode activation energy, is the cathode activation energy, the unit is ; is the anode reference temperature, is the cathode reference temperature, the unit is ; and are the reference exchange current density at the reference temperature of anode and cathode, the units are .
2.1.2. Current Conservation Model
The volume source terms of , and the volume source terms of the dissolved water content generated by the electrochemical reaction in the catalyst layer are calculated by Formulas (9)–(11) as follows:
where, is the molecular weight of hydrogen, is the molecular weight of oxygen, is the molecular weight of water, 2, 4 are the number of electrons per mole of reactants and products.
Because the total current generated by the cathode and anode catalyst layers is the same, the current conservation equation is shown in Formula (12) as follows:
2.2. Numerical Simulation Model of PEMFC
2.2.1. Drawing Three-Dimensional Geometric Model
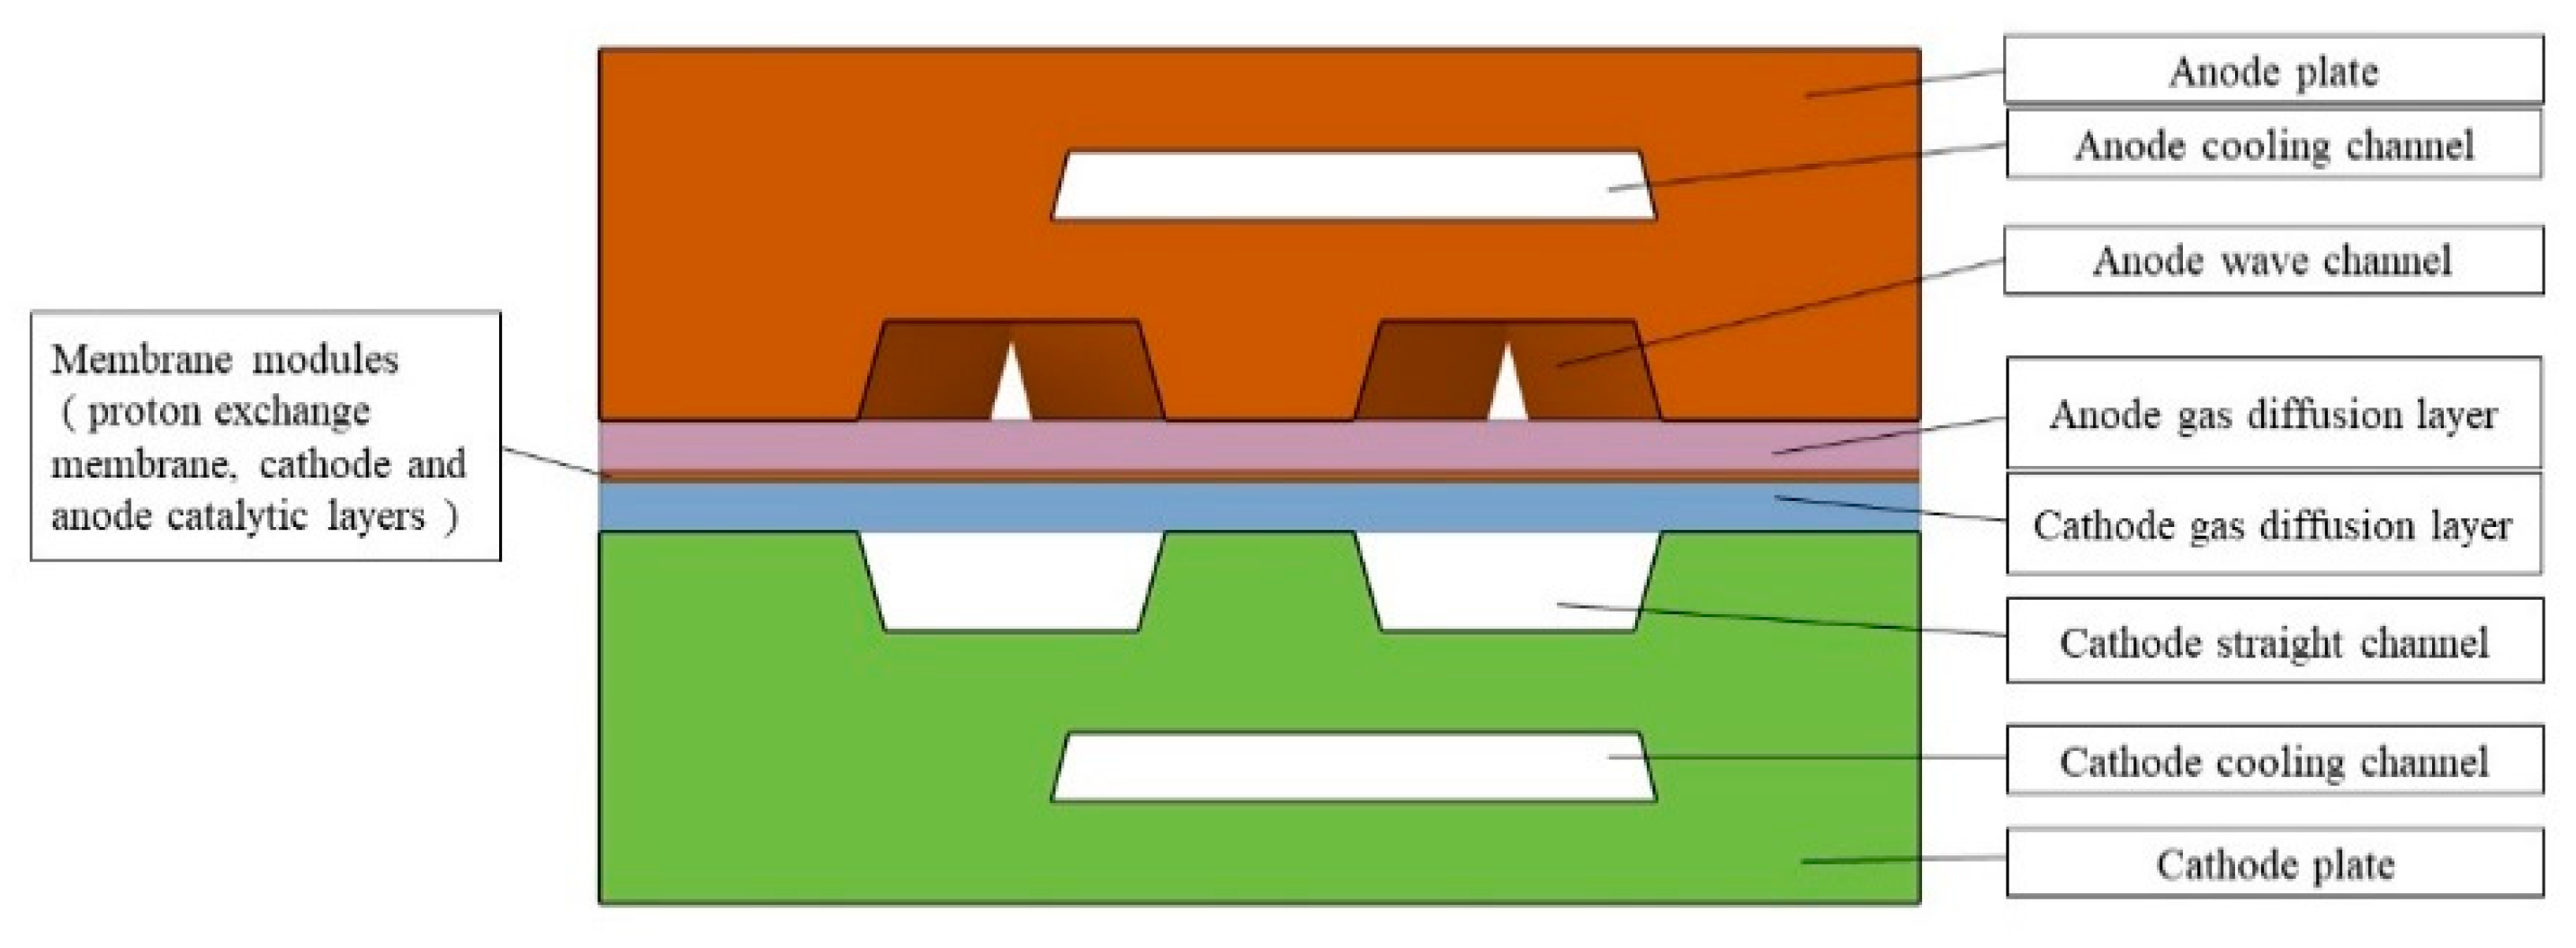
The fuel cell model is based on a multi-channel water-cooled PEMFC produced by a company. In order to improve the computational efficiency, two channels and one cooling channel are selected for three-dimensional simulation calculation. The intercepted geometric model is shown in Figure 1, and the geometric parameters are shown in Table 1. The structure includes the following: cathode and anode plates, cathode and anode coolant channels, cathode and anode gas flow channels, cathode and anode gas diffusion layers (in order to simplify the calculation, the microporous layer is merged into the gas diffusion layer), cathode and anode catalytic layers, and proton exchange membranes. The cathode flow channel is a straight channel. The anode flow channel is a distorted-wave channel, and the degree of distortion refers to the number of cycles within the length of a single cell. The formula is as follows:
where, is the distortion of the wave channel; is the wave length in a single period, the unit is ; is the length of battery model, the unit is ;
2.2.2. Mesh Rendering
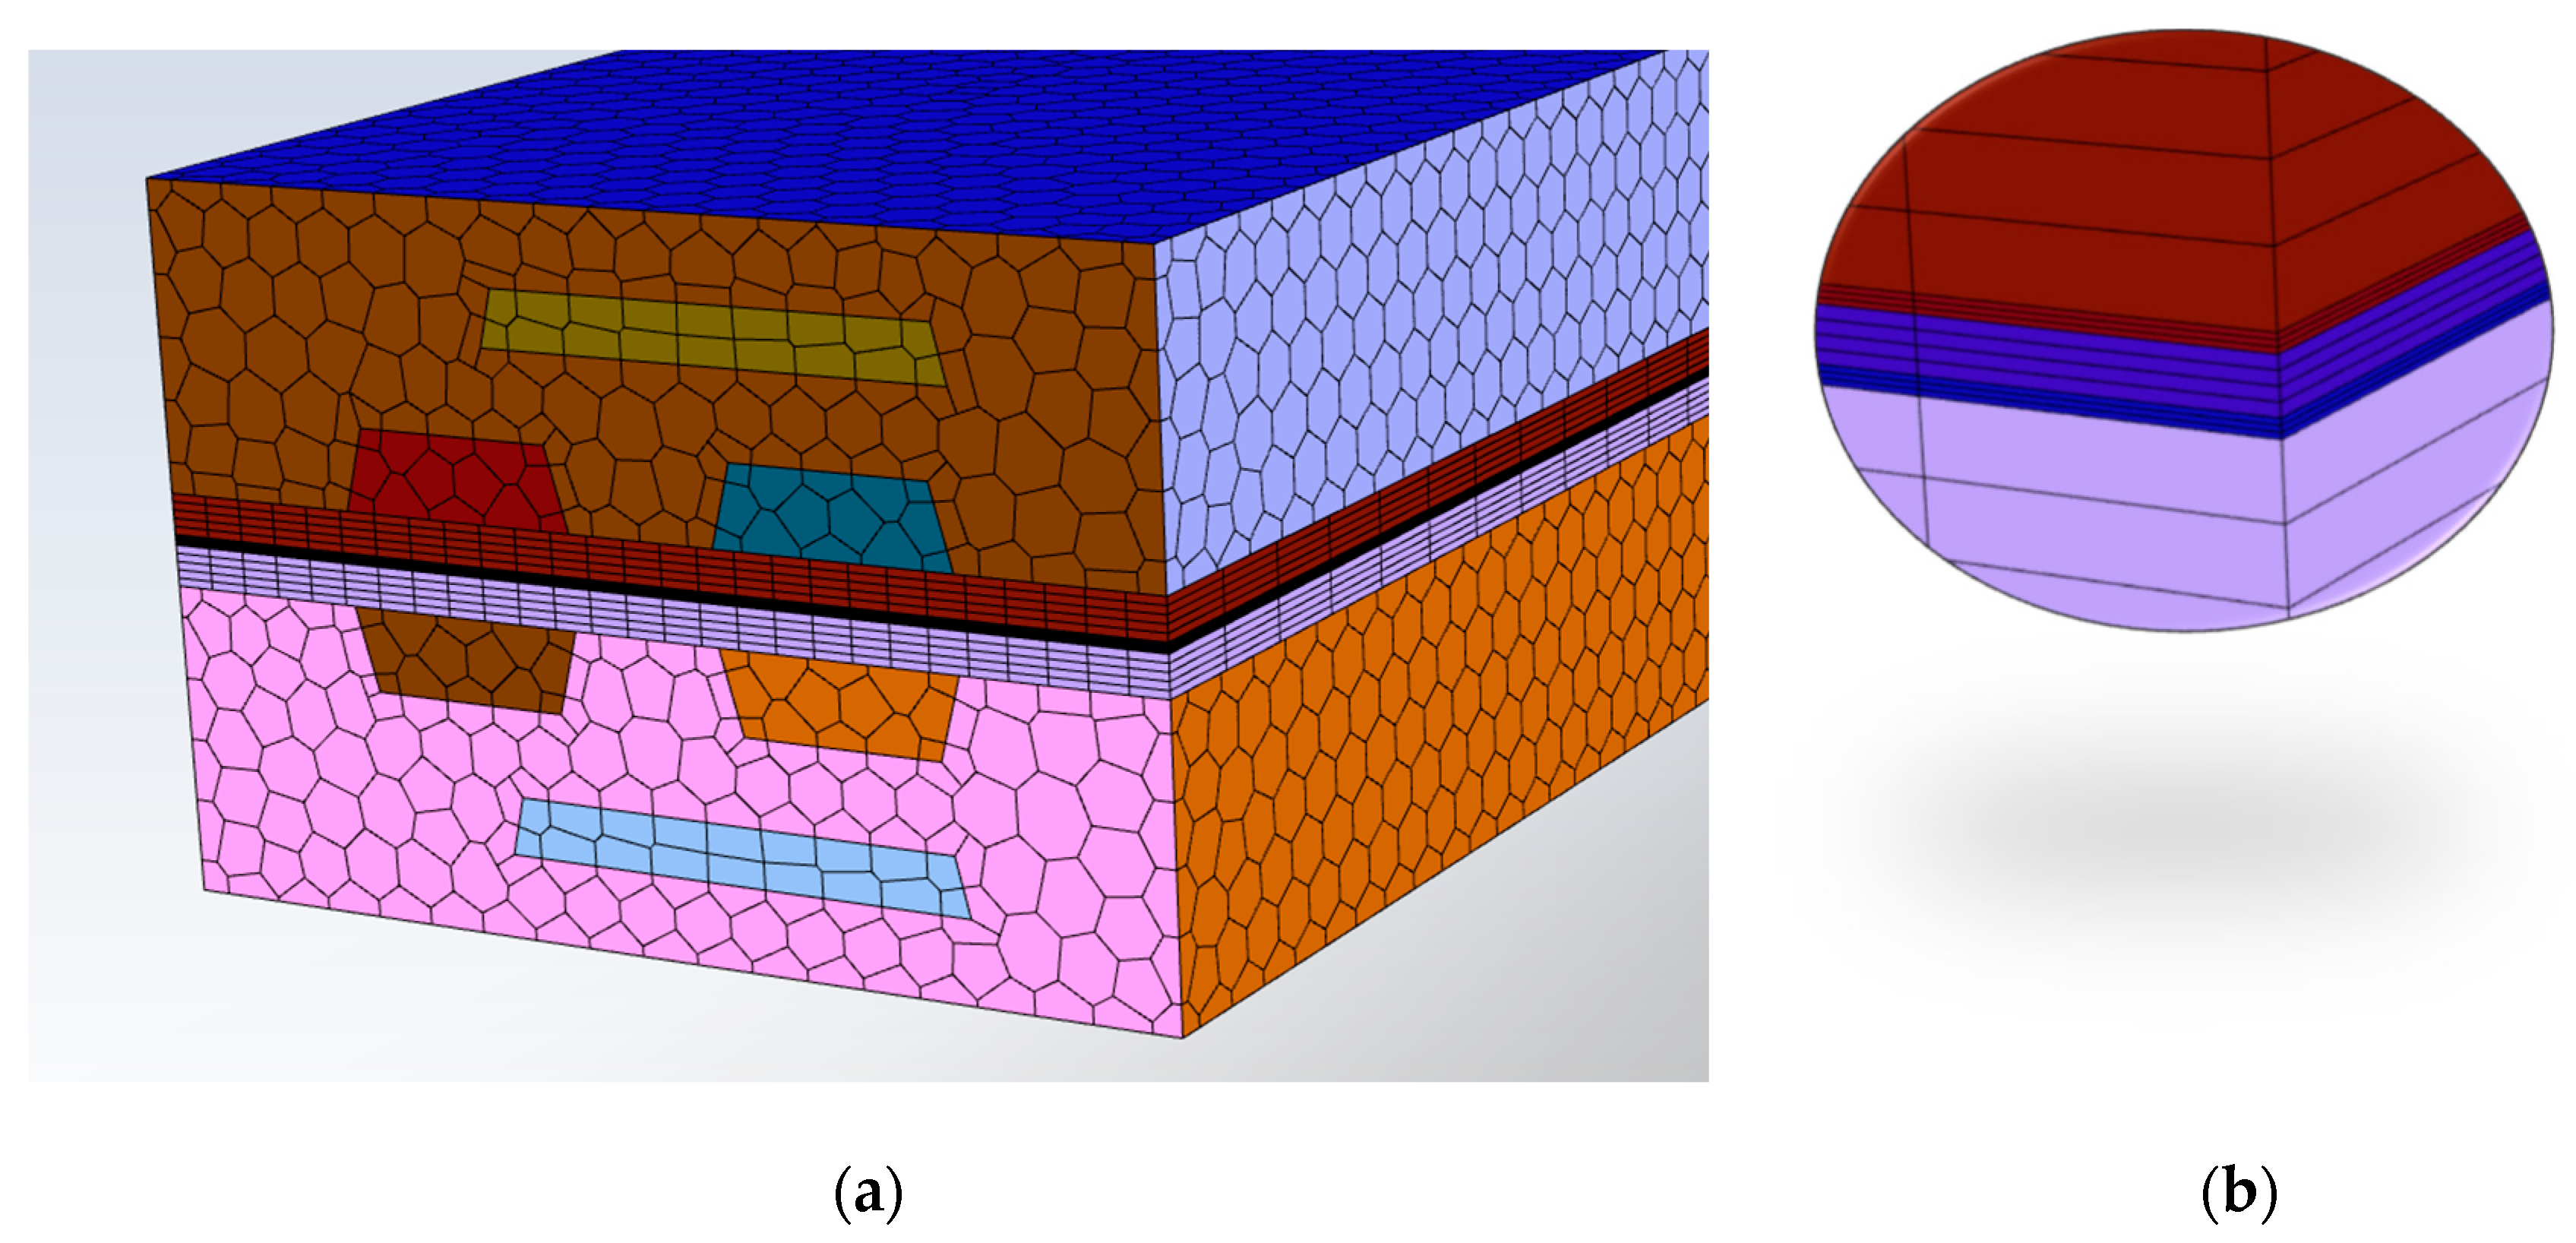
Since the geometric model contains complex wave channels, when meshing the geometry, different parts are divided by different software. The gas diffusion layer, the catalytic layer, and the proton exchange membrane are the key components, which are drawn from the fine hexahedral structured mesh by Hypermesh software. The two ends of the plate and the gas flow channel are meshed by the Meshing module of ANSYS Fluent. The overall structure is shown in Figure 2.
2.2.3. Setting Physical Parameters
In the three-dimensional simulation calculation, the physical model and other formulas are coupled with the software solver, and the physical parameters are shown in Table 2.
2.3. Calibrating Model
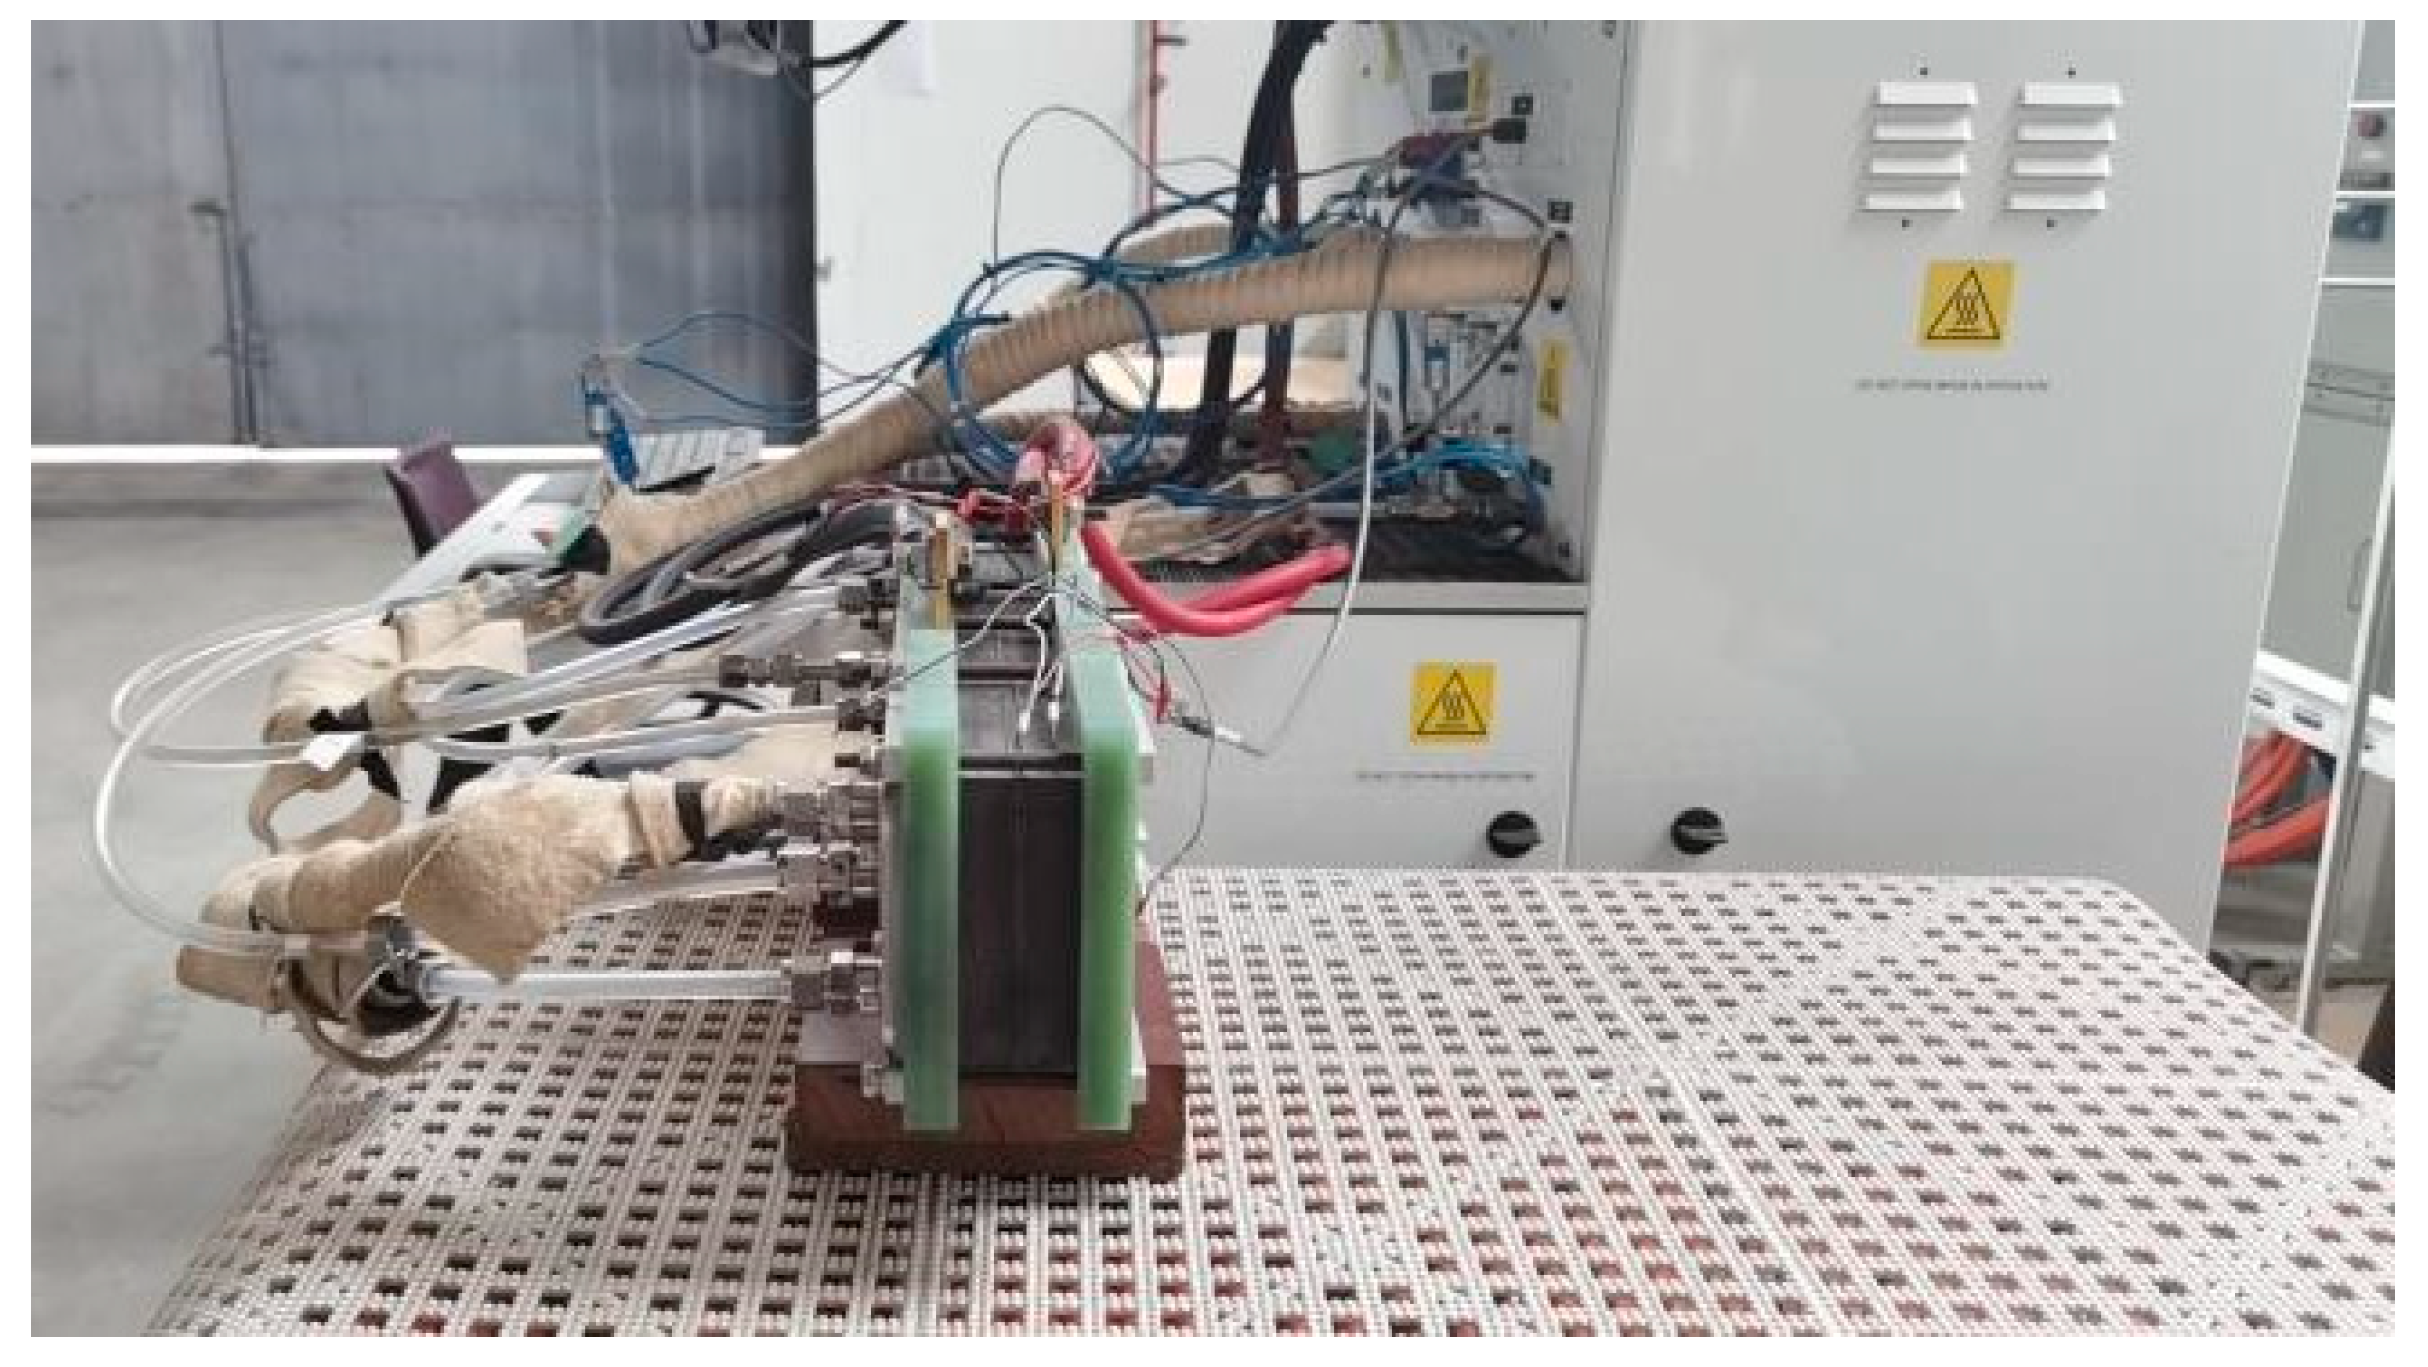
In order to ensure the accuracy of the simulation model, the experiment results are needed to verify the performance parameters of the simulation model. The performance test of the PEMFC is carried out in a manufacturing company. The test bench used in the test is the Greenlight G60 Single Cell Test Station, and its power test range is 20–500 W. The completed test bench is shown in Figure 3. The working temperature of the fuel cell is 80 °C, the initial voltage of the experiment is 0.85 V, and the termination voltage is 0.58 V. More than 9000 experimental data are collected to correct the cathode transfer coefficient of the fuel cell simulation model.
Referring to the content of model calibration in Reference [35], the cathode transfer coefficient and is further calibrated by the cathode transfer coefficient . When is 1.3, the polarization curve fits well with the experimental value in particular, when the operating voltage is 0.64 V, the simulation model result is 13,368.94 , the experimental result is 13,466.78 and the error between them is 0.73%.
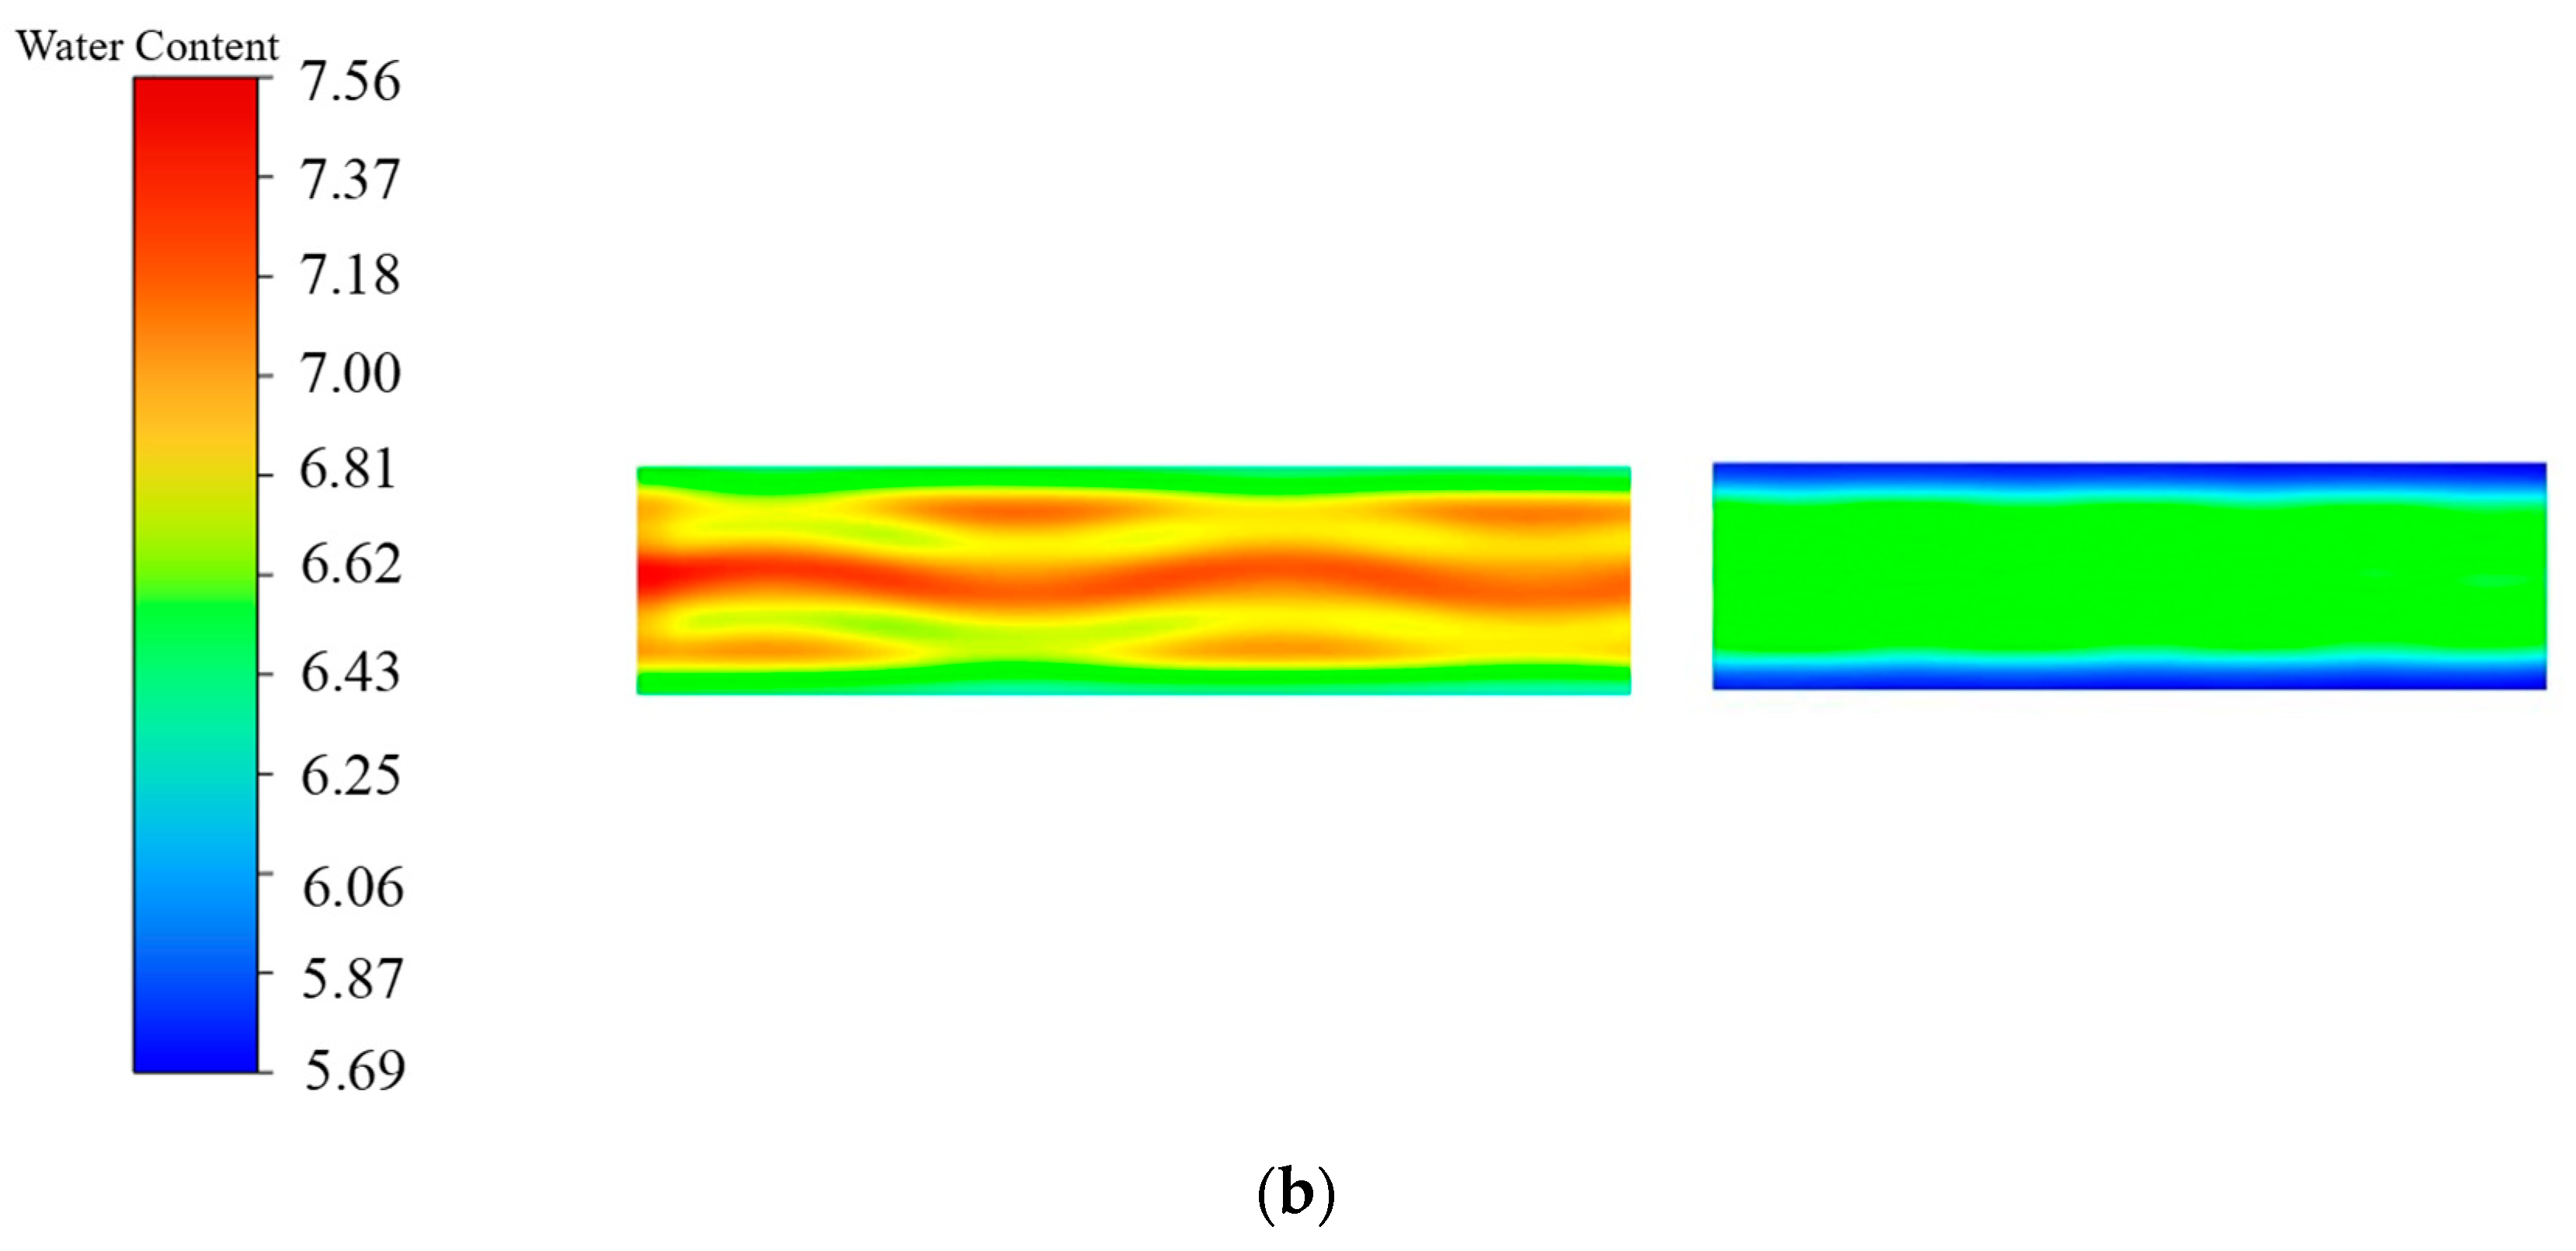
The calibrated simulation model is used for the following structural parameter optimization matching research work, and the calculation results are shown in Figure 4. The figures are close to the proton exchange membrane and intercepted along the channel direction. In view of the long channel, only the head and end of the channel are displayed. Due to the high concentration of hydrogen and oxygen in the inlet section, the current density and water content are larger than the outlet section, which is in good agreement with the actual working conditions.
3. Performance Analysis and Optimization of PEMFC
Based on the calibrated simulation model, the Taguchi method and single factor experiment are used to analyze the performance of different structural parameters of PEMFC, and then the optimal structural parameter combination is obtained. The optimization process is shown in Figure 5.
3.1. Constructing Orthogonal Experiment Scheme
There are many structural parameters that affect the performance of the PEMFC. The distortion of the anode wave flow channel is conducive to the diffusion of hydrogen to the membrane module and accelerates the electrochemical reaction rate, but it affects the flow resistance appropriately. The thickness of the gas diffusion layer and the porosity of the gas diffusion layer have a great influence on the mass transfer effect of the reaction gas diffusion to the membrane module. The orthogonal experimental scheme is constructed by the three structural parameters of the distortion of the anode wave channel, the thickness of the gas diffusion layer and the porosity of the gas diffusion layer.
Other parameters of PEMFC are as follows: the inlet humidity of the anode and cathode is 100%, the contact angle of the gas diffusion layer of the anode and cathode is , the initial value of the mass flow of hydrogen and oxygen is set when the operating voltage of 0.64 V. Under the same working conditions, the higher the current density, the higher the electrochemical conversion efficiency of PEMFC, then the current density is taken as the target value. The factors and levels of the orthogonal experiment are shown in Table 3, and the orthogonal array list is shown in Table 4.
According to the simulation results, the signal-to-noise ratio are processed at different levels and shown in Table 5. It can be seen that the thickness of the gas diffusion layer of the cathode and anode has the greatest impact on the performance of the fuel cell, with a contribution rate of 54%, followed by the porosity of the gas diffusion layer, with a contribution rate of 28% and finally the distortion of the anode flow channel, with a contribution rate of 18%.
In order to explore the effect of three structural factors of PEMFC on current density, the results of independent variables, independent variables multiplied by each other, and the square of each variable were calculated by regression analysis. The results are shown in Table 6.
Since the t-test values are greater than 3.49, the selected independent variables are important. Among all the factors, the t-test value of the gas diffusion layer thickness is the largest, which further indicates that it plays the most important role in the current density of PEMFC. The R2 test is 0.915, indicating that there is a good linear correlation between the variables of the model and the current density. The F test is 53.508, which is much larger than the critical value F0.01(4,20) = 4.938. It shows that the regression result is significant, and the equation can be used to predict the current density as follows:
where, is the distortion of the anode wave channel, is the thickness of the gas diffusion layer and is the porosity of the gas diffusion layer.
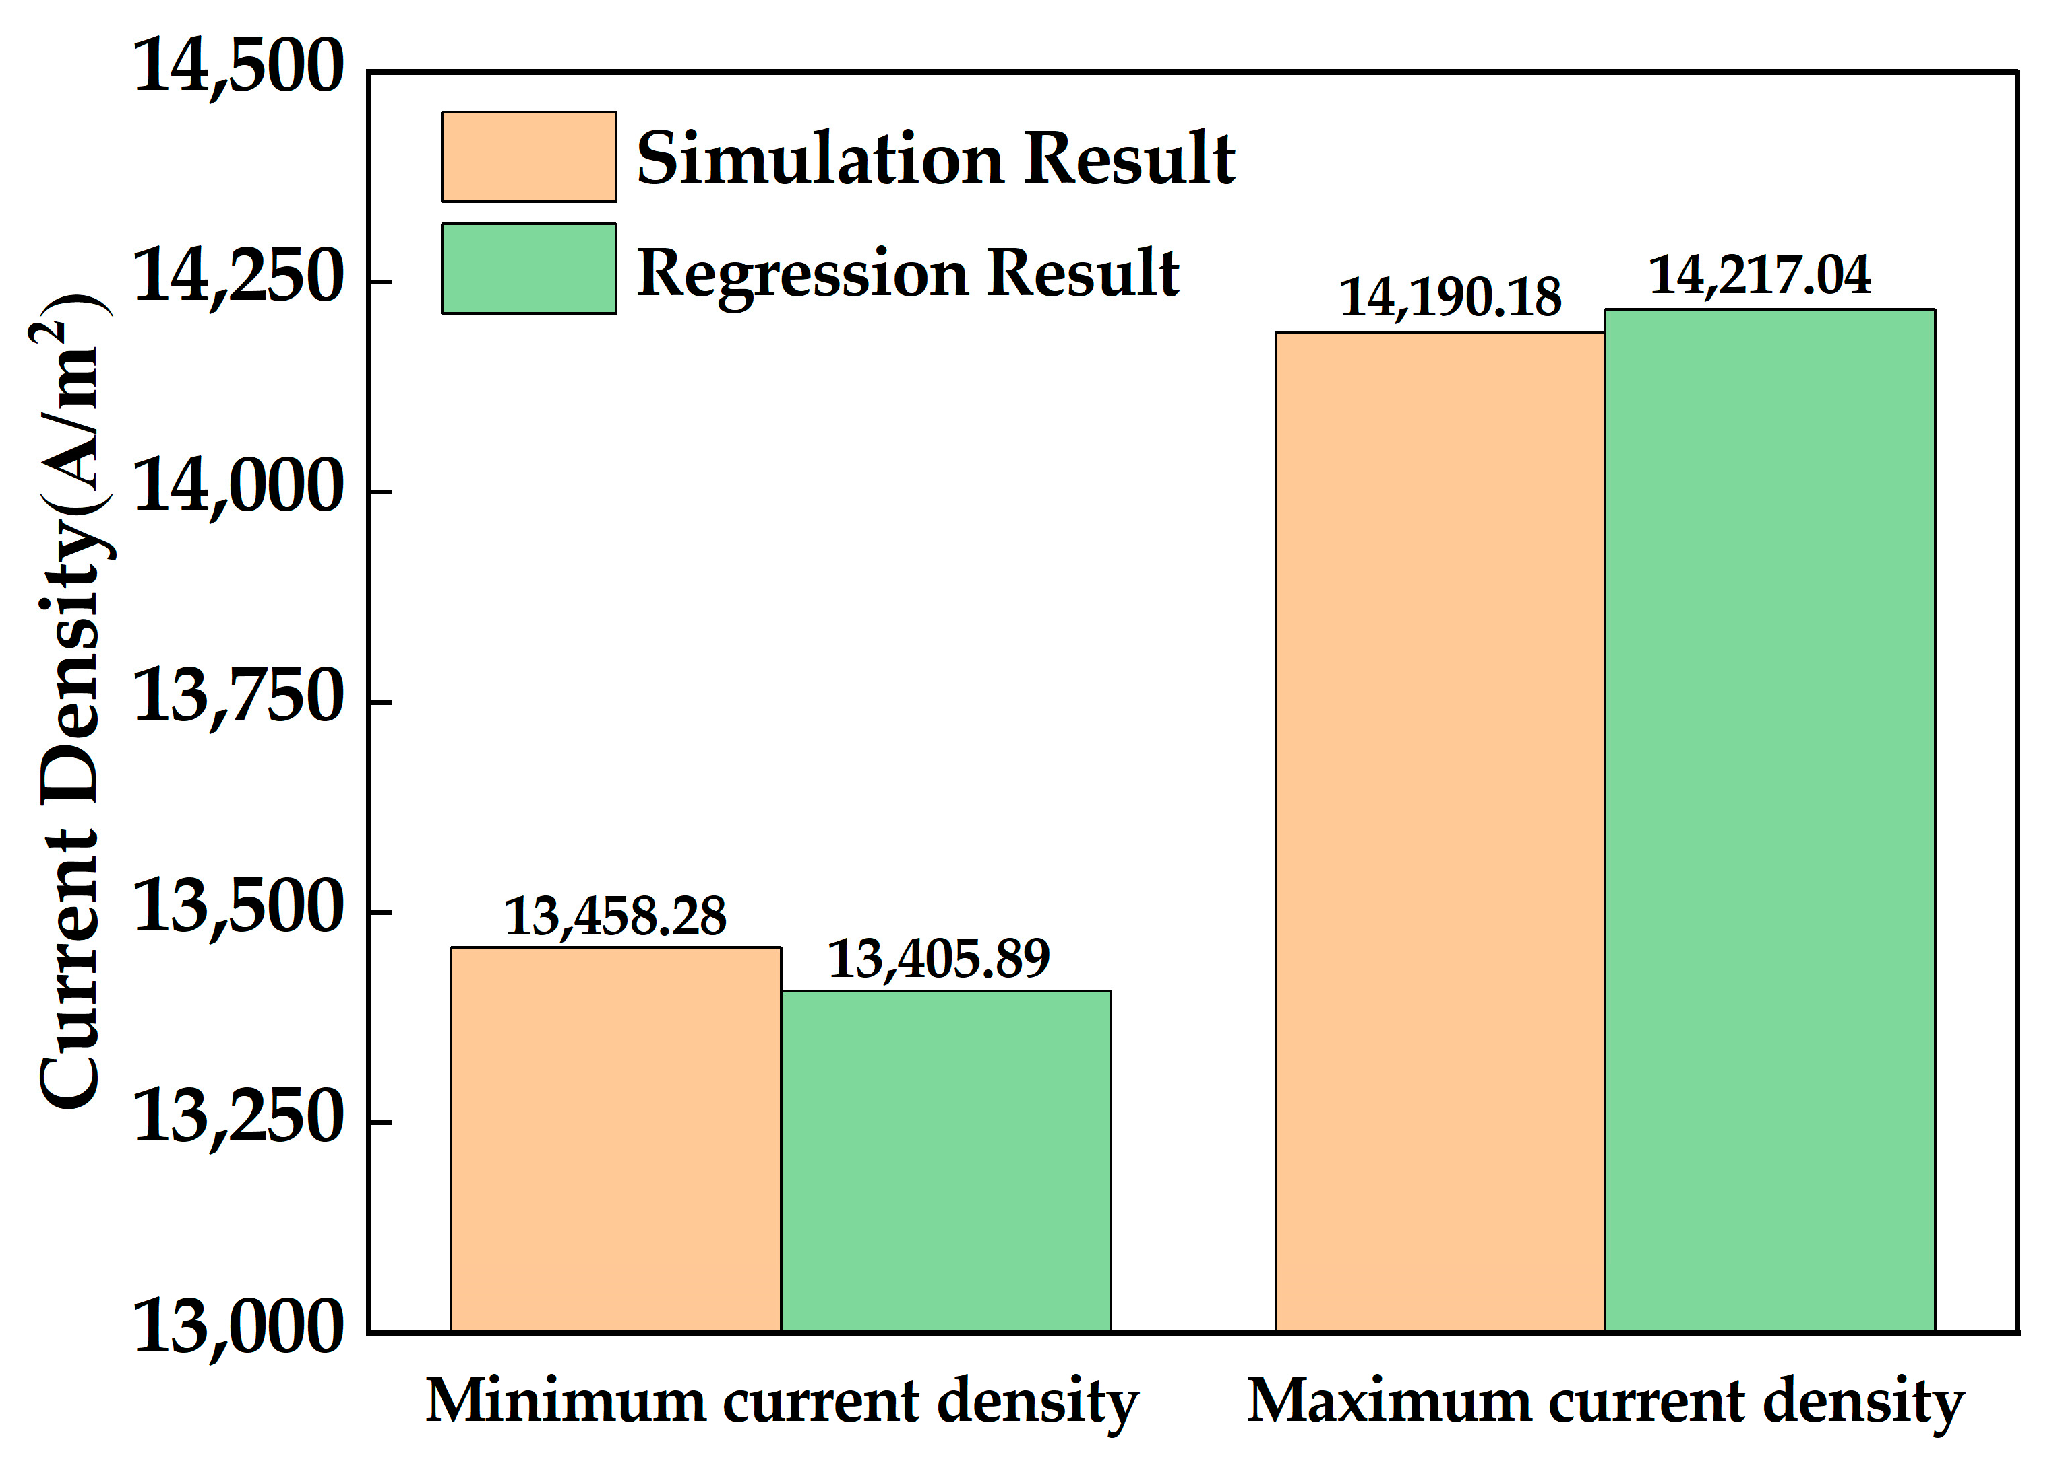
When the anode flow channel distortion is 40, the thickness of the gas diffusion layer is 0.38 mm. In fact, 0.4 mm is selected for convenient process production, and the porosity is 0.8, and the current density is the highest. When the anode flow channel distortion is 20, the thickness of the gas diffusion layer is 0.6 mm, and the porosity is 0.6, the current density is the lowest. The predicted optimal combination and the worst combination parameters are substituted into the model for simulation calculation. The regression value and the simulation value are shown in Figure 6. The error between the regression value and the simulation value is 0.39% and 0.19%, respectively, which confirms the effectiveness of the orthogonal experimental results.
3.2. Single Factor Simulation Experiment
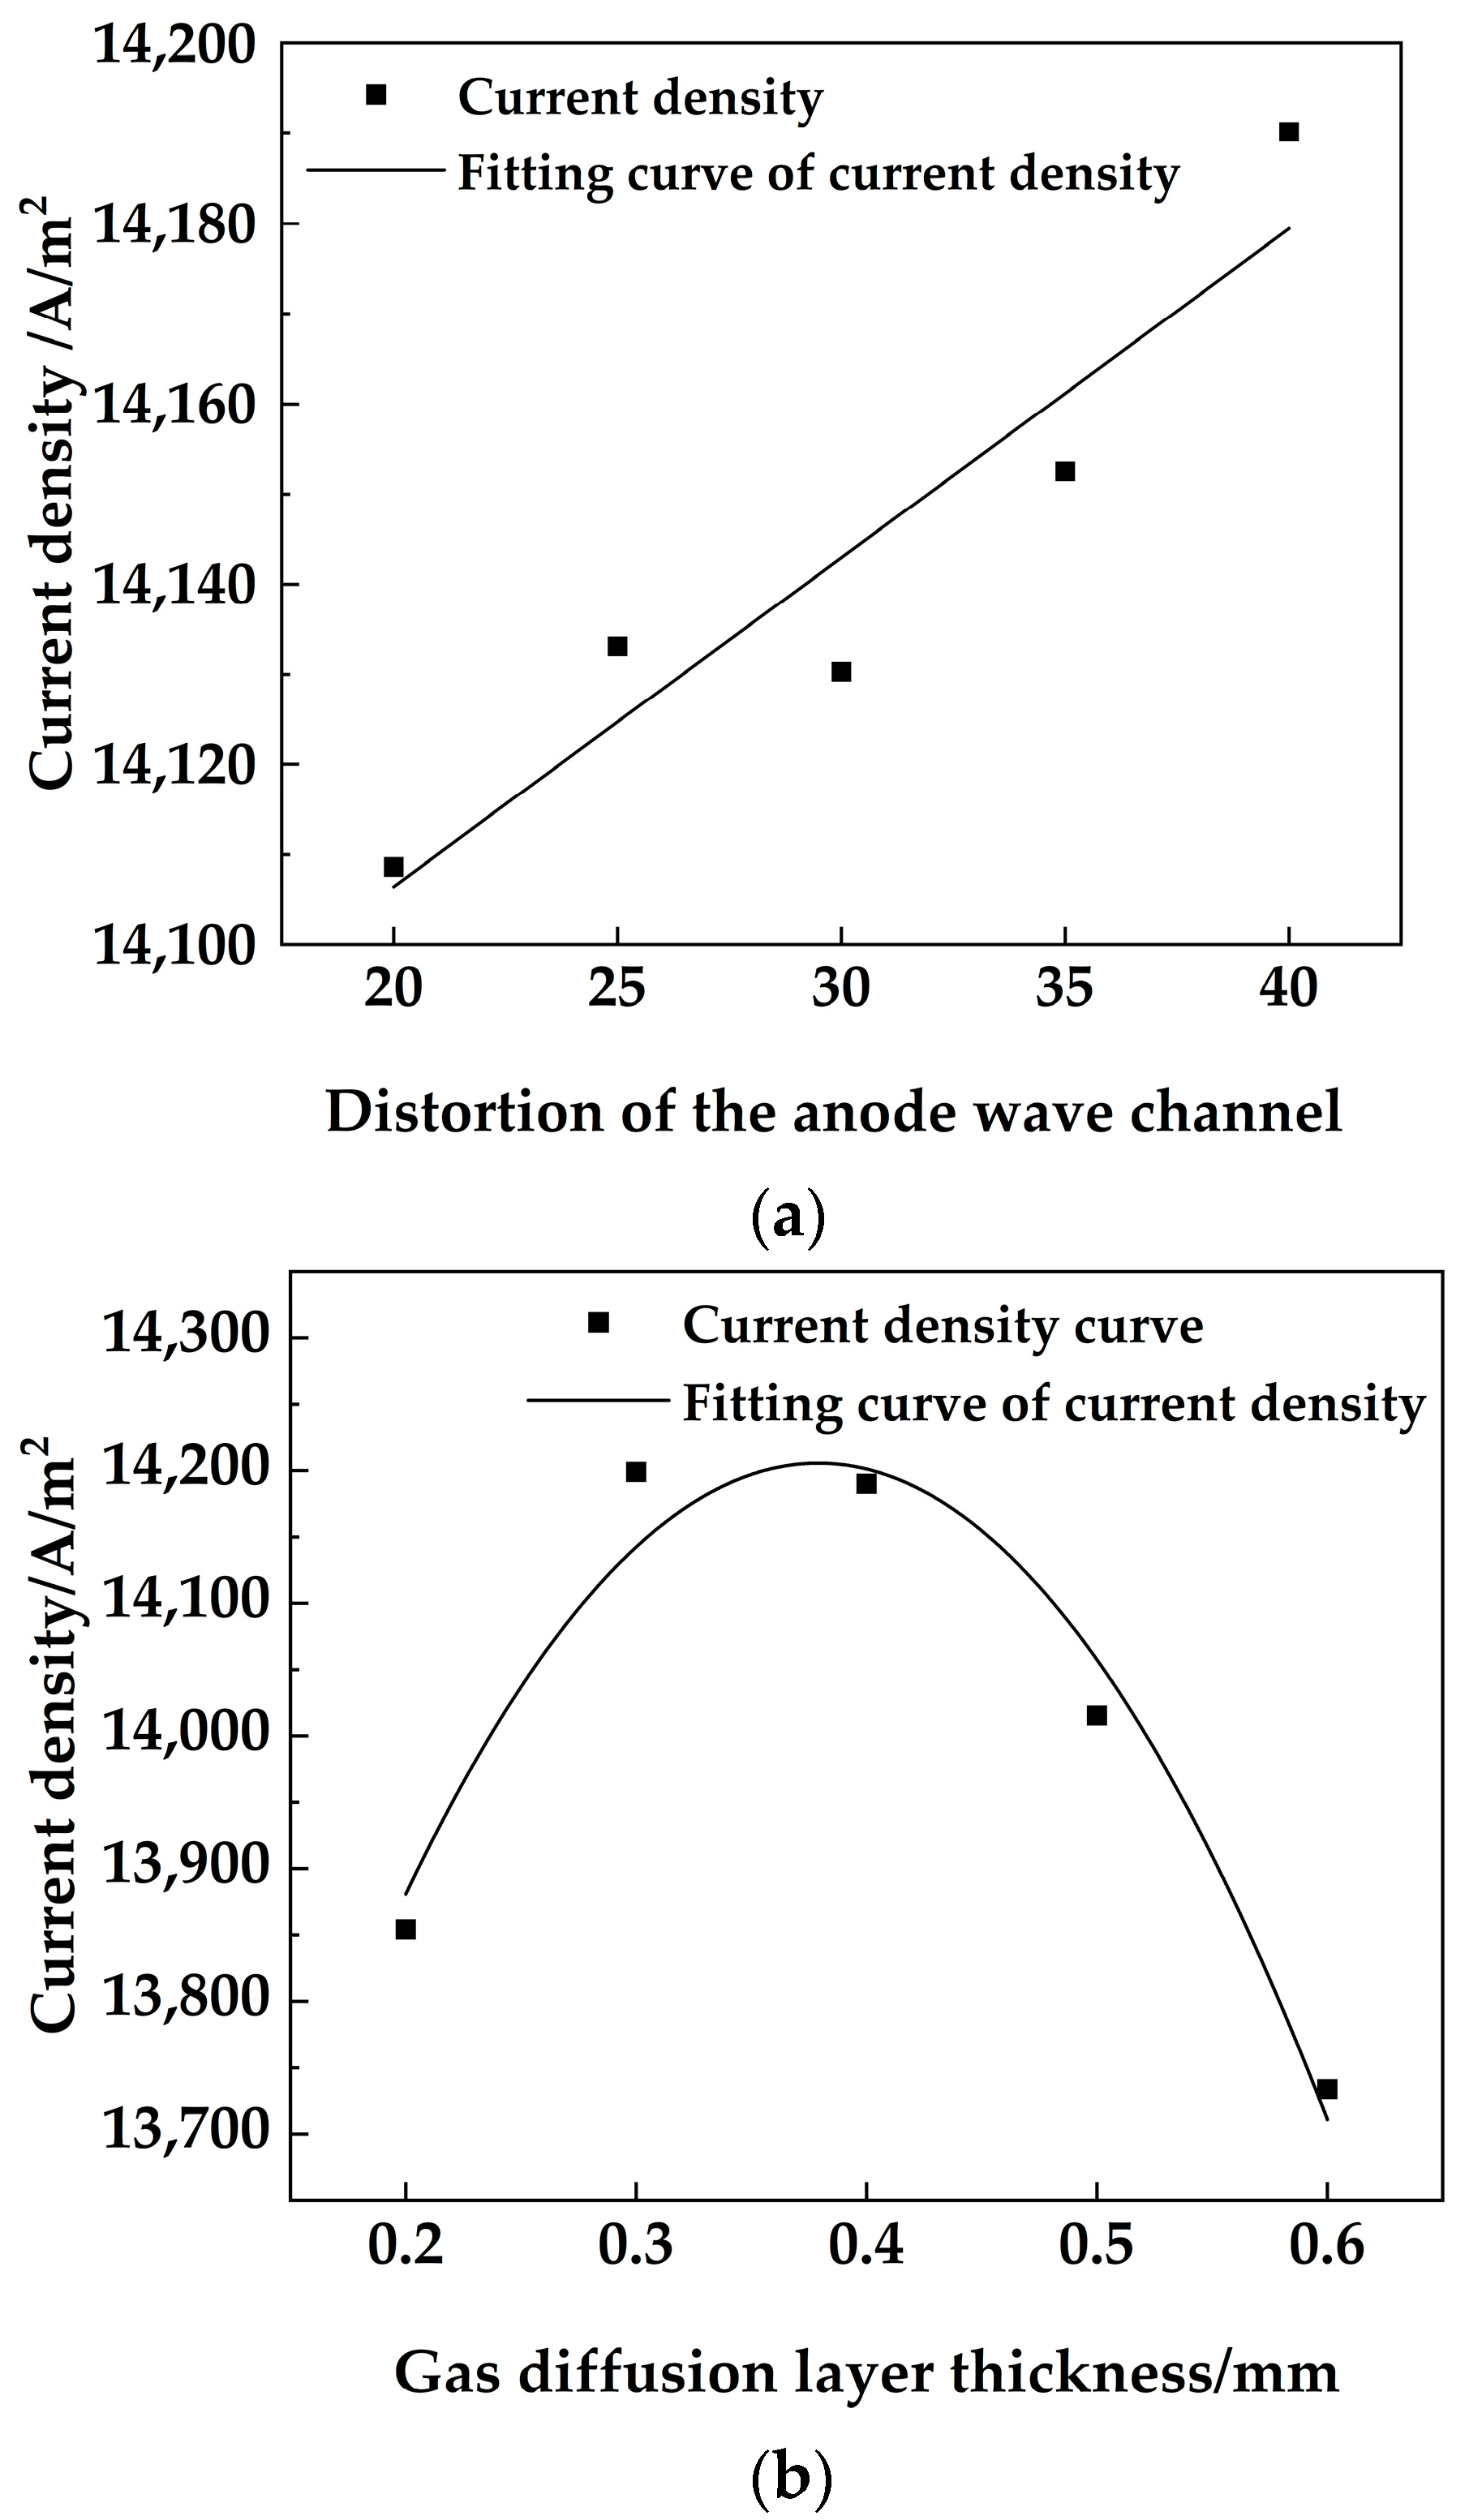
In order to further explore the influence of distortion on the current density of PEMFC, the thickness of the gas diffusion layer is fixed at the optimal value of 0.4 mm and the porosity of the gas diffusion layer is fixed at the optimal value of 0.8. Single factor experiments with distortion of 20, 25, 30, 35 and 40 are carried out, respectively, and shown in Figure 7a. As the degree of distortion increases, the current density shows a monotonous upward trend and its change trend is consistent with the equation of the orthogonal experiment. The reason is that the wave flow channel can allow hydrogen to directly impact the surface of the flow channel, reduce the boundary layer and effectively improve the mass transfer effect in the chemical reaction process of PEMFC, thereby improving the hydrogen transfer rate and gas utilization rate in the diffusion layer and catalytic layer, and the performance is enhanced. However, with the increase in the distortion degree of the anode wave channel, the pressure drop also increases. Then the inlet and outlet pressure data of the simulation model are read, respectively. The pressure drop is 937.16 Pa when the distortion degree is 20, and the pressure drop is 1040.82 Pa when the distortion degree is 40. Because the inlet pressure of hydrogen is the influence of pressure drop can be ignored. The above simulation results show that a moderate increase in the distortion of the anode wave channel can effectively improve the efficiency of PEMFC, and the pressure drop is within a controllable range.
Similarly, the anode wave channel distortion is fixed at the optimal value of 40, and the porosity of the gas diffusion layer is at the optimal value of 0.8. The single factor experiment of the gas diffusion layer thickness of 0.2 mm, 0.3 mm, 0.4 mm, 0.5 mm and 0.6 mm are carried out, respectively, and shown in Figure 7b. With the increase in the thickness of the gas diffusion layer, the change process of the current density presents a quadratic polynomial change trend, which is consistent with the result of the orthogonal experiment. When the thickness of the gas diffusion layer is too thin, it will weaken the protection of the catalytic layer and reduce the electrochemical reaction active area. Too thick a gas diffusion layer will prolong the gas transmission path and increase the mass transfer resistance, resulting in a serious polarization phenomenon, which will reduce the current density. Because the water content of the membrane will affect the performance of the fuel cell. The membrane water content of five different models is extracted, respectively. Because the inlet humidity is 100 %, the change value is between 5.48 and 5.54, and the thickness of the gas diffusion layer had little effect on the membrane water content. Because the thickness of the gas diffusion layer has a great influence on PEMFC, optimizing the thickness of the gas diffusion layer is the key to improving the performance of PEMFC.
Finally, the distortion of the anode wave channel is fixed at the optimal value of 40 and the thickness of the gas diffusion layer is fixed at the optimal value of 0.4mm. Single factor experiments with porosity of 0.6, 0.65, 0.7, 0.75 and 0.8 are carried out respectively and shown in Figure 7c. As the current density increases with the increase in porosity, and it is consistent with the rule of orthogonal experiment fitting. This is mainly because as the porosity of the gas diffusion layer increases, the mass transfer resistance during the diffusion of the reaction gas to the catalytic layer is reduced, thereby increasing the current density of the PEMFC. For the same reason, under the condition of 100% inlet humidity, the change of porosity has little effect on membrane water content.
4. Conclusions
Optimizing the structural parameters of PEMFC can effectively improve its performance of PEMFC. This paper attempts to optimize the structural parameters of PEMFC by combining three-dimensional simulation calculations with the Taguchi method.
(1) Based on the actual PEMFC geometric model and mathematical model, a three-dimensional simulation calculation model of a fuel cell is established. The parameters of the simulation model are calibrated by the bench test. When the cathode transfer coefficient is 1.3, the error between the simulation value and the result of the experiment is 0.73% when the working voltage is 0.64 V.
(2) Based on the calibration model, the Taguchi method is used to design a multi-factor and multi-level orthogonal experimental scheme. The effects of anode wave channel distortion, gas diffusion layer thickness and gas diffusion layer porosity on PEMFC current density are investigated, and the regression equation is obtained. The signal-to-noise ratio analysis and t-test show that the thickness of the gas diffusion layer has the greatest influence on the performance of PEMFC, followed by the porosity of the gas diffusion layer and the distortion of the anode wave channel. R test and F test shows that the regression equation is significant and obtained the optimal parameter matching combination. When the anode wave channel distortion is 40, the diffusion layer thickness is 0.4mm and the porosity is 0.8, the performance of PEMFC is the best. The current density calculated by the simulation model is 14,190.18 A/m2, which is 6.14% higher than the calibration model.
(3) The other factors are set at the best level the single factor simulation tests of different the distortion of the anode wave channel, gas diffusion layer thickness and gas diffusion layer porosity are carried out, respectively. The changing trend of the experiment results is consistent with the orthogonal experiment results, which further proves the influence law and importance of the three factors on the performance.
Author Contributions
Conceptualization, methodology, W.Y. and G.W.; Data curation, W.Y., J.W. and J.L.; Formal analysis, W.Y. and J.W.; Validation, W.Y. and G.W.; Resources and funding acquisition, W.Y.; Writing—original draft preparation, W.Y., J.L. and G.W.; Writing—review and editing, W.Y., J.W. and G.W. All authors have read and agreed to the published version of the manuscript.
Funding
This work was funded by the National Key R&D program of China of Grant No. 2022YFB4300700 and the Shandong province Key Research and Development Program of Grant No. 2020CXGC011005.
Data Availability Statement
Not applicable.
Conflicts of Interest
The authors declare no conflict of interest.
Nomenclature
| conductivity of the solid material | potential of the solid material | ||
| volume current density of the solid material | molecular weight of hydrogen | ||
| conductivity in the catalytic layer and the membrane | molecular weight of oxygen | ||
| potential in the catalytic layer and the membrane | molecular weight of water | ||
| volume current density in the catalytic layer and membrane | anode transfer coefficient of anode | ||
| exchange current density of anode | cathodic transfer coefficient of anode | ||
| exchange current density of the cathode | anode transfer coefficient of cathode | ||
| reference exchange current density per active surface area of the anode | cathodic transfer coefficient of cathode | ||
| reference exchange current density per active surface area of the cathode | Faraday constant | ||
| anode side specific effective surface area | universal gas constant | ||
| cathode side specific effective surface area | temperature | ||
| local species concentration on the anode side | anode activation energy | ||
| local species concentration on the cathode side | cathode activation energy | ||
| reference local species concentration on the anode side | reference exchange current density at the anode reference temperature | ||
| reference local species concentration on the cathode side | reference exchange current density at the cathode reference temperature | ||
| anode reference temperature | porosity | ||
| anode side concentration correlation coefficient | cathode side concentration correlation coefficient |
References
- Rezaie, M.; Azar, K.K.; Sani, A.K.; Akbari, E.; Ghadimi, N.; Razmjooy, N.; Ghadamyari, M. Model parameters estimation of the proton exchange membrane fuel cell by a Modified Golden Jackal Optimization. Sustain. Energy Technol. Assess. 2022, 53, 102657. [Google Scholar] [CrossRef]
- Kannan, R.; Sundharajan, V. A novel MPPT controller based PEMFC system for electric vehicle applications with interleaved SEPIC converter. Int. J. Hydrogen Energy 2023. Available online: https://www.sciencedirect.com/science/article/pii/s0360319922061456 (accessed on 13 January 2023). [CrossRef]
- Liang, X.; Kang, H.; Shen, J.; Li, Z.; Zeng, R. Review and analysis of hydrogen recirculation devices for compact vehicular proton exchange membrane fuel cells. J. Power Sources 2023, 555, 232308. [Google Scholar] [CrossRef]
- Pugi, L.; Berzi, L.; Cirillo, F.; Vecchi, A.; Pagliazzi, V. A tool for rapid simulation and sizing of hybrid traction systems with fuel cells. Proc. Inst. Mech. Eng. Part F J. Rail Rapid Transit 2023, 237, 104–113. [Google Scholar] [CrossRef]
- Pugi, L.; Mela, A.; Reatti, A.; Casazza, A.; Fiorenzani, R.; Mattei, G. A fixed wing UAV with VTOL capabilities: Design, control and energy management. Int. J. Model. Identif. Control 2022, 41, 206–221. [Google Scholar] [CrossRef]
- Bianco, E.; Di Napoli, L.; Grano, E.; Carello, M. E-scooter Modelling: Battery and Fuel Cell System Integration. In Advances in Italian Mechanism Science, Mechanisms and Machine Science; Niola, V., Gasparetto, A., Quaglia, G., Carbone, G., Eds.; Springer International Publishing: Cham, Switzerland, 2022; pp. 909–916. [Google Scholar]
- Khosravi, H.S.; Abbas, Q.; Reichmann, K. Electrochemical aspects of interconnect materials in PEMFCs. Int. J. Hydrogen Energy 2021, 46, 35420–35447. [Google Scholar] [CrossRef]
- Ding, Y.; Xu, L.; Zheng, W.; Hu, Z.; Shao, Y.; Li, J.; Ouyang, M. Characterizing the two-phase flow effect in gas channel of proton exchange membrane fuel cell with dimensionless number. Int. J. Hydrogen Energy 2023, 48, 5250–5265. [Google Scholar] [CrossRef]
- Shi, D.; Cai, L.; Zhang, C.; Chen, D.; Pan, Z.; Kang, Z.; Liu, Y.; Zhang, J. Fabrication methods, structure design and durability analysis of advanced sealing materials in proton exchange membrane fuel cells. Chem. Eng. J. 2023, 454, 139995. [Google Scholar] [CrossRef]
- Jia, F.; Tian, X.; Liu, F.; Ye, J.; Yang, C. Oxidant starvation under various operating conditions on local and transient performance of proton exchange membrane fuel cells. Appl. Energy 2023, 331, 120412. [Google Scholar] [CrossRef]
- Chu, T.; Tang, Q.; Wang, Q.; Wang, Y.; Du, H.; Guo, Y.; Li, B.; Yang, D.; Ming, P.; Zhang, C. Experimental study on the effect of flow channel parameters on the durability of PEMFC stack and analysis of hydrogen crossover mechanism. Energy 2023, 264, 126286. [Google Scholar] [CrossRef]
- Yu, R.; Guo, H.; Chen, H.; Ye, F. Influence of different parameters on PEM fuel cell output power: A three-dimensional simulation using agglomerate model. Energy Convers. Manag. 2023, 280, 116845. [Google Scholar] [CrossRef]
- Salva, J.A.; Iranzo, A.; Rosa, F.; Tapia, E.; Lopez, E.; Isorna, F. Optimization of a PEM fuel cell operating conditions: Obtaining the maximum performance polarization curve. Int. J. Hydrogen Energy 2016, 41, 19713–19723. [Google Scholar] [CrossRef]
- Li, W.; Yang, W.; Zhang, W.; Qu, Z.; He, Y. Three-dimensional modeling of a PEMFC with serpentine flow field incorporating the impacts of electrode inhomogeneous compression deformation. Int. J. Hydrogen Energy 2019, 44, 22194–22209. [Google Scholar] [CrossRef]
- Penga, Ž.; Bergbreiter, C.; Barbir, F.; Scholta, J. Numerical and experimental analysis of liquid water distribution in PEM fuel cells. Energy Convers. Manag. 2019, 189, 167–183. [Google Scholar] [CrossRef]
- Zhang, G.; Jiao, K. Three-dimensional multi-phase simulation of PEMFC at high current density utilizing Eulerian-Eulerian model and two-fluid model. Energy Convers. Manag. 2018, 176, 409–421. [Google Scholar] [CrossRef]
- Xu, S.; Liao, P.; Yang, D.; Li, Z.; Li, B.; Ming, P.; Zhou, X. Liquid water transport in gas flow channels of PEMFCs: A review on numerical simulations and visualization experiments. Int. J. Hydrogen Energy 2023, 48, 10118–10143. [Google Scholar] [CrossRef]
- Shang, K.; Han, C.; Jiang, T.; Chen, Z. Numerical study of PEMFC heat and mass transfer characteristics based on roughness interface thermal resistance model. Int. J. Hydrogen Energy 2023, 48, 7460–7475. [Google Scholar] [CrossRef]
- Randrianarizafy, B.; Schott, P.; Chandesris, M.; Gerard, M.; Bultel, Y. Design optimization of rib/channel patterns in a PEMFC through performance heterogeneities modelling. Int. J. Hydrogen Energy 2018, 43, 8907–8926. [Google Scholar] [CrossRef]
- Mohanty, S.; Desai, A.N.; Singh, S.; Ramadesigan, V.; Shaneeth, M. Effects of the membrane thickness and ionomer volume fraction on the performance of PEMFC with U-shaped serpentine channel. Int. J. Hydrogen Energy 2021, 46, 20650–20663. [Google Scholar] [CrossRef]
- Khatib, F.N.; Wilberforce, T.; Thompson, J.; Olabi, A.G. Experimental and analytical study of open pore cellular foam material on the performance of proton exchange membrane electrolysers. Int. J. Thermofluids 2021, 9, 100068. [Google Scholar] [CrossRef]
- Liao, Z.; Wei, L.; Dafalla, A.M.; Guo, J.; Jiang, F. Analysis of the impact of flow field arrangement on the performance of PEMFC with zigzag-shaped channels. Int. J. Heat Mass Transf. 2021, 181, 121900. [Google Scholar] [CrossRef]
- Zhang, S.-Y.; Qu, Z.-G.; Xu, H.-T.; Talkhoncheh, F.-K.; Liu, S.; Gao, Q. A numerical study on the performance of PEMFC with wedge-shaped fins in the cathode channel. Int. J. Hydrogen Energy 2021, 46, 27700–27708. [Google Scholar] [CrossRef]
- Seyhan, M.; Akansu, Y.E.; Murat, M.; Korkmaz, Y.; Akansu, S.O. Performance prediction of PEM fuel cell with wavy serpentine flow channel by using artificial neural network. Int. J. Hydrogen Energy 2017, 42, 25619–25629. [Google Scholar] [CrossRef]
- Guo, Q.; Zheng, J.; Qin, Y. Optimization of block structure parameters of PEMFC novel block channels using artificial neural network. Int. J. Hydrogen Energy 2022, 47, 38386–38394. [Google Scholar] [CrossRef]
- Wang, C.-N.; Yang, F.-C.; Nguyen, V.T.T.; Nguyen, Q.M.; Huynh, N.T.; Huynh, T.T. Optimal Design for Compliant Mechanism Flexure Hinges: Bridge-Type. Micromachines 2021, 12, 1304. [Google Scholar] [CrossRef]
- Huynh, N.T.; Nguyen, T.V.T.; Nguyen, Q.M. Optimum Design for the Magnification Mechanisms Employing Fuzzy Logic–ANFIS. Comput. Mater. Contin. 2022, 73, 5961–5983. [Google Scholar] [CrossRef]
- Amadane, Y.; Mounir, H.; Marjani, A.E.; Mohamed Karim, E. Optimization of Operating Parameters Af-fecting the Performance of Proton Exchange Membrane Fuel Cell (PEMFC) by Using Taguchi Method. In Proceedings of the 2019 International Conference of Computer Science and Renewable Energies (ICCSRE), Agadir, Morocco, 22–24 July 2019; pp. 1–5. [Google Scholar]
- Amadane, Y.; Mounir, H. Performance improvement of a PEMFC with dead-end anode by using CFD-Taguchi approach. J. Electroanal. Chem. 2022, 904, 115909. [Google Scholar] [CrossRef]
- Lin, C.-C.; Hsieh, C.-C. Study on proton exchange membrane fuel cells performance design: A case study of a small surface boat. Alex. Eng. J. 2022, 61, 4491–4505. [Google Scholar] [CrossRef]
- Abraham, B.P.; Murugavel, K.K. Influence of Catalyst Layer and Gas Diffusion Layer Porosity in Proton Exchange Membrane Fuel Cell Performance. Electrochim. Acta 2021, 389, 138793. [Google Scholar] [CrossRef]
- Chen, W.-H.; Tsai, Z.-L.; Chang, M.-H.; You, S.; Kuo, P.-C. Geometry optimization and pressure analysis of a proton exchange membrane fuel cell stack. Int. J. Hydrogen Energy 2021, 46, 16717–16733. [Google Scholar] [CrossRef]
- Ansys Fluent. Ansys Fluent Theory Guide 2021 R2; ANSYS, Inc. and Ltd.: Canonsburg, PA, USA, 2021. [Google Scholar]
- Wang, B.; Wu, K.; Xi, F.; Xuan, J.; Xie, X.; Wang, X.; Jiao, K. Numerical analysis of operating conditions effects on PEMFC with anode recirculation. Energy 2019, 173, 844–856. [Google Scholar] [CrossRef]
- Liu, H.; Zhang, G.; Li, D.; Wang, C.; Bai, S.; Li, G.; Wang, G. Three-dimensional multi-phase simulation of cooling patterns for proton exchange membrane fuel cell based on a modified Bruggeman equation. Appl. Therm. Eng. 2020, 174, 115313. [Google Scholar] [CrossRef]
Figure 1.
Three-dimensional geometric model of PEMFC.

Figure 2.
Mesh division of PEMFC. (a) Mesh of overall structure; (b) Mesh of catalytic layer and membrane.
Figure 2.
Mesh division of PEMFC. (a) Mesh of overall structure; (b) Mesh of catalytic layer and membrane.

Figure 3.
PEMFC experiment bench.

Figure 4.
Simulation results of PEMFC model after calibration. (a) The current density distribution on the cathode side of the membrane; (b) The water content distribution on the cathode side of the membrane.
Figure 4.
Simulation results of PEMFC model after calibration. (a) The current density distribution on the cathode side of the membrane; (b) The water content distribution on the cathode side of the membrane.


Figure 5.
Flowchart of analysis and optimization process.

Figure 6.
Regression and simulation results of the best combination and the worst combination of factors and levels.
Figure 6.
Regression and simulation results of the best combination and the worst combination of factors and levels.

Figure 7.
The influence of factors’ different levels on the current density. (a) The influence of different anode wave channel distortion on current density; (b) the influence of different gas diffusion layer thickness on current density; (c) the influence of different porosity on current density.
Figure 7.
The influence of factors’ different levels on the current density. (a) The influence of different anode wave channel distortion on current density; (b) the influence of different gas diffusion layer thickness on current density; (c) the influence of different porosity on current density.


Table 1.
Geometric model parameters of fuel cell.
| Geometric Parameter | Value | Unit |
|---|---|---|
| Battery model length/width | 270/5.32 | mm |
| Section parameters of anode and cathode flow channel upper bottom/lower bottom/height | 1.02/1.24/0.4 | mm |
| Cross-section parameters of cathode and anode cooling channel upper bottom/lower bottom/high | 2.3/2.44/0.277 | mm |
| Gas diffusion layer thickness of anode and cathode | 0.2 | mm |
| Anode and cathode plate height | 1.5 | mm |
| Thickness of Cathode and Anode Catalytic Layer | 0.01 | mm |
| Membrane thickness | 0.03 | mm |
| The distortion of the wave channel | 30 |
Table 2.
Material parameters and boundary conditions of model.
| Parameter | Value | Unit |
|---|---|---|
| Reference exchange current density of anode and cathode | 0.5/10,000 | |
| Reference concentration of anode and cathode | 0.00339/0.0564 | |
| Correlation coefficient of anode and cathode material concentration | 1/1 | |
| Transfer coefficient of anode and cathode of anode electrode | 0.5/0.5 | |
| The cathode and anode transfer coefficient of cathode electrode | 1.3; 1.3 | |
| Open circuit voltage | 1.06 | |
| Porosity of diffusion layer | 0.5 | |
| Absolute permeability of diffusion layer | 3 × 10⁻¹² | |
| Contact angle of diffusion layer | 150 | |
| Porosity of catalytic layer | 0.2 | |
| Absolute permeability of catalytic layer | 3 × 10⁻¹² | |
| Contact angle of catalytic layer | 110 | |
| Working pressure | 11,325 | |
| Pressure of outlet | 0 | |
| Relative inlet humidity of cathode and anode | 100% | |
| Working temperature | 353.15 |
Table 3.
Orthogonal experimental factor level.
| Factor | Distortion of the Anode Wave Flow Channel | Thickness of the Gas Diffusion Layer | Porosity of the Gas Diffusion Layer |
|---|---|---|---|
| A | C | ||
| Level 1 | 20 | 0.2 | 0.6 |
| Level 2 | 25 | 0.3 | 0.65 |
| Level 3 | 30 | 0.4 | 0.7 |
| Level 4 | 35 | 0.5 | 0.75 |
| Level 5 | 40 | 0.6 | 0.8 |
Table 4.
List of orthogonal arrays.
| Case | Variable Factors and Calculation Results of Each Level Grouping | |||
|---|---|---|---|---|
| A | C | |||
| Case 1 | 20 | 0.2 | 0.6 | 13,476.8 |
| Case 2 | 20 | 0.3 | 0.65 | 13,944.893 |
| Case 3 | 20 | 0.4 | 0.7 | 14,011.894 |
| Case 4 | 20 | 0.5 | 0.75 | 13,733.151 |
| Case 5 | 20 | 0.6 | 0.8 | 13,674.246 |
| Case 6 | 25 | 0.2 | 0.65 | 13,575.083 |
| Case 7 | 25 | 0.3 | 0.7 | 14,022.033 |
| Case 8 | 25 | 0.4 | 0.75 | 14,087.25 |
| Case 9 | 25 | 0.5 | 0.8 | 13,967.192 |
| Case 10 | 25 | 0.6 | 0.6 | 13,471.345 |
| Case 11 | 30 | 0.2 | 0.7 | 13,656.63 |
| Case 12 | 30 | 0.3 | 0.75 | 14,083.23 |
| Case 13 | 30 | 0.4 | 0.8 | 14,130.283 |
| Case 14 | 30 | 0.5 | 0.6 | 13,754.372 |
| Case 15 | 30 | 0.6 | 0.65 | 13,533.67 |
| Case 16 | 35 | 0.2 | 0.75 | 13,828.567 |
| Case 17 | 35 | 0.3 | 0.8 | 14,160.018 |
| Case 18 | 35 | 0.4 | 0.6 | 13,934.971 |
| Case 19 | 35 | 0.5 | 0.65 | 13,833.591 |
| Case 20 | 35 | 0.6 | 0.7 | 13,722.57 |
| Case 21 | 40 | 0.2 | 0.8 | 13,854.175 |
| Case 22 | 40 | 0.3 | 0.6 | 13,978.937 |
| Case 23 | 40 | 0.4 | 0.65 | 14,036.42 |
| Case 24 | 40 | 0.5 | 0.7 | 13,919.343 |
| Case 25 | 40 | 0.6 | 0.75 | 13,688.054 |
Table 5.
Current density treatment results.
| Level | A | B | C | |
|---|---|---|---|---|
| Average signal-to-noise ratio | 1 | 82.77 | 82.72 | 82.75 |
| 2 | 82.81 | 82.95 | 82.79 | |
| 3 | 82.81 | 82.95 | 82.84 | |
| 4 | 82.86 | 82.82 | 82.85 | |
| 5 | 82.86 | 82.68 | 82.89 | |
| Range of signal-to-noise ratio | 0.09 | 0.27 | 0.14 | |
| Contribution rate | 18% | 54% | 28% |
Table 6.
Regression analysis results of current density.
| Sig | |||
|---|---|---|---|
| 0.956 | 0.915 | 53.508 | |
| Model | Coefficient | t | Sig |
| constant | 11,613.26 | 63.0256 | 0.000 |
| A | 6.51 | 3.4911 | 0.002 |
| B | 7495.86 | 11.7542 | 0.000 |
| C | 1134.23 | 6.0781 | 0.000 |
| BB | −9765.88 | −12.3843 | 0.000 |
Disclaimer/Publisher’s Note: The statements, opinions and data contained in all publications are solely those of the individual author(s) and contributor(s) and not of MDPI and/or the editor(s). MDPI and/or the editor(s) disclaim responsibility for any injury to people or property resulting from any ideas, methods, instructions or products referred to in the content. |
© 2023 by the authors. Licensee MDPI, Basel, Switzerland. This article is an open access article distributed under the terms and conditions of the Creative Commons Attribution (CC BY) license (https://creativecommons.org/licenses/by/4.0/).
Share and Cite
MDPI and ACS Style
Yan, W.; Wang, J.; Li, J.; Wang, G. Optimizing Structural Parameters of PEMFC Based on Taguchi Method. World Electr. Veh. J. 2023, 14, 76. https://doi.org/10.3390/wevj14030076
AMA Style
Yan W, Wang J, Li J, Wang G. Optimizing Structural Parameters of PEMFC Based on Taguchi Method. World Electric Vehicle Journal. 2023; 14(3):76. https://doi.org/10.3390/wevj14030076
Chicago/Turabian StyleYan, Wei, Jichuan Wang, Jiaqi Li, and Guihua Wang. 2023. "Optimizing Structural Parameters of PEMFC Based on Taguchi Method" World Electric Vehicle Journal 14, no. 3: 76. https://doi.org/10.3390/wevj14030076