
Effect of Directional Auditory Takeover Request on Takeover Behavior and Eye Movement in Conditionally Automated Driving

1
School of Automotive Studies, Tongji University, Shanghai 201804, China
2
College of Design and Innovation, Tongji University, Shanghai 200092, China
*
Author to whom correspondence should be addressed.
World Electr. Veh. J. 2023, 14(3), 70; https://doi.org/10.3390/wevj14030070
Submission received: 19 February 2023
/
Revised: 4 March 2023
/
Accepted: 7 March 2023
/
Published: 9 March 2023
Abstract
:Conditionally automated driving (CAD) systems allow the driver to temporarily disengage from driving tasks. The significant concern of CAD is to ensure a safe and timely transition to the manual driving mode when the system exceeds its limits and issues a takeover request (TOR). The aim of this study was to investigate the effect of directional auditory TOR on the driver takeover process. A within-subject experimental design was used: twenty-four participants drove four times in an automated driving simulation scenario and received two non-directional auditory TORs and two directional auditory TORs (TOR directions corresponding to the orientation of potential hazards). The takeover behavior and eye movement characteristics relevant to the takeover process were collected. The results showed that directional auditory TOR enabled drivers to shift their visual attention to the hazards’ area faster than non-directional auditory TOR, accelerating the driver’s understanding of the road environment and improving takeover behavior. The study may provide a reference for the design of takeover requests for conditionally automated driving.
1. Introduction
1.1. General Overview
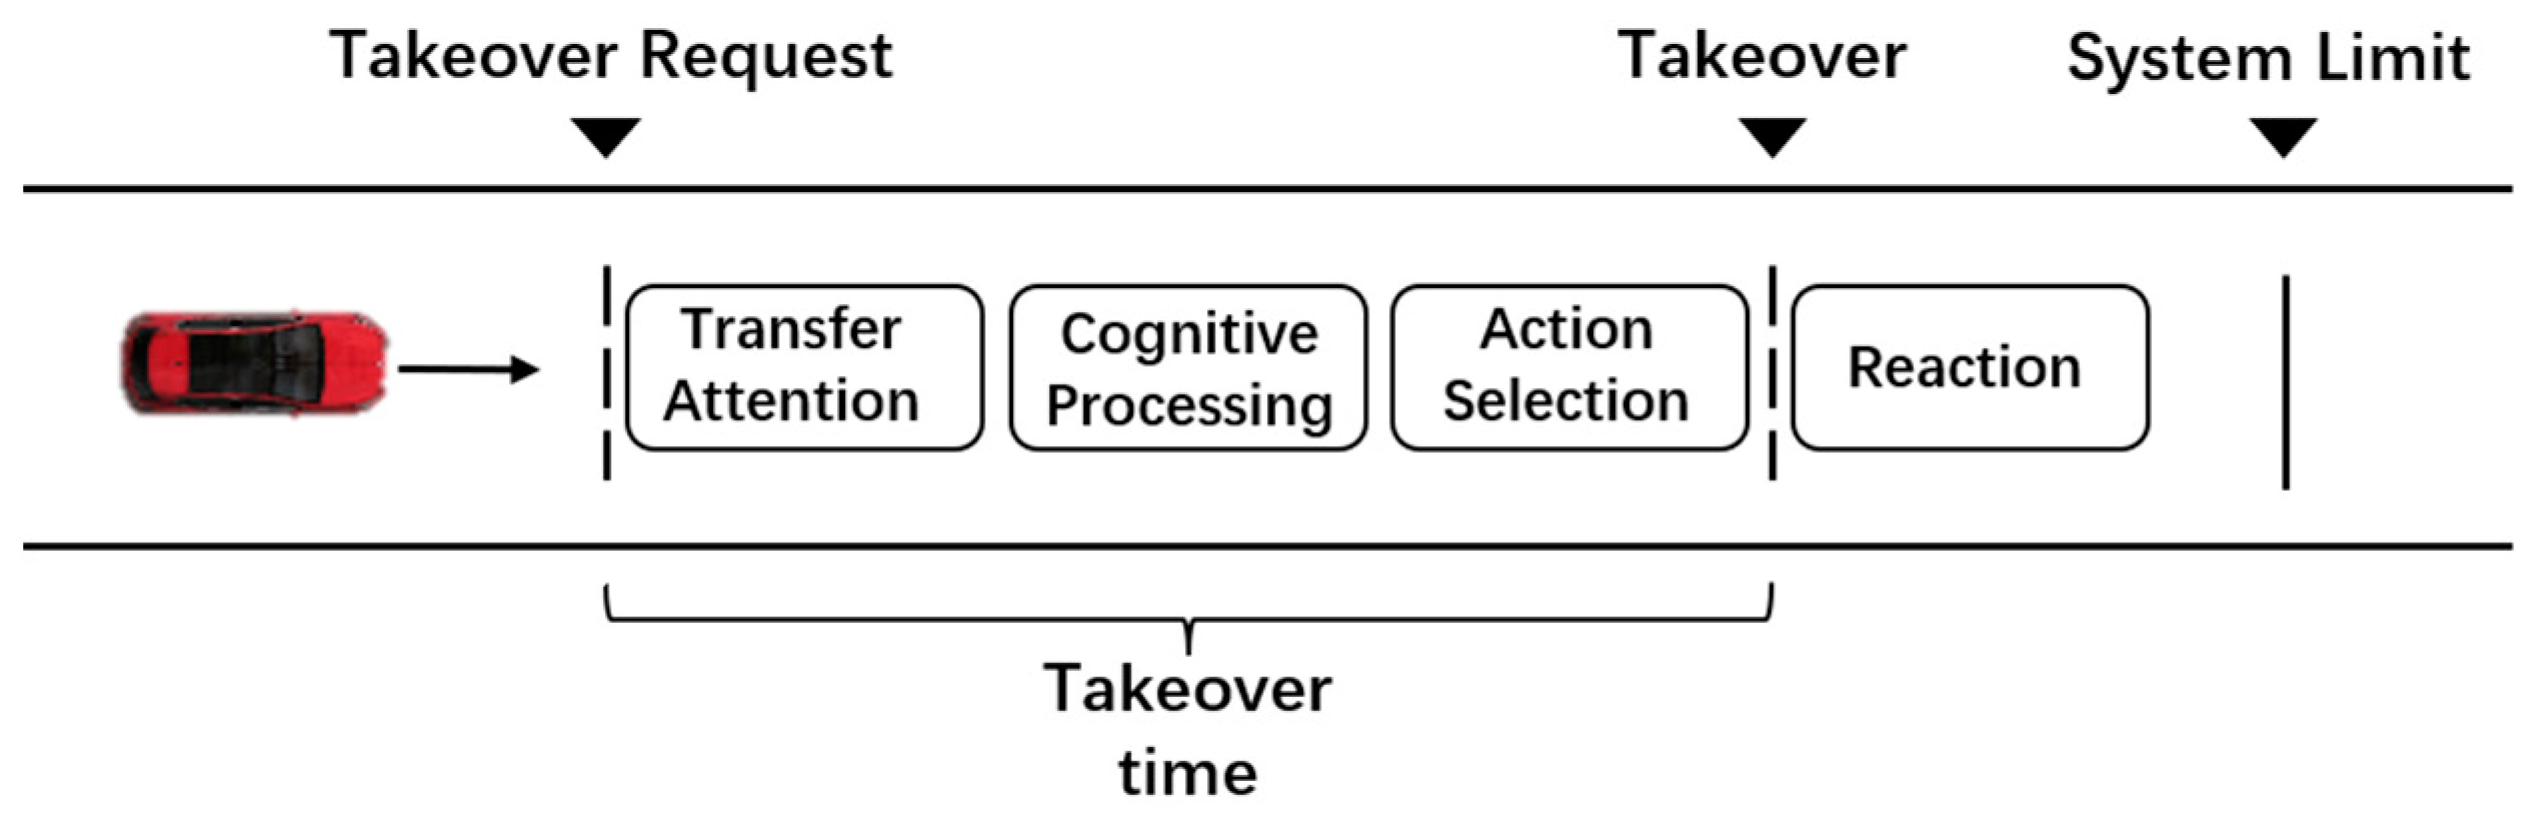
Automated driving systems can effectively reduce the burden of drivers and improve road traffic efficiency, which is the breakthrough point in the development of the modern automotive industry. The Society of Automotive Engineers classifies automated driving into different levels from L0 to L5 based on the scope of responsibility of the driver and the automated driving system as well as the functional content of the automated driving system. At present, we can already see L2 automated vehicles on the road, but the driver must be fully responsible for the vehicle’s driving tasks and automated driving system supervision tasks when the system is activated. In L3 of vehicle autonomy, conditionally automated driving (CAD), the vehicle is able to drive automatically and without constant driver monitoring, so the driver may focus on non-driving related tasks, including watching videos, reading the news, talking to others, etc. However, if the automated driving system malfunctions or exceeds the operational limits, human intervention is required, and the system sends a takeover request to the driver, who is required to respond and take over the vehicle. After the driver has been out of the loop for a long time, their situation awareness of the driving environment will be diminished, and this will increase the reaction time to take over the vehicle if a road accident or system failure happens [1]. According to Zeeb et al. [2] and Kerschbaum et al. [3], taking over control from the automated driving system involves several mental and physical stages, as shown in Figure 1. The driver must go through the following stages to resume control: (1) shift visual attention from non-driving related tasks to the road; (2) scan the driving scenario, cognitively process and evaluate the traffic environment, and make appropriate decisions; (3) move hands and feet to the steering wheel and pedals for control inputs; and (4) perform appropriate actions through the steering wheel and/or pedals.
Appropriate information interaction between the system and the driver is crucial during the transition from automated driving mode to manual driving mode. The takeover request, as the starting point of the takeover process, is key to ensuring safety during automated driving and reducing the rate of automated driving accidents.
1.2. Visual, Auditory and Vibrotactile TORs
In recent years, experts and scholars have conducted numerous studies on takeover requests. In terms of visual TORs, a common visual TOR is to present information about the takeover request on the dashboard, such as current vehicle status and distance to danger [4,5]. Brandenburg et al. [6] showed that the response to takeover requests was faster and more accurate with an anthropomorphic design than with an abstract design and that drivers found the anthropomorphic design easier to understand. Löcken et al. [7] found that surrounding LEDs can make distracted drivers more aware of TOR and speed up the decisions constituting the take-over process. Although visual stimuli can provide a large amount of visual information in a short time to help drivers understand hazards in their surroundings, the driver’s attention to the visual interface may weaken drivers’ attention to the environment [8]. Forster et al. [9] found that auditory TORs had shorter response times than visual TORs. Moreover, adding voice reminders, such as “please take over”, to the generic stimulus can help improve the driver’s comfort in taking over. Bazilinsky et al. [10] compared the preference for four different natural alert tones and found that a continuous “beeps” sound was most preferred by users. Naujoks et al. [11] investigated the comparison of the effect of siren and voice takeover requests under missing lane line conditions on highways through simulator experiments and concluded that the siren had a shorter response time than voice alerts when performing complex driving tasks. Bazilinsky et al. [4] conducted a public survey of 140 speech-based takeover requests with different intonation and speed, and the results showed that faster and more verbalized phrases (e.g., “Please take over”, “Take over now”) were more likely to make drivers feel urgent, while the gender or mood of the voice announcer did not have a significant effect on driver takeover. Roche et al. [12] studied a construction zone takeover scenario and found that auditory-only takeover requests outperformed auditory + visual takeover requests. Although speech-based TOR is more informative, it takes longer to deliver and requires more attention. In terms of vibrotactile TORs, Telpaz et al. [13] demonstrated in their study that tactile vibration signals are an effective way to assist the driver to take over the vehicle faster. In addition, Yoon et al. [14] pointed out that the mixed takeover request mode that includes visual, vibrotactile, and auditory stimuli is the most satisfactory mode for the driver.
1.3. Analysis of Auditory TOR and Directionality
The mentioned literature shows that visual, auditory, and vibrotactile requests to take over can receive the driver’s full attention and thus assist them in taking over successfully. Furthermore, auditory and vibrotactile stimuli have been proven to result in faster reaction times than visual stimuli, possibly due to the fact that auditory and vibrotactile feedback requires fewer cognitive resources than visual feedback, and driving is primarily a visual task [15]. However, the vibrotactile stimulus relies on the steering wheel or seat (seat cushion or backrest) and other internal parts of the car, which are more influenced by the sitting position of the driver or even the thickness of the clothes [16]. In addition, there is research that found that redundant visual–auditory stimuli did not improve drivers’ lane maintenance compared to auditory-only stimuli [17]. Thus, it seems that auditory stimuli may be the most promising way to issue take over requests. However, while previous research on auditory TORs has mainly focused on the content, timbre, and frequency, the directionality of sound has rarely been investigated. Petermeijer et al. [18] pointed out that directional auditory stimuli do not evoke a directional response. However, the experimental design is inadequate and limited by driving habits and traffic rules. In manual driving, sounds from different directions, such as honks and brakes, can help drivers quickly understand the surrounding road environment. Similarly, auditory stimuli from different directions should also help drivers to detect potential hazards and understand the surrounding road conditions faster and more naturally. For example, among the research related to Collision Warning Systems, it has been widely proven that directional information of auditory warning can help drivers react to critical events at signalized intersections faster than non-directional warning [19,20,21].
Therefore, in this study, we recorded videos of automated driving scenarios and designed different directional auditory TORs based on the 5.1 channel which includes six speakers and can create sound from many different directions. Then we design the experiment to evaluate the effect of directional auditory TOR on takeover behavior and eye-movement characteristics.
2. Materials and Methods
2.1. Participants
A total of 24 participants (5 females and 19 males) were recruited, and written informed consent was obtained from each participant. All participants are students and faculty of the university, whose ages varied from 22 to 41 years old (M = 27.8, SD = 5.4). Their mean driving experience was 5.8 years (SD = 3.7). Of the participants, 10 reported a mileage of 1–1000 km, 7 reported a mileage of 1001–5000 km, and 7 reported a mileage of 5001–15,000 km in the past 12 months. All participants could distinguish the directionality of the sound. After the experiment, each participant received a payment of CNY 200.
2.2. Experimental Equipment
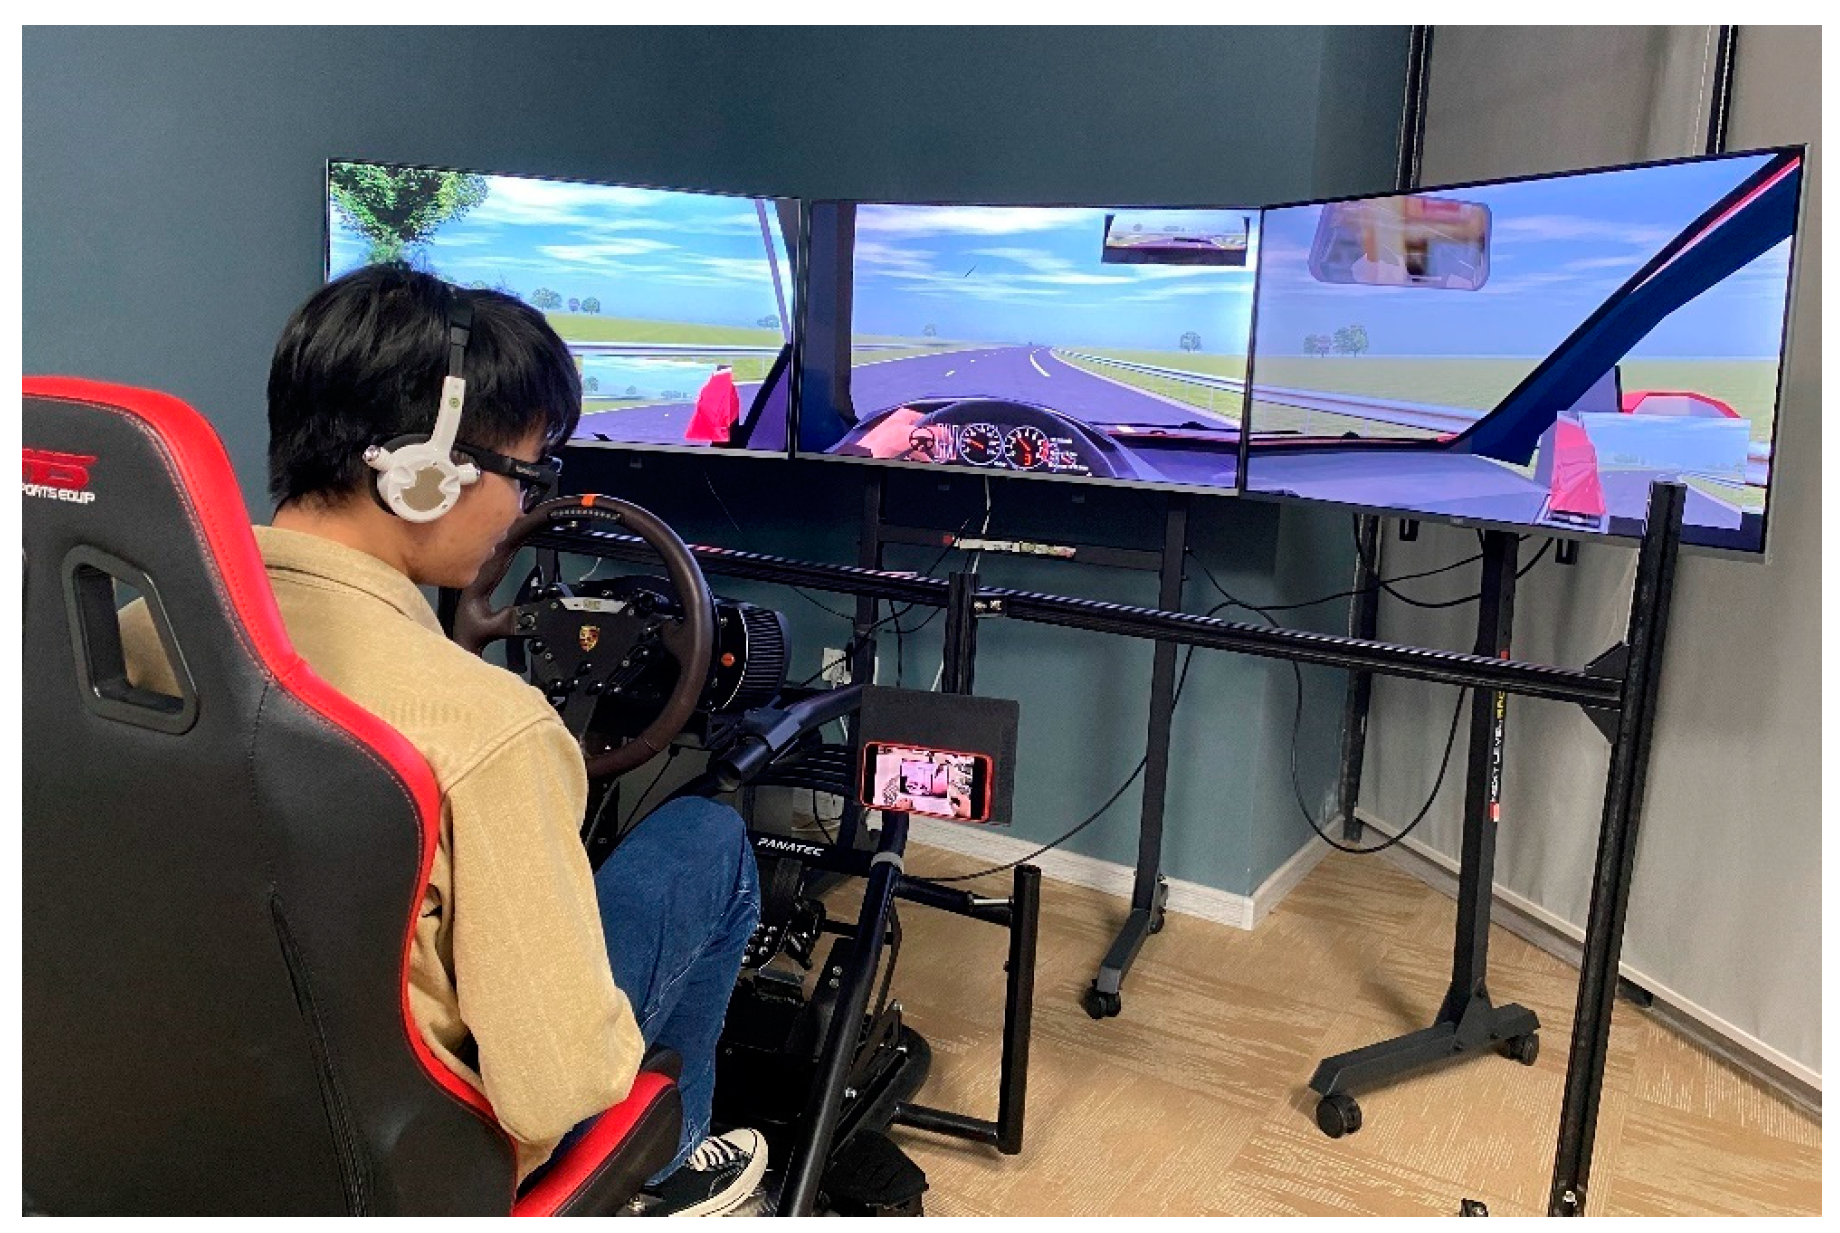
Figure 2 shows the driving simulator used for this experiment. The simulator was modified based on a set of Fanatec® simulated cockpit including the steering wheel and pedals with force feedback. Three 43-inch screens were placed to display the simulated driving scenarios, and they built a field-of-view of approximately 95°. An eye-tracking device (Tobii Pro Glasses 3) was used to collect the participants’ eye movements, which can capture data such as fixation, fixation time, fixation area, glance time, pupil diameter, etc. The sampling frequency is 50 Hz. A headset (Track Vibras) with 5.1 channel system was used to play auditory stimuli. A smartphone was used by the participants for non-driving related tasks.
2.3. Conditional Automation Driving Simulation Scenarios
Intersections and curves are more complex and have plenty of potential hazards in more directions than straight roads [11,22]. This is because, in intersection and curve scenarios, drivers are faced with additional vertical oncoming traffic or need to control both longitudinal and lateral movement of the vehicle. Therefore, this experiment built the following two types of scenarios in SCANeR Studio Version 2022.
- (1)
- Intersection: 5000 m long with 6 lanes in both directions; each lane was 3.5 m wide. Before the takeover request was issued, the CAD system was driving at a constant speed of 50 km/h in the middle lane. The takeover scenario is shown below. The vehicle was about to enter an intersection when it detected a traffic accident ahead. The CAD system approached boundary conditions. At the same time, a two-wheeler with a speed of 15 km/h appeared at the left front/right front intersection with a distance of 30 m, moving in a direction perpendicular to the experiment vehicle’s travel direction. It was considered a potential danger and an auditory TOR was issued;
- (2)
- Curve: 5000 m long with a radius of curvature of 500 m; 2 lanes in the same direction; each lane was 3.5 m wide. Before the takeover request was issued, the vehicle was driving at a constant speed of 50 km/h in the current lane. The takeover scenario is shown below. The CAD system detected a traffic accident ahead and approached boundary conditions. At the same time, a vehicle with a distance of 30 m in the adjacent lane was rapidly approaching and overtaking at a speed of 80 km/h. It was considered a potential danger and an auditory TOR was issued.
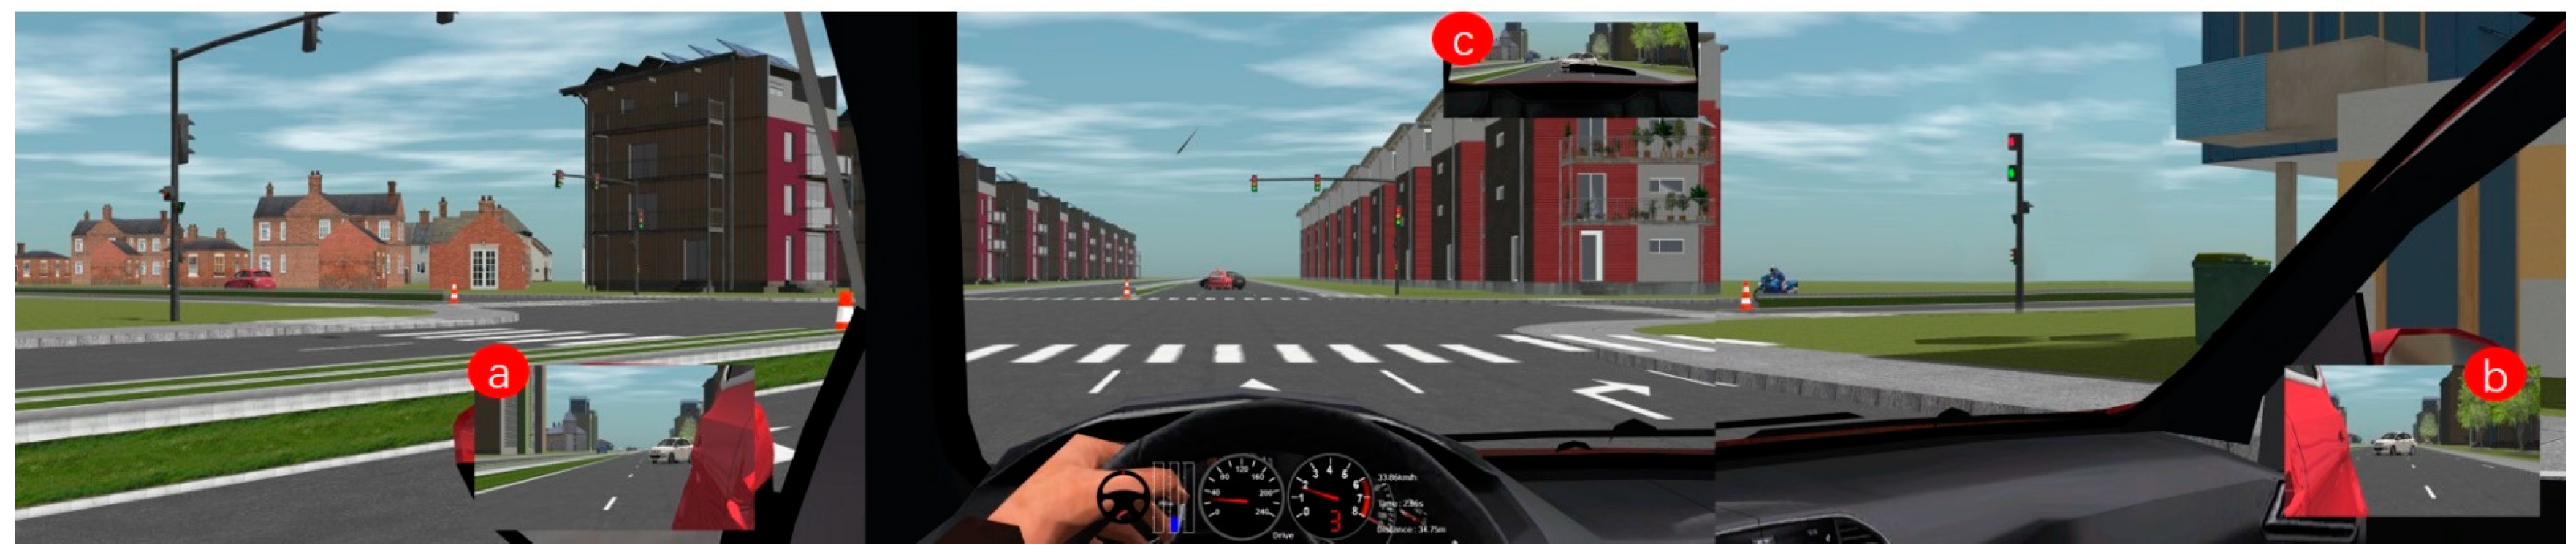
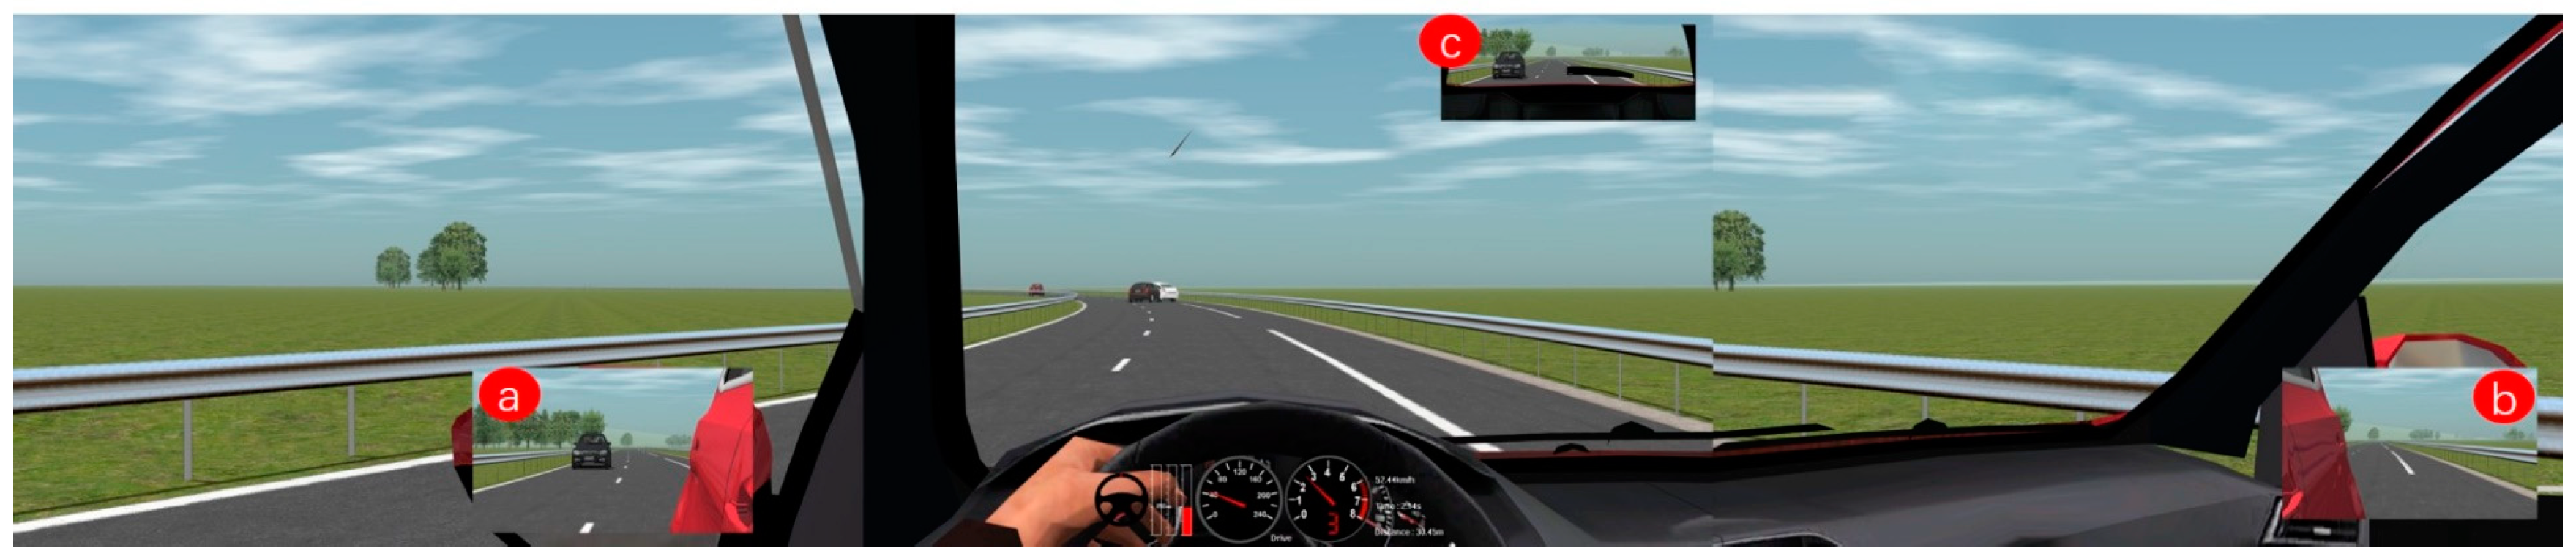
Figure 3 shows what participants can see on the display. Basically, it is the same as the driver’s view in the vehicle cockpit; participants could see the road and vehicle ahead, A-pillar, steering wheel, left rearview mirror, center rearview mirror, and right rearview mirror, etc. Restricted by SCANeR Studio, we had set it to automated driving mode even though it showed hands on the steering wheel. Similarly, participants could also see traffic lights in the intersection scenario, but in fact the traffic lights did not work.
The number and type of environmental elements presented in the simulated driving scenario were roughly the same but appeared in different locations and at different times. The aim was to create different combinations of environmental elements under different conditions, forming a random order and reducing the learning effect.
2.4. Auditory TORs Design
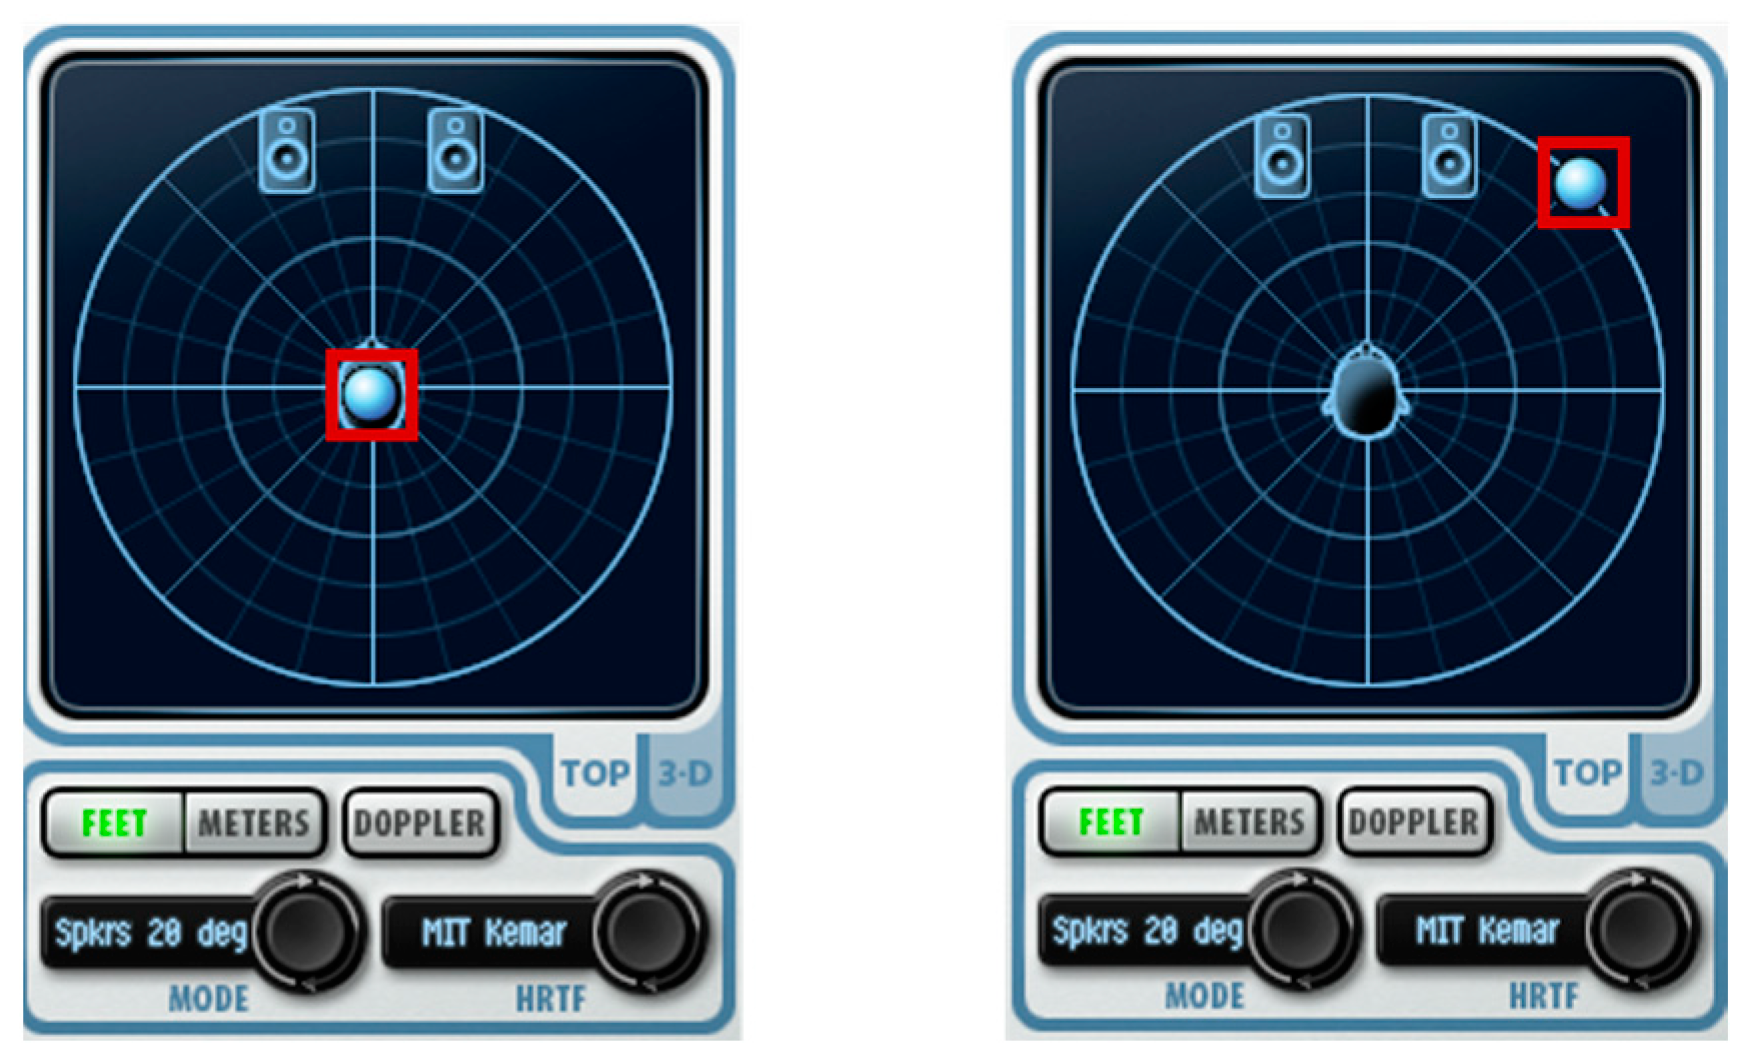
Studies have shown that continuous “beeps” are preferred by users [4], and the average takeover time of auditory TORs is within 3 s [15]. Therefore, this study used Steinberg Cubase Version 12 software to design 3 s “beeps” auditory stimuli. The non-directional and directional TORs configuration interfaces are shown in Figure 4.
We first created five auditory stimuli (non-direction. left front, right front, left rear, right rear), which differed only in direction. Then, for each scenario, we edited the script in SCANeR to call different audio, specifying that the corresponding auditory stimulus would be played once the time to collision with the accident ahead is less than 7 s [23].
2.5. Non-Driving Related Tasks
A survey by Pfleging et al. [24] found that drivers preferred activities such as using smartphones, talking to passengers, and listening to music in higher-level ADSs. Therefore, more consideration needs to be given to naturalistic tasks in the study of the CAD system. In this experiment, non-driving related tasks were not included as one of the experimental variables, so we considered watching smartphone videos as a distraction in simulated driving.
2.6. Experimental Design and Procedure
The study used a within-subject design with different types of auditory TORs. Each participant performed 4 sessions: 2 driving scenarios (intersection & curve) × 2 auditory TORs (non-directional and directional). In the same type of scenario, the hazard appeared on the left side and another time on the right side. It is important to emphasize that the orientation of the directional auditory TOR corresponds to the location of the potential hazards of the driving scenario (e.g., the left-front hazard in the intersection scenario corresponds to the auditory TOR from the left front). In addition, we avoided the possible influence of sequence effect on experimental results by equalizing the presentation order of directional TOR and non-directional TOR (one-half of the participants experienced directional TOR first and the other half experienced non-directional TOR first). The timing of the takeover request and the orientation of the hazard were slightly different for each session to avoid learning effects and to ensure that differences in takeover behavior and eye-movement characteristics can be directly attributed to the differences in takeover requests.
Upon arrival, participants received written instructions and a consent form. After signing the consent form, participants completed an introductory questionnaire that included the participant’s gender, age, and questions about their driving experience. Participants were then verbally informed of the experimental procedure and screen display content. The importance of focusing on NDRT in CAD mode and switching their attention as soon as possible after receiving a takeover request were stressed.
Next, participants drove a 3-min familiarization session in which they practiced how to use the steering wheel and pedals. The road environment in this session was similar to the forthcoming sessions, but without the hazards.
In the formal experiment, participants first went through the automated driving scenario for about 5 min, then received a “beeps” request to take over for about 3 s. Once hearing the TOR, participants turned their eyes from the smartphone to the display as soon as possible and observed information about the driving environment. After the simulator received a valid action input (steering wheel angle greater than 2 degrees or pedal stroke greater than 10% [25]), it switched from automatic driving mode to manual driving mode. Then, participants were asked to take control to ensure the safety of the vehicle. A session ended after the vehicle had passed the takeover incident and returned to the original lane.
Each session took about 6 min. After each session, participants took a break for about 2 min while the experimenter recorded and saved the data and changed the experimental scenario.
2.7. Dependent Variables
The following dependent variables were used:
- (1)
- Collision rate (%): the proportion of participants failing to takeover properly and colliding with potential hazards or the traffic accident;
- (2)
- Takeover time (ms): the time from the start of the TOR to the participant reengaging control of the vehicle. In this study, we defined reengaging control of the vehicle as the steering wheel angle greater than 2 deg or pedal depression greater than 10%;
- (3)
- Deceleration (m/s2): maximum longitudinal acceleration during the takeover, which is measured from the time when the TOR is issued to the time when the accident is avoided, or collisions occur;
- (4)
- Steering wheel angle (°): maximum steering wheel angle during the takeover, which is measured from the time when the TOR is issued to the time when the accident is avoided, or collisions occur;
- (5)
- Time to the first fixation on the area of interest (AOI) (ms): in this study, the AOI refers to the area where the potential hazard is located after TORs, such as the right rearview mirror, left rearview mirror, front left view, and front right view. The time between the start of the TOR and the participant’s first fixation at the AOI is the time to the first fixation on the AOI;
- (6)
- AOI fixation rate (%): the proportion of the time fixations which are in the AOI to the total duration of fixation;
- (7)
- Average pupil diameter (mm): pupil diameter of participants during the period from the start of TOR to the participant’s response;
2.8. Statistical Analyses
The data were analyzed with IBM SPSS Statistics Version 26. Data obtained for each of the dependent variables were analyzed descriptively and tested to see if they were normally distributed using the Shapiro–Wilk test. According to the data type and within-subject design, inferential methods were applied as shown in Table 1. For the eye movement data, we only utilized data from participants with a tracking ratio above 90%.
3. Results
3.1. Eye Movement
3.1.1. Time to the First Fixation on AOI
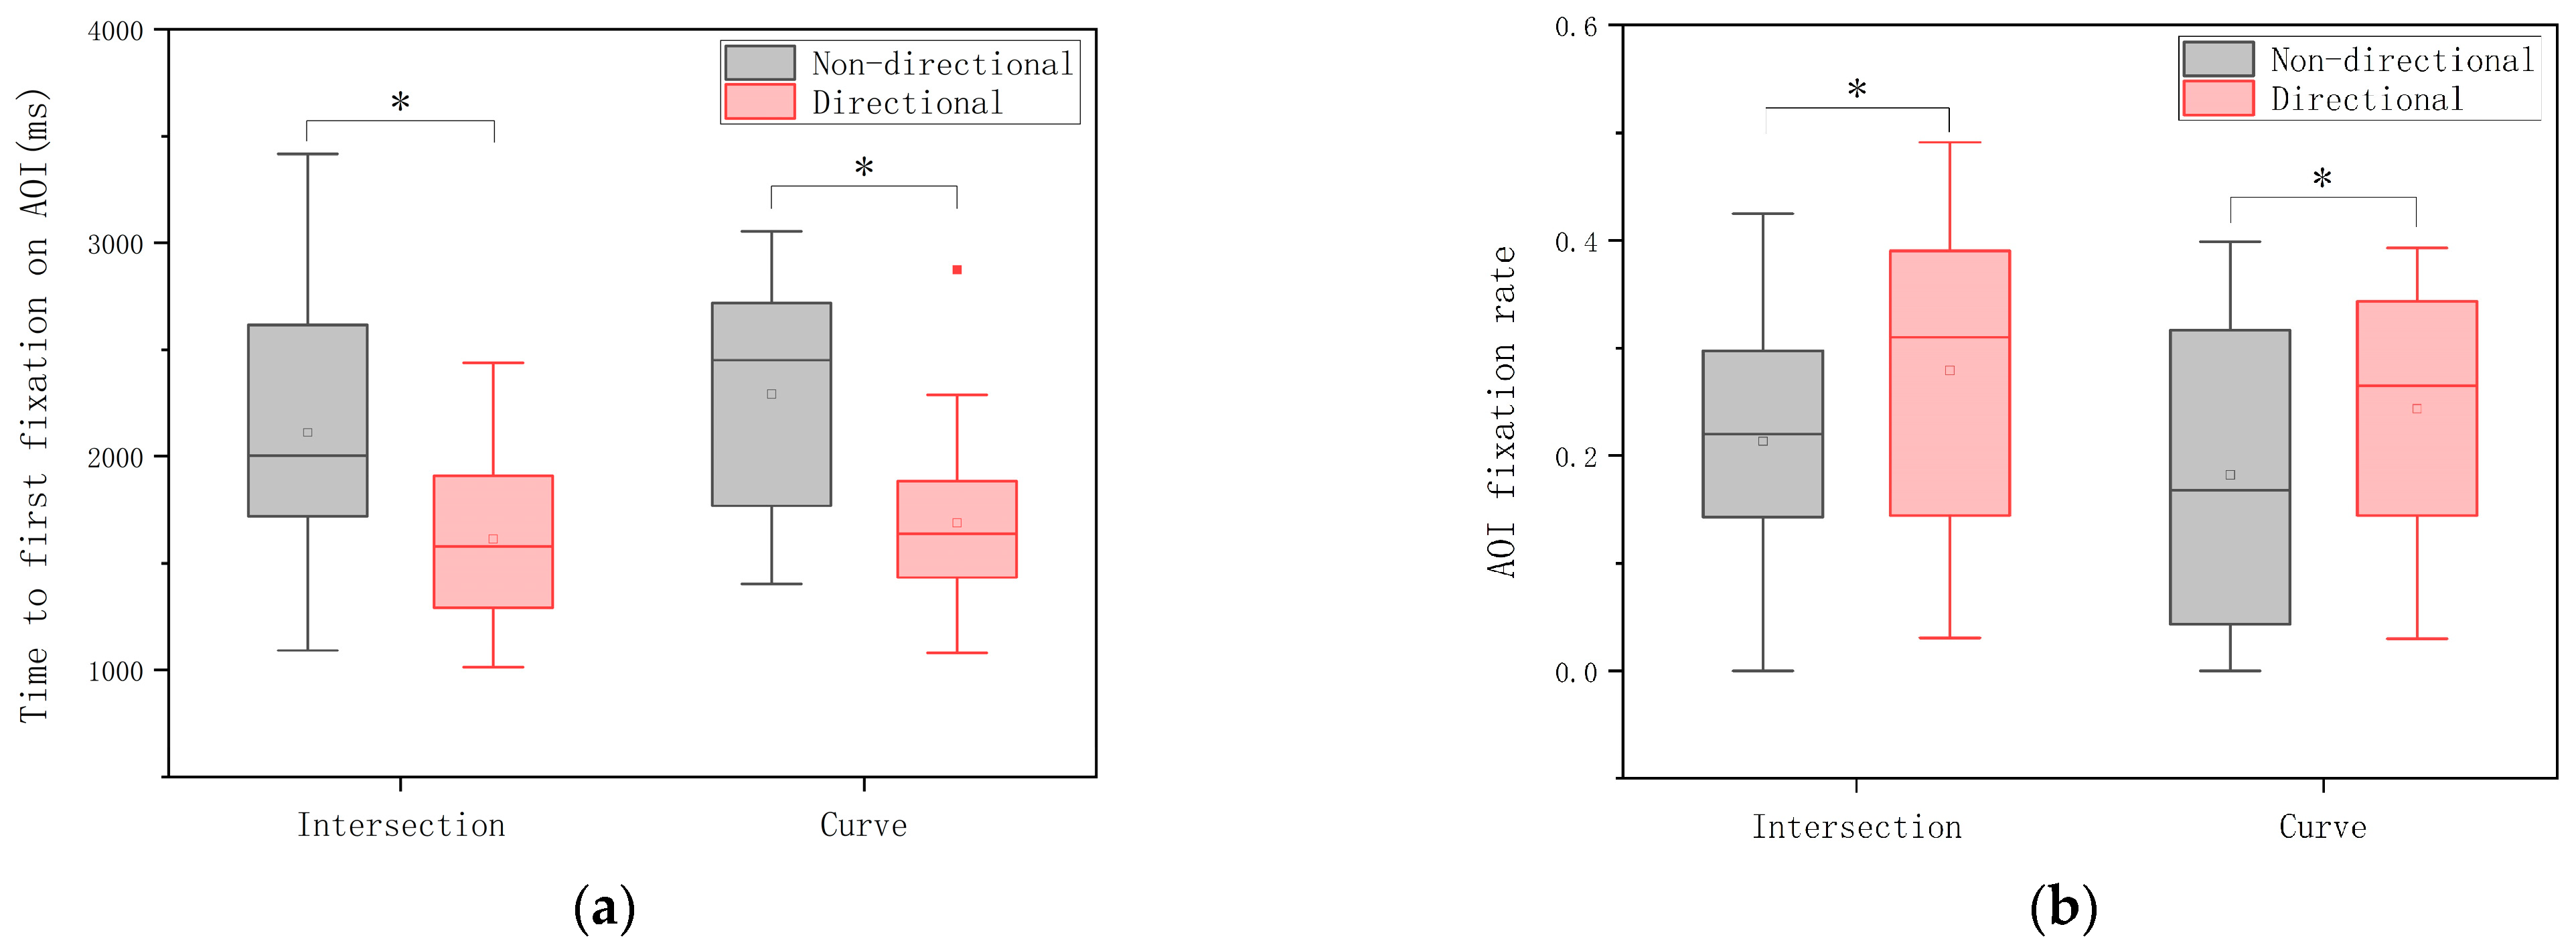
Figure 5a shows the comparison of the time to the first fixation on AOI with different types of auditory TORs. In the intersection scene, the time to the first fixation on AOI with the directional auditory TORs (M = 1613.2 ms, SD = 316.2 ms) was shorter than the time to the first fixation on AOI with the non-directional auditory TORs (M = 2112.4 ms, SD = 550.3 ms), and this difference was statistically significant (paired t-test, t (23) = 2.580, p = 0.017). In the curve scenario, the time to the first fixation on AOI with the directional auditory TORs (M = 1687.9 ms, SD = 395.2 ms) was shorter than the time to the first fixation on AOI with the non-directional auditory TORs (M = 2291.7 ms, SD = 509.5 ms), and this difference was statistically significant (paired t-test, t (23) = 2.218, p = 0.037).
3.1.2. AOI Fixation Rate
Figure 5b shows the comparison of the fixation rate of AOI for different types of auditory TORs. In the intersection scenario, participants’ AOI fixation rate was higher with directional auditory TORs (M = 0.285, SD = 0.123) than with non-directional auditory TORs (M = 0.213, SD = 0.120), and this difference was statistically significant (paired t-test, t (23) = −2.148, p = 0.043). In the curve scenario, participants’ AOI fixation rate was higher with directional auditory TORs (M = 0.244, SD = 0.111) than with non-directional auditory TORs (M = 0.182, SD = 0.137), and this difference was statistically significant (paired t-test, t (23) = −2.240, p = 0.035).
3.1.3. Average Pupil Diameter
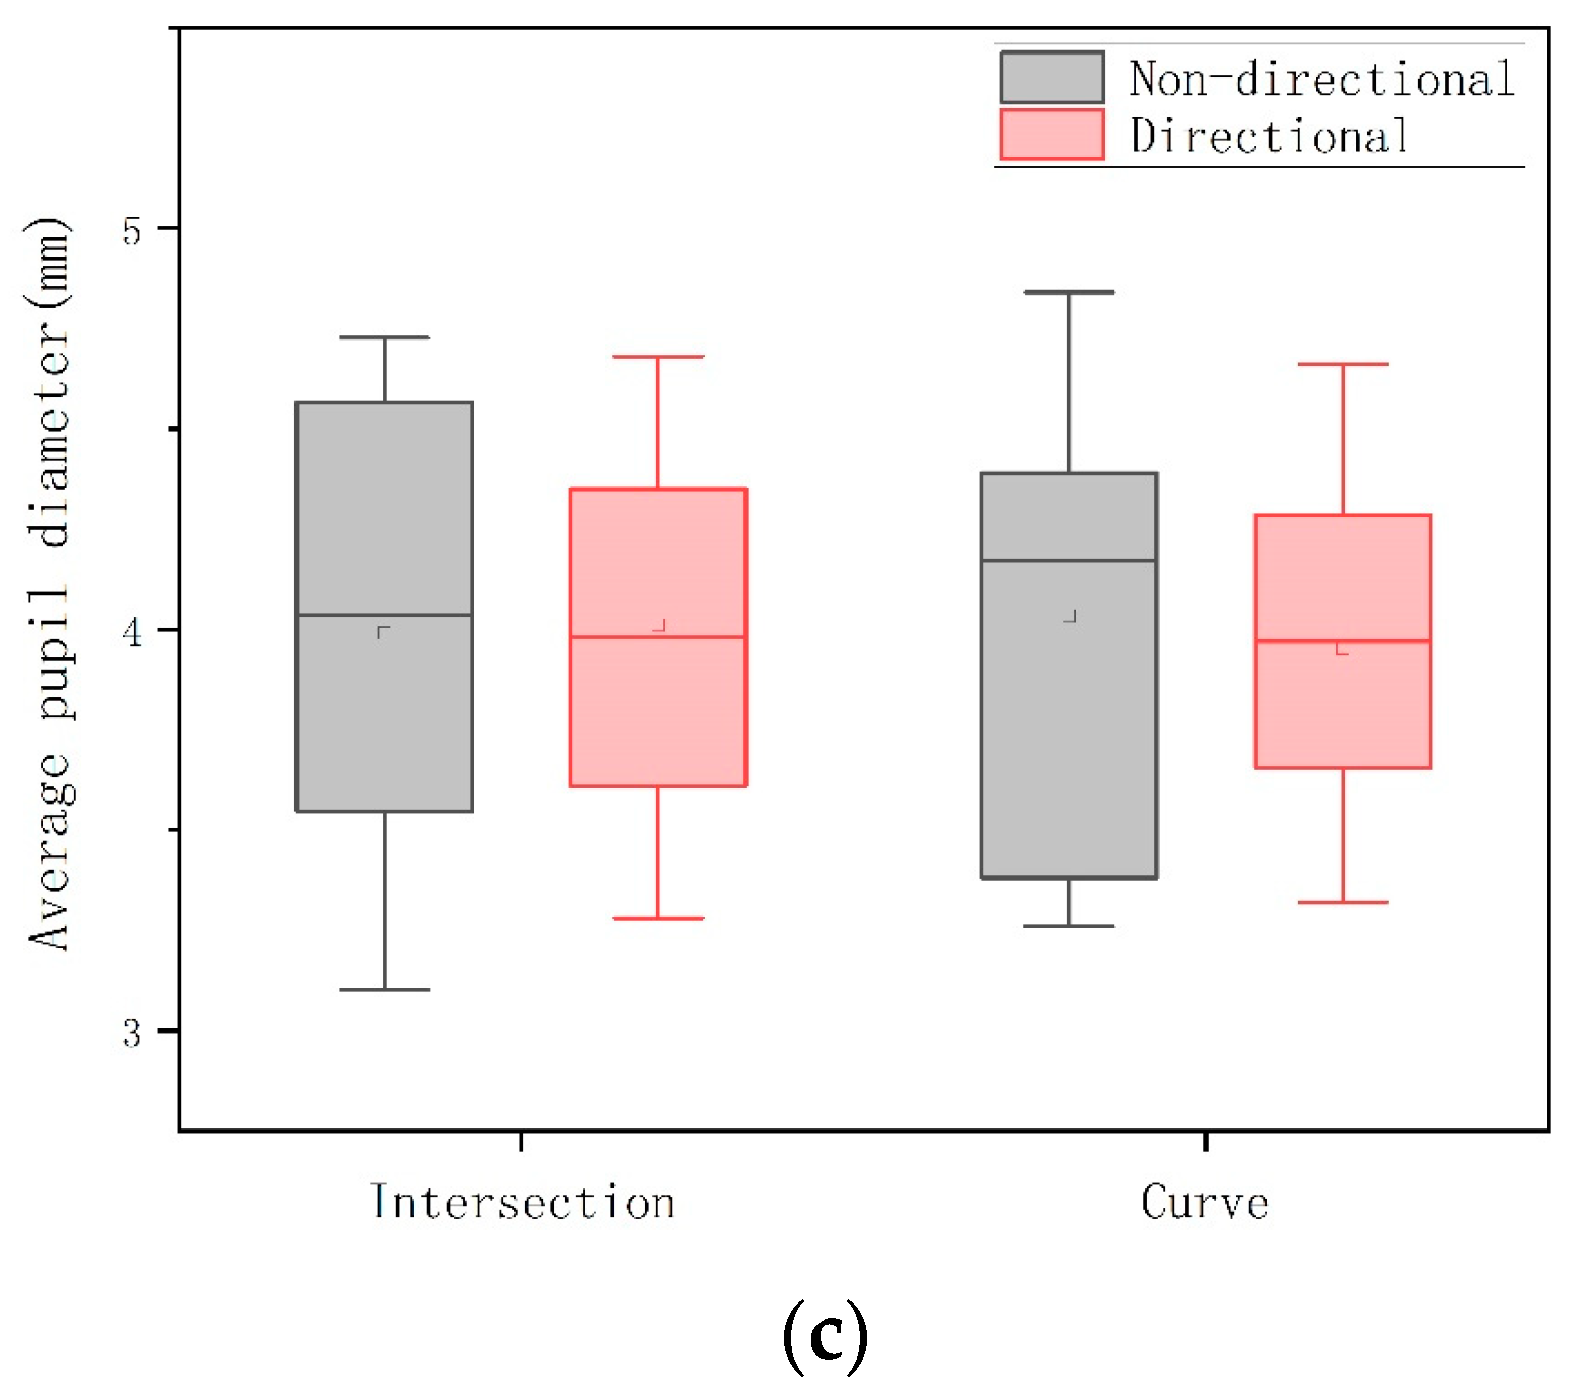
Figure 5c shows the comparison of pupil diameters of participants with different types of auditory TORs. It was found that the directional TOR produces a more concentrated distribution of pupil diameter data. In the intersection scenario, the mean pupil diameter of participants with the directional auditory TORs (M = 4.01 mm, SD = 0.44 mm) was smaller than the mean pupil diameter of participants with the non-directional auditory TORs (M = 3.99 mm, SD = 0.54 mm), but this difference was not statistically significant at the statistical level (Wilcoxon signed-rank, Z = −0.314, p = 0.753). In the curve scenario, the mean pupil diameter of participants with the directional auditory TORs (M = 3.95 mm, SD = 0.37 mm) was smaller than the mean pupil diameter of participants with the non-directional auditory TORs (M = 4.03 mm, SD = 0.51 mm), but the difference was not statistically significant at the statistical level (Wilcoxon signed-rank, Z = −0.529, p = 0.597).
3.2. Takeover Behavior
3.2.1. Collision Rate
The analysis shows that the collision rate of directional auditory TORs (8%) was lower than that of non-directional auditory TORs (29%) in the intersection scenario, but there was no statistically significant difference between the two (Fisher’s exact probability test, p = 0.137). The collision rate of directional auditory TOR (4%) was lower than that of non-directional auditory TOR (38%) in the curve scenario, and there was a statistically significant difference between the two (Fisher’s exact probability test, p = 0.010).
3.2.2. Takeover Time
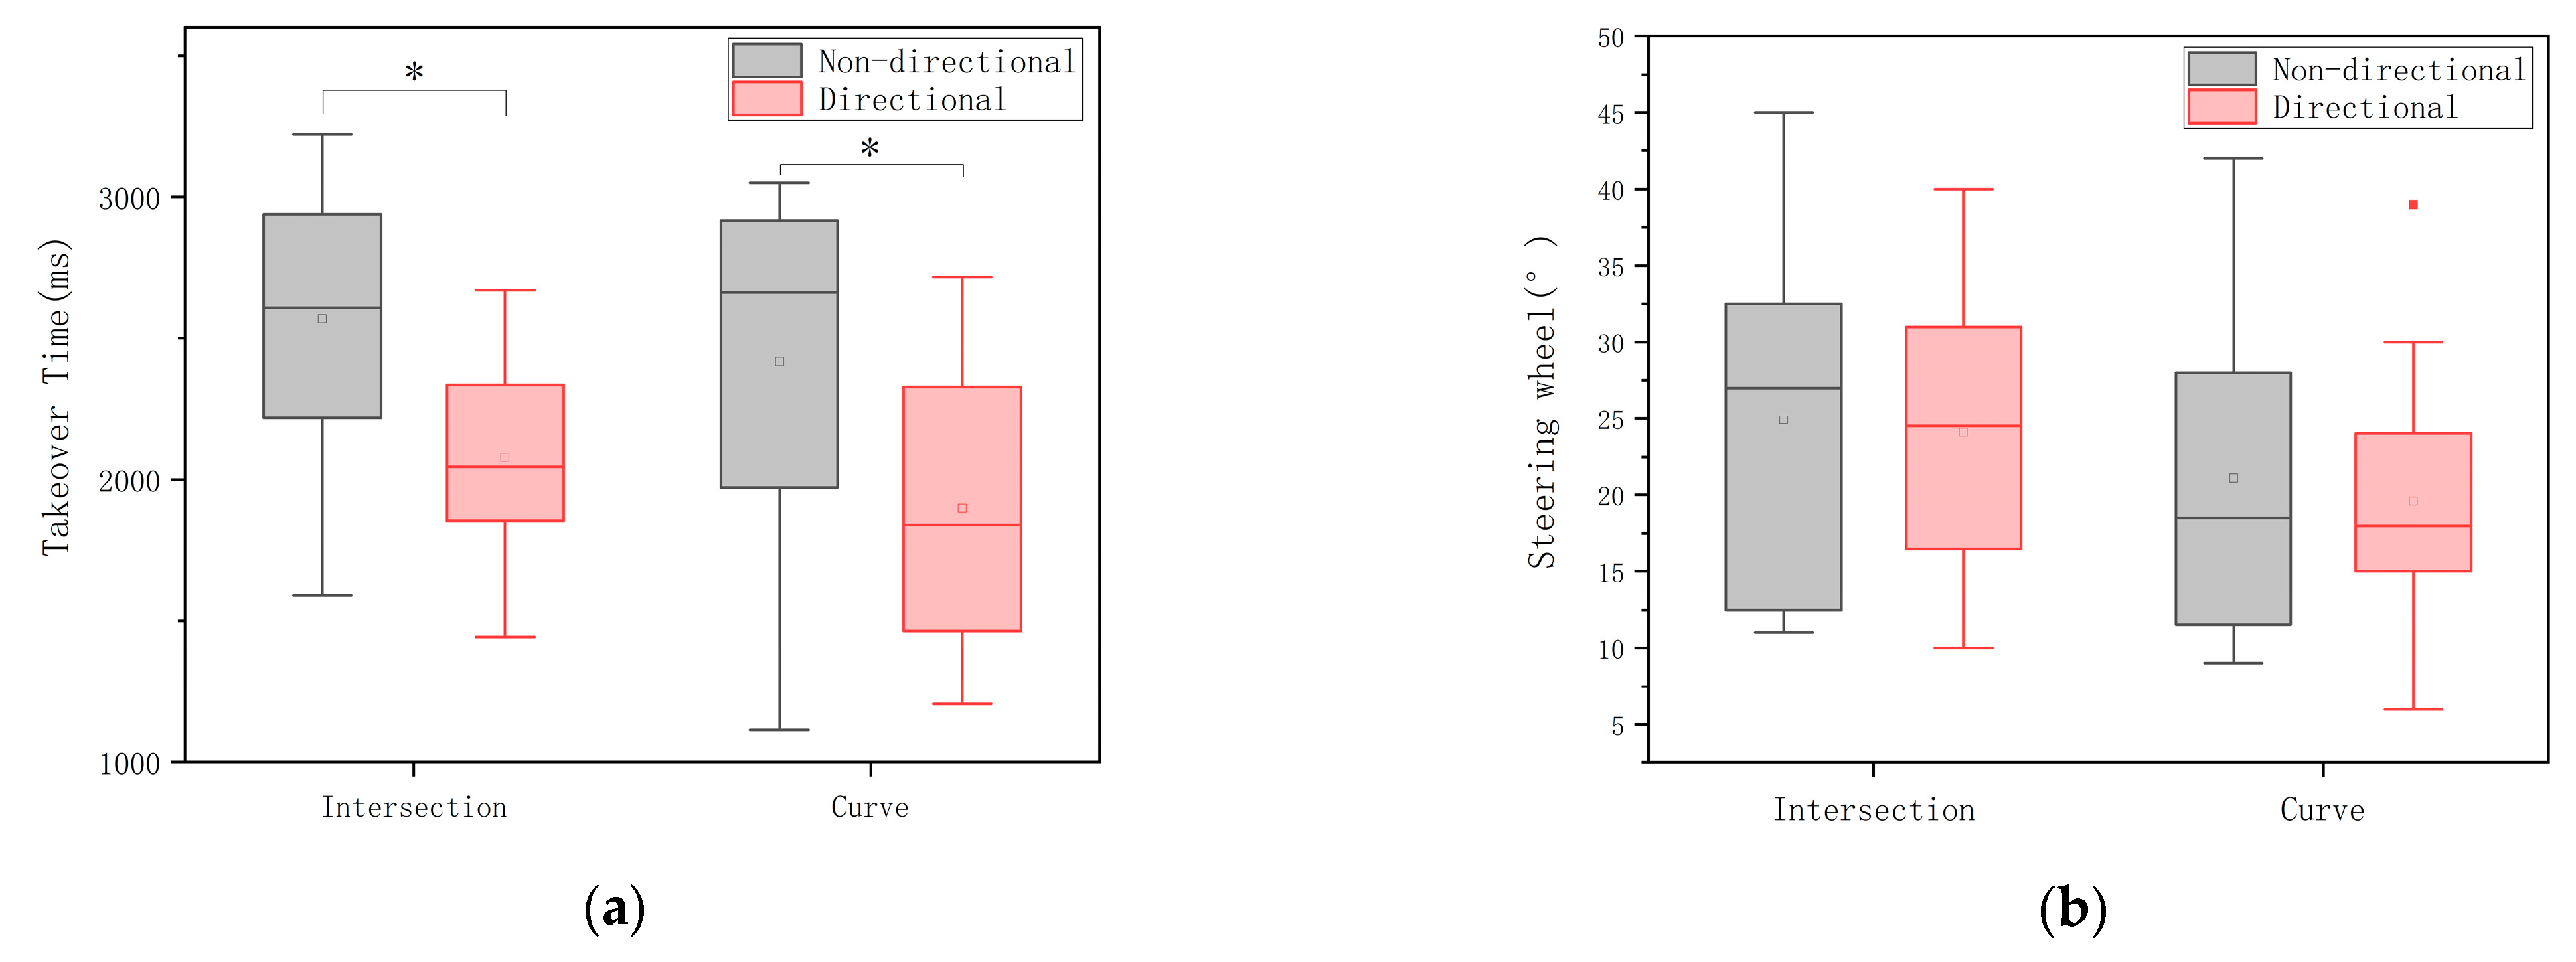
Figure 6a shows the comparison of takeover time for different types of auditory TORs. In the intersection scenario, the takeover time for the directional auditory TORs (M = 1986.3 ms, SD = 387.6 ms) was shorter than that for the non-directional auditory TORs (M = 2231.7 ms, SD = 471.8 ms) and this difference was statistically significant (paired t-test, t (23) = 2.580, p = 0.017). In the curve scenario, the takeover time for the directional auditory TORs (M = 2028.1 ms, SD = 488.3 ms) was shorter than that for the non-directional auditory TORs (M = 2359.4 ms, SD = 570.3 ms), and this difference was statistically significant (paired t-test, t (23) = 2.218, p = 0.037).
3.2.3. Steering Wheel Angle
Figure 6b shows the comparison of the steering wheel angle for different types of auditory TORs. In the intersection scenario, the steering wheel angle was smaller with directional auditory TORs (M = 24.08 degrees, SD = 8.61 degrees) than with non-directional auditory TORs (M = 24.92 degrees, SD = 10.70 degrees), but this difference was not statistically significant (paired t-test, t (23) = 0.295, p = 0.770). In the curve scenario, the steering wheel angle was smaller with directional auditory TORs (M = 19.58 degrees, SD = 7.34 degrees) than with non-directional auditory TORs (M = 21.13 degrees, SD = 10.76 degrees), but this difference was not statistically significant (paired t-test, t (23) = 0.535, p = 0.597).
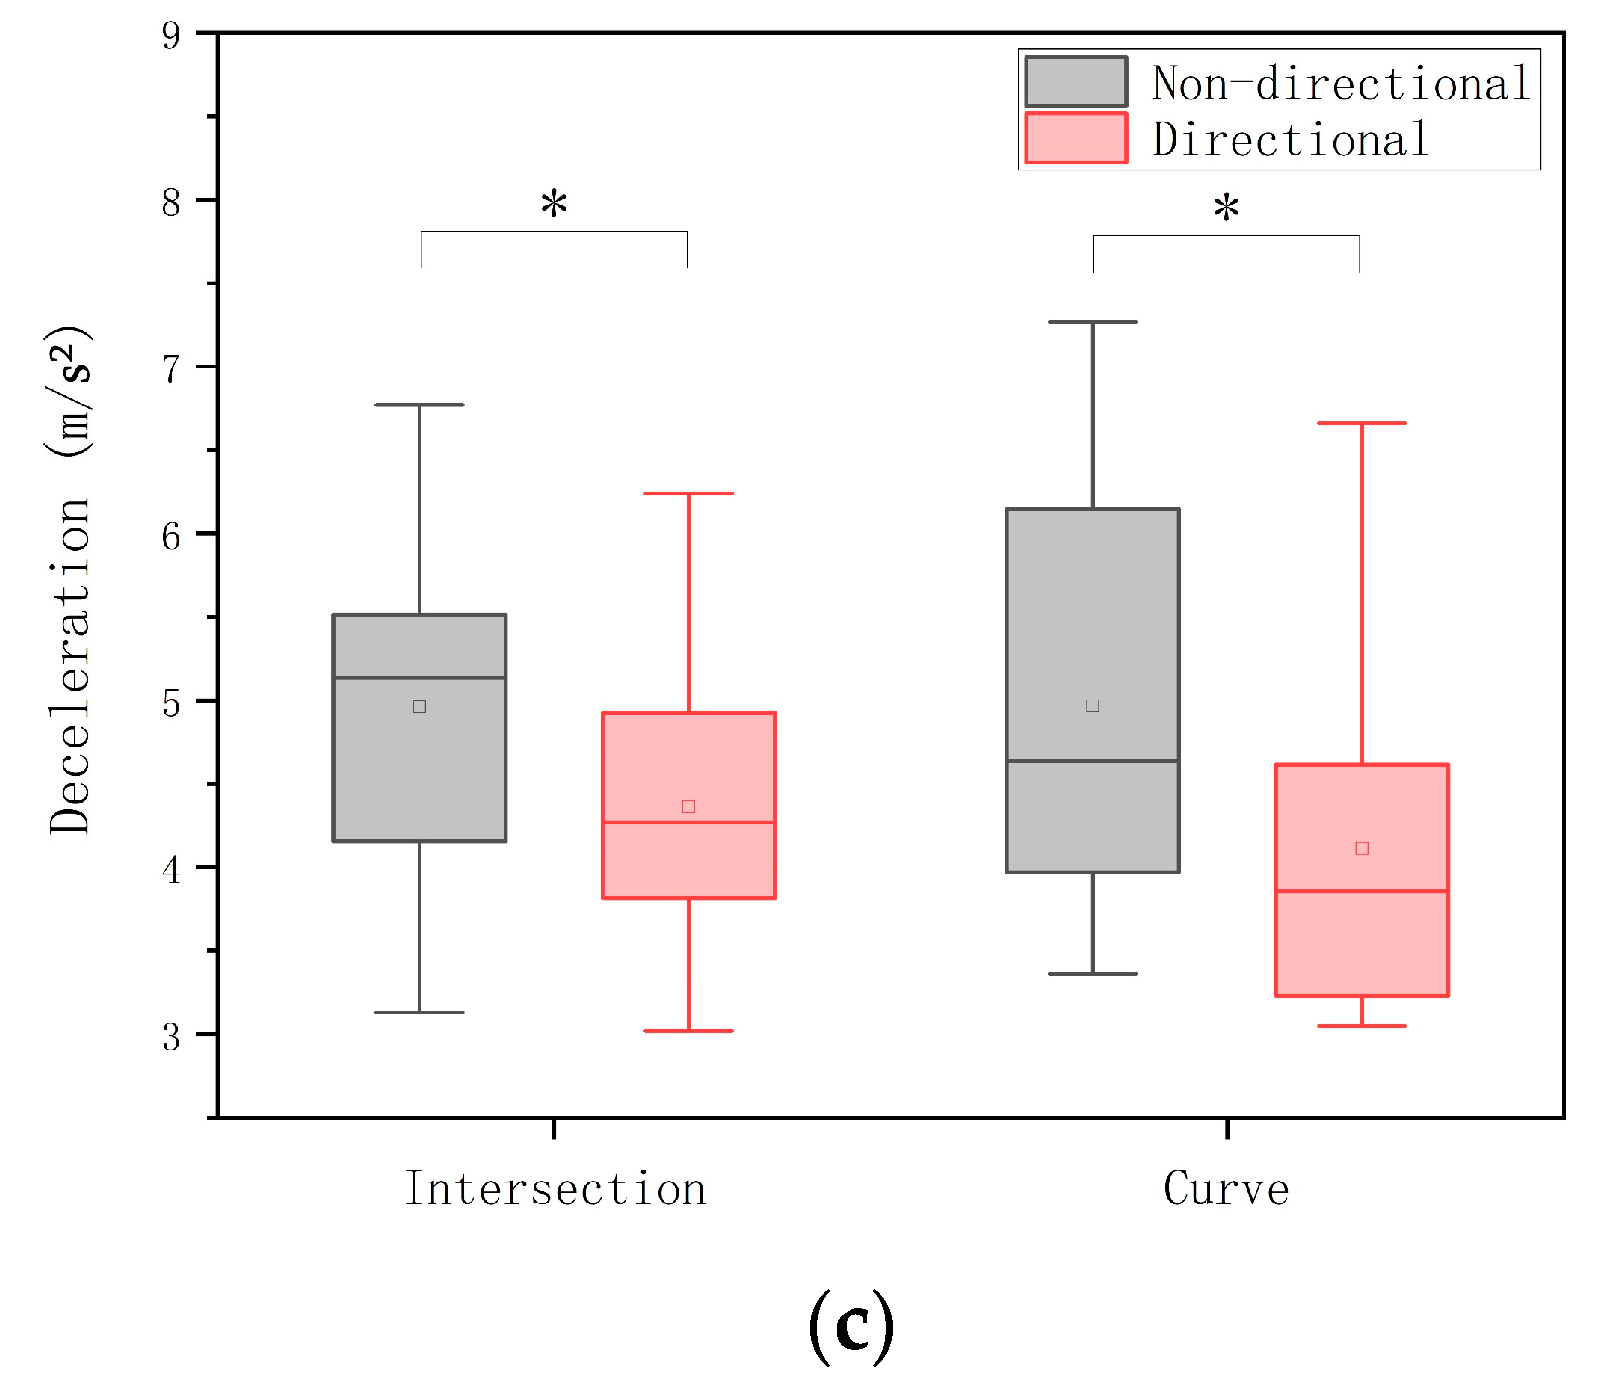
3.2.4. Deceleration
Figure 6c shows the comparison of the deceleration for different types of auditory TORs. In the intersection scenario, the deceleration was smaller with directional auditory TORs (M = 4.36 m/s2, SD = 0.88 m/s2) than with non-directional auditory TORs (M = 4.94 m/s2, SD = 1.03 m/s2), and this difference was statistically significant (paired t-test, t (23) = 3.208, p = 0.012). In the curve scenario, the deceleration was smaller with directional auditory TORs (M = 4.01 m/s2, SD = 0.93) than with non-directional auditory TORs (M = 4.89 m/s2, SD = 1.19 m/s2), and this difference was statistically significant (paired t-test, t (23) = 2.520, p = 0.021).
4. Discussion
The aim of this study was to investigate the effect of directional auditory TOR on automated driving takeover behavior and eye movement.
Guo et al. [26] pointed out that hazard perception is the whole process of decision-making after the driver perceives the information of the surrounding road environment through visual and auditory systems, and about 90% of the driver’s information during the driving process is derived from vision. In this study, we investigated the effect of directional stimuli on the driver’s eye-movement characteristics. In particular, the directional auditory TORs significantly reduced the time to the first fixation on AOI. The probable reason is that directional sound stimuli are more aligned with the driver’s cognitive habits developed during the manual driving experience. For example, drivers can usually approximate the distance and direction of other vehicles by the sound of brakes, honks, or even engines in the road. In addition, the AOI fixation rate reflects the participants’ attention allocation. Compared with the non-directional TORs, participants’ AOI gaze rate was significantly higher when they heard the directional auditory TORs, indicating that participants allocated more attention to the target AOI with the intention of finding more useful information.
Surprisingly, we found that there was no significant difference between pupil diameter and the TORs. Schneider et al. [27] pointed out that there was a positive correlation between pupil diameter and driver cognitive load. Therefore, there was no evidence that the directional TORs increased or decreased the cognitive load. This facilitates subsequent attempts to combine auditory TOR with other modality stimuli, providing more information.
Regarding the takeover behavior, the results have shown that participants are more likely to avoid potential hazards in the road after receiving directional auditory TORs than non-directional auditory TORs. It is suggested that directional cues can provide drivers with more information about road hazards and help drivers to determine traffic conditions more accurately. These findings are consistent with previous studies involving directional interaction and operation performance [19,28]. However, there is also an article that states that directional auditory stimuli have no effect on driving [18]. The reason for this discrepancy may be that they overestimate the role of sound directionality. For uninstructed drivers, the “beeps” directional auditory TORs cannot convey complex decision-making information such as where to take the car next. Its primary role is to help drivers observe the environment and restore road situation awareness. This is why, in their experiments, there was no correlation between the direction of the driver’s lane change and the direction of the auditory TORs. While considering the takeover time caused by different TORs, this study found that there is a significant effect of different TORs on takeover time. This result may be partly explained by the fact that directional TOR contains useful information which helps drivers to perceive their environment faster and improve their operational confidence. In addition, this study also found that directional auditory TOR leads to smaller brake deceleration. This may be because the directional TORs help participants understand road conditions faster. Then, participants can take more comfortable and appropriate braking actions to avoid potential hazards, similar to previous studies [29]. On the other hand, the difference in steering wheel angle was not significant. The lack of significant effects may be because participants turned the steering wheel at different times (during or after deceleration). In addition, for each participant, the steering wheel angle required to change lanes within a certain speed range mainly follows driving habits. Overall, better takeover behavior from the directional TOR suggested that it was possible to improve drivers’ response and vehicle control in difficult scenarios by providing useful information [30].
One of the concerns about the findings was that the intersection scenarios in this study are partially simplified, and more complex scenarios may occur in reality. Single-direction auditory stimuli may not work in cases with multiple hazards. In addition, the psychophysiological characteristics of the participants are likely to influence the results of the experiment, and subsequent studies might explore the influence of gender or age. Furthermore, the TOR for this study was based entirely on auditory stimuli, and multimodal stimuli are truly important in interacting with the driver. We will investigate the validity of TOR by combining directional auditory stimuli with other modalities in the future.
In summary, our results showed that the directional auditory TORs yielded better takeover behavior and more effective visual search than non-directional auditory TORs. Further research could investigate the effects of directional auditory TORs in combination with stimuli of other modalities.
Author Contributions
Conceptualization, J.M. and Y.G.; methodology, Y.G. and J.L.; software, Y.G. and J.L.; validation, Y.G. and W.X.; investigation, Y.G.; data curation, Y.G. and W.X.; writing—original draft preparation, Y.G.; writing—review and editing, J.M. and Y.G.; visualization, Y.G.; project administration, J.M. All authors have read and agreed to the published version of the manuscript.
Funding
This research received no external funding.
Data Availability Statement
Not applicable.
Conflicts of Interest
The authors declare no conflict of interest.
References
- Rossi, R.; Gastaldi, M.; Orsini, F.; De Cet, G.; Meneguzzer, C. A comparative simulator study of reaction times to yellow traffic light under manual and automated driving. Transp. Res. Procedia 2021, 52, 276–283. [Google Scholar] [CrossRef]
- Zeeb, K.; Buchner, A.; Schrauf, M. What determines the take-over time? An integrated model approach of driver take-over after automated driving. Accid. Anal. Prev. 2015, 78, 212–221. [Google Scholar] [CrossRef] [PubMed]
- Kerschbaum, P.; Lorenz, L.; Bengler, K. A transforming steering wheel for highly automated cars. In Proceedings of the 2015 IEEE Intelligent Vehicles Symposium (IV), Seoul, Republic of Korea, 28 June–1 July 2015; pp. 1287–1292. [Google Scholar]
- Bazilinskyy, P.; Petermeijer, S.M.; Petrovych, V.; Dodou, D.; De Winter, J.C.F. Take-over requests in highly automated driving: A crowdsourcing multimedia survey on auditory, vibrotactile, and visual displays. Transp. Res. Part C 2018, 56, 82–98. [Google Scholar] [CrossRef]
- Stanton, N.A.; Eriksson, A.; Banks, V.A. Transition to manual: Comparing simulator with on-road control transitions. Accid. Anal. Prev. 2017, 102, 227–234. [Google Scholar]
- Brandenburg, S.; Chuang, L. Take-over requests during highly automated driving: How should they be presented and under what conditions? Transp. Res. Part F Traf. Psychol. Behav. 2019, 66, 214–225. [Google Scholar] [CrossRef]
- Löcken, A.; Heuten, W.; Boll, S. Supporting lane change decisions with ambient light. In Proceedings of the 7th International Conference on Automotive User Interfaces and Interactive Vehicular Applications, Nottingham, UK, 1–3 September 2015; pp. 204–211. [Google Scholar]
- Ma, S.; Wei, Z.; Shi, J.; Yang, Z. The human factors of the take-over process in conditional automated driving based on cognitive mechanism. Adv. Psychol. Sci. 2019, 28, 150–160. [Google Scholar] [CrossRef] [Green Version]
- Forster, Y.; Naujoks, F.; Neukum, A.; Huestegge, L. Driver compliance to take-over requests with different auditory outputs in conditional automation. Accid. Anal. Prev. 2017, 109, 18–28. [Google Scholar] [CrossRef]
- Bazilinskyy, P.; de Winter, J. Auditory interfaces in automated driving: An international survey. PeerJ Comput. Sci. 2015, 1, e13. [Google Scholar] [CrossRef] [Green Version]
- Naujoks, F.; Mai, C.; Neukum, A. The effect of urgency of take-over requests during highly automated driving under distraction conditions. In Proceedings of the 5th International Conference on Applied Human Factors and Ergonomics AHFE, Krakow, Poland, 19–23 July 2014; pp. 431–438. [Google Scholar]
- Roche, F.; Somieski, A.; Brandenburg, S. Behavioral changes to repeated takeovers in highly automated driving: Effects of the takeover-request design and the nondriving-related task modality. Hum. Factors 2019, 61, 839–849. [Google Scholar] [CrossRef]
- Telpaz, A.; Rhindress, B.; Zelman, I.; Tsimhoni, O. Haptic seat for automated driving: Preparing the driver to take control effectively. In Proceedings of the 7th International Conference on Automotive User Interfaces and Interactive Vehicular Applications, Nottingham, UK, 1–3 September 2015; pp. 23–30. [Google Scholar]
- Yoon, S.H.; Kim, Y.W.; Ji, Y.G. The effects of takeover request modalities on highly automated car control transitions. Accid. Anal. Prev. 2019, 123, 150–158. [Google Scholar] [CrossRef]
- Ho, C.; Reed, N.; Spence, C. Multisensory in-car warning signals for collision avoidance. Hum. Factors 2007, 49, 1107–1114. [Google Scholar] [CrossRef] [PubMed]
- Spence, C.; Ho, C. Tactile and multisensory spatial warning signals for drivers. IEEE Trans. Haptics 2008, 1, 121–129. [Google Scholar] [CrossRef] [PubMed]
- Biondi, F.N.; Rossi, R.; Gastaldi, M.; Orsini, F.; Mulatti, C. Precision teaching to improve drivers’ lane maintenance. J. Saf. Res. 2020, 72, 225–229. [Google Scholar] [CrossRef]
- Petermeijer, S.; Bazilinskyy, P.; Bengler, K.; De Winter, J. Take-over again: Investigating multimodal and directional TORs to get the driver back into the loop. Appl. Ergonom. 2017, 62, 204–215. [Google Scholar] [CrossRef] [Green Version]
- Zhang, Y.; Yan, X.; Zhuo, Y. Discrimination of effects between directional and nondirectional information of auditory warning on driving behavior. Discret. Dynam. Nat. Soc. 2015, 2015, 980281. [Google Scholar] [CrossRef] [Green Version]
- Yan, X.; Zhang, Y.; Lu, M. The influence of in-vehicle speech warning timing on drivers’ collision avoidance performance at signalized intersections. Transp. Res. Part C 2015, 51, 231–242. [Google Scholar] [CrossRef]
- Bella, F.; Silvestri, M. Effects of directional auditory and visual warnings at intersections on reaction times and speed reduction times. Transp. Res. Part F Traf. Psychol. Behav. 2017, 51, 88–102. [Google Scholar] [CrossRef]
- Yan, X.; Zhang, X.; Xue, Q. How does intersection field of view influence driving safety in an emergent situation? Accid. Anal. Prev. 2018, 119, 162–175. [Google Scholar] [CrossRef]
- Gold, C.; Happee, R.; Bengler, K. Modeling take-over performance in level 3 conditionally automated vehicles. Accid. Anal. Prev. 2018, 116, 3–13. [Google Scholar] [CrossRef]
- Pfleging, B.; Rang, M.; Broy, N. Investigating user needs for non-driving-related activities during automated driving. In Proceedings of the 15th International Conference on Mobile and Ubiquitous Multimedia, Rovaniemi, Finland, 12–15 December 2016; pp. 91–99. [Google Scholar]
- Zhang, B.; de Winter, J.; Varotto, S.; Happee, R.; Martens, M. Determinants of take-over time from automated driving: A meta-analysis of 129 studies. Transp. Res. Part F Traf. Psychol. Behav. 2019, 64, 285–307. [Google Scholar] [CrossRef]
- Guo, Y.S.; Ma, Y.; Fu, R.; Meng, N.; Yuan, W. Influence of driving experience on gazing behavior characteristic for car driver. J. Traf. Transp. Eng. 2012, 74, 59–61. [Google Scholar]
- Schneider, A.; Sonderegger, A.; Krueger, E.; Meteier, Q.; Chavaillaz, A. The interplay between task difficulty and microsaccade rate: Evidence for the critical role of visual load. J. Eye Mov. Res. 2021, 13. [Google Scholar] [CrossRef] [PubMed]
- Lif, P.; Oskarsson, P.A.; Hedstrm, J.; Andersson, P.; Lindahl, B.; Palm, C. Evaluation of tactile drift displays in helicopter. In Proceedings of the International Conference on Human-Computer Interaction, Heraklion, Crete, Greece, 22–27 June 2014; pp. 578–588. [Google Scholar]
- Ou, Y.K.; Huang, W.X.; Fang, C.W. Effects of different takeover request interfaces on takeover behavior and performance during conditionally automated driving. Accid. Anal. Prev. 2021, 162, 106425. [Google Scholar] [CrossRef] [PubMed]
- Alvarez, I.; Martin, A.; Dunbar, J.; Taiber, J.; Wilson, D.M.; Gilbert, J.E. Designing driver-centric natural voice user interfaces. In Proceedings of the 3rd International Conference on Automotive User Interfaces and Interactive Vehicular Applications, Salzburg, Austria, 30 November–2 December 2011; pp. 42–49. [Google Scholar]
Figure 1.
Processes underlying the driver takeover during conditionally automated driving.

Figure 2.
Driving simulator and equipment.

Figure 3.
Intersection scenario (above); curve scenario (below); left rearview mirror (a); right rearview mirror (b); central rearview mirror (c).
Figure 3.
Intersection scenario (above); curve scenario (below); left rearview mirror (a); right rearview mirror (b); central rearview mirror (c).


Figure 4.
Software configuration interface: non-directional sound (left); directional sound (right). Note that we can change the sound direction by moving the sound source location (within the red rectangle border).
Figure 4.
Software configuration interface: non-directional sound (left); directional sound (right). Note that we can change the sound direction by moving the sound source location (within the red rectangle border).

Figure 5.
(a) The time to the first fixation on AOI for different auditory TORs; (b) AOI fixation rate for different auditory TORs; and (c) average pupil diameter for different auditory TORs. (* p < 0.05; ▪: outlier).
Figure 5.
(a) The time to the first fixation on AOI for different auditory TORs; (b) AOI fixation rate for different auditory TORs; and (c) average pupil diameter for different auditory TORs. (* p < 0.05; ▪: outlier).


Figure 6.
(a) Takeover time for different auditory TORs; (b) steering wheel angle for different auditory TORs; and (c) deceleration for different auditory TORs. (* p < 0.05; ▪: outlier).
Figure 6.
(a) Takeover time for different auditory TORs; (b) steering wheel angle for different auditory TORs; and (c) deceleration for different auditory TORs. (* p < 0.05; ▪: outlier).


Table 1.
Measures and statistical tests.
| Measure | Statistical Test |
|---|---|
| -Time to the first fixation on AOI | t-test for paired samples |
| -AOI fixation rate | t-test for paired samples |
| -Average pupil diameter | Wilcoxon signed-rank |
| -Collision rate | Fisher’s exact probability test |
| -Takeover time | t-test for paired samples |
| -Deceleration | t-test for paired samples |
| -Steering wheel angle | t-test for paired samples |
Disclaimer/Publisher’s Note: The statements, opinions and data contained in all publications are solely those of the individual author(s) and contributor(s) and not of MDPI and/or the editor(s). MDPI and/or the editor(s) disclaim responsibility for any injury to people or property resulting from any ideas, methods, instructions or products referred to in the content. |
© 2023 by the authors. Licensee MDPI, Basel, Switzerland. This article is an open access article distributed under the terms and conditions of the Creative Commons Attribution (CC BY) license (https://creativecommons.org/licenses/by/4.0/).
Share and Cite
MDPI and ACS Style
Ma, J.; Guo, Y.; Xu, W.; Li, J. Effect of Directional Auditory Takeover Request on Takeover Behavior and Eye Movement in Conditionally Automated Driving. World Electr. Veh. J. 2023, 14, 70. https://doi.org/10.3390/wevj14030070
AMA Style
Ma J, Guo Y, Xu W, Li J. Effect of Directional Auditory Takeover Request on Takeover Behavior and Eye Movement in Conditionally Automated Driving. World Electric Vehicle Journal. 2023; 14(3):70. https://doi.org/10.3390/wevj14030070
Chicago/Turabian StyleMa, Jun, Yixun Guo, Wenxia Xu, and Jiateng Li. 2023. "Effect of Directional Auditory Takeover Request on Takeover Behavior and Eye Movement in Conditionally Automated Driving" World Electric Vehicle Journal 14, no. 3: 70. https://doi.org/10.3390/wevj14030070