1. Introduction
At present, the fuel utilization rate of agricultural machinery is still very low. With the rapid development of agricultural machinery, the problems of environmental pollution and energy shortage are also growing. In the “Fourteenth Five Year” National Agricultural Mechanization Development Plan issued by the Ministry of Agriculture and Rural Affairs, it was pointed out that the industrial chain of agricultural mechanization industry clusters should be enlarged and strengthened, and agricultural mechanization, intelligence, and greening should be accelerated.
As a green dynamic machine with zero emissions, no pollution, and low noise, the electric tractor will become one of the important ways for the further development of modern agricultural tractors, and it also represents the development direction of new energy technology in the field of agricultural machinery [
1]. At present, experts have performed some research on electric tractors. Xu et al. designed a comprehensive bench test platform for electric tractors, and conducted performance tests on electric tractor motors and battery packs [
2]. Xie et al. proposed a configuration scheme for dual-motor coupling power systems, and carried out parameter matching and optimization for the power system [
3]. Gao et al. conducted an experimental study on the transmission efficiency and driving force characteristics of a small four-wheel electric tractor [
4].
Some research on parameter optimization of electric tractors has been performed. Wang et al. proposed a speed and torque coupling dual-motor drive system. Taking the vehicle driving distance and 100 km acceleration time as the optimization objectives, they used the quantum genetic optimization algorithm to optimize the drive system parameters [
5]. Gao et al. optimized the motor, battery parameters, and transmission ratio based on the vehicle power demand and the vehicle energy consumption [
6]. Li et al. optimized the parameters of the motor and battery and transmission ratio with the goal of accelerating time and energy consumption and the constraint of power performance [
7]. Taking plug-in hybrid vehicles as the research object; engine, motor, and battery parameters as decision variables; and battery cost and acceleration performance as objective functions, Mozaffari et al. used the synchronous self-learning Pareto algorithm to optimize the drive system [
8]. Taking the parallel hybrid vehicle as the research object; engine and motor power, battery capacity, and number as the optimization parameters; the exhaust emission transmission system cost as the goal; and vehicle power performance as the constraint, Madanipour et al. used the particle swarm optimization algorithm to optimize [
9]. However, none of the above studies fully considered the power distribution problem when two motors are coupled, leading to inaccurate optimization results. Therefore, it is the focus of this paper to fully consider the impact of the power distribution of dual motors when coupling on the energy consumption of electric tractors, and to find better power parameters after considering the contradiction between tractor power performance and economy.
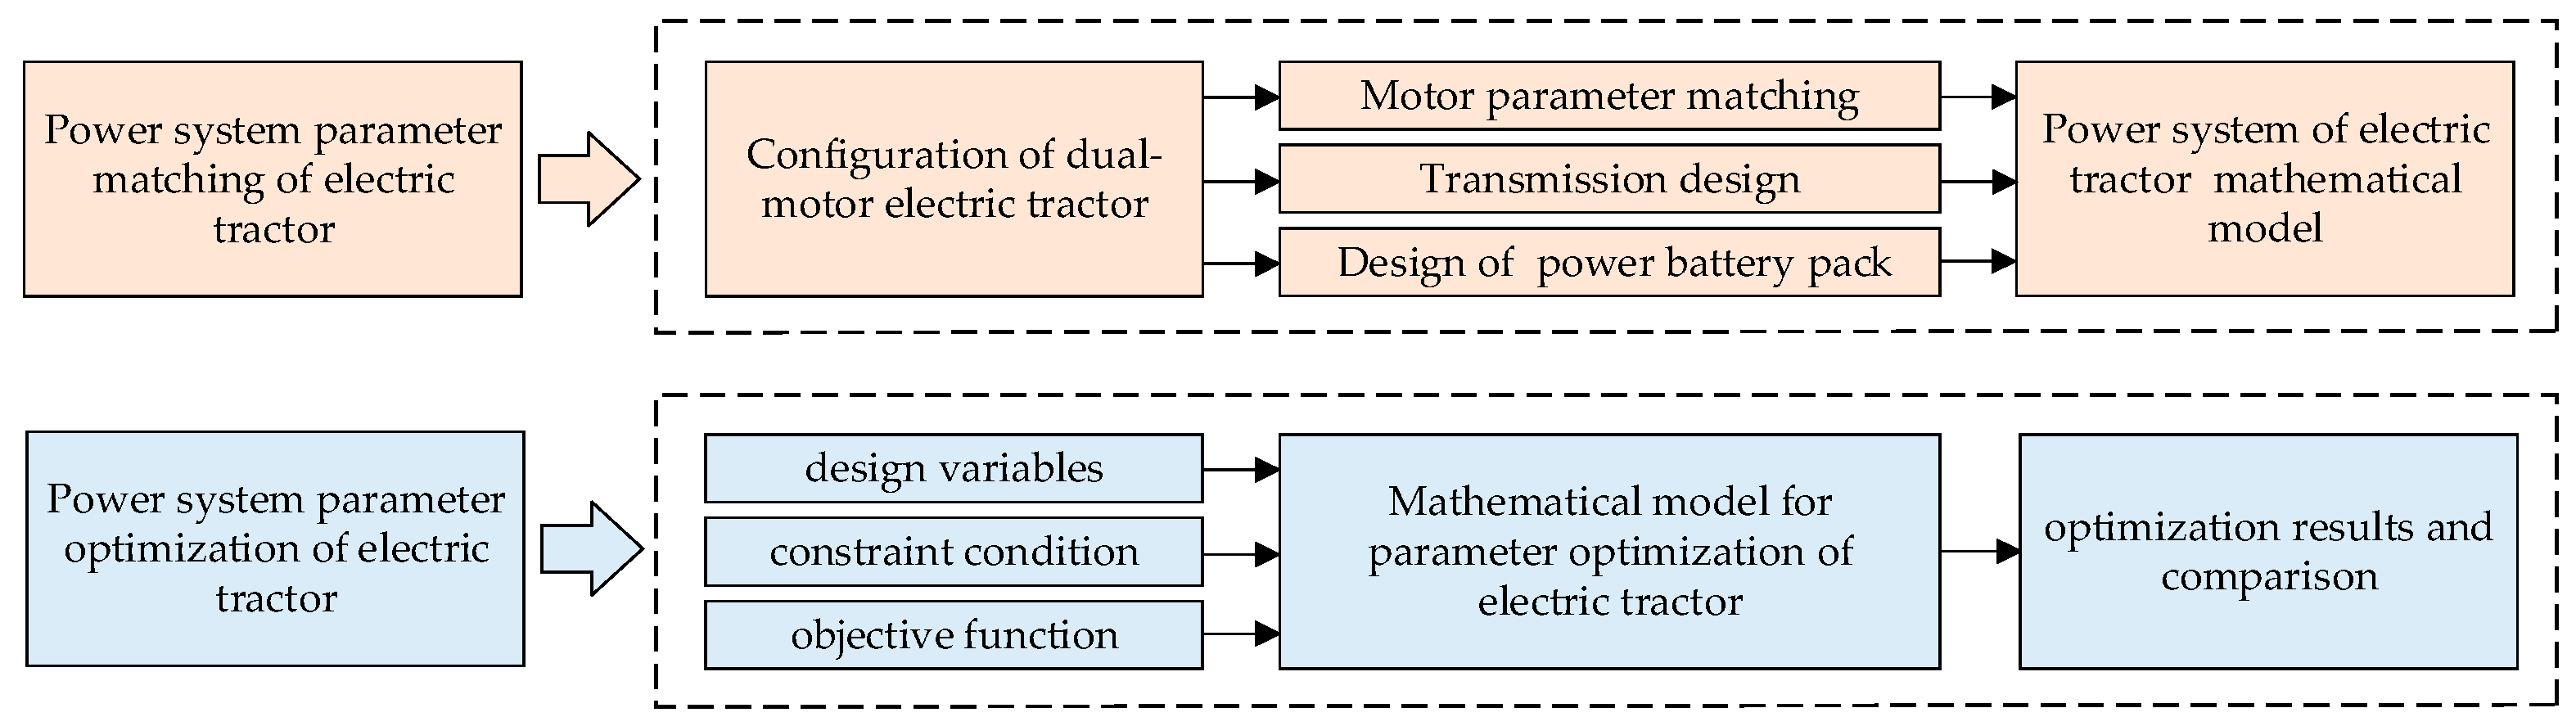
At present, there is no theoretical basis for the power distribution and determination of dual motors in the dual-motor coupling system of electric tractors. It is determined by experience. This study provides a theoretical basis for the power distribution and determination of dual motors. Based on the trait of tractor plowing operation, the models of each component of the electric tractor power system were established in this paper, and the parameters of the main component of the electric tractor power system were matched. Then, with the tractor power performance as the constraint and the economy as the goal, the power distribution coefficient of dual motors was optimized through MATLAB, and the optimization results were compared and analyzed. The research flowchart of the article is as follows
Figure 1 and the nomenclature of article is shown in
Appendix A.
2. Materials and Methods
2.1. Design of Electric Tractor Drive System
2.1.1. Transmission Scheme
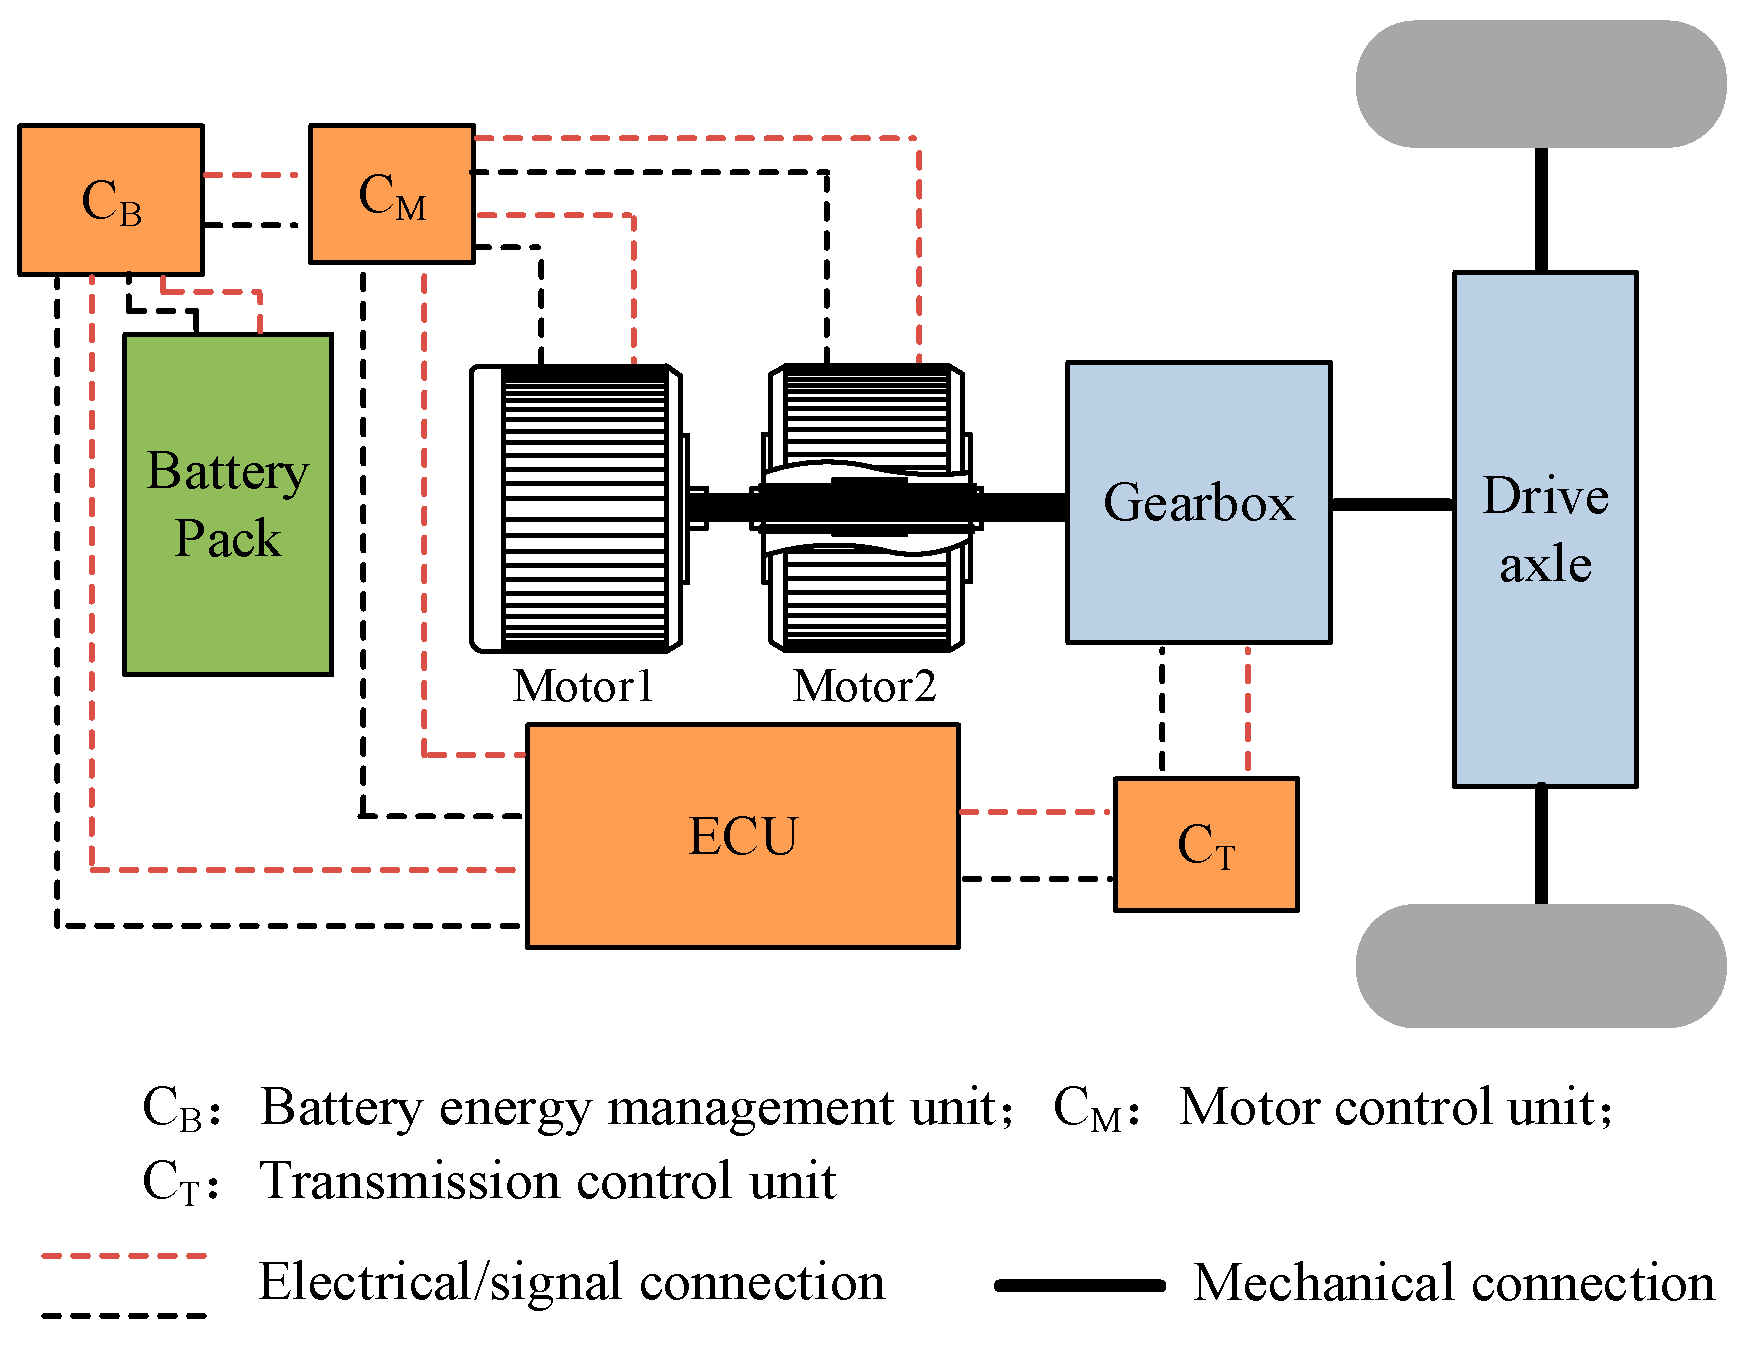
Figure 2 shows the transmission scheme of the power system, which is mainly composed of a dual motor, battery system, electronic control system, transmission, and drive axle. The dual motors in this paper are two permanent magnet synchronous motors with the same specifications and parameters, which have many advantages such as high power density, high efficiency, etc. [
10], and can satisfy the power performance of electric tractors when they are engaged in traction operations. Lithium iron phosphate battery is used as the battery. The lithium iron phosphate battery has high specific energy, long service life, low cost, and good temperature characteristics, and is suitable for electric tractors [
11,
12]. The battery system provides electric energy to the dual motors through the electronic control system. The dual motors output power to the tractor, driving wheels through the mechanical coupling of the transmission shaft and through the transmission and rear axle to drive the tractor for transportation, plowing, and other working conditions.
2.1.2. Traction performance Calculation of Electric Tractor
In order to satisfy the power demand of the different operation items of the tractor, the drive system of the electric tractor should first meet the requirements of rated traction [
13]. The rated traction of the tractor is generally determined by overcoming the average traction resistance of its main supporting agricultural machinery under common working conditions. The plowing working condition is the most common and heavily loaded working of the tractor. Therefore, the traction performance of the tractor should first satisfy the requirements of the plowing operation. The traction resistance formula of plowing operation is [
14]:
where
denotes the quantity of plowshares;
represents the width of a single plowshare,
;
refers to the plowing depth,
; and
is the soil-specific resistance,
.
Considering the variable operating environment, complex operating conditions, and resistance changes caused by load fluctuation during traction unit operation, a 10%~20% power reserve is generally reserved [
15]. Therefore, the rated traction of the electric tractor can be determined as:
- 2.
Traction efficiency
The traction efficiency of electric tractors refers to the ratio of traction power to motor power [
16], namely:
where
denotes the traction power exerted by the electric tractor,
; and
refers to the effective power of traction motor,
.
Different from traditional tractors, the traction efficiency of electric tractors is not only affected by the mechanical transmission efficiency from the gearbox, the wheel slip efficiency, and the rolling efficiency, but is also related to the efficiency of the motor. Its calculation formula is given by the following formula [
10]:
where
is the traction efficiency;
is the motor and controller efficiency;
denotes the transmission efficiency;
is the slip efficiency;
and
represent the slip rate; and
is the rolling efficiency.
- 3.
Climbing gradient
The climbing gradient of the electric tractor is generally calculated according to the transportation conditions, and the tractor is set to run at a constant speed at a slope angle of
α. On the ramp, its traction balance equation is:
where
denotes the driving force;
refers to the rolling resistance;
represents the ramp resistance;
is the total mass of the electric tractor;
is the slope angle; and
denotes the rolling resistance coefficient.
The driving force generated by the electric tractor in different gears is [
11]:
where
and
denote the transmission ratio of the gearbox and main reducer, respectively;
refers to the total output torque of the motor; and
is the radius of the driving wheel.
The slope angle obtained from the above two equations:
where
denotes the total mass of the electric tractor.
It can be seen that the gradient is:
2.1.3. Motor Parameter Matching
From the above traction performance analysis, it can be seen that the peak power of the electric tractor motor needs to meet the requirements of both the traction force under the plowing operation condition and the climbing condition:
Satisfying the requirements of plowing resistance and rolling resistance of electric tractors under plowing conditions [
16]:
where
denotes the traveling speed of the electric tractor,
;
denotes the quantity of plowshares;
represents the width of a single plowshare,
;
refers to the plowing depth,
;
is the soil-specific resistance; and
;
is the traction efficiency.
- 2.
Meeting the requirements of slope resistance and rolling resistance of the electric tractor when climbing:
It can be seen that the total peak power of double motors . Since the specifications and parameters of double motors are the same, the peak power of a single motor is .
2.1.4. Transmission Design
The gearbox is an important part of the drive system of the electric tractor. The gearbox gear can be designed according to the load size of the actual working of the tractor. The working conditions of the tractor can be divided into three types according to the load size in the actual operation: heavy-load working conditions (100% full power) when the tractor is plowing rotary tillage; medium-load working conditions (80% full power) during harrowing, intertillage, and other operations; and low-load working conditions (65% full power) [
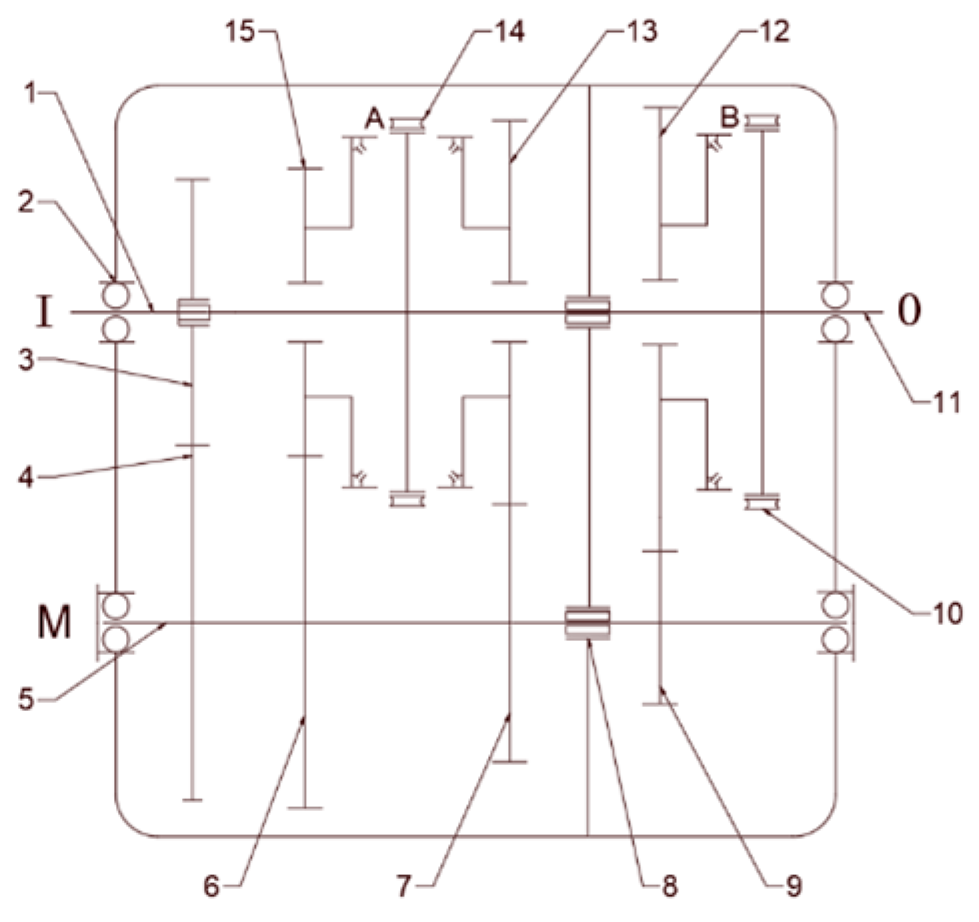
17] when sowing and harvesting. The transmission is set to three gears according to different load rates, as shown in
Figure 3. The I shaft is the power input shaft, the M shaft is the intermediate shaft, the O shaft is the power output shaft, and A and B are synchronizers. There are three pairs of constant mesh gears on the O shaft of the power output shaft and the M shaft of the intermediate shaft, which correspond to Gear 1, Gear 2, and Gear 3, respectively. The gear is switched by adjusting the position of the joint sleeve of Synchronizers A and B.
When the electric tractor is under high load conditions, the motor has high efficiency. Therefore, when designing the speed ratio, it should work near the rated speed of the motor. The ratio of the gearbox can be calculated by the following formula [
18]:
where
is the Gear 1 transmission ratio;
denotes the rolling radius of the driving wheel,
;
refers to the rated speed of the motor,
;
is the speed ratio of the main reducer;
is the driving speed of the tractor under plowing conditions,
;
is the ratio of each gear; and
is the load rate of each gear, taking
= 0.8 and
= 0.65.
2.1.5. Design of Power Battery Pack
The battery pack is the energy supply device of the electric tractor, which outputs power to the traction motor to enable the tractor to satisfy the power demand of the corresponding operating conditions. The power battery must be designed to meet the maximum power demand and energy demand.
where
is the quantity r of batteries of the power battery pack calculated according to the maximum power demand;
is the maximum power of the traction motor,
; and
is the power output per battery,
.
where
is the number of batteries of the power battery pack calculated according to the total energy demand;
is the accessory power,
; and
is the working time of the electric tractor,
.
The number of batteries in the power battery pack is the larger of the two, namely, .
2.1.6. Calculation of Main Parameters
Taking a wheeled tractor of YTO as the research object, each component of its power system is calculated accordingly. The rated tractive force is determined according to the agricultural machinery matched with the electric tractor during the plowing operation. The agricultural machinery matched with the tractor is a double share plow, with a single plow width of 30 cm, a plow depth of 25 cm, and a soil-specific resistance of 7 N/cm2. According to the above formula, the value range of the rated traction force is 11.55~12.6 kN. Considering that the tractor needs a large power reserve to cope with the load fluctuation, the rated traction force is 12.6 kN.
The primary component parameters of the power system of the electric tractor can be obtained from Equations (10)–(15), as shown in
Table 1.
2.2. Establishment of Mathematical Model and Parameter Optimization Model of Dual-Motor Power System
Parameter optimization of the electric tractor drive system is to improve the dynamic performance of the tractor and ensure the economic demand of the tractor [
8,
19]. The power performance of the electric tractor is affected by the driving force, which is transmitted to the driving wheels through the gearbox and rear axle after the power coupling of the dual motors, and is affected by the power distribution of the dual motors. In addition, the reasonable distribution of dual-motor power can also make each motor work in the high-efficiency range and reduce the energy consumption of the electric tractor. Therefore, the power performance and economy of the electric tractor can be improved by rational distribution and optimization of dual-motor power.
2.2.1. Establishment of Main Component Models of Power System
After the parameters of the primary components of the power system, such as the traction motor and power battery, are determined, the mathematical model of the primary components of the power system is established, and the simulation model of the electric tractor is built using MATLAB/Simulink. Simulink is a visual simulation tool in MATLAB launched by the MathWorks company in America, and the version used in this article is R2021a. The data are exchanged with the MATLAB work area through the from/to workspace module, and the parameters of the dual-motor power system are optimized.
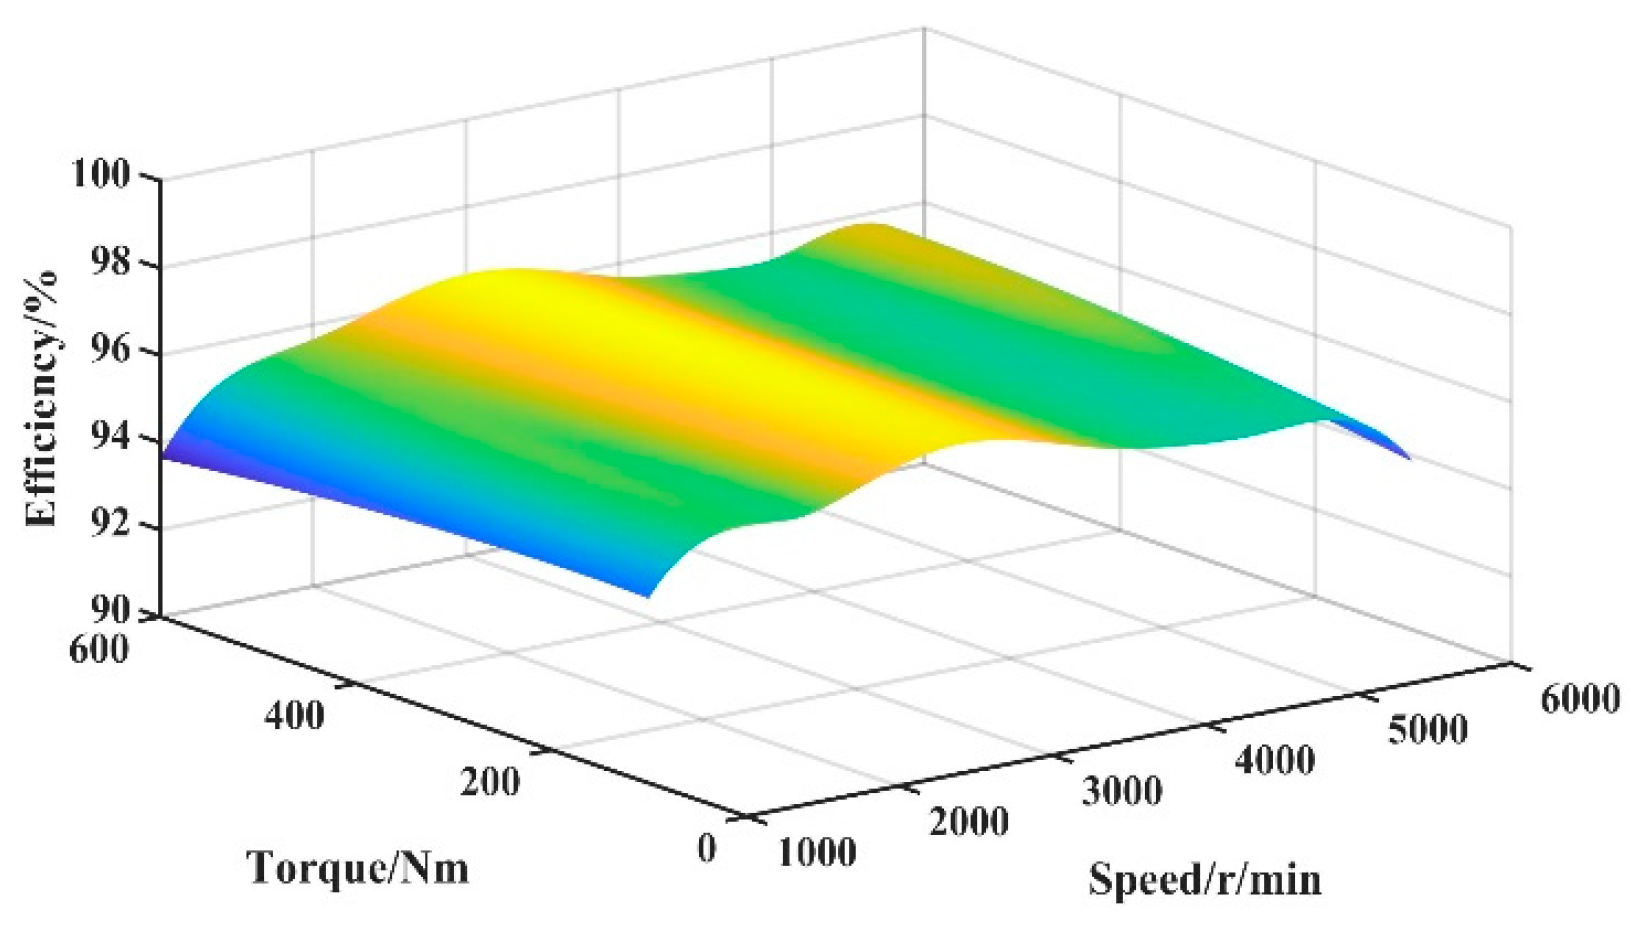
The motor modeling methods are generally divided into theoretical modeling methods and experimental modeling methods [
20,
21]. The theoretical modeling method is based on theoretical analysis modeling, which requires accurate modeling of motor components and their working process. The parameters required for the model are difficult to measure, and modeling is difficult; test modeling is to establish a motor test data sheet through the motor bench test, and then obtain its output characteristics by looking up the table. This paper uses the test modeling method. The relationship between motor speed, torque, and efficiency is obtained through the test, and the efficiency of dual motors is obtained through interpolation fitting of the following formula, and the motor efficiency model is shown in
Figure 4:
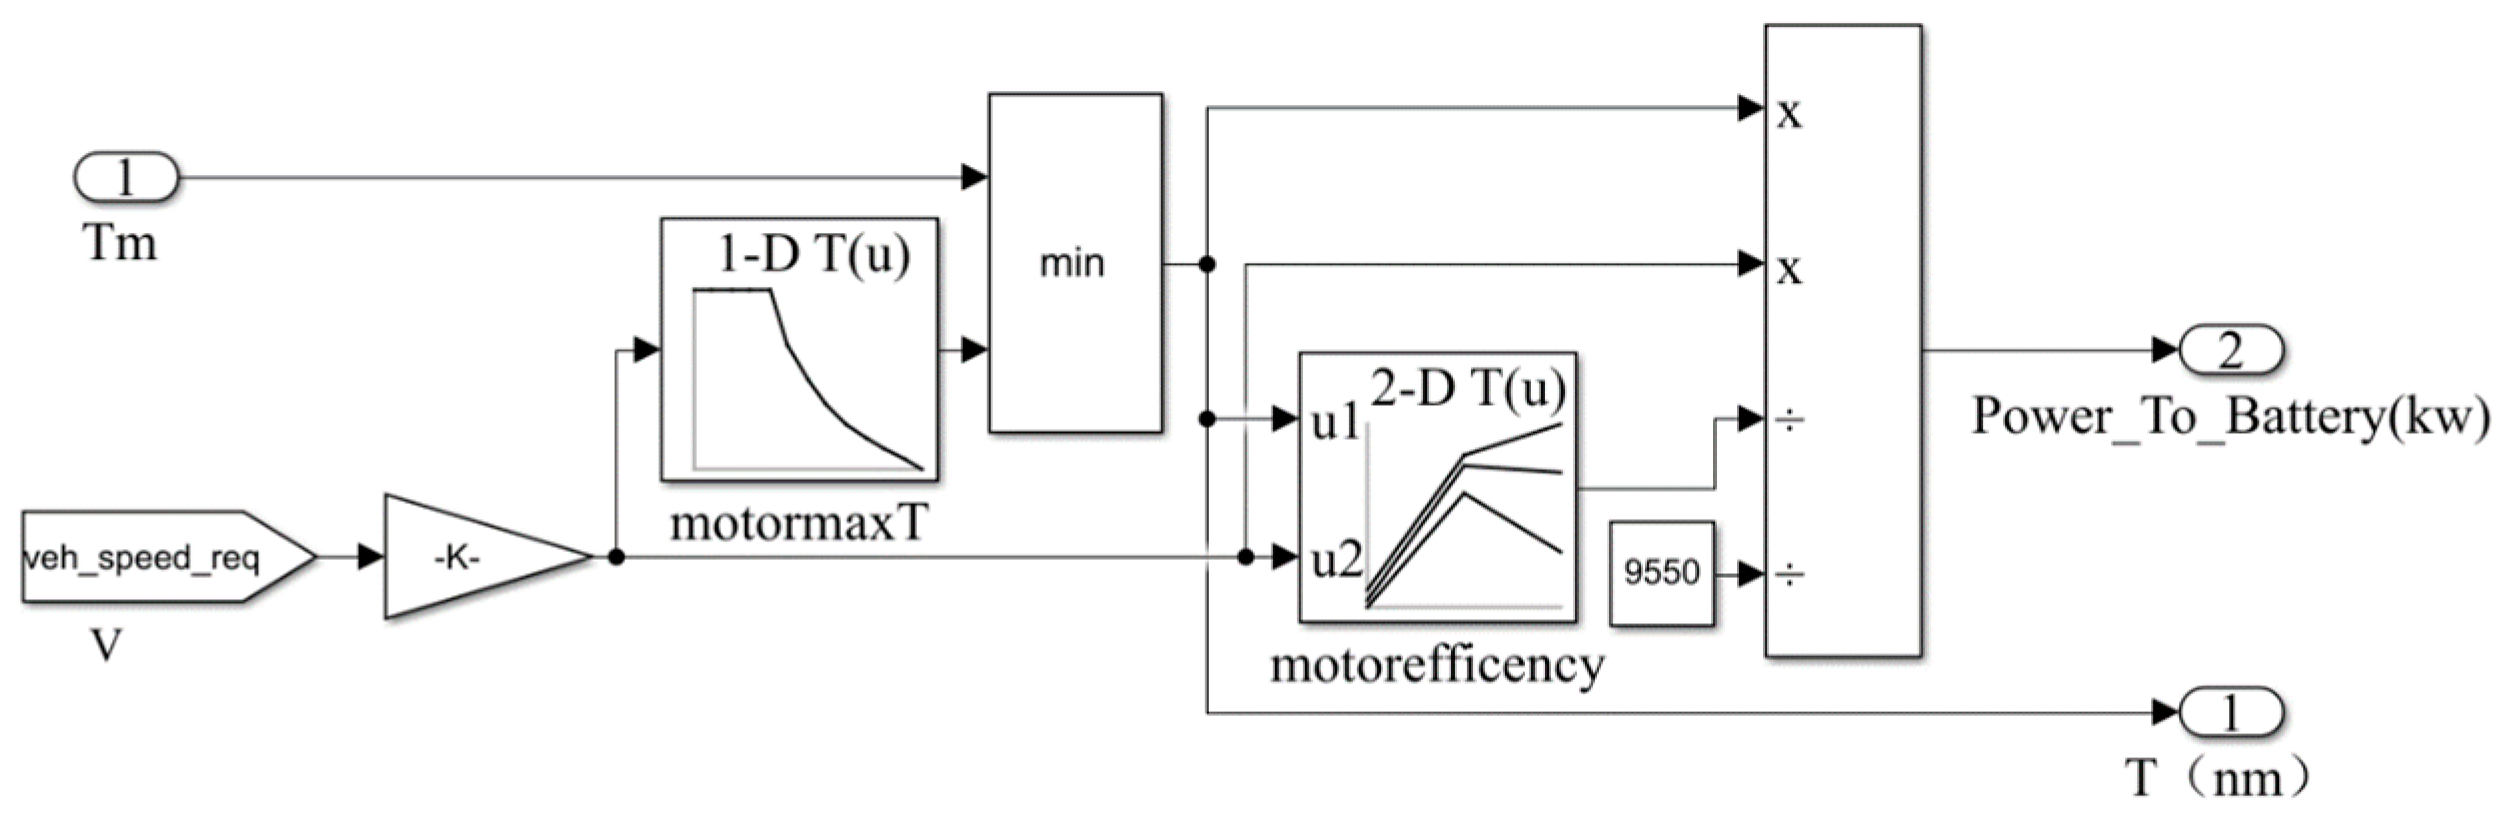
The established motor Simulink model is shown in
Figure 5:
- 2.
Battery model
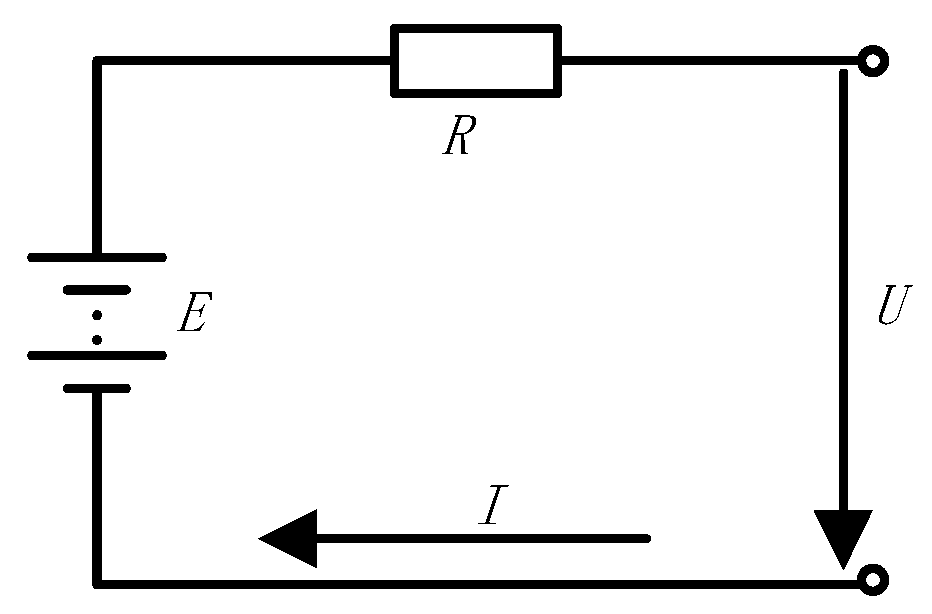
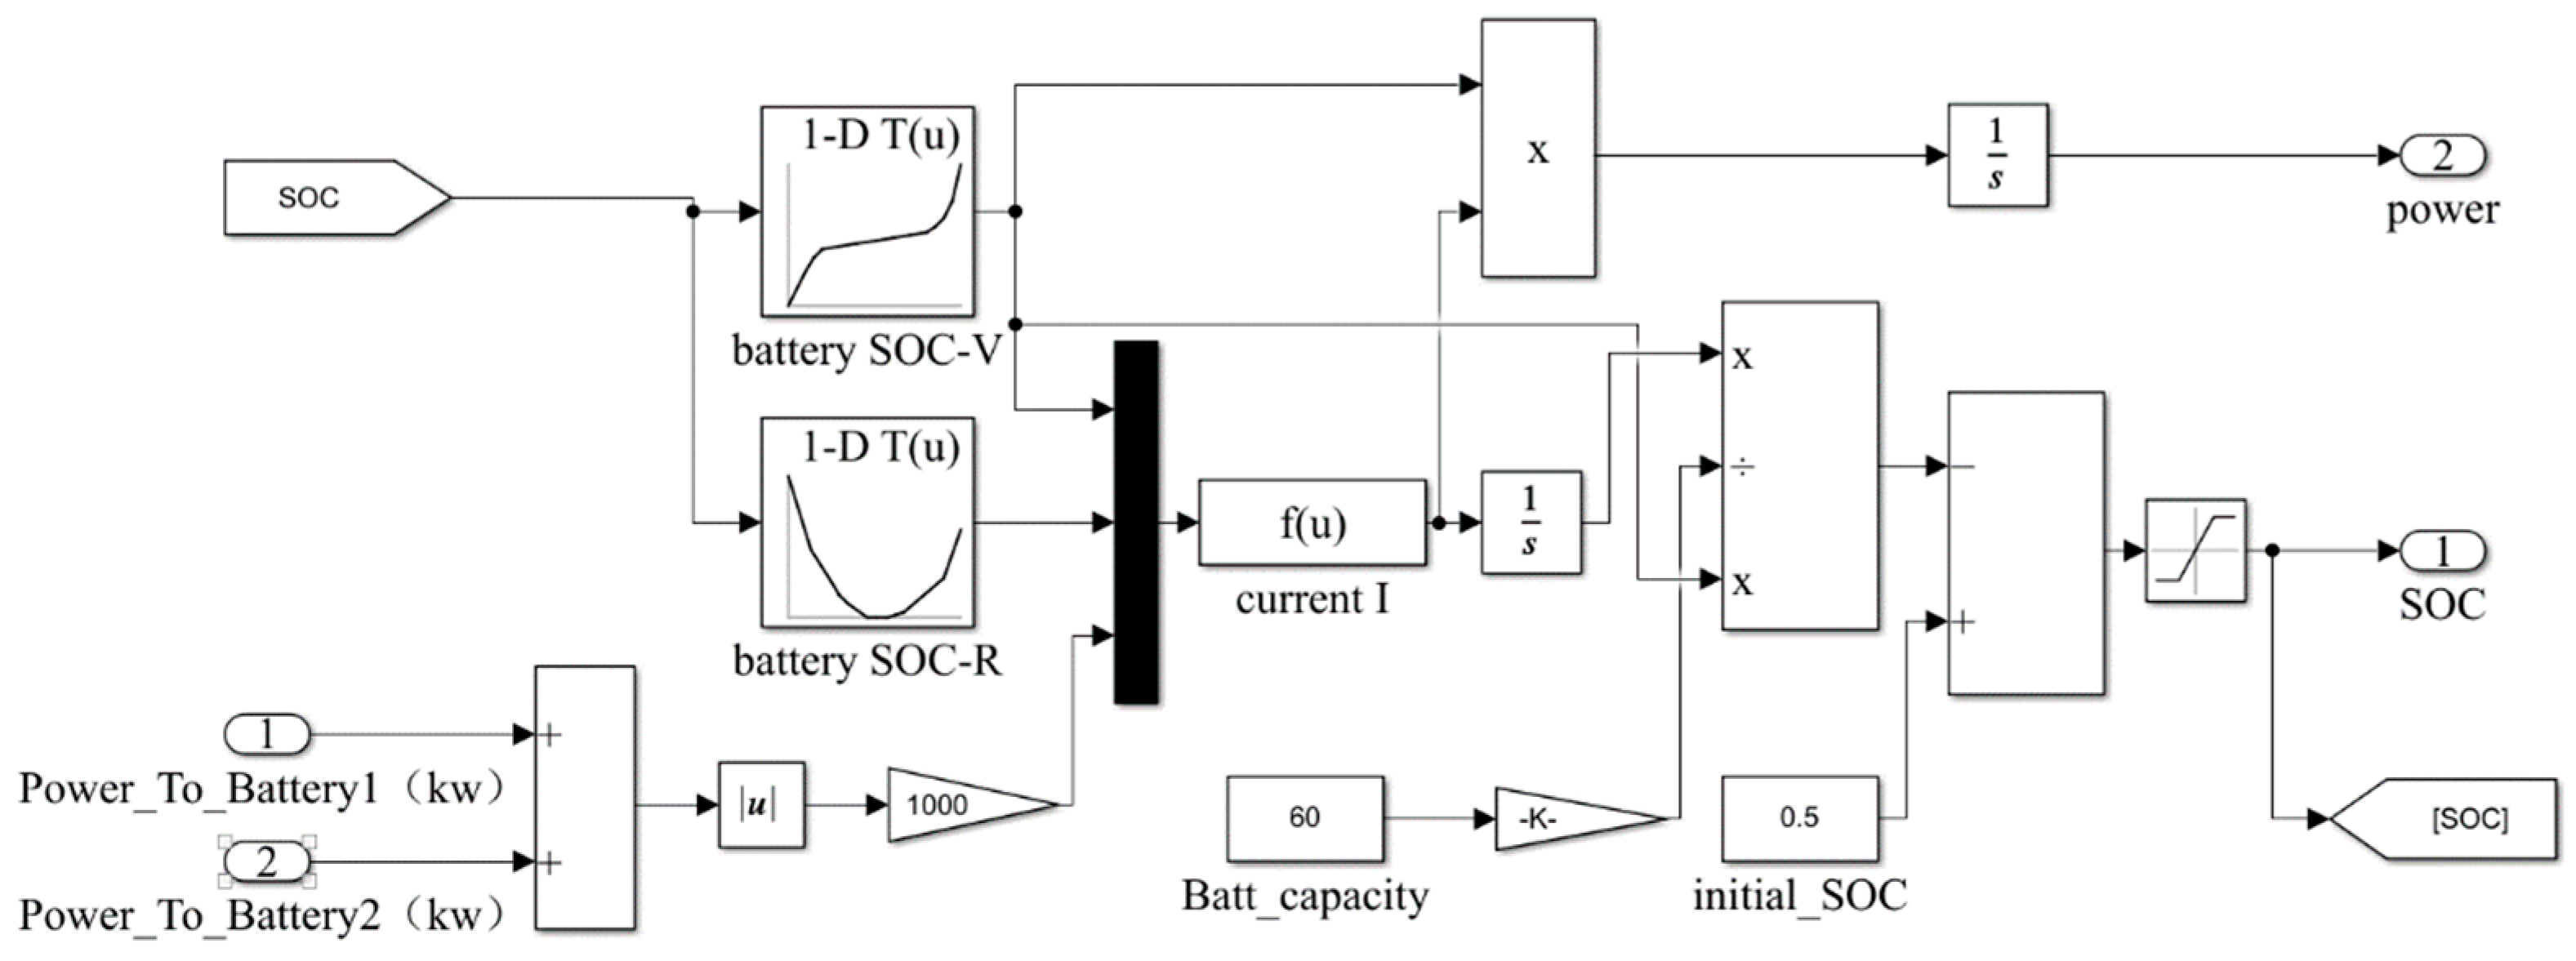
The battery pack is the only energy source of the electric tractor and one of the main components of the power system. According to the battery test data and theoretical analysis, the battery equivalent circuit is established to simplify the analysis and describe its working characteristics. The battery equivalent model established in this paper is shown in
Figure 6.
The following can be obtained:
where
is the load voltage,
;
is the battery open-circuit voltage,
;
is the battery discharge current,
; and
is the internal resistance of the battery,
.
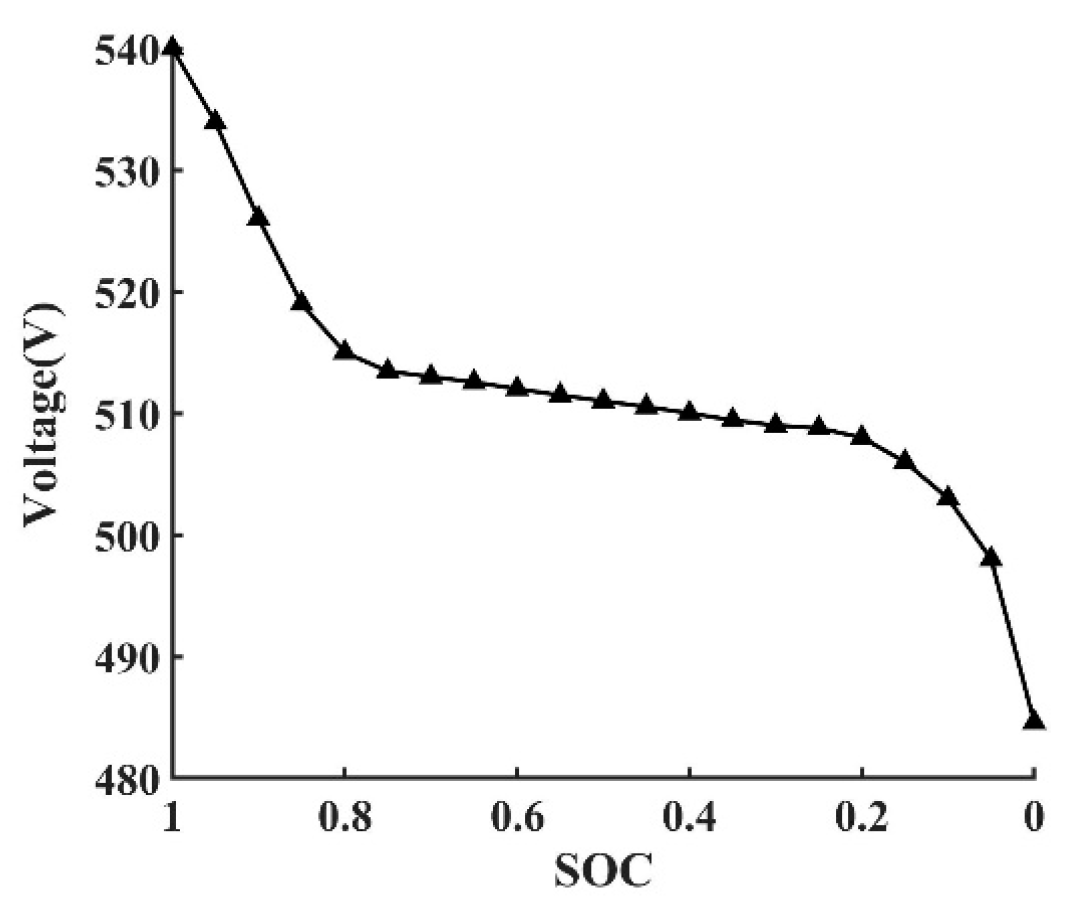
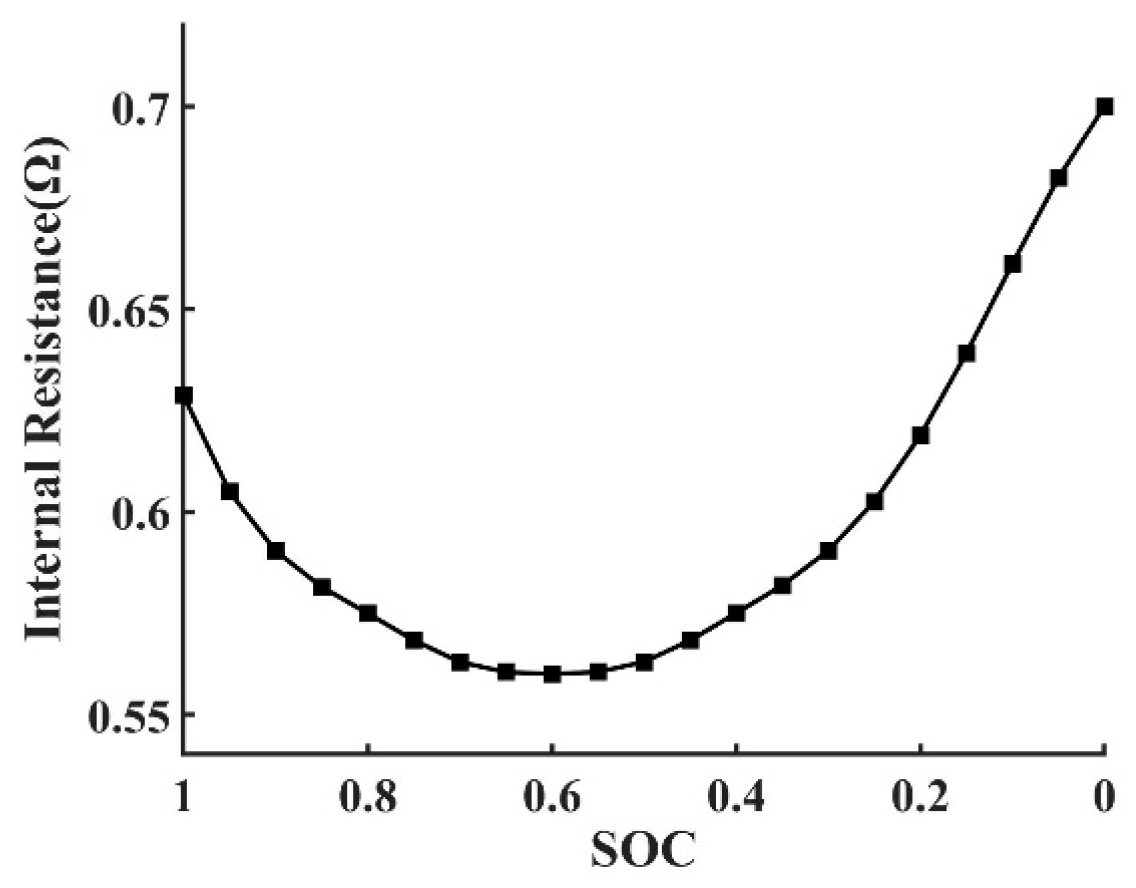
This paper mainly considers the influence of SOC on battery parameters. During discharge, the influence of SOC on open-circuit voltage and battery internal resistance is expressed as:
where
SOC is the state of charge. As the name implies, it refers to the usable state of the remaining charge in the battery, which can be described by the following proportional formula:
The relationship between
SOC and open-circuit voltage during discharge is shown in
Figure 7, and the relationship between
SOC and battery internal resistance is shown in
Figure 8.
The established battery simulink model is shown in
Figure 9:
2.2.2. Establishment of Optimization Model
The electric drive system has a single power source and actuator, which is simpler than the hybrid power system. The electric drive system is mainly optimized for the gearbox, battery, and motor. The optimization variables of the gearbox are mainly the ratio of each gear. The optimization variables of the battery generally include the number and type of battery cells, and the optimization variables of the motor are generally the peak power, peak torque, peak speed, etc. [
22]. The power distribution between two motors in the power system of a dual-motor electric tractor also has a great impact on the economy of the tractor. Therefore, the power distribution coefficient
of the dual motors is taken as the optimization variable.
- 2.
Objective function
The objective function of the parameter optimization of the electric tractor power system is generally determined according to the power and economy, which are mutually restricted. To avoid this situation, we take economic optimization as the objective function of parameter optimization and the satisfaction of basic power demand as the constraint [
23]. The power consumption is taken as the optimization objective of electric tractor parameter optimization. The specific expression is:
where
is the optimization design variable;
is power consumption.
- 3.
Constraints
Constraints refer to the preconditions that must be observed in the process of performance improvement of pure electric tractors through parameter optimization [
8]. In this article, the basic power requirements of tractors are taken as constraints:
(1) Maximum traction
Plowing working condition is the most basic and heavy load working condition of the tractor. The tractor traction must first meet the needs of the plowing operation. Therefore, the maximum traction force should be calculated according to the first gear during plowing operation, and 10%~20% of the reserve traction force should be reserved to cope with the resistance changes caused by different working conditions and farm tools [
24].
where
and
denote the torque of two motors,
;
is the traction efficiency;
is the first-gear ratio;
denotes the quantity of plowshares;
represents the width of a single plowshare,
;
refers to the plowing depth,
;
is the soil-specific resistance,
;
denotes the total mass of the electric tractor,
;
is the radius of the driving wheel; and
denotes the rolling resistance coefficient.
(2) Climbing gradient
The basic climbing requirements that the tractor should meet.
where
and
denote the torque of two motors,
;
is the traction efficiency;
is the first-gear ratio;
denotes the total mass of the electric tractor,
;
is the radius of the driving wheel,
; and
denotes the rolling resistance coefficient.
(3) Acceleration time
Acceleration time of tractor from 0 to 15 km/h
where
and
denote the driving force generated by two motors,
;
denotes the total mass of the electric tractor,
;
denotes the rolling resistance coefficient; and
is the slip rate.
2.3. Implementation of Genetic Algorithm
The main idea of the genetic algorithm is to simulate the problem to be optimized into the process of species evolution. At the beginning, the initialized population is randomly generated, that is, the initial solution to the problem. Each individual is evaluated according to the fitness function, and its fitness value is given. Select by roulette according to the fitness value. Individuals with large fitness values are copied into the new generation, and individuals with poor fitness are eliminated. Continue to cross and mutate. After several iterations, individuals with good fitness are the optimal solution to the problem. The algorithm is implemented as follows [
25]:
(1) Coding and decoding: The genetic algorithm expresses the feasible range of the solution as individual or chromosome by coding. The coding methods are string encoding, real-number encoding, multi-level parameter encoding, etc. This paper selects real-number encoding. Decoding is the inverse process of encoding, and it corresponds to the actual decision variables according to the individuals in the genetic space.
(2) Initial population: The initial population is a population composed of individuals generated by real-number coding. There are usually two methods to generate the initial population: one is completely random generation, which is suitable for the situation without any prior knowledge of the problem; second, according to experience, the initial population is randomly generated under certain conditions. This method can make the genetic algorithm reach the optimal solution faster. In this paper, the second method is used to randomly generate n individuals within the feasible region of the optimization variable x as the initial population.
(3) Fitness function: The fitness function is used to judge the quality of individuals, which is generally obtained by transforming the objective function. In this paper, the minimum value problem is solved, and the inversion of the function value is taken as the fitness of the individual. The fitness expression is:
(4) Selection operation: The selection operation selects better individuals from the previous generation to the next generation with a certain probability. Better individuals are more likely to be selected. The selection operation usually includes roulette roulette and other methods. In this paper, roulette roulette is selected, that is, the selection probability is determined according to the fitness, and the expression is
(5) Cross operation: Cross operation is to exchange a part of the chromosomes of two random individuals to produce better individuals. The real-number cross method is adopted. The
chromosome
and
chromosome
, and the crossover operation method at the
position are:
where
denotes the random number of [0,1] intervals.
(6) Mutation operation: The mutation operation refers to the selection of a random individual and mutation at a certain position to generate a new individual. The mutation method of the
gene
of the
individual is:
(7) The termination condition judgment: Taking the evolution algebra as the termination condition, if the evolution algebra is less than the set value, return to Step (3); if satisfied, output the result.
3. Results
3.1. Parameter Optimization Results
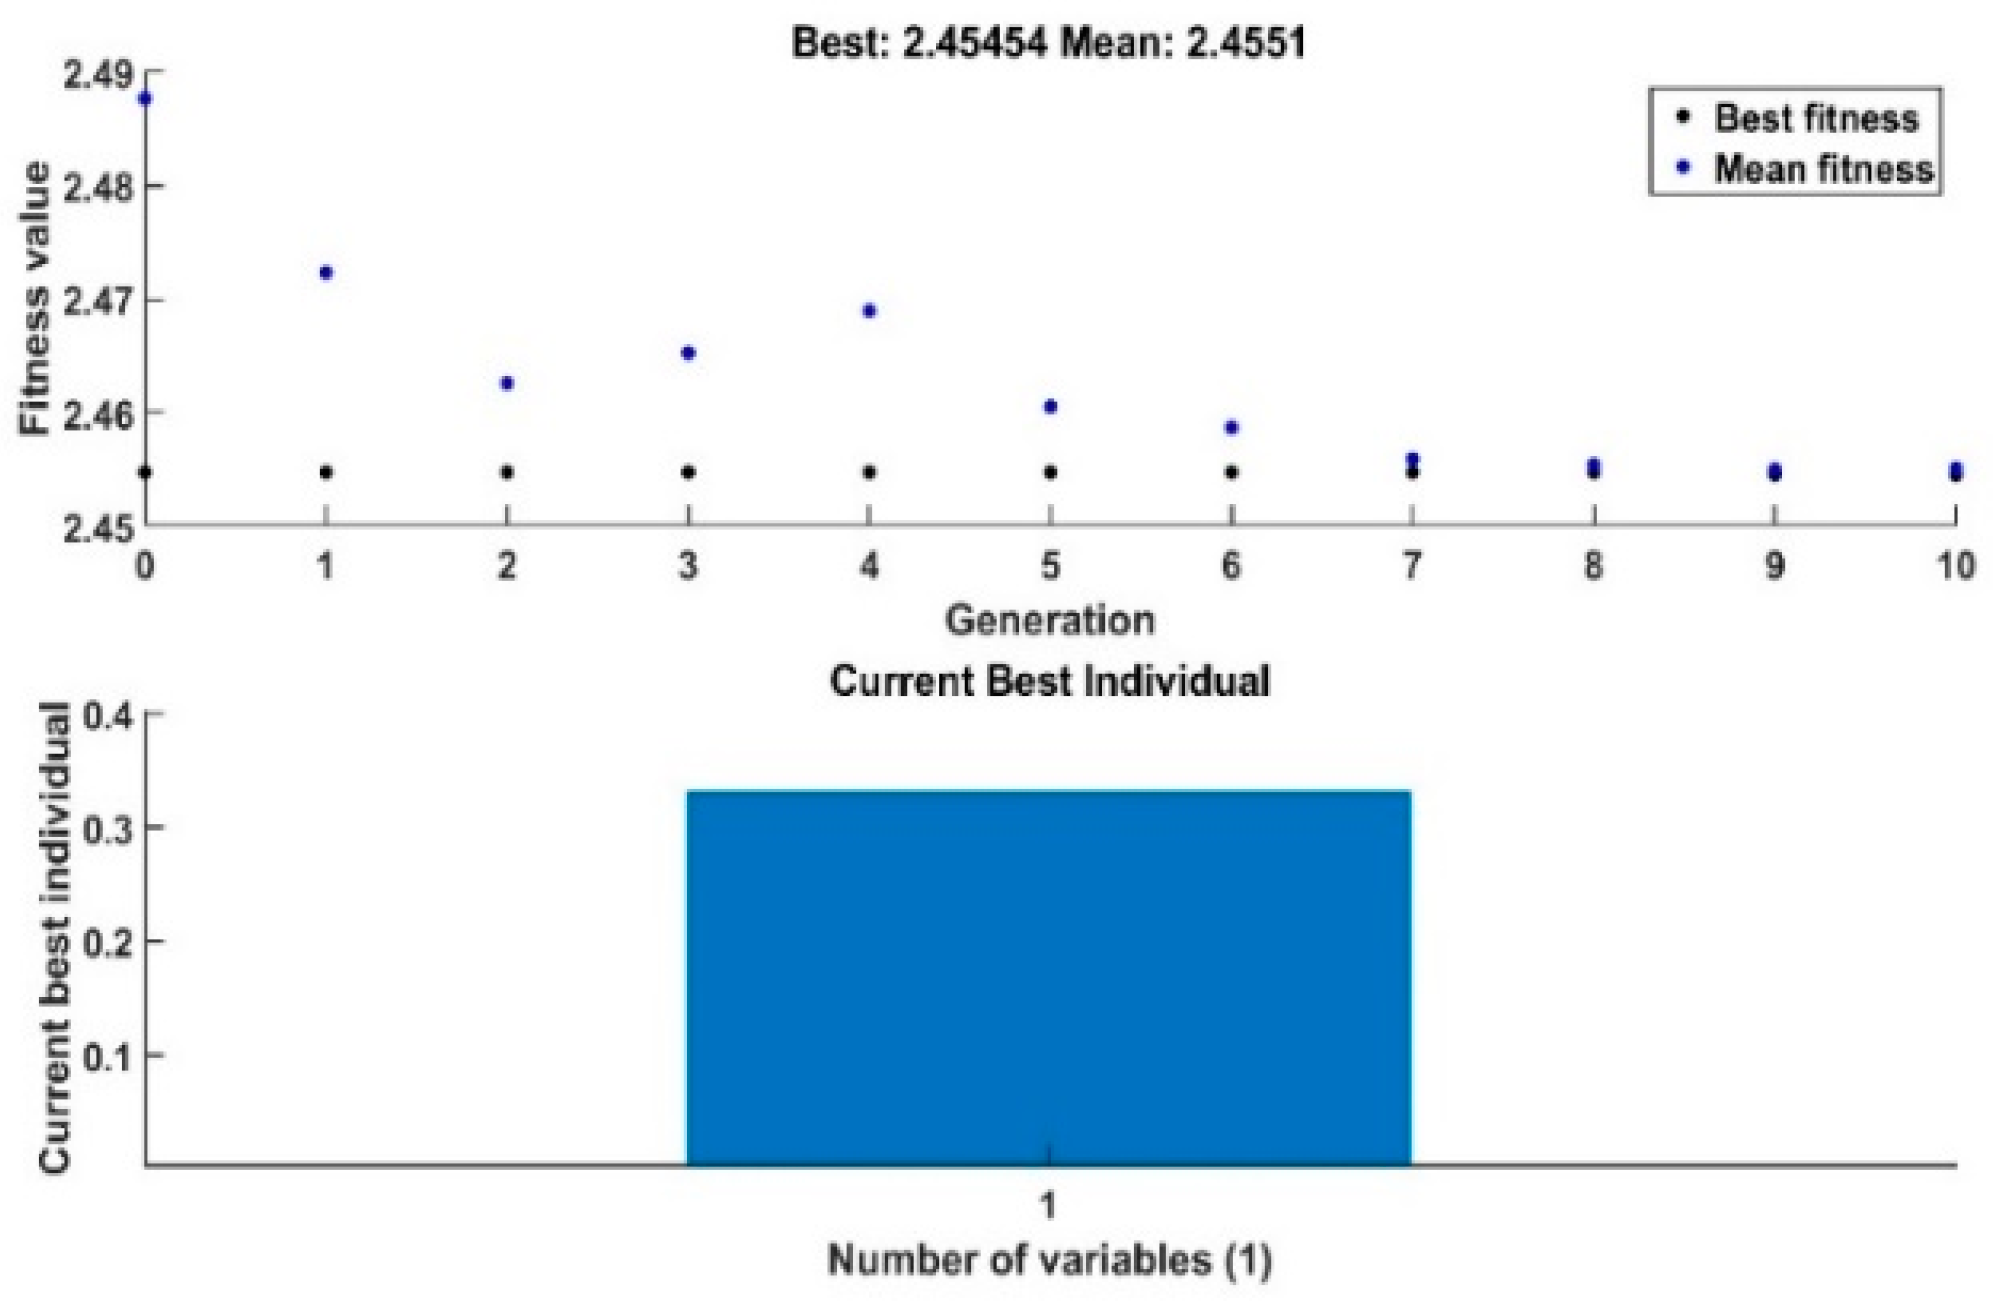
This article optimizes the power distribution of electric tractor dual motors through MATLAB, and sets the basic parameters of the algorithm: the population scale is 60, the initial population range is [0,1], the maximum number of iterations is 10, the cross proportion is 0.8, the number of elite individuals is 10, and the mutation probability is 0.2. The optimization model was run, and after several iterations, the optimized power distribution coefficient u was 0.3324, as shown in
Figure 10. It is known that the rated power and rated torque of Motor 1 after optimization are 42 kw and 200 N m, respectively.
3.2. Analysis of Optimization Results of Power Distribution Coefficient of Dual Motors
3.2.1. Comparison and Analysis of Driving Characteristics between the Optimized Electric Tractor and the Original Tractor
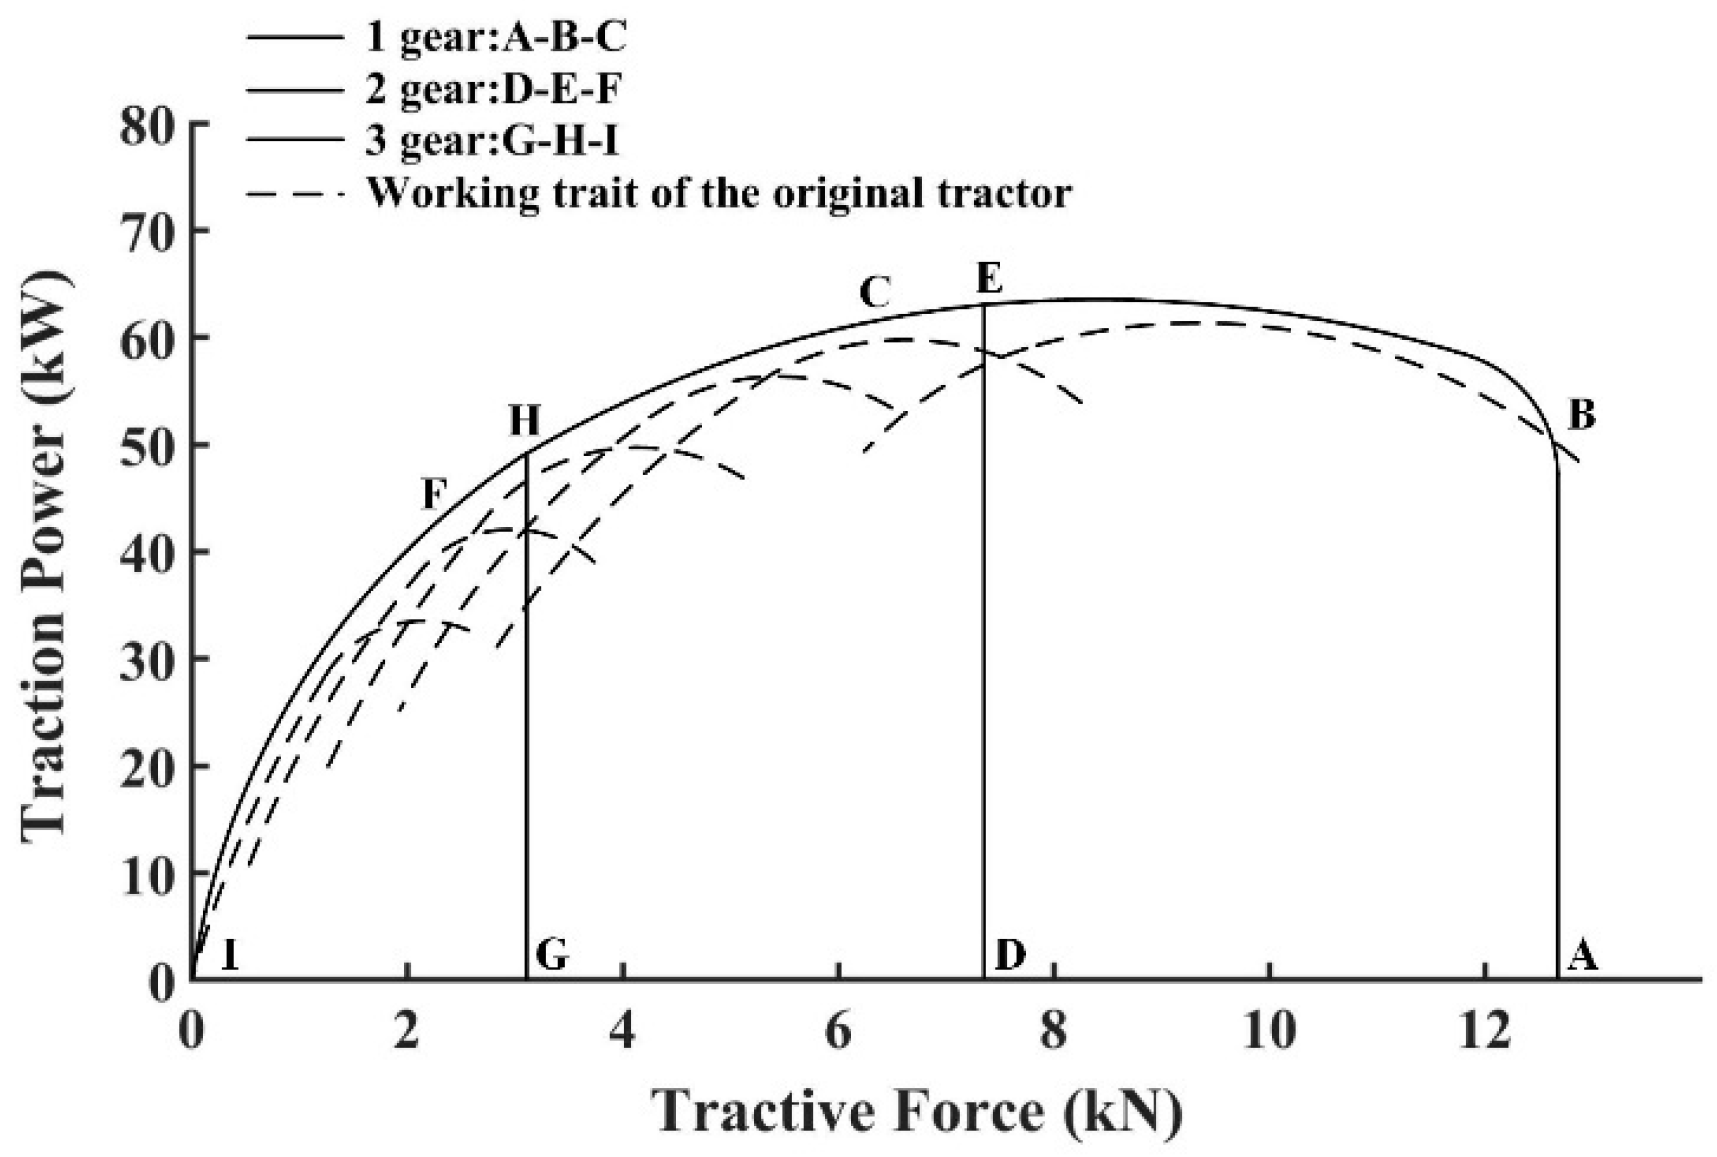
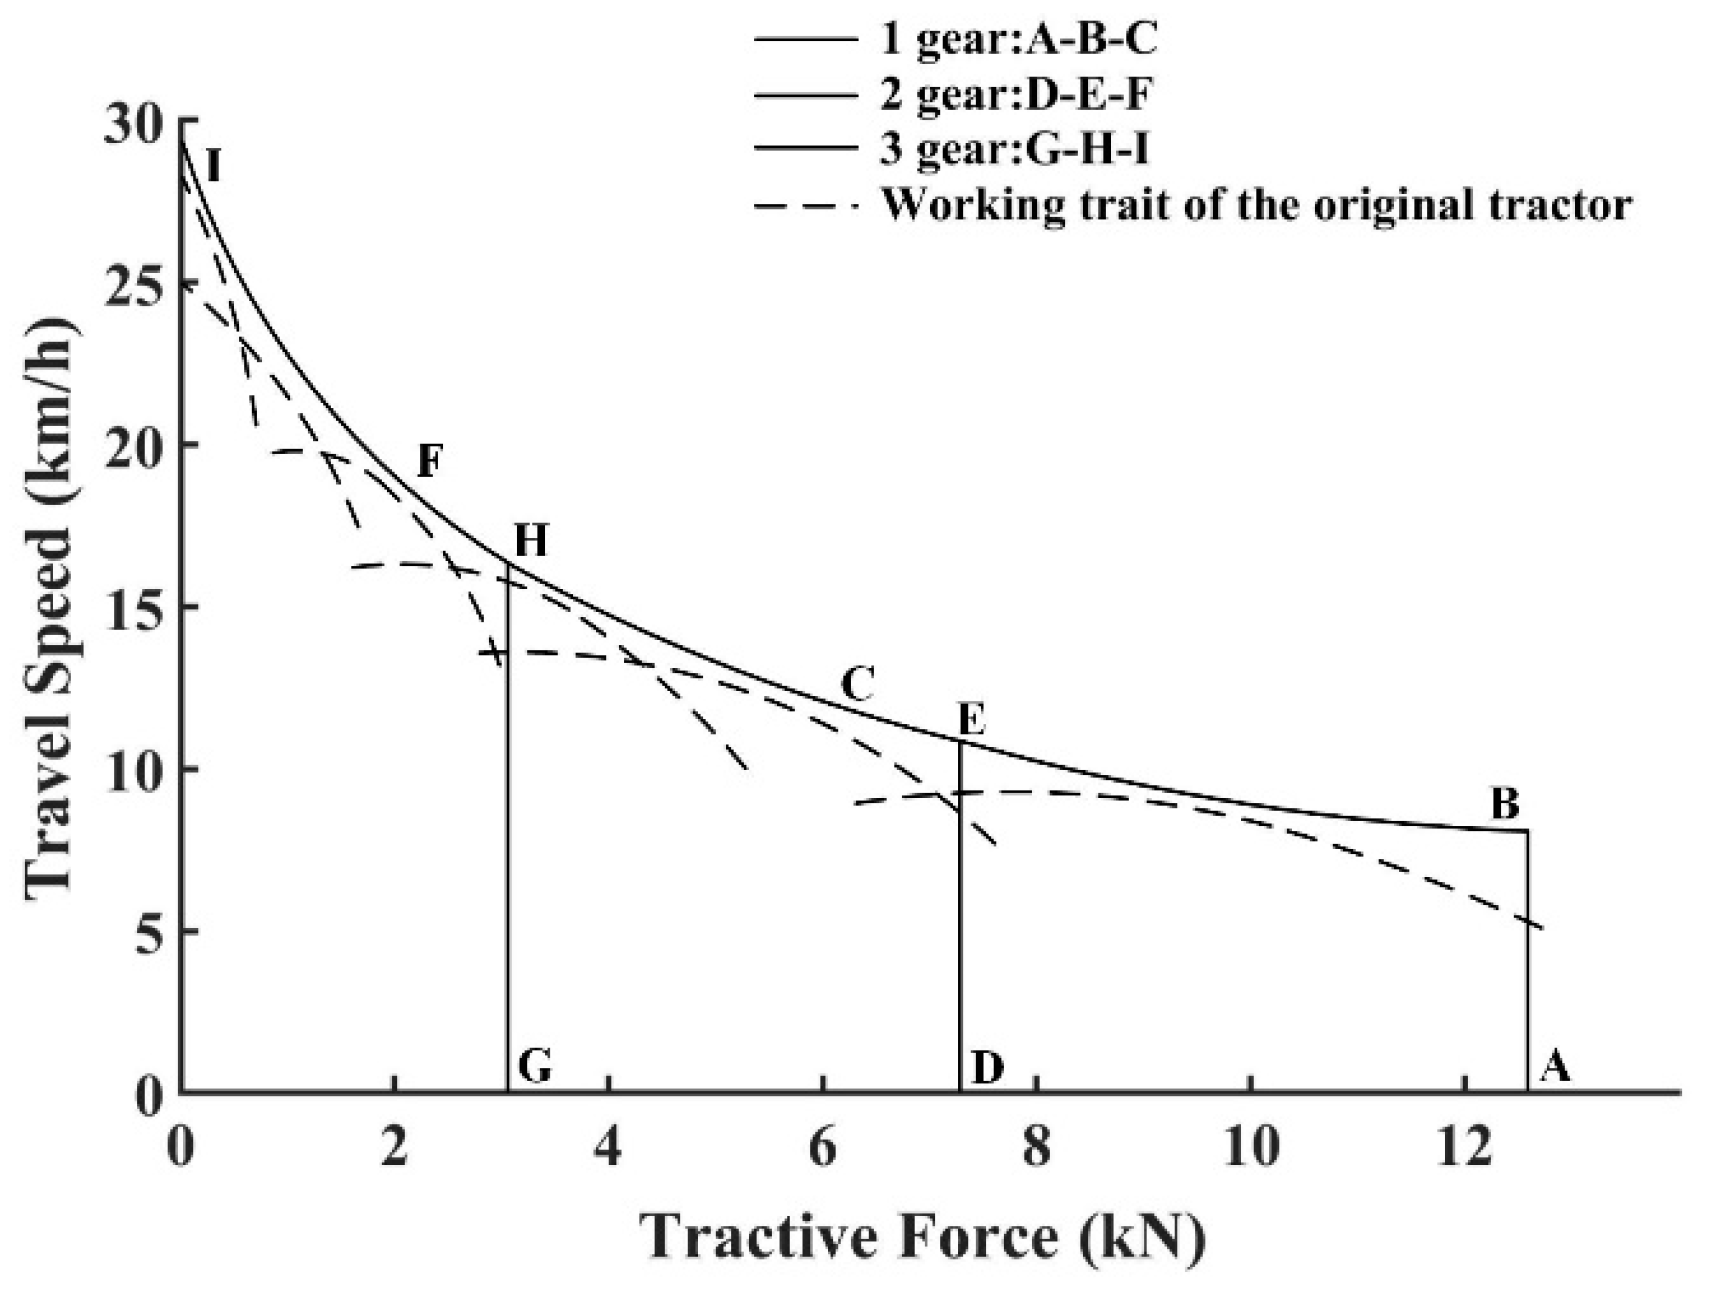
The solid and dotted lines in
Figure 10 and
Figure 11 are the optimized electric tractor characteristic curves and the original tractor characteristic curves, respectively. In
Figure 10 and
Figure 11, the first gear corresponds to Curve A-B-C, the second gear corresponds to curve D-E-F, the third gear corresponds to Curve G-H-I, and the working characteristics of the original tractor correspond to dashed lines. It can be seen from the traction force and traction power curve shown in
Figure 11 that the optimized electric tractor characteristic curve completely covers the original tractor characteristic curve, and the traction efficiency is improved by about 2.7%. The traction efficiency is the ratio of traction power at the power output extremity to the power of motors. Because the simulation result is discrete, it can be calculated by integrating power to time, and the formula is:
Due to the external characteristics of the motor, when the tractor is working in a gear, the traction force will first remain constant, then gradually decrease, and the traction power will first increase and then decrease. Taking Gear 2 as an example, the low-speed constant torque characteristics of the motor can enable it to maintain the tractor’s constant torque output before reaching the rated speed, that is, to maintain the tractor’s maximum output traction force, i.e., DE segment (DE segment indicates the region of traction power that the tractor can provide when it is in the second gear and the motor is in the constant torque zone). When reaching the rated speed, the traction power reaches the maximum value at Point E, and as the speed continues to increase, the traction force decreases, and so does the traction power, i.e., EF segment. The traction power reaches the peak value near the second gear working area. This is because when working in the Gear 2 working area, the adhesion performance is good. However, the tractor working in the Gear 1 working area has poor adhesion performance, a larger slip rate, and increased slip loss.
Figure 12 shows the variation in driving speed with traction. It can be seen from the figure that the maximum speed in the constant torque area of the motor can be fully utilized in Gear 1 is 8 km/h, the maximum speed in the constant torque area of the motor can be fully utilized in Gear 2 is 11.4 km/h, and the maximum speed in the constant torque area of the motor can be fully utilized in Gear 3 is 17.1 km/h. It can satisfy the speed demand of the tractor in different working environments, and the change in vehicle speed in low gear is smaller than that of traction force, which can ensure that the tractor can increase traction force as much as possible under heavy working conditions to improve farming efficiency. The speed change in high gear is larger than that of traction force, which can help the tractor to increase driving speed as much as possible under low-load working conditions to improve the working speed.
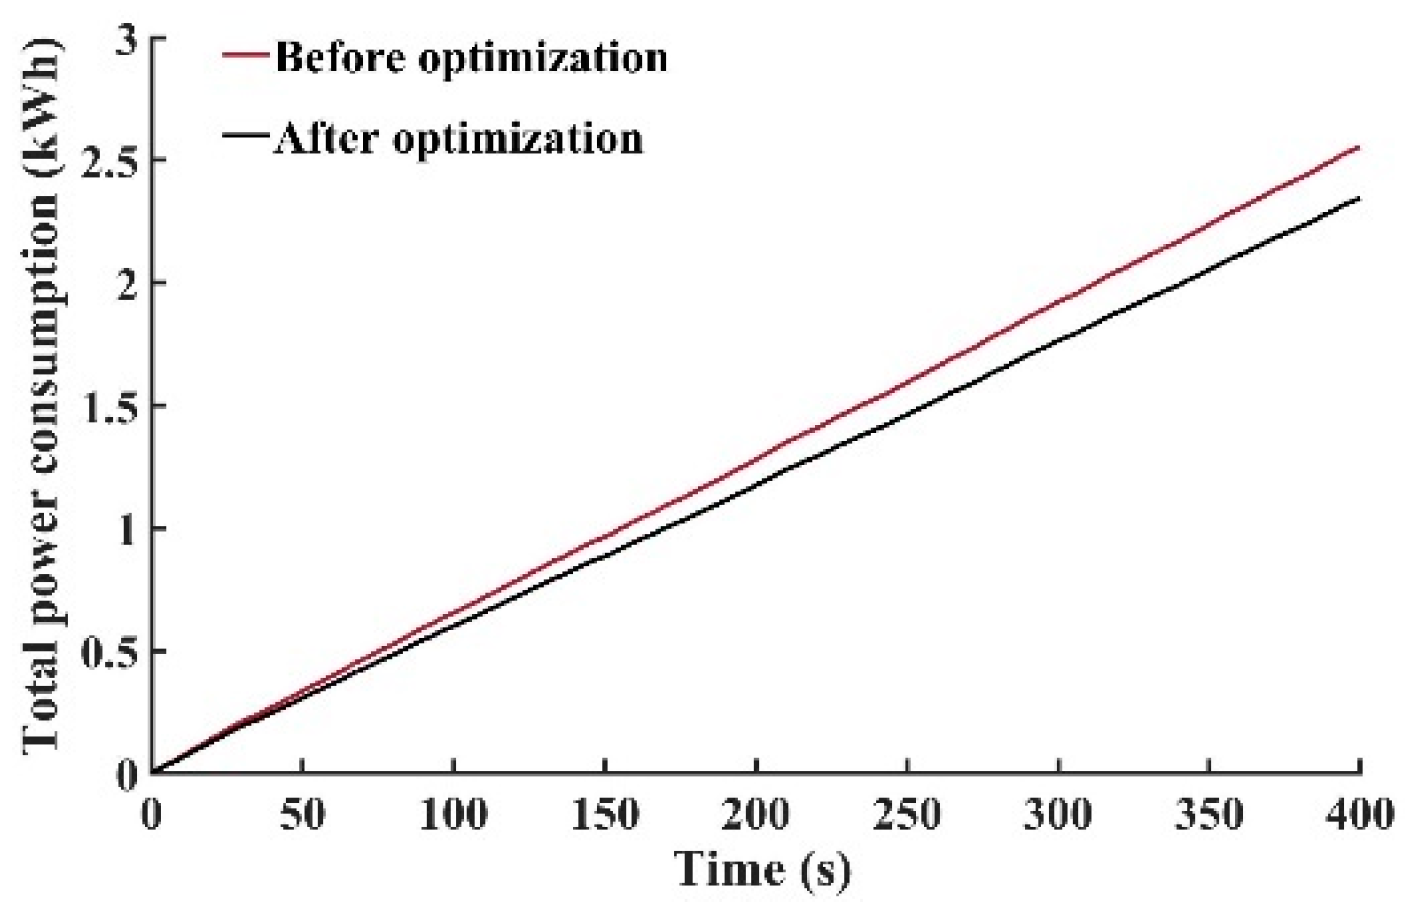
3.2.2. Comparison and Analysis of Total Power Consumption and Instantaneous Power Consumption before and after Optimization
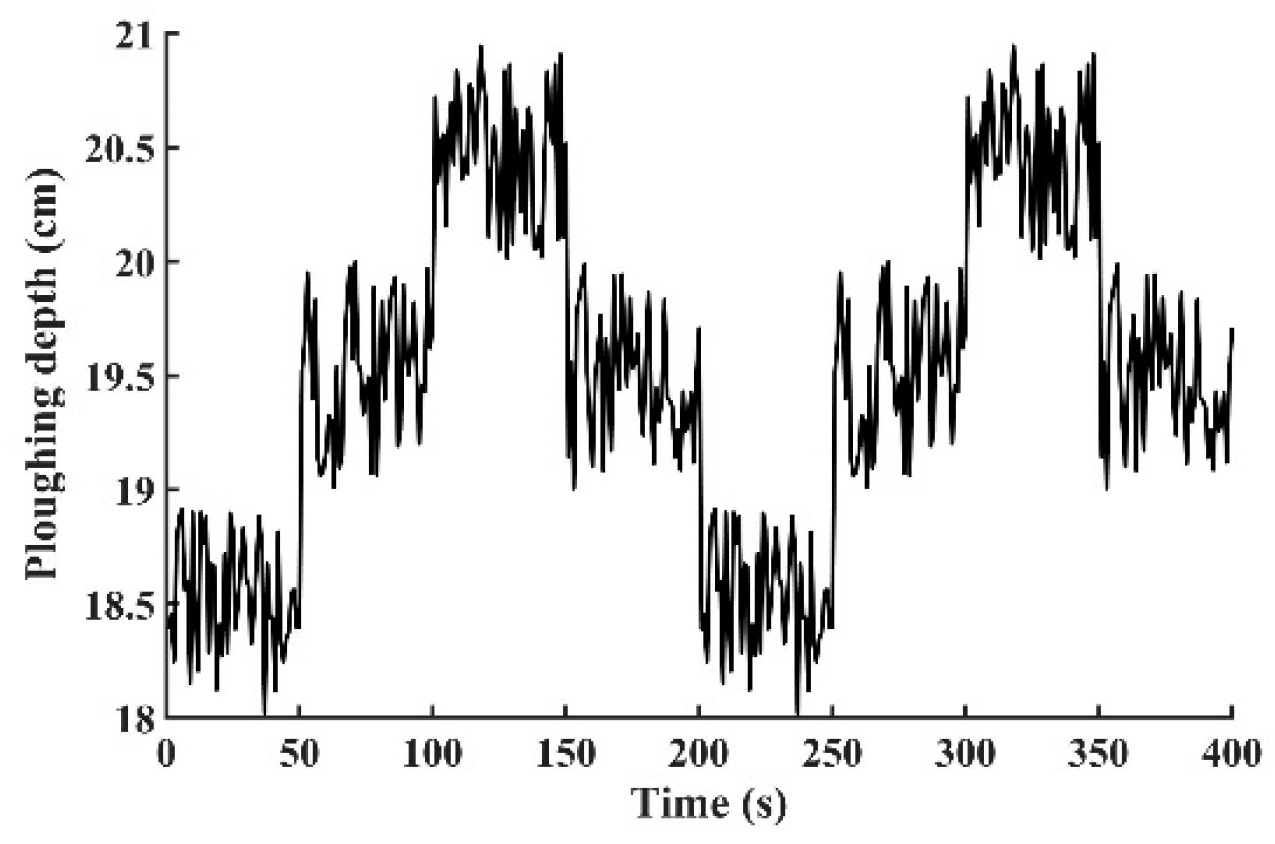
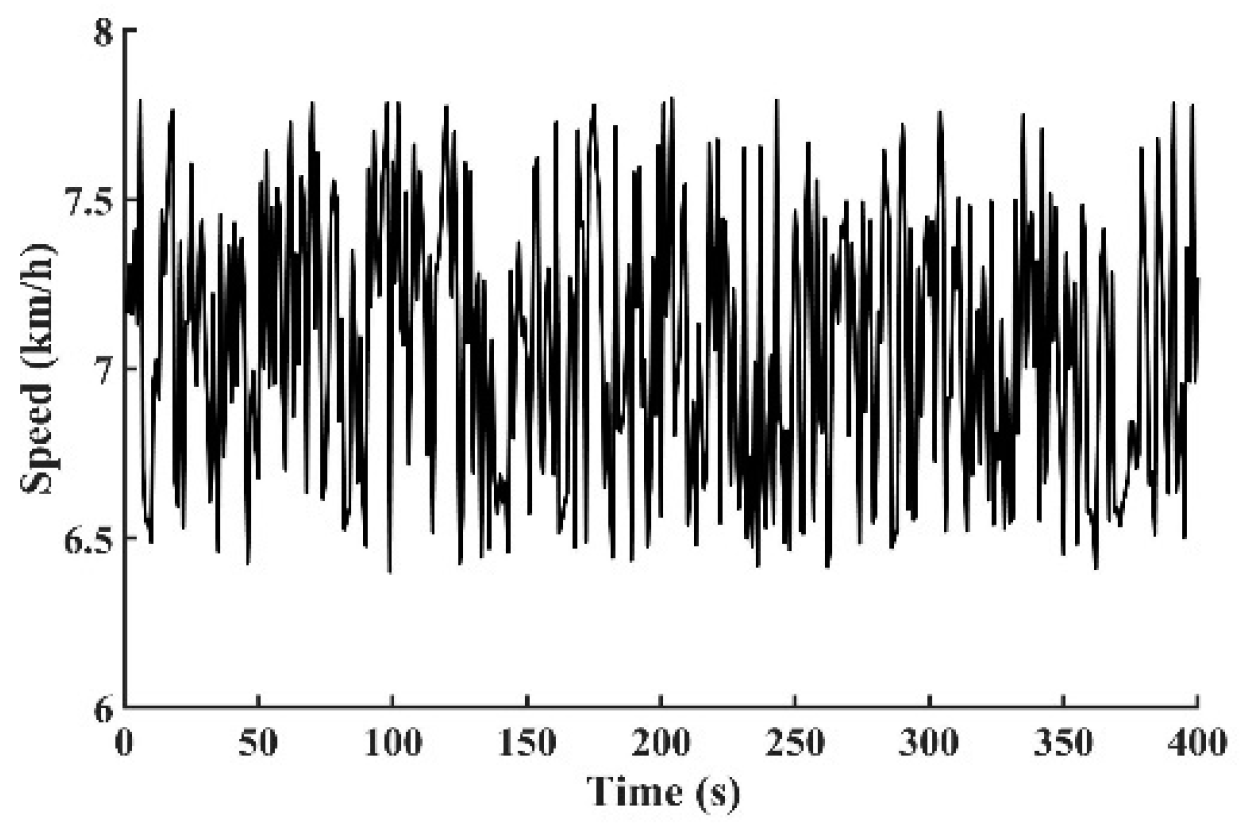
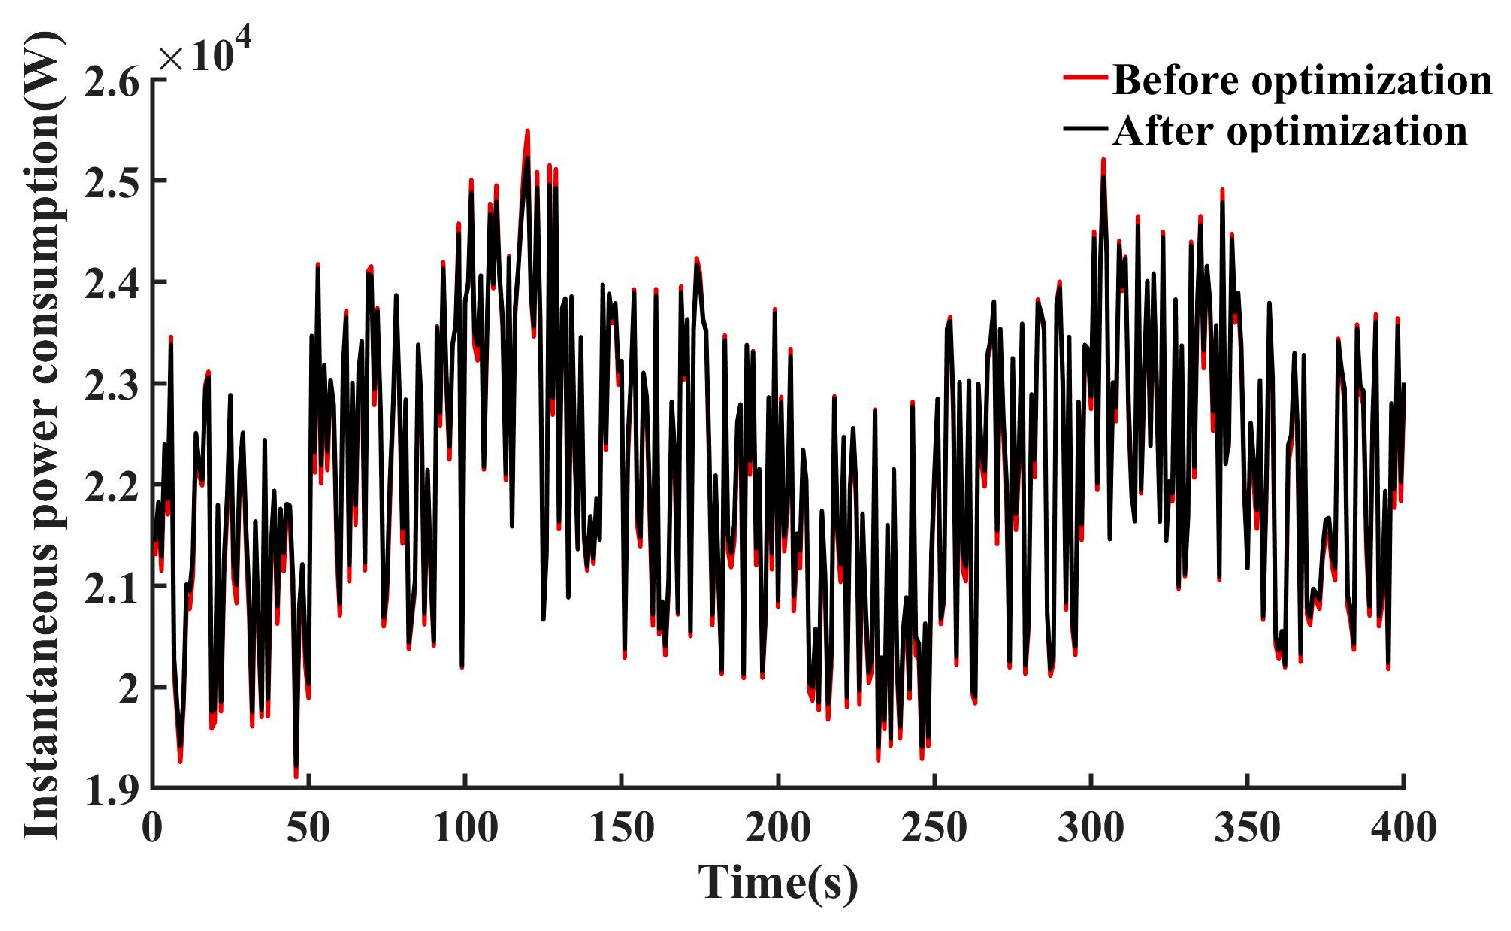
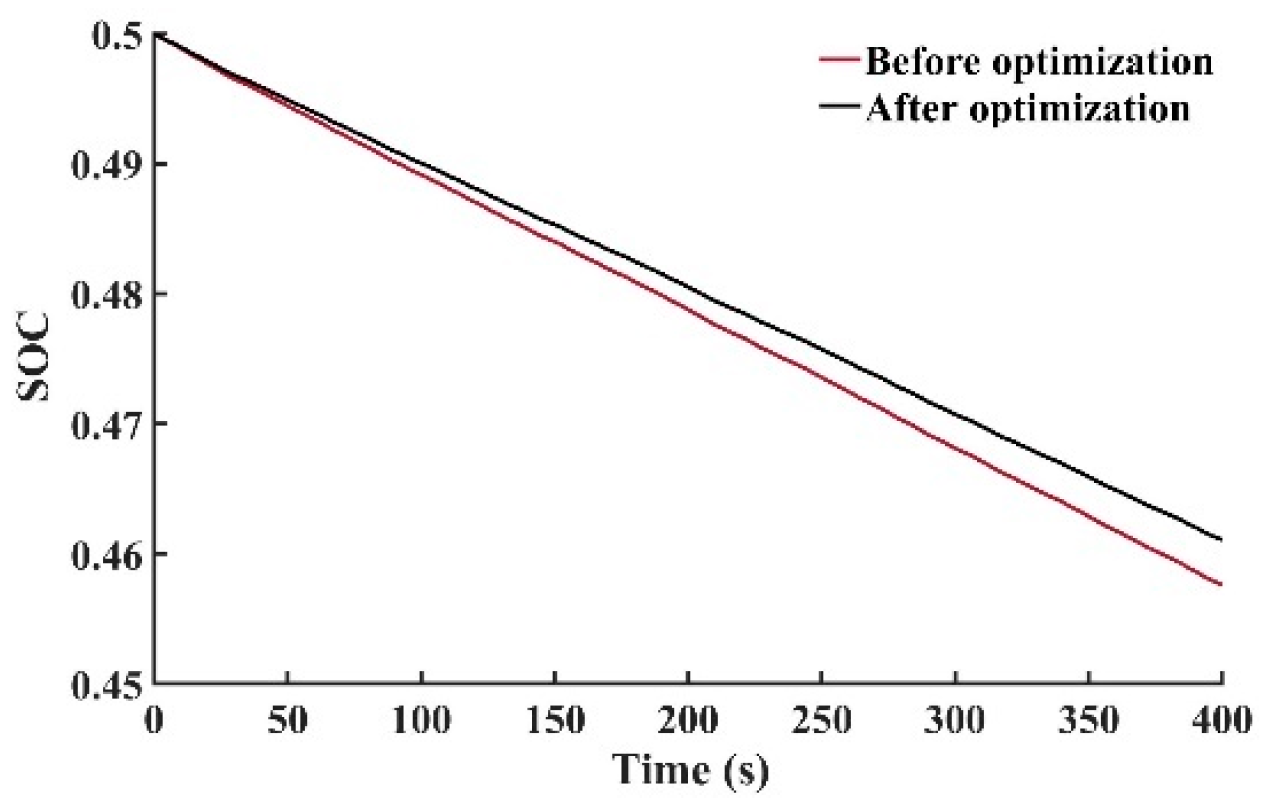
Setting the simulation working condition as the variable tillage deep tillage working condition with the tillage depths of 18.5 cm, 19.5 cm, and 20.5 cm, and keeping the plowing speed around 7 km/h, the simulation time is 400 s, and the tillage depth and speed are shown in
Figure 13 and
Figure 14. The simulation results of instantaneous power consumption and total power consumption of the tractor are shown in
Figure 15,
Figure 16 and
Figure 17. In
Figure 15, the comparison before and after optimization is expressed by amplitude. The reason why the values of the signals are not average is that the instantaneous power consumption of the tractor changes synchronously with the change in tillage depth.
From the data in the figure, the SOC consumed by the electric tractor before and after optimization is reduced from 0.044 to 0.039 when the plowing condition is the above variable tillage depth cycle condition and the vehicle speed is maintained at 7 km/h for 400 s, and the total power consumption is reduced from 2.55 kwh to 2.34 kwh. Before and after optimization, the total power consumption is reduced by 8.2% (total power consumption is derived from the implicit formula and some variables involve the interpolation method, which cannot be expressed by explicit formula).
4. Discussion
A transmission scheme of the driving system of the dual-motor electric tractor is proposed, and the parameters of the primary components of the electric driving system are calculated and matched. Then, the simulation model of the electric drive system is built, and the optimization model is established with the maximum traction, climbing slope, and acceleration time of the electric tractor as constraints; the power distribution coefficient of the tractor’s dual motors as decision variables; and the tractor’s power consumption as the optimization objective. Eventually, using MATLAB to optimize the power distribution coefficient of the dual motor, the selecting genetic algorithm as the optimization algorithm, and the optimal power distribution coefficient is obtained through iteration. The driving characteristics of the optimized electric tractor and the original tractor, as well as the instantaneous power consumption and total power consumption of the tractor before and after optimization, are compared and analyzed. The simulation analysis shows that the traction performance of the optimized electric tractor can better meet the working characteristics of the original tractor, and the traction efficiency is improved. The economy of the electric tractor after optimization is improved compared with that before optimization. In comparison with different references, the innovative point of this article is to propose and use the optimization variable different from other articles, that is, the power distribution coefficient of double motors, and the transmission scheme is also different from other articles. In the future, we will strengthen the research on the dual-motor power system and start the development of relevant software and hardware. In addition, we will also make some improvements to the optimization algorithm to obtain better results.
5. Conclusions
(1) This article puts forward a transmission scheme for the drive system of the double-motor electric tractor, and calculates and matches the parameters of the main components of the electric drive system.
(2) The Simulink simulation model of the electric drive system is built. The optimization model is established with the maximum traction force, gradient and acceleration time of the electric tractor as constraints, and the power distribution coefficient of the tractor’s dual motors as decision variables.
(3) Using MATLAB to optimize the power distribution coefficient of the dual motors, the tractor power and economy have been significantly improved after parameter matching and optimization.
Author Contributions
Conceptualization, L.X. and Y.T.; methodology, J.Z.; software, J.Z.; validation, X.Y. and Y.T.; formal analysis, Y.T.; investigation, X.Y.; resources, L.X.; data curation, Y.T.; writing—original draft preparation, Y.T.; writing—review and editing, X.Y.; visualization, J.Z.; supervision, L.X.; funding acquisition, L.X. All authors have read and agreed to the published version of the manuscript.
Funding
This research was funded in part by the 2022 Key Scientific Research Project Plan of Colleges and Universities in Henan Province: Hybrid Tractor Powertrain Control Technology Research, Grant Number 22B416001, in part by the Key technology research and development and assembly creation of hydrogen/methane agricultural machinery power system and intelligent control unit, a key national research and development plan project of the “14th Five-Year Plan”, Grant Number 2022YFD2001203, in part by the State Key Research and Development Special Project, Grant Number NK202216010103, in part by the State Key Laboratory Open Subject, Grant Number SKT2022001, and in part by the Henan Province key research and development and promotion project, Grant Number 222102240088.
Data Availability Statement
Not applicable.
Conflicts of Interest
The authors declare no conflict of interest.
Appendix A
Table A1.
Nomenclature.
| Symbol | Symbol Meaning | Dimension |
|---|
| FT | tractor plowing resistance | N |
| z | quantity of plowshares | - |
| b | width of single plowshare | cm |
| h | plowing depth | cm |
| k | soil specific resistance | N/cm2 |
| FTN | rated traction of the electric tractor | N |
| ηT | traction efficiency | - |
| PT | traction power exerted | kW |
| PM | effective power of traction motor | kW |
| ηmc | motor and controller efficiency | - |
ηm
ηδ
ηf | transmission efficiency | - |
| slip efficiency | - |
| rolling efficiency | - |
| Ft | driving force | N |
| Ff | rolling resistance | N |
| Fi | ramp resistance | N |
| f | rolling resistance coefficient | - |
| α | slope angle | ° |
| ig | transmission ratio of gearbox | - |
| i0 | transmission ratio of main reducer | - |
| r | radius of driving wheel | m |
| G | total mass of electric tractor | kg |
| vT | traveling speed of electric tractor | km/h |
| ne | rated speed of the motor | r/min |
| Pl | accessory power | kW |
| TN | working time of the electric tractor | h |
| U | load voltage | V |
| E | battery open-circuit voltage | V |
| I | battery discharge current | A |
| R | internal resistance of the battery | Ω |
| u | power distribution coefficient | - |
| δ | slip rate | - |
References
- Xie, B.; Wu, Z.B.; Mao, E.R. Development Status and Prospect of Agricultural Tractor Key Technologies. J. Agric. Mach. 2018, 49, 1–17. [Google Scholar]
- Xu, L.Y.; Zhao, Y.R.; Zhao, X.P.; Liu, M.N.; Ni, Q. Design and test of electric tractor comprehensive bench test system. J. Agric. Mach. 2020, 51, 355–363. [Google Scholar]
- Chen, Y.N.; Xie, B.; Du, Y.; Mao, E.R. Powertrain parameter matching and optimal design of dual-motor driven electric trac-tor. Int. J. Agric. Biol. Eng. 2019, 12, 33–41. [Google Scholar]
- Gao, H.S.; Wang, S.S.; Zhu, S.H. Driving force and transmission efficiency characteristics test of electric tractors. J. Agric. Mach. 2008, 10, 40–43+58. [Google Scholar]
- Wang, Y.; Sun, D.Y. Powertrain matching and optimization of dual-motor hybrid driving system for electric vehicle based on quantum genetic intelligent algorithm. Discret. Dyn. Nat. Soc. 2014, 2014, 1–11. [Google Scholar] [CrossRef] [Green Version]
- Gao, J.P.; Wei, Y.H.; Liu, Z.N. Matching and optimization for powertrain system of parallel hybrid electric vehicle. Appl. Mech. Mater. 2013, 341–342, 423–431. [Google Scholar] [CrossRef]
- Li, L.; Zhang, Y.; Yang, C.; Jiao, X.; Zhang, L.; Song, J. Hybrid genetic algorithm-based optimization of powertrain and control parameters of plug-in hybrid electric bus. J. Frankl. Inst. 2015, 352, 776–801. [Google Scholar] [CrossRef]
- Mozaffari, A.; Vajedi, M.; Chehresaz, M.; Azad, N. Multi-objective component sizing of a power-split plug-in hybrid electric vehicle powertrain using Pareto-based natural optimization machines. Eng. Optim. 2016, 48, 361–379. [Google Scholar] [CrossRef]
- Madanipour, V.; Montazeri-Gh, M.; Mahmoodi, K.M. Multi-objective component sizing of plug-in hybrid electric vehicle for optimal energy management. Clean Technol. Environ. Policy 2017, 19, 291. [Google Scholar] [CrossRef] [Green Version]
- Wang, J.M. Parameter Design and Optimization of Pure Electric Vehicle Driving System. Master’s Thesis, Jilin University, Changchun, China, 2019. [Google Scholar]
- Gao, H.S.; Zhu, S.H. Research on design theory and method of electric tractor transmission system. J. Nanjing Agric. Univ. 2009, 32, 140–145. [Google Scholar]
- Xiong, X.F.; Xiao, P.X. The Control Strategy of Flywheel Battery for Electric Vehicles. In Proceedings of the IEEE International Conference on Control and Automation, Guangzhou, China, 30 May–1 June 2007. [Google Scholar]
- Zhao, J.H.; Xu, L.Y.; Liu, E.Z.; Liu, M.N.; Meng, T. Design of the drive system of the increased program electric tractor. Res. Agric. Mech. 2018, 40, 236–240. [Google Scholar]
- Shi, H. Research on Hybrid Tractor Powertrain Design. Master’s Thesis, Henan University of Science and Technology, Luoyang, China, 2014. [Google Scholar]
- Xu, L.Y.; Liu, M.N.; Zhou, Z.L. Driving system design of series hybrid tractor. J. Agric. Eng. 2014, 30, 11–18. [Google Scholar]
- Li, C.B.; Li, Y.; Xiao, W.H.; Hu, J.; Zhao, L.J. Parameter optimization and matching of dual-motor powertrain of pure electric vehicle for energy consumption. Comput. Integr. Manuf. Syst. 2017, 23, 1620–1628. [Google Scholar]
- Xu, L.Y.; Zhou, Z.L.; Zhang, M.Z.; Li, Y. Rational matching of tractor hydro mechanical continuously variable transmission system and engine. J. Agric. Eng. 2006, 09, 109–113. [Google Scholar]
- Zhou, Z.L.; Xia, X.W.; Xu, L.Y. Design of electric tractor drive system. J. Henan Univ. Sci. Technol. 2015, 36, 78–81+86+9. [Google Scholar]
- Millo, F.; Zhao, J.; Rolando, L.; Cubito, C.; Fuso, R. Optimizing the design of a plug-in hybrid electric vehicle from the early phase: An advanced sizing methodology. Comput.-Aided Des. Appl. 2015, 12 (Suppl. S1), 22–32. [Google Scholar] [CrossRef] [Green Version]
- Zhao, X. Research on Powertrain Control Strategy of Pure Electric Bus. Master’s Thesis, Chang’an University, Xian, China, 2012. [Google Scholar]
- Jin, T.T. Research on Modeling and Optimal Control of Hybrid Power Transmission System. Master’s Thesis, Beijing Jiaotong University, Beijing, China, 2014. [Google Scholar]
- Zhang, K.K.; Xu, L.F.; Hua, J.F.; Li, J.Q.; Ouyang, M.G.; Zhao, X.Y.; Cheng, A.G. Parameter matching method of pure electric vehicle powertrain based on multi-objective optimization. Automot. Eng. 2015, 37, 757–765. [Google Scholar]
- Qian, J.; Wang, D.F.; Miao, X.D. Multi objective optimization of automobile transmission parameters based on particle swarm optimization. Mech. Manuf. Autom. 2018, 47, 168–170. [Google Scholar]
- Fu, S.H.; Li, Z.; Du, Y.F.; Mao, E.R.; Zhu, Z.X. Matching optimization of tractor transmission system based on improved NSGA -II algorithm. J. Agric. Mach. 2018, 49, 349–357. [Google Scholar]
- YU, L.; Shi, F. Analysis of 30 Cases of MATLAB Intelligent Algorithm, 2nd ed.; Beijing University of Aeronautics and Astronautics Press: Beijing, China, 2011; pp. 15–24. [Google Scholar]
Figure 1.
Research flow chart of matching and optimization of power system of electric tractor.
Figure 1.
Research flow chart of matching and optimization of power system of electric tractor.
Figure 2.
Power system transmission scheme.
Figure 2.
Power system transmission scheme.
Figure 3.
Structural diagram of transmission. 1, Input shaft; 2, Bearing; 3, Input shaft transmission gear; 4, Intermediate shaft drive gear; 5, Intermediate shaft; 6, Intermediate shaft third gear; 7, Gear 2 of intermediate shaft; 8, Support bearing; 9, Gear 1 of intermediate shaft; 10, Gear 1, synchronizer engagement sleeve; 11, Output shaft; 12, Gear 1 of intermediate shaft; 13, Gear 2; 14, Gear 2 of output shaft and Gear 3 of synchronizer joint sleeve; 15, Gear 3 of output shaft.
Figure 4.
Motor efficiency model.
Figure 4.
Motor efficiency model.
Figure 5.
Motor Simulink model diagram.
Figure 5.
Motor Simulink model diagram.
Figure 6.
Equivalent model of battery.
Figure 6.
Equivalent model of battery.
Figure 7.
Relationship between open-circuit voltage and SOC during discharge.
Figure 7.
Relationship between open-circuit voltage and SOC during discharge.
Figure 8.
Relationship between battery internal resistance and SOC during discharge.
Figure 8.
Relationship between battery internal resistance and SOC during discharge.
Figure 9.
Battery Simulink model.
Figure 9.
Battery Simulink model.
Figure 10.
Iteration diagram of power distribution coefficient.
Figure 10.
Iteration diagram of power distribution coefficient.
Figure 11.
Relationship between traction power and traction force.
Figure 11.
Relationship between traction power and traction force.
Figure 12.
Relationship between driving speed and traction.
Figure 12.
Relationship between driving speed and traction.
Figure 13.
Simulated Tillage Depth.
Figure 13.
Simulated Tillage Depth.
Figure 14.
Simulated speed diagram.
Figure 14.
Simulated speed diagram.
Figure 15.
Comparison diagram of instantaneous power consumption.
Figure 15.
Comparison diagram of instantaneous power consumption.
Figure 16.
Comparison chart of SOC.
Figure 16.
Comparison chart of SOC.
Figure 17.
Comparison chart of total power consumption.
Figure 17.
Comparison chart of total power consumption.
Table 1.
Primary parameters of electric tractor drive system.
Table 1.
Primary parameters of electric tractor drive system.
| Components | Parameter | Design Value |
|---|
| Vehicle | Curb weight/kg | 3600 |
| Rated traction/kN | 12.6 |
| Motor | Rated power (peak power)/kw | 63 (125) |
| Rated torque (peak torque)/(Nm) | 300 (600) |
| Rated speed (peak speed)/(r/min) | 2000 (6000) |
| Battery pack | Rated voltage/V | 540 |
| Rated capacity/Ah | 110 |
| Number of battery packs | 12 |
| Transmission | Gear 1 ratio | 9.42 |
| Gear 2 ratio | 7.54 |
| Gear 3 ratio | 6.12 |
| Disclaimer/Publisher’s Note: The statements, opinions and data contained in all publications are solely those of the individual author(s) and contributor(s) and not of MDPI and/or the editor(s). MDPI and/or the editor(s) disclaim responsibility for any injury to people or property resulting from any ideas, methods, instructions or products referred to in the content. |
© 2023 by the authors. Licensee MDPI, Basel, Switzerland. This article is an open access article distributed under the terms and conditions of the Creative Commons Attribution (CC BY) license (https://creativecommons.org/licenses/by/4.0/).


