Article

Battery Pack Prospects for Long-Haul Transport Trucks Considering Electrified Highways and Megawatt Charging

1
National Research Council of Canada, 1200 Montreal Rd., Ottawa, ON K1A 0R6, Canada
2
Natural Resources Canada, 1 Haanel Drive, Ottawa, ON K1A 1M1, Canada
3
ICAM-Lille, 6 Rue Auber, 59800 Lille, France
*
Author to whom correspondence should be addressed.
World Electr. Veh. J. 2023, 14(3), 60; https://doi.org/10.3390/wevj14030060
Submission received: 10 February 2023 / Revised: 22 February 2023 / Accepted: 24 February 2023 / Published: 28 February 2023

Abstract

:
The economics of long haul trucking on both continuous and intermittent Electric Highways were evaluated from a technical perspective as alternatives to using conventional megawatt chargers. The study revealed complex and sensitive interplay between the various technical factors related to the vehicle, its battery pack and the configuration and construction of the electrified highway. Key preliminary outcomes showed that a 250 kW highway power supply level allows a 36 tonne truck to drive continuously without requiring off-road recharging, and it can operate with a battery pack of about 50% of the size required for a truck only using megawatt charging. For now, while there is no overwhelming case in favour of any particular technology, the study serves to highlight the relevant factors impacting anticipated design criteria for the electrification of highways.

1. Introduction

There is growing worldwide societal commitment to the electrification of road transport which will require a broad overhaul of equipment and infrastructure. All classes of on-road vehicles consume upwards of 75% of the energy used in the transportation sector, with heavy duty trucks accounting for about one-third of this [1]. An emerging technology is that of electrified roadways whereon electric vehicles receive electrical power to power the vehicle as well as charge their batteries while driving. On electrified highways (e-Hwys), vehicles would require smaller batteries than otherwise, and still drive long distances. Vehicles seeking to adhere to a schedule would not require significant downtime for recharging. Similarly, heavy duty trucks for long-distance road freight, whose battery capacity would normally be a concern as well as a costly component, could potentially match today’s diesel performance with far lower energy costs and without releasing greenhouse gas, soot and polluting gas components. Of course, the infrastructure costs for e-Hwys are high and would require a solid techno-economic case to bring about their implementation.
To now, there have been a number of published studies considering energy and infrastructure forecasting for long haul trucking electrification [2,3,4]. In general they suggest that e-Hwys are a viable alternative to megawatt charging systems on an economic level. Naturally, whatever modality or mix of modalities of electrification is eventually adopted, its implementation will have an all-encompassing impact in terms of equipment and compatibility, accessibility, ease of use and operational efficiency. A key component in all of these options will be vehicle battery packs. An assessment of battery pack requirements and projected durability in these scenarios will be a critical criterion informing choices ultimately to be made for future infrastructure development. At power provision levels similar to or above instantaneous vehicle needs, the battery state of charge (SOC) can be controlled to deviate only slightly from a mid-level set point, thereby simultaneously minimizing degradation rates.
The electrification of roadways is now a developing reality. Ultimately, should e-Hwys become widespread, it would require a level of full commitment to them from a range of sectors including highway departments, vehicle manufacturers, the electrical distribution grid, favorable policy and popular support. Test sections of e-Hwys are an essential first step. Notable initial efforts include a 1.6 km test section of e-Hwy on the Swedish island of Gotland [4], a 10 km catenary supplied section of the A5 autobahn in Germany [5], a test section of e-Hwy between Paris and Orléans in France is planned with the Vinci group working with government support [6], as well as portions of a route used by electric buses in Tel Aviv [7] also involving commercial company Electreon.
In a simulation study, the National Research Council of Canada and Natural Resources Canada jointly investigated the operation and economics of electric trucks using megawatt charging and of e-Hwys with DWPT, specifically including the cost of battery degradation in the economic evaluation. Additionally, the potential of intermittent electrification of the 540 km highway between Toronto and Montreal in Canada was evaluated as a means to reduce investment costs.

2. Study Scope and Methodology
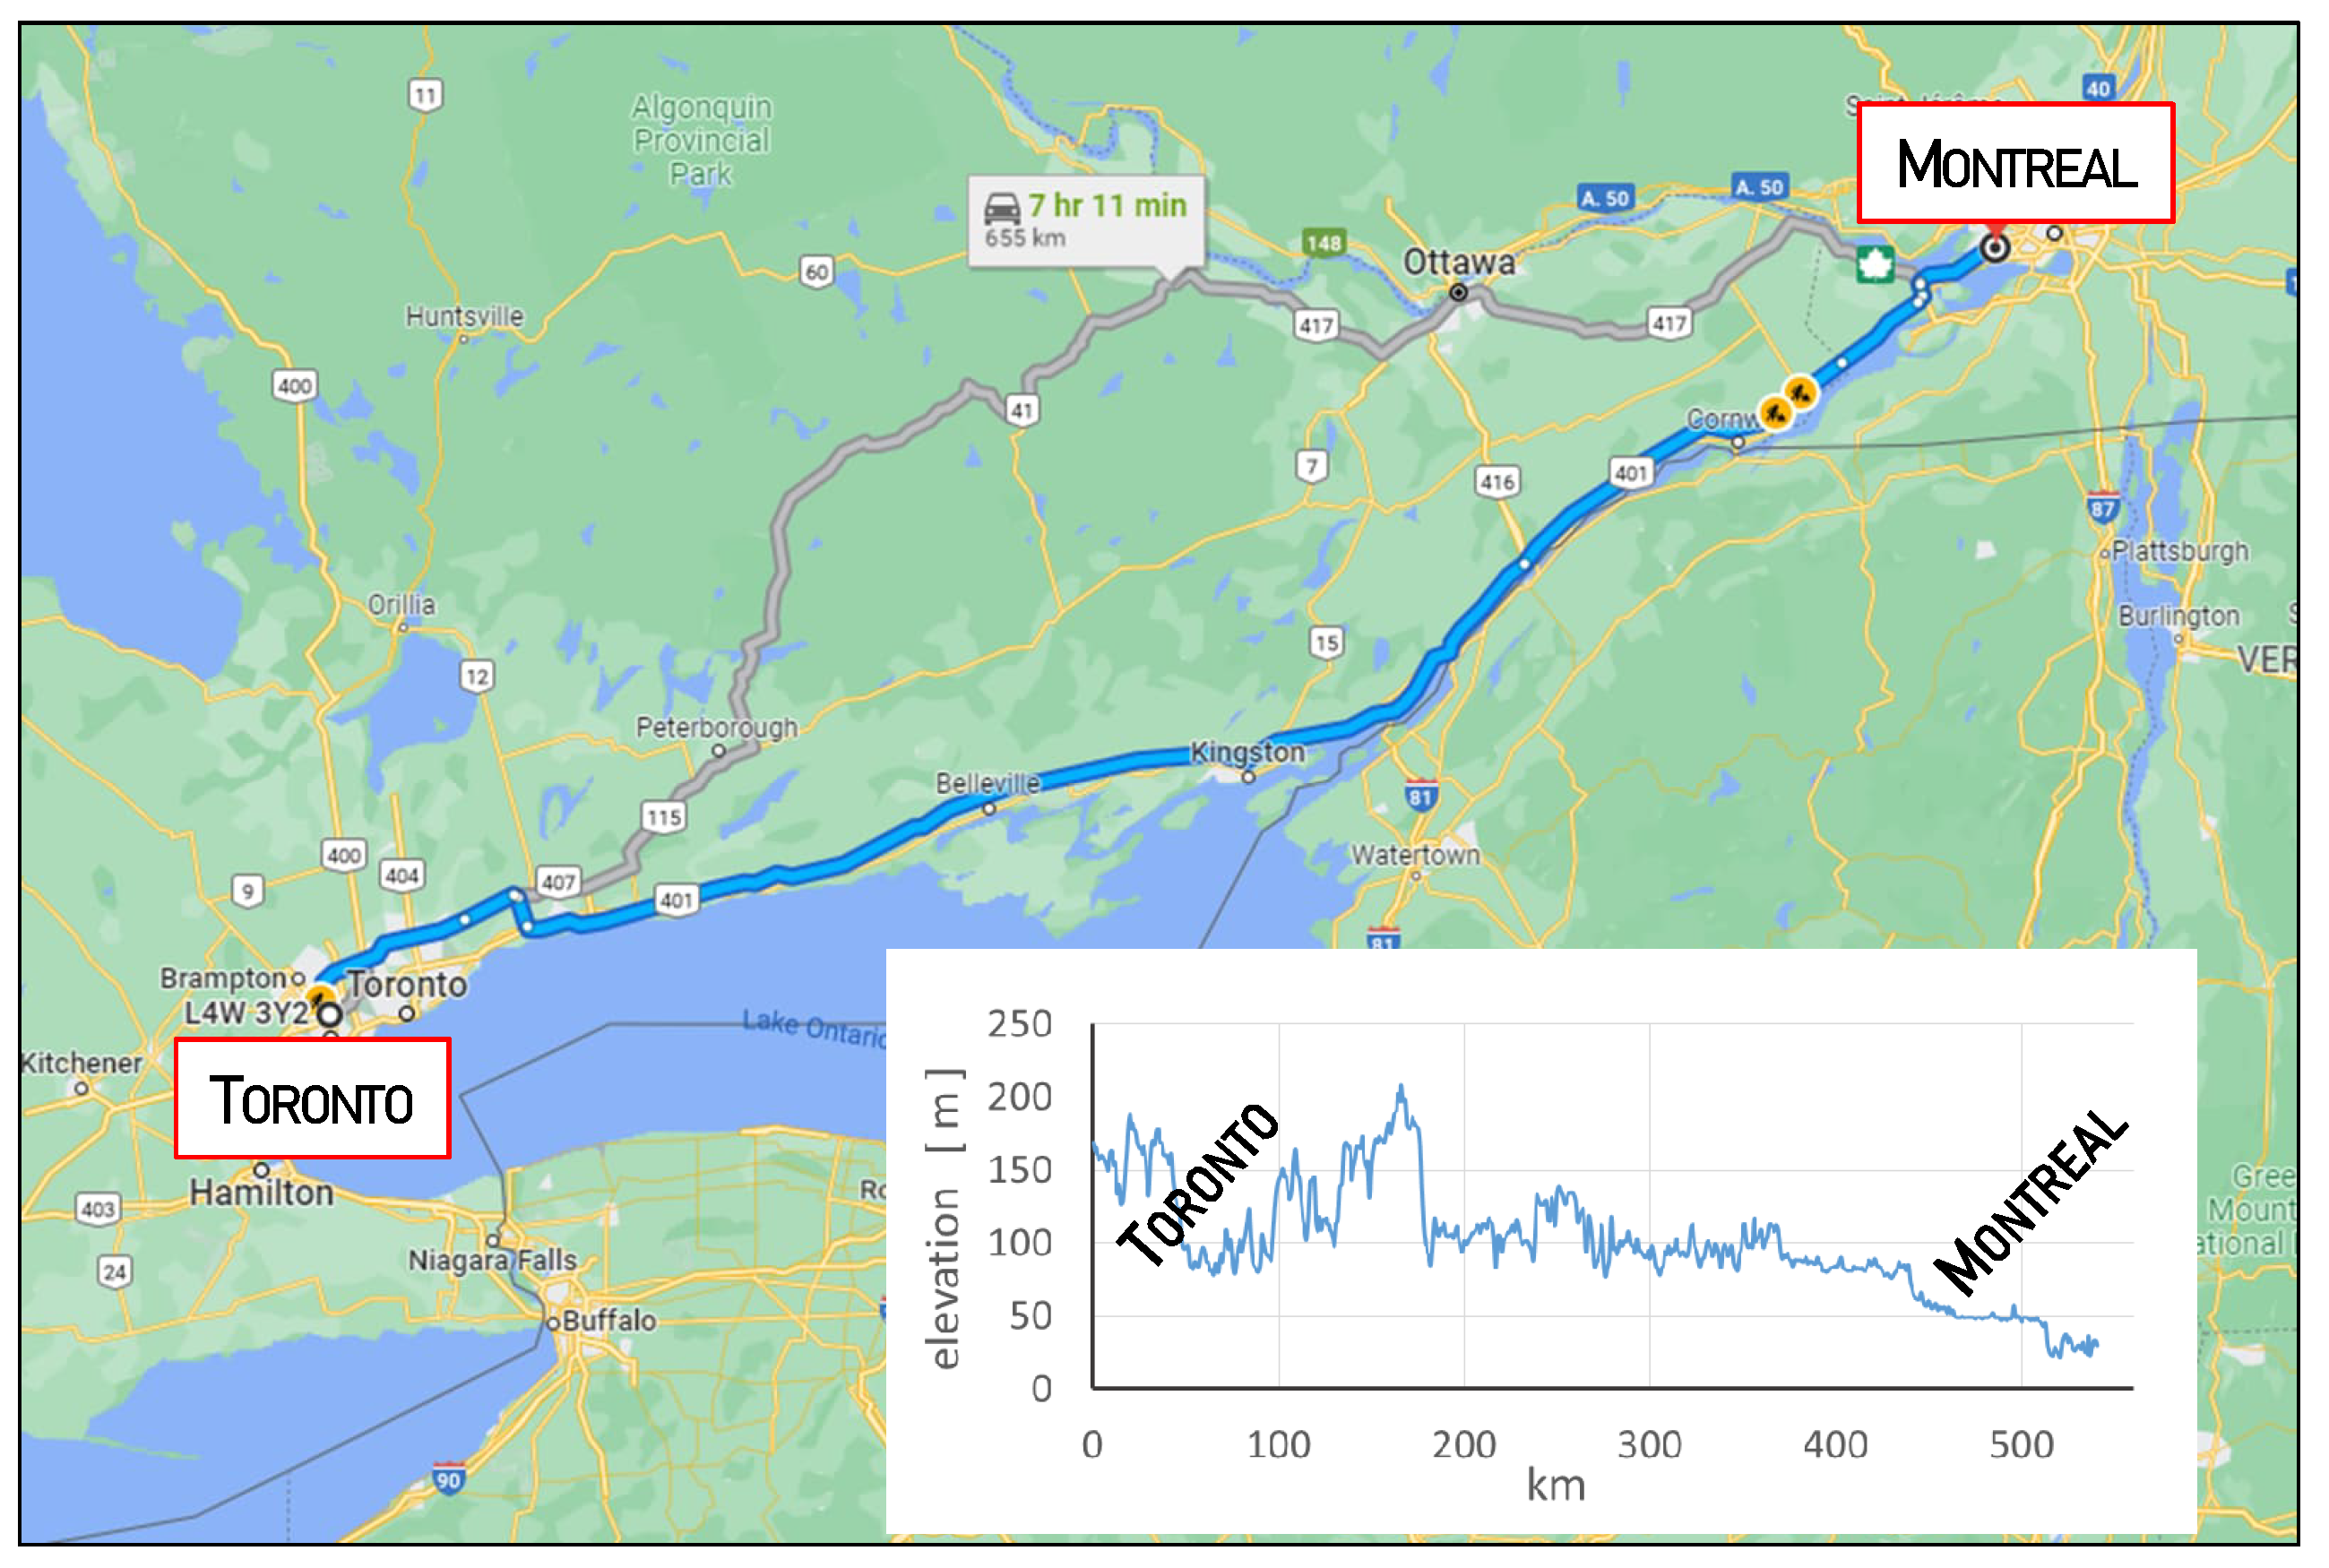
2.1. Route

The route between Toronto and Montreal in Canada is one of the busiest highways in North America. A total of about 8000 trucks use it in either direction on a daily basis. Local depots of a shipping company in both cities were selected as the end points of the daily two-way duty cycle of 1081 km, of which 99% is on highways. Speed limits and elevations at 500 m intervals along the route were obtained from Google Earth [8], and outdoor conditions along this route were given by hourly temperature data published by Environment Canada [9] for the year 2020. On the highway, the truck speed was set as 100 km/h. Figure 1 is a map of the route driven, along with an accompanying elevation profile in the inset.

2.2. Scenarios

Three e-Hwy scenarios were evaluated against a reference case of a truck using only battery power and being recharged with a megawatt charger:
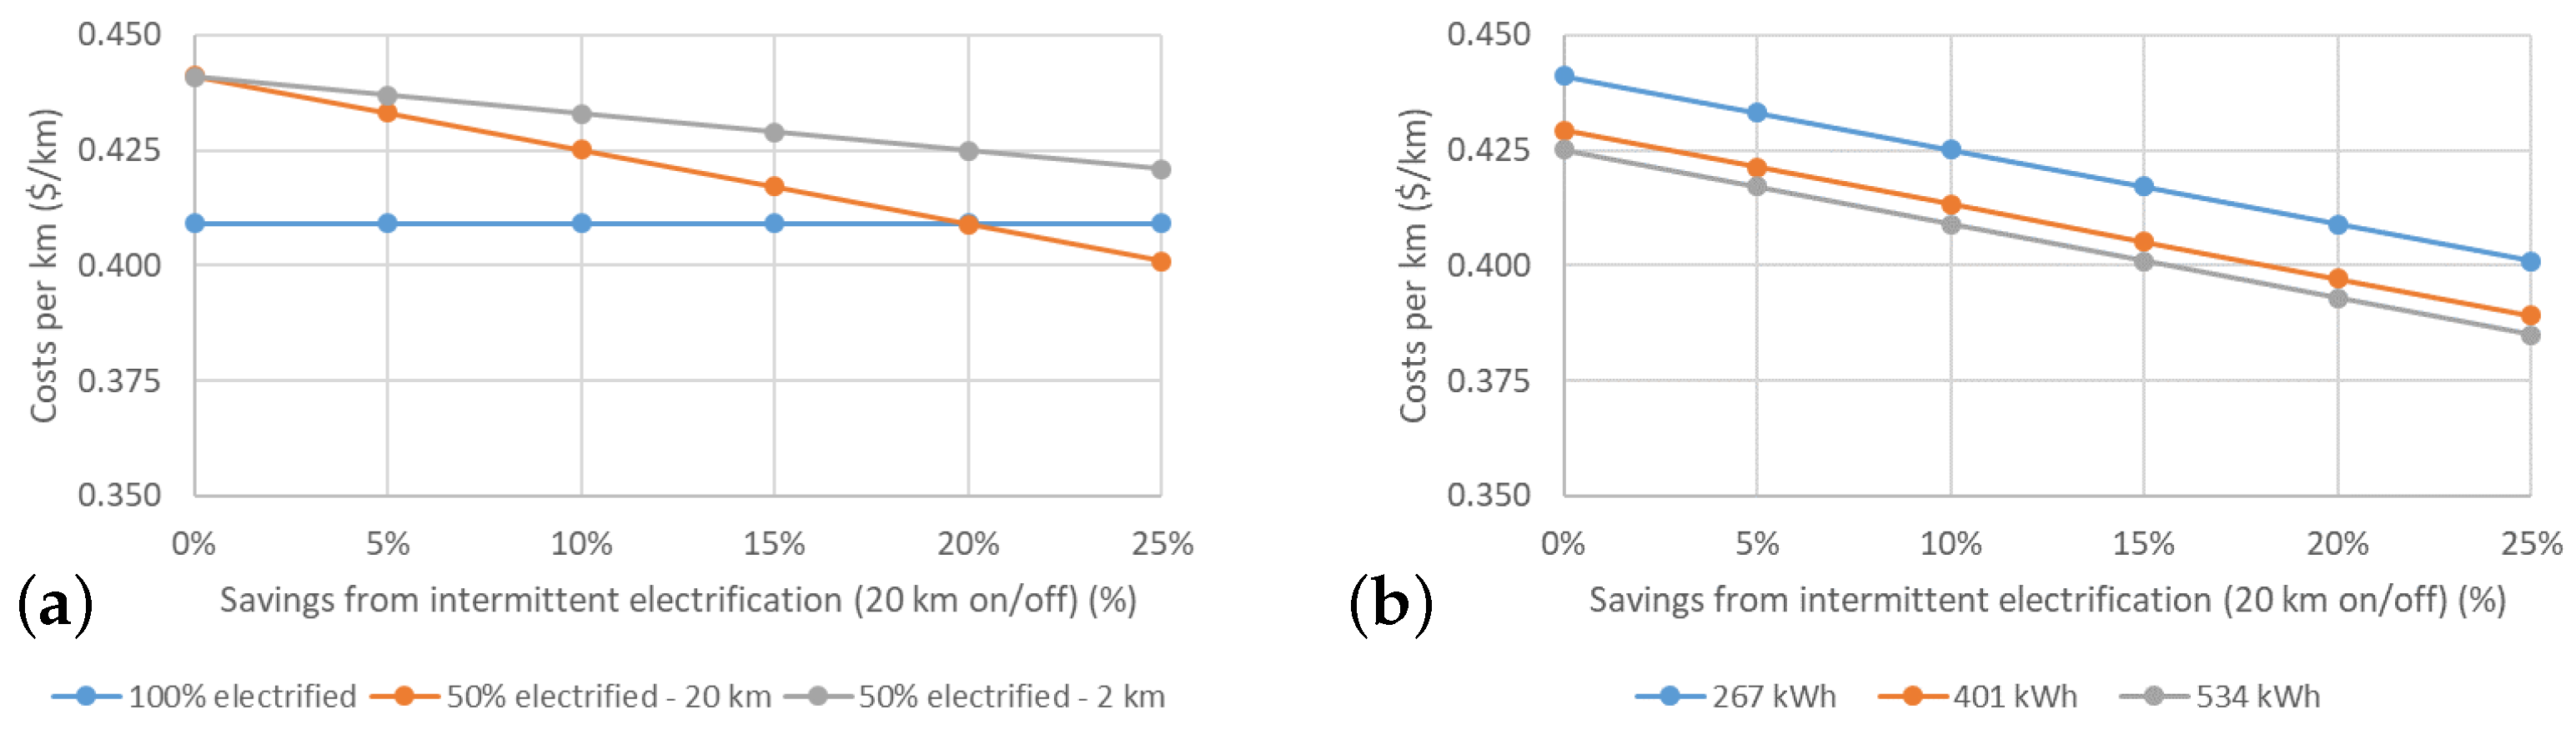
  • A 100% electrified highway (providing 200 kW at 85% uptake efficiency [10] to the truck)
  • A 50% electrified highway with alternating sections of 20 km that are electrified (at 400 kW) or non-electrified
  • A 50% electrified highway with alternating sections of 2 km that are electrified (at 400 kW) or non-electrified

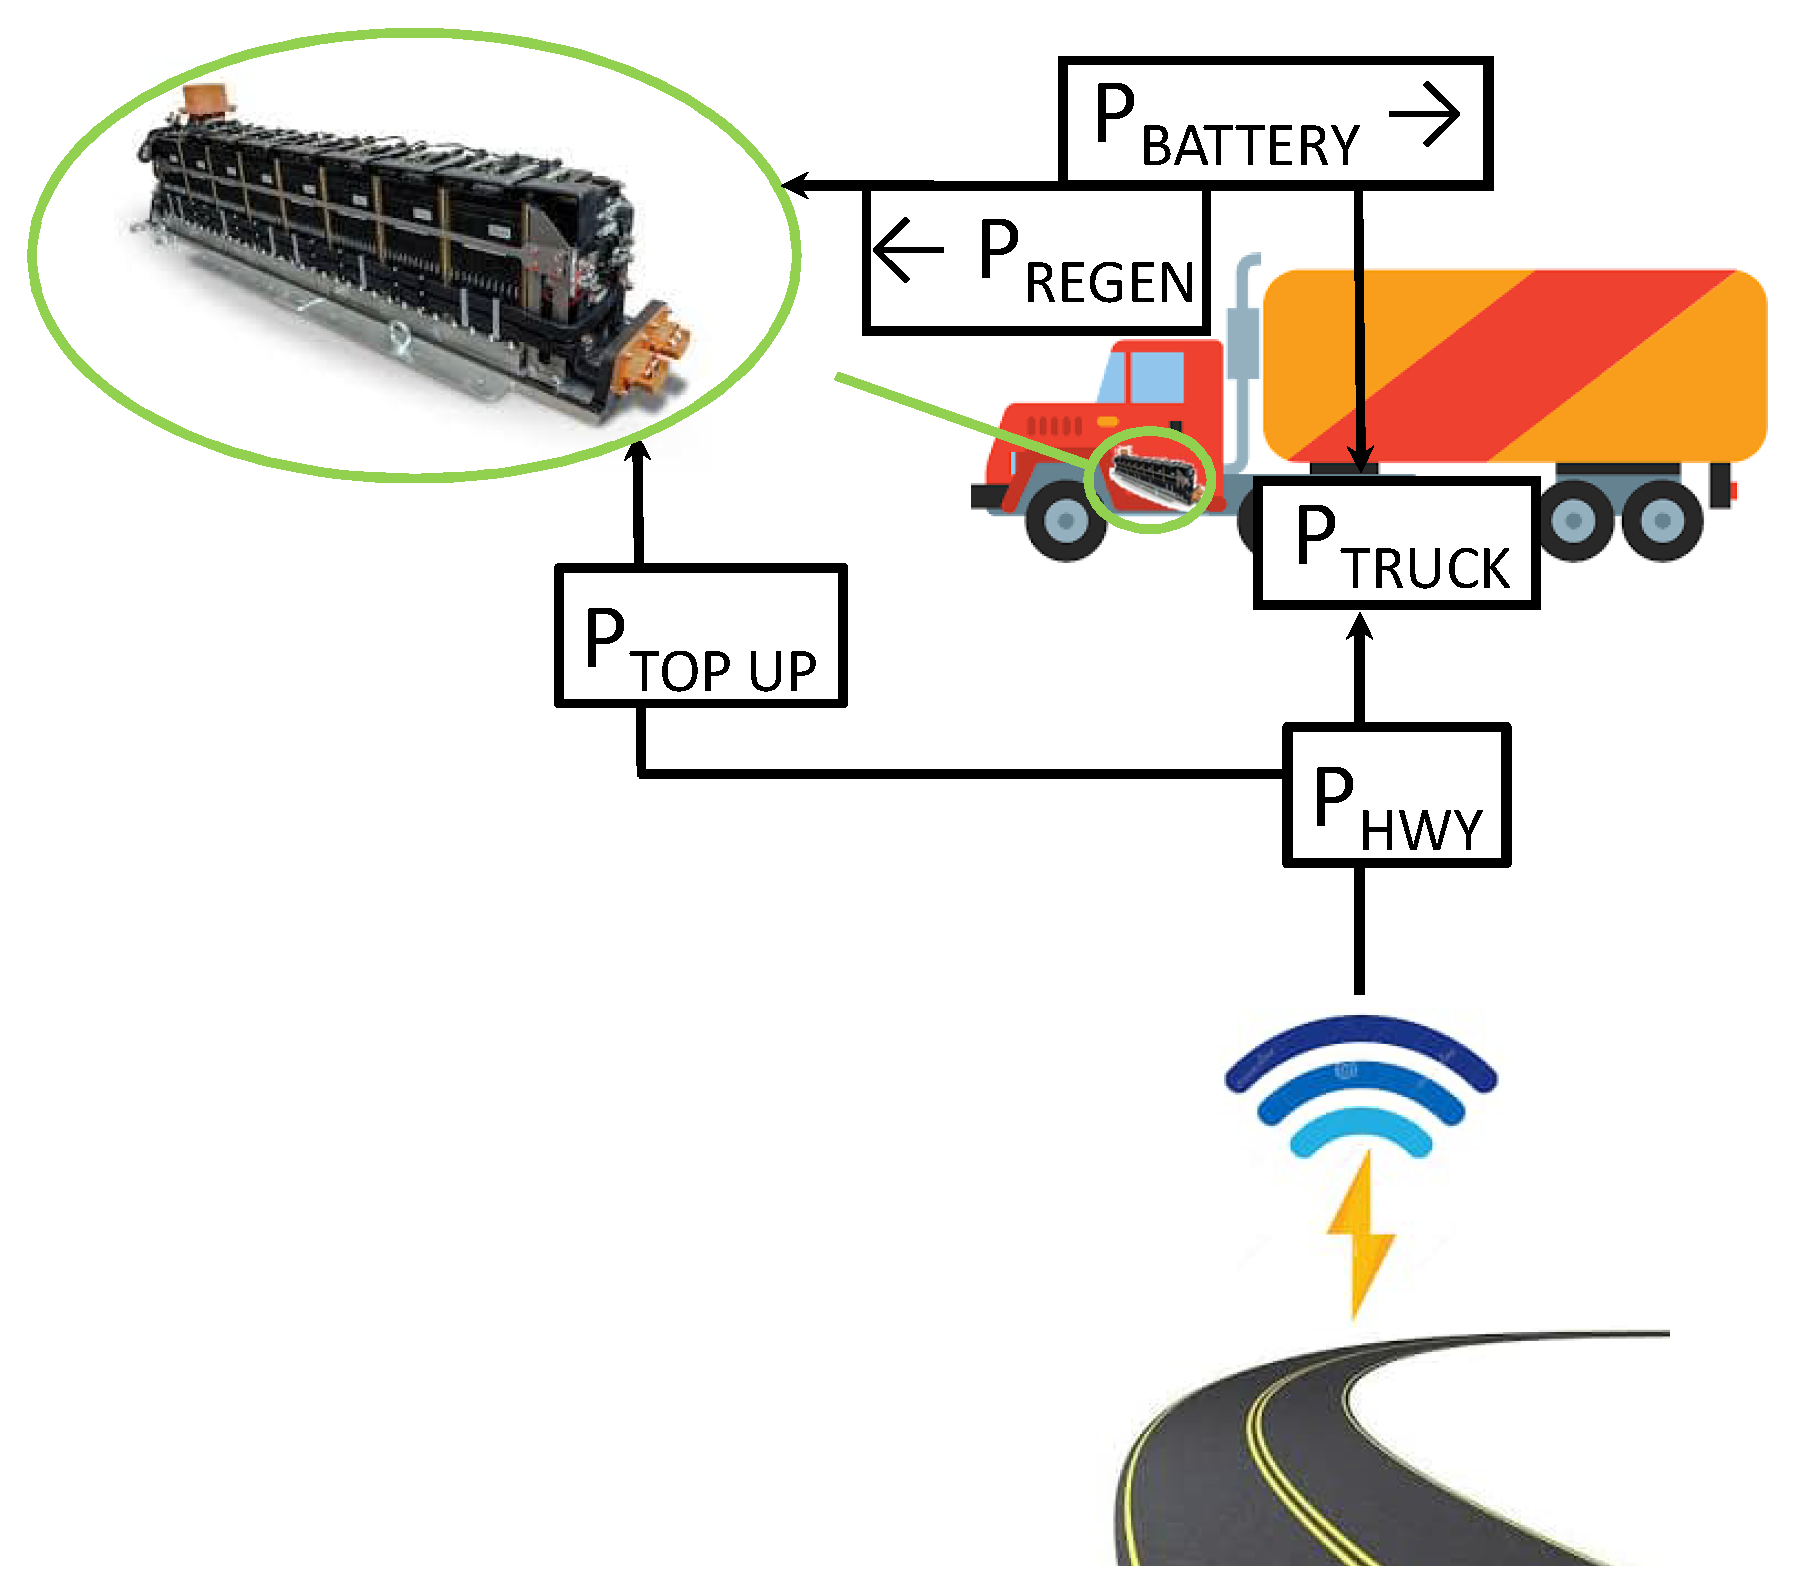
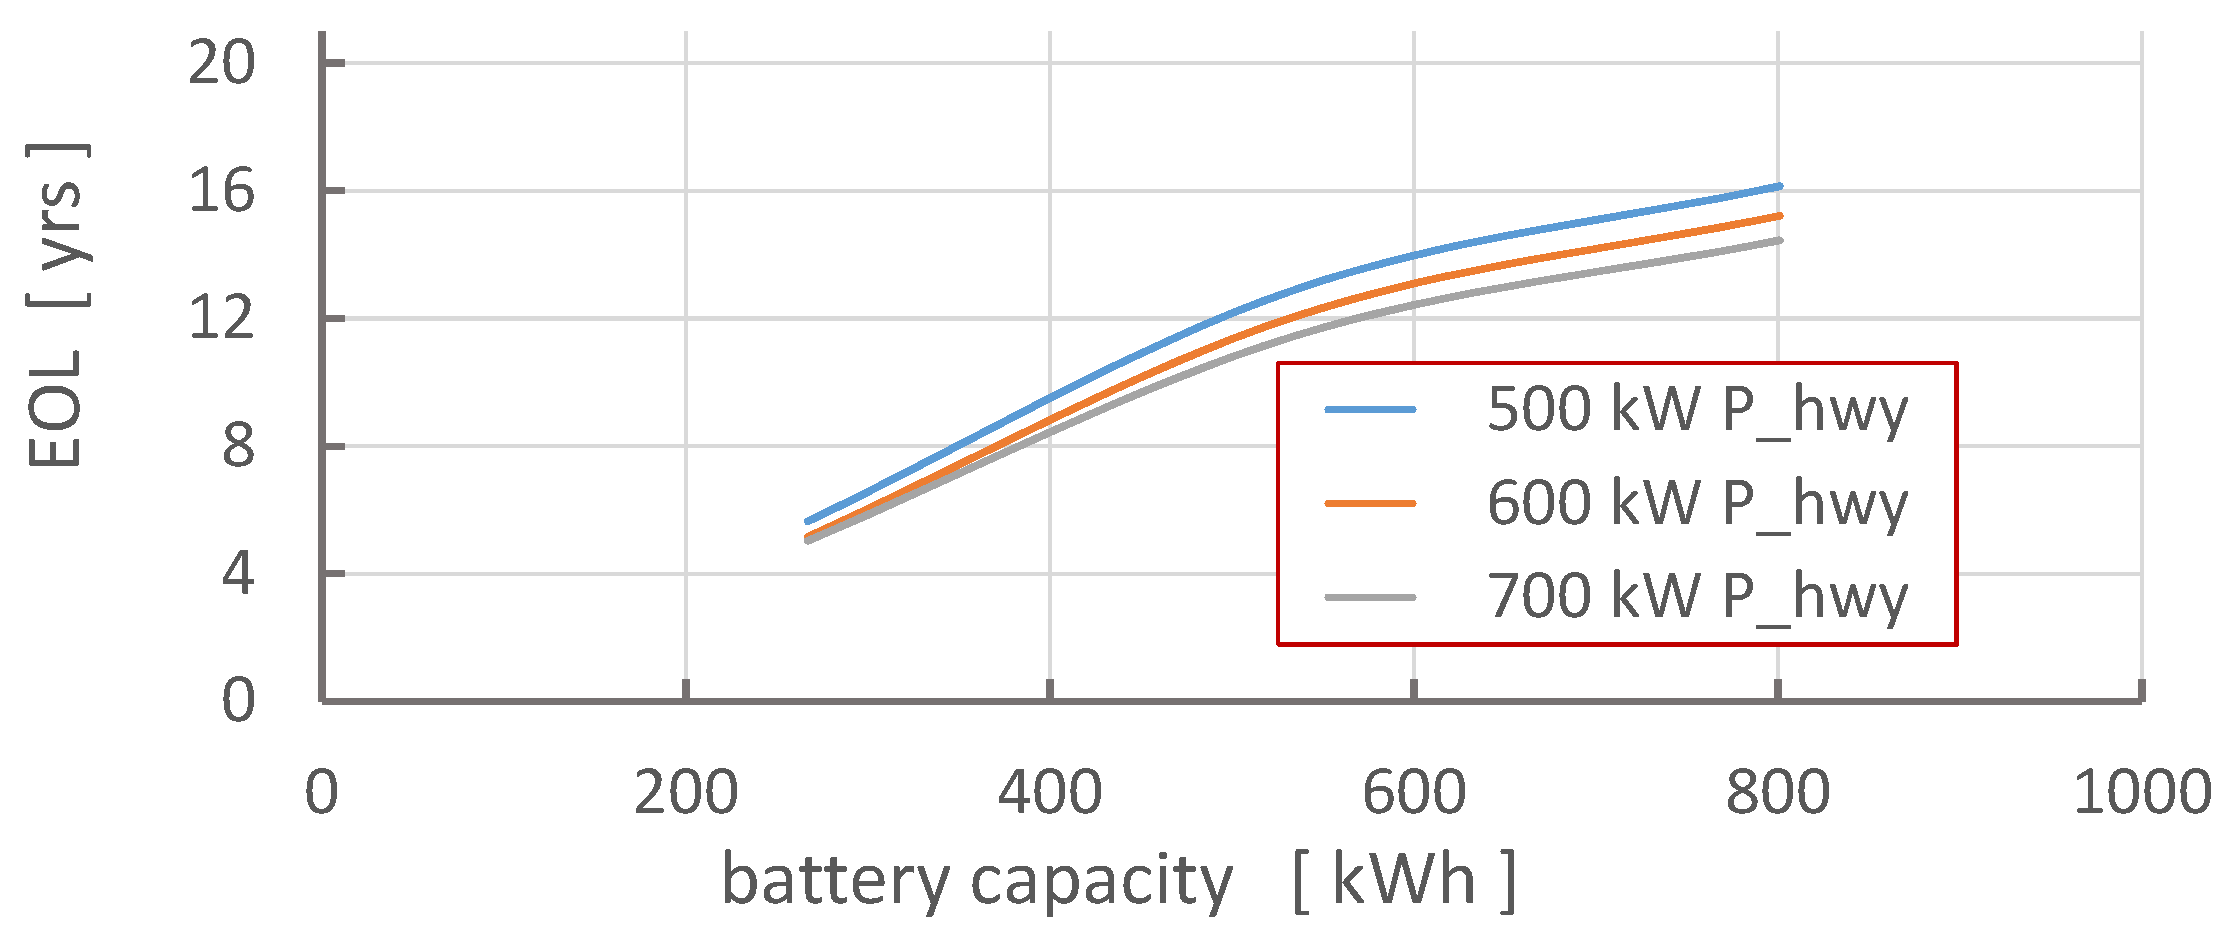
2.3. Electric Truck Battery Sizing

The reference basis for modeling an e-truck was the proposed Tesla Semi [11]. The Tesla Semi is specified to have a 947 kWh battery pack composed of 4860 format cylindrical cells with an anticipated 800 km driving range. As of now, there are no characterization data available for them in the technical literature. For the intended Toronto to Montreal transit of 540 km, it was desired to have a battery electric truck (BET) with sufficient driving range to be able complete the trip over its lifetime (i.e., with decreasing battery capacity down to 60% of the original capacity) without requiring mid-trip recharging. For now, the battery pack that was used in the 2016 Tesla Model S [12] was used as a base unit for building a BET pack. In the simulated BET, cell banks of 3.07 Ah cells were configured in a 74-parallel and 84-series arrangement. For our simulations, packs were simulated in quantities ranging from 4 banks up to 16 banks (267 to 1068 kWh) to power the BET. Battery capacities used in this study are summarized in Table 1 below. The 84-series specification was required for floor level 240 V operation.

3. Modeling Overview

A motivation for this project was to examine the concept of interrupted battery load demands through intermittent e-Hwy configurations to exploit temporal relaxation states that could enhance battery durability.

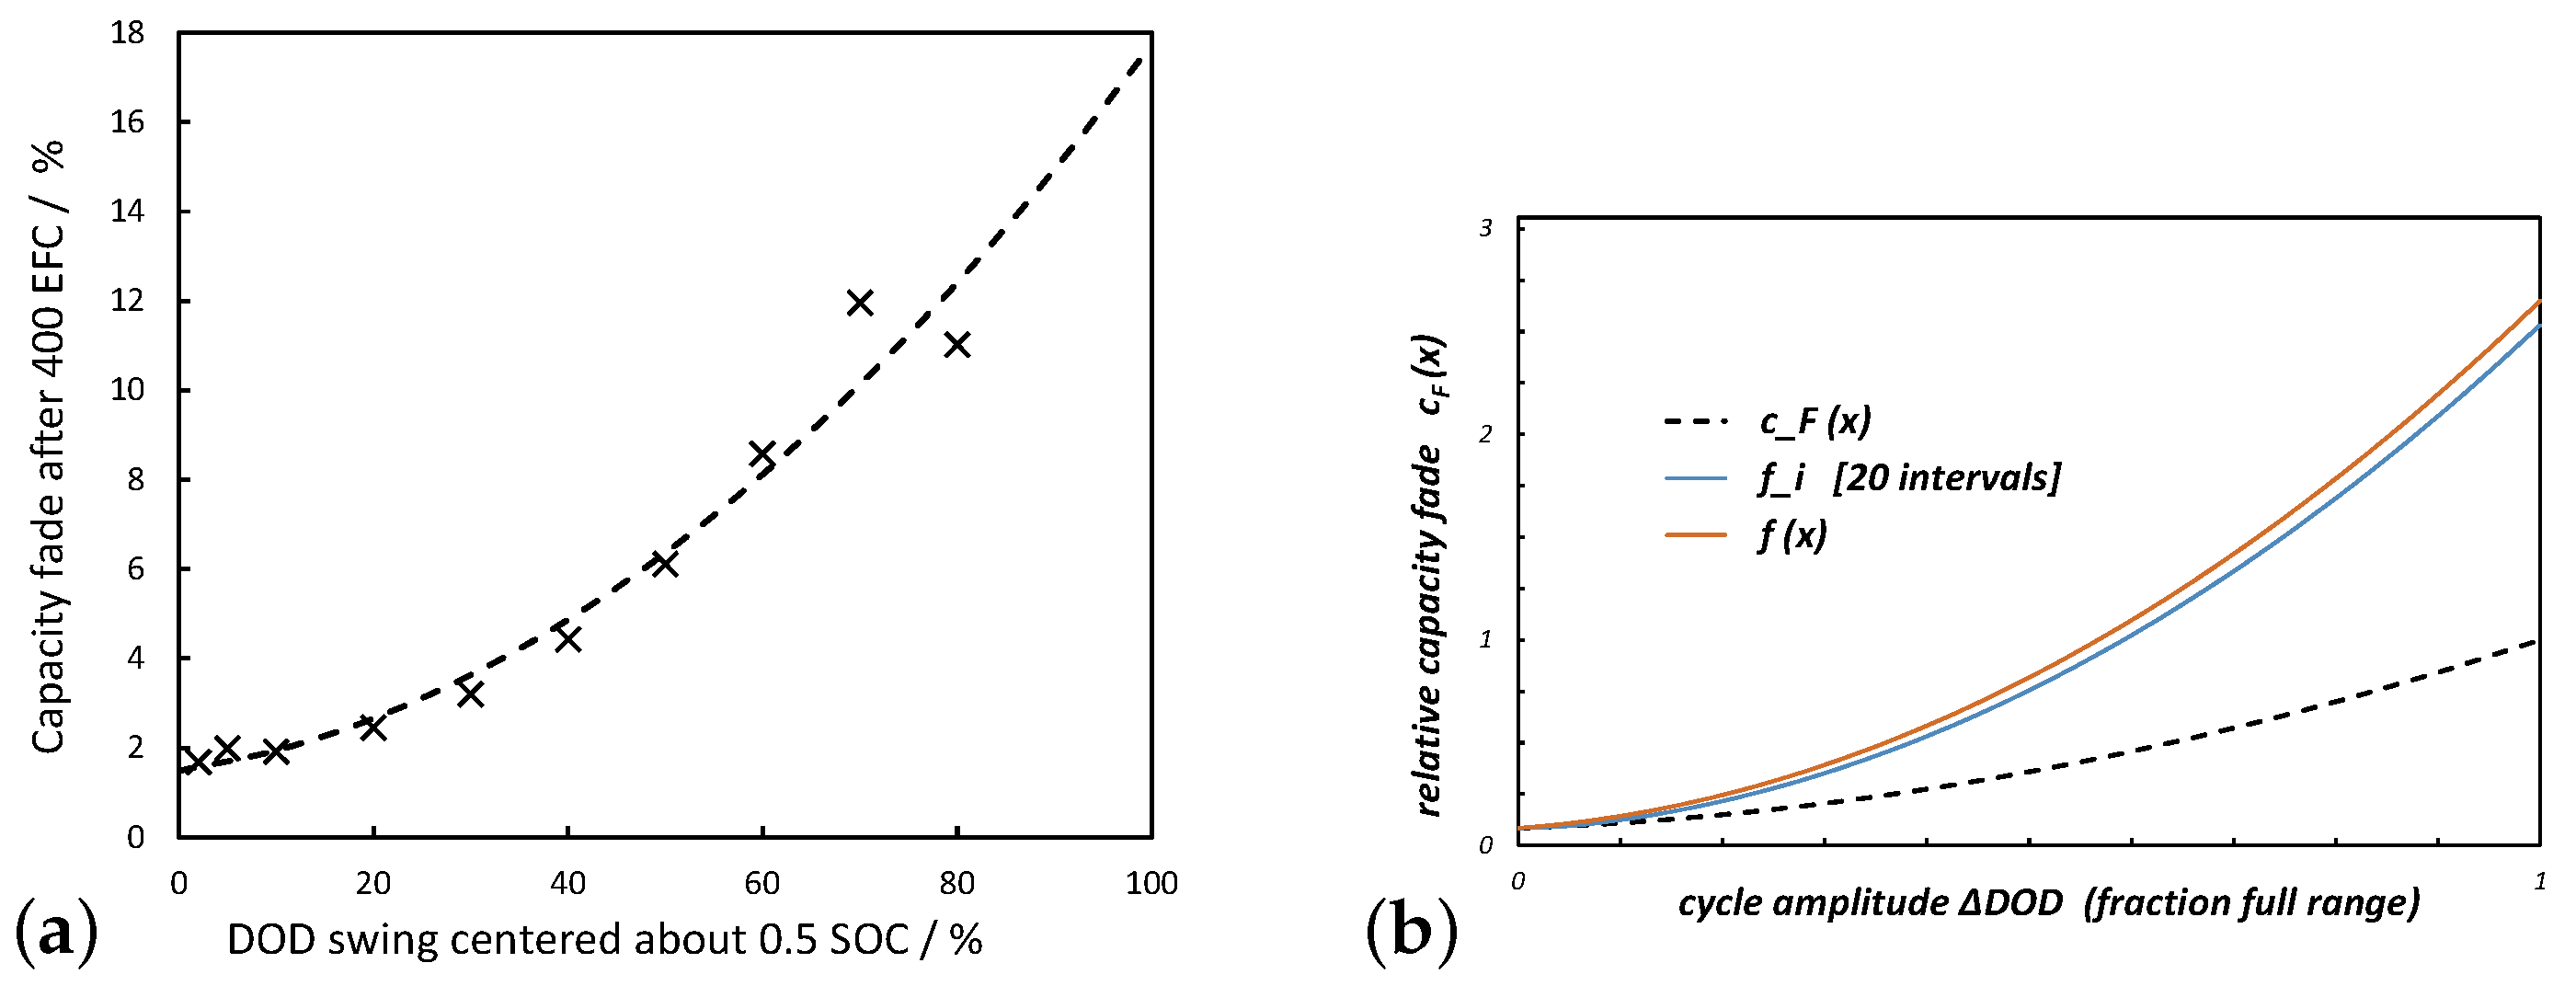
3.1. Primer on Battery Degradation

Use of a battery will gradually degrade its available energy capacity via low-rate irreversible chemical side reactions which proceed even when the battery is at rest. These reactions consume lithium ions, and fix them as resistance building deposits inside the electrode, thereby reducing the amount of charge that can be transferred during battery operation [13].
In general, factors which are understood to drive degradation are the level of applied current, the battery temperature and its instantaneous state of charge, and temporal effects related to its immediate history of charging, discharging or rest phases. Empirical expressions, such as Equation (1) developed in [13] can be applied in battery usage simulations over short time steps and can account for instantaneous degradation rates occurring under the state and operational conditions of the battery. Capacity loss or fade is normally expressed in A h, occurring at nano to micro-level quantities over a time step, and which accumulate to significant percentage levels over extended time periods.
cap fade = cap fade REF Δ t · F CUR [ I ( Δ t ) ] F DOD [ DOD ] F T [ T , I ] F DUR [ Δ DOD ]
In Equation (1), cap fade REF is a reference degradation rate determined from experiments and normally given in A·h/s, Δ t is the time step, I is the current, T is the temperature, DOD is the depth of discharge in the cell, Δ DOD is the extent of DOD swing in effect, and F i are factors applied to modify the degradation rate according to how the various inputs differ from the reference conditions. More complete details are provided in [13,14].
Conventional experimental cell testing methods were used to provide the data for the analyses given here. The experimental setup consisted of 18,650 cells placed inside a temperature controlled chamber and connected to independent channels on an Arbin BT2000 series battery test system. Each channel is both a potentiostat and galvanostat which provided both voltage and current control for all charging and discharging requirements. The temperature was controlled to within ±0.1 °C of the desired set point with a thermal control unit described and illustrated in [15].

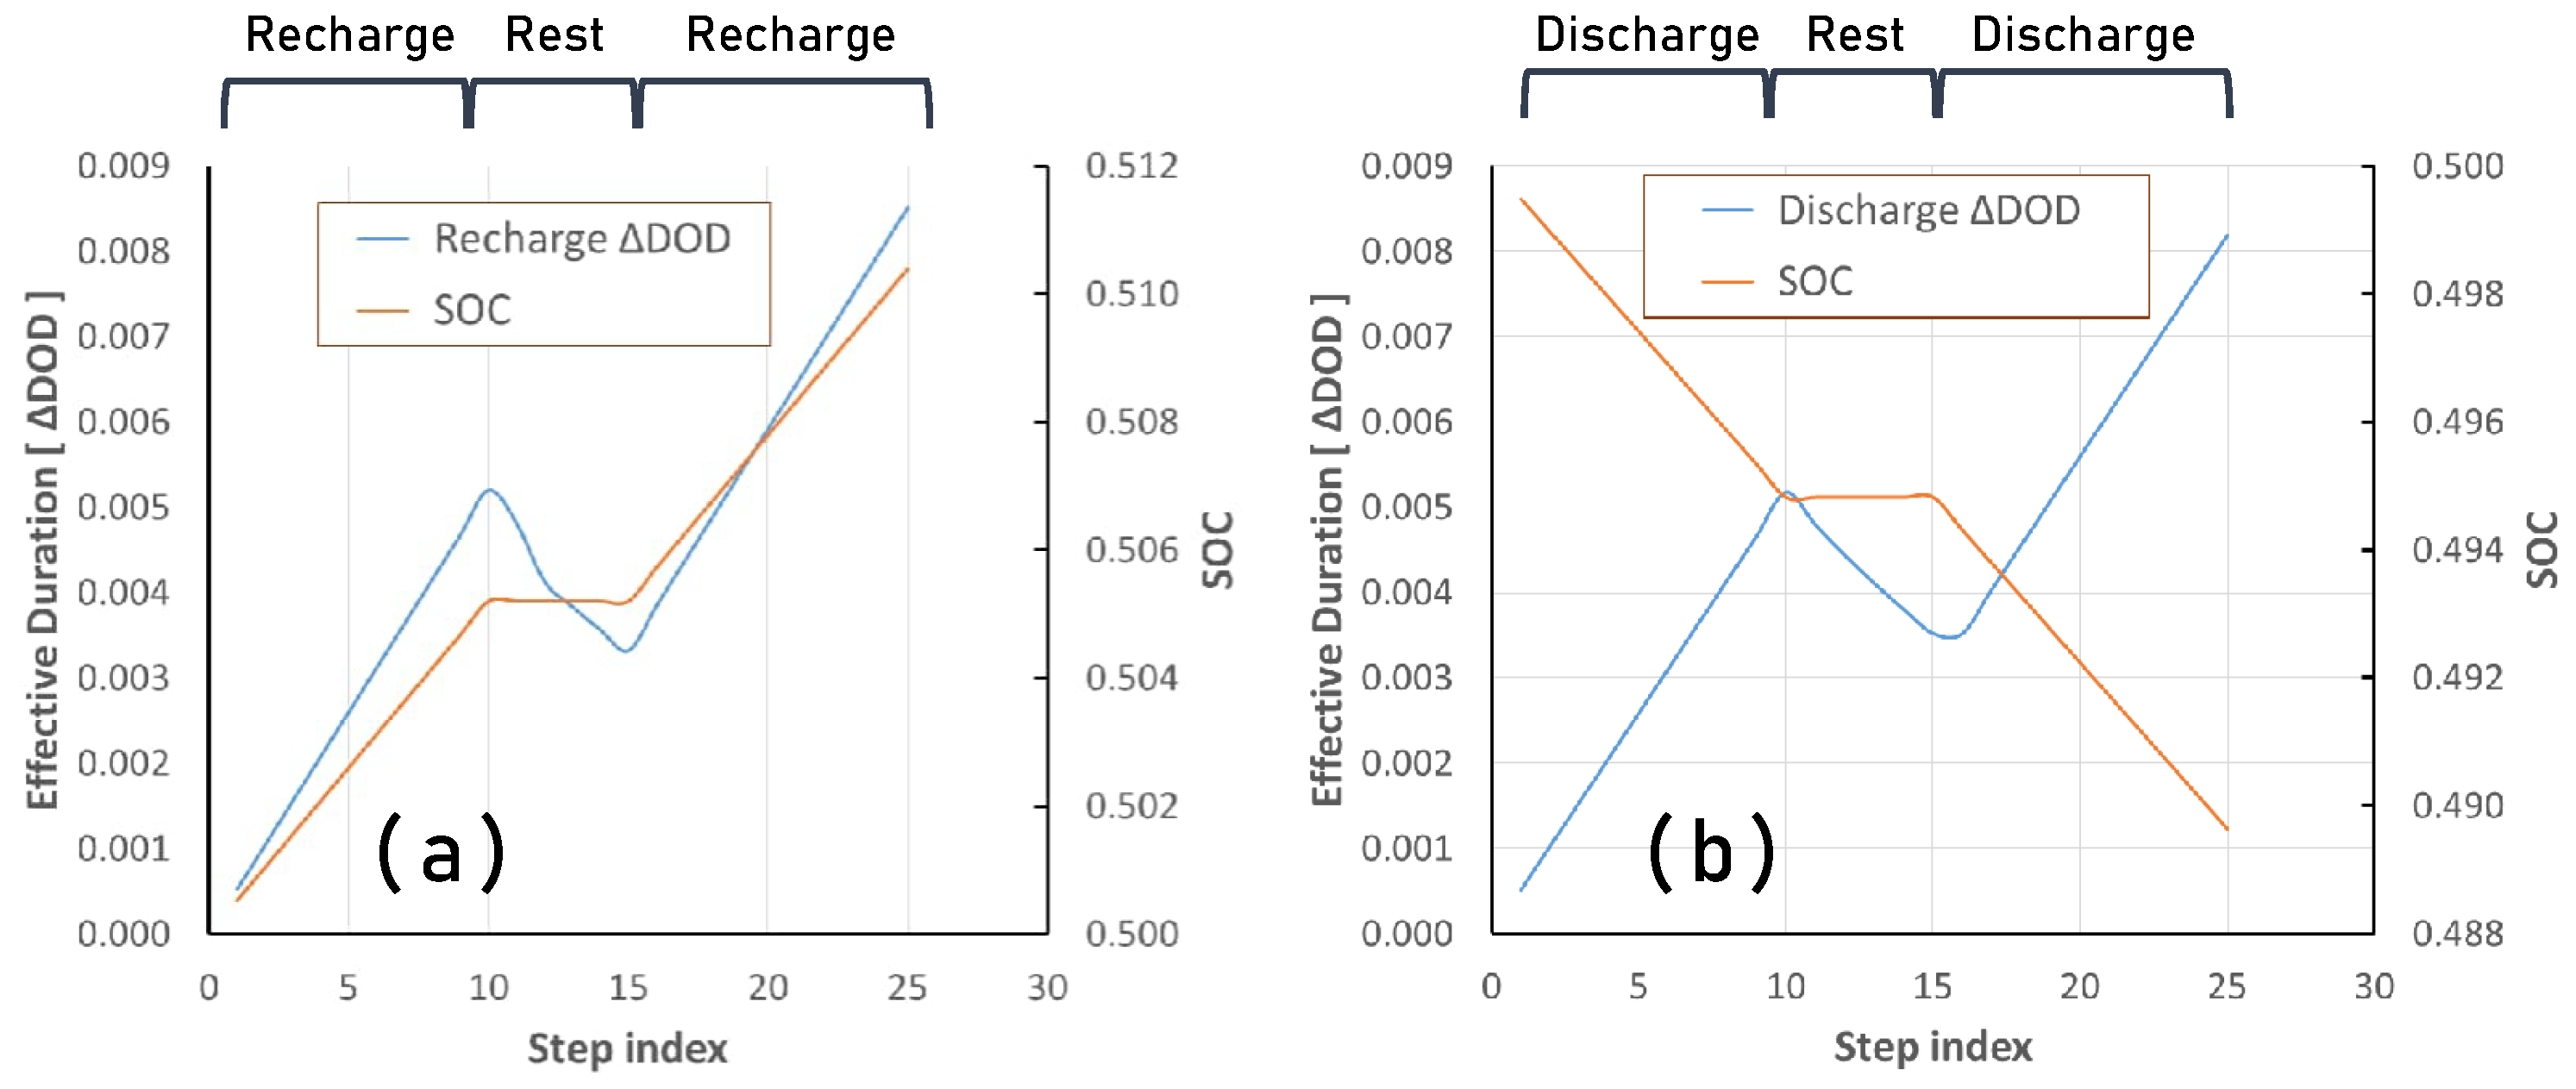
3.2. Mode Switching Effects

A mode switch can be defined here as an instantaneous change from an operational state of discharging, recharging or rest, to a different operational state. Details of the derivation of the duration effect on battery degradation are given in [13]. One additional situation relevant to the present study is discussed below.
Two basic cases are presented here to illustrate the tracking of the Δ DOD argument for duration factor ( F DUR [ Δ DOD ] ) on degradation for situations where an operation in progress experiences a brief rest or zero current period before resuming. The underlying concept is that an uninterrupted continuing charge or discharge operation can build up an excess lithium ion concentration in the electrodes which was shown to be a driver for degradation [14]. Punctuating such operations with rest periods allows this excess concentration to dissipate over time, such that the degradation driver associated with the just ceased battery operation is still present, although subsiding.
The first case (a) in Figure 2 shows the effective duration of a recharge operation in terms of the absolute value of the degree of discharge ( Δ DOD), along with rest phase relaxation rates applied according to details given in [13]. On the horizontal axis, the step index is simply a time step count.
The duration continues up until a rest period begins. The duration level attained at the start of the rest decays according to the time elapsed during the rest period. The steps along the horizontal axis represent 10 s intervals. Here, after a 50 s rest, the decay is only partial, and the lithium profiles in the anode which drive the degradation still show some excess concentration. Thus, when the recharge operation resumes, the duration effect built up previously is not entirely erased, but restarts from a reduced value arrived at via decay over the rest period. For longer rest periods the Δ DOD would decay down to zero and produce a temporal factor which reflects rest state degradation also known as calendar fade.
Figure 2b shows a parallel situation but for a discharge operation with a rest period followed by continuing discharge. In this case, the rest period which follows discharge drops the excess concentration driving degradation to a lower level, and it begins rebuilding at the same rate once the current is restored.
In both plots in Figure 2 the cell state of charge (SOC) is plotted along the same horizontal axis as the operation duration, its value is indicated on the right side vertical axis. The SOC curve is shown as an aid for following the cell operation over the steps; it drops during discharge, stays constant during rests and increases during recharge.

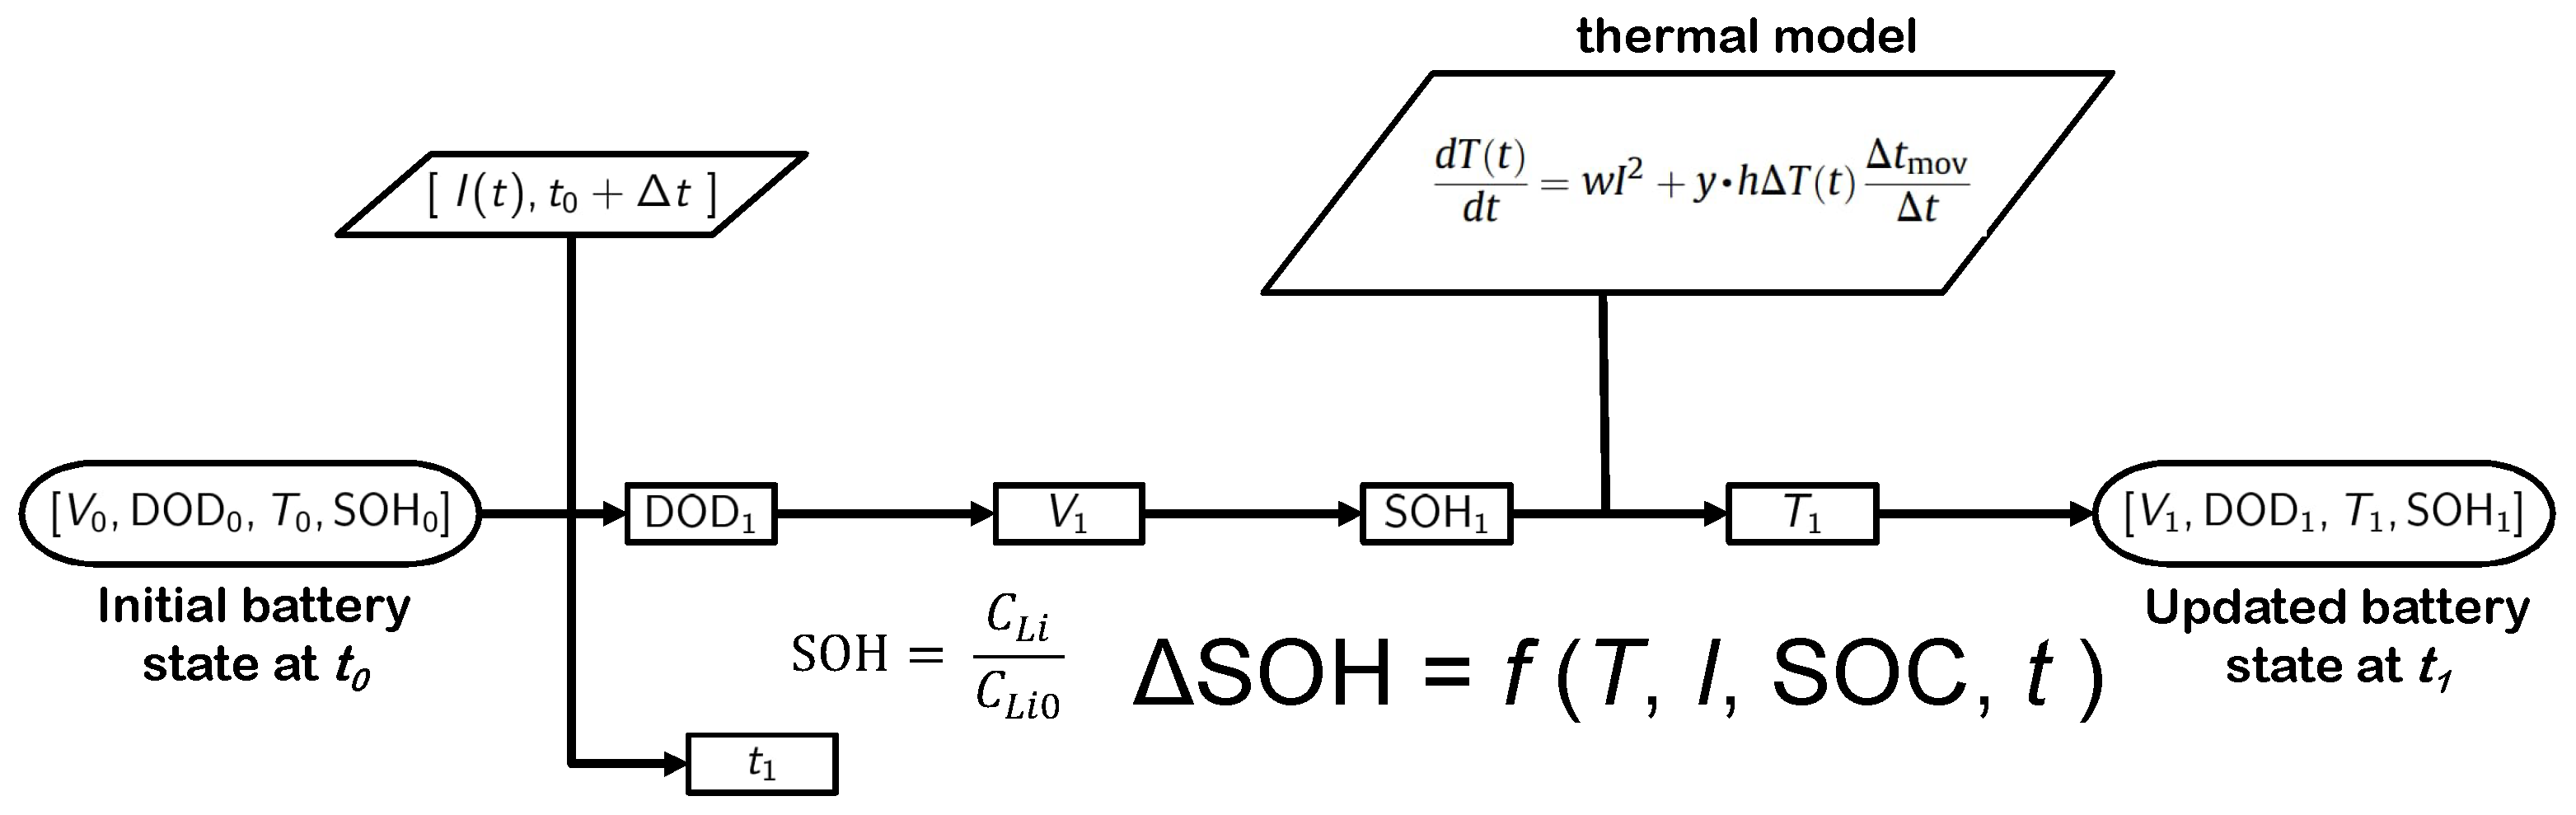
3.3. Battery Life Model

BET power loads were determined by applying driving conditions to an expression from [10] given below.
P truck = ( μ f + sin α ) M g η eq + C d A v ( t ) 3 ρ 2 η eq + δ M a ( t ) v ( t ) η eq = η eff · I V
The terms in Equation (2) account for rolling resistance, elevation change, form drag and acceleration effects. The current demand for the battery can then be determined by the equivalence of P truck to η eff · I V , where η eff is the electric motor efficiency and I would be the current required from a battery at potential V. The power requirement P truck is a duty load which reflects the driving and highway features, and was a common input for all the various simulation cases.
The simulation runs also employed some basic control logic, akin to the battery management system (BMS) found in an electric vehicle. In this case, the cell voltage range was restricted between 4.05 and 2.9 V. For the base reference case, the battery pack was fully charged to begin each driving trip. The power flow dynamics inside the BET are depicted in the schematic diagram, Figure 3, below.
The BET power demand P truck is served by power provided by the e-Hwy P hwy and supplemented by P battery if required. If P hwy was in excess of P truck , the excess power available was provided to the battery pack if the DOD (Depth of Discharge) was greater than 0.50 and referred to as P top up . During some descents, regenerative braking power could be produced, and was supplied to the battery pack, referred to as P regen . The BET power model was then linked to an equivalent circuit model for battery operation [12]. Thermal states were tracked using an empirical transient model for the battery packs which accounted for ambient temperatures and battery function [16]. Battery electrochemical and thermal states then were applied to a capacity loss model to track cell State of Health (SOH) including intermittent effects [17]. Batteries were assumed to have reached their end of life when their SOH was reduced to 60%.
The tracking of the electrochemical state of the battery in simulation relies on an equivalent resistance type (Gao) model [18]. The model is expressed by Equation (3), which provides a means of updating the DOD given a specified battery state and load. The parameters α and β in the model pertain to the particular battery cell being simulated and are determined from data in discharge curves [17].
d DOD d t = I ( t ) α β CAP REF
The resulting voltage during discharging can be determined by:
V ( t , D O D , I ( t ) ) = O C V ( D O D ) I ( t ) R i n t ( D O D )
where I ( t ) is the current (amperes) and R i n t is the internal resistance (ohms). The Gao model is computationally efficient, and detailed one second time step multi-year EV simulations can be run in less than one hour.
Figure 4 gives a flow sheet depiction of the simulation model basis.
For EV lifetime determinations, tracking of the capacity loss is critical. This was done in the simulations on a one second time step basis, using Equation (1) which accounts for instantaneous effects contributing to lithium loss based on the type of cell used, the cell DOD value, the current level and temporal effects. The temporal effects are represented with a factor F DUR [ Δ DOD , t ] , which is determined according to the duration of the current mode of operation (discharge, recharge or rest) and residual effects from previous operational models.
This present study is the first to incorporate a model where operational duration effects and mode switching effects have been considered in capacity loss determinations [14]. Briefly, it was found that the capacity loss varied significantly as a function of cycle amplitude for tests conducted at the same current level and for the same length of time. Analysis in [13] was able to determine an instantaneous degradation driver for indeterminate operational lengths by finding values that applied over the interval produced the average value corresponding to the measured degradation from the variable amplitude experiments. Figure 5 shows these experimental results and the analytical advance. The instantaneous degradation factor is relevant for situations such as driving on a highway with elevation changes or intermittent DWPT power provision which will produce abrupt changes in current direction in the battery or allow rest periods for the battery. During rests electrolyte phase lithium levels which drive degradation and are established during steady operation will relax and decrease the degradation rates. A partition function for the relative contributions of the discharge and recharge phases of current flow was also determined in [13] and is used in these e-Hwy scenarios for BETs.

3.4. Economic Model

An economic model was developed to calculate the aggregated costs per kilometer driven for battery use, electricity consumption and capital costs for the charging infrastructure. It takes a break-even perspective on the operation of the charging infrastructure, and a wide range of possible investment cost values were evaluated for both megawatt charging and e-Hwys, as accurate cost numbers are presently uncertain for these technologies that are still under development. The economic model adapted a similar approach detailed by the authors in [19]. In our study, the capital costs included all the costs for the chargers and their installation or for the e-Hwy (coils, electronic cabinets, installation), though it did not consider the cost of grid upgrades. For the recharging equipment, an installed megawatt charger was priced at $1.5M. The e-Hwy infrastructure for the 534 km route was priced at $1.0M per km at 200 kW power and $1.9M per km at 400 kW power. All costs reported here are in US dollars.

4. Results

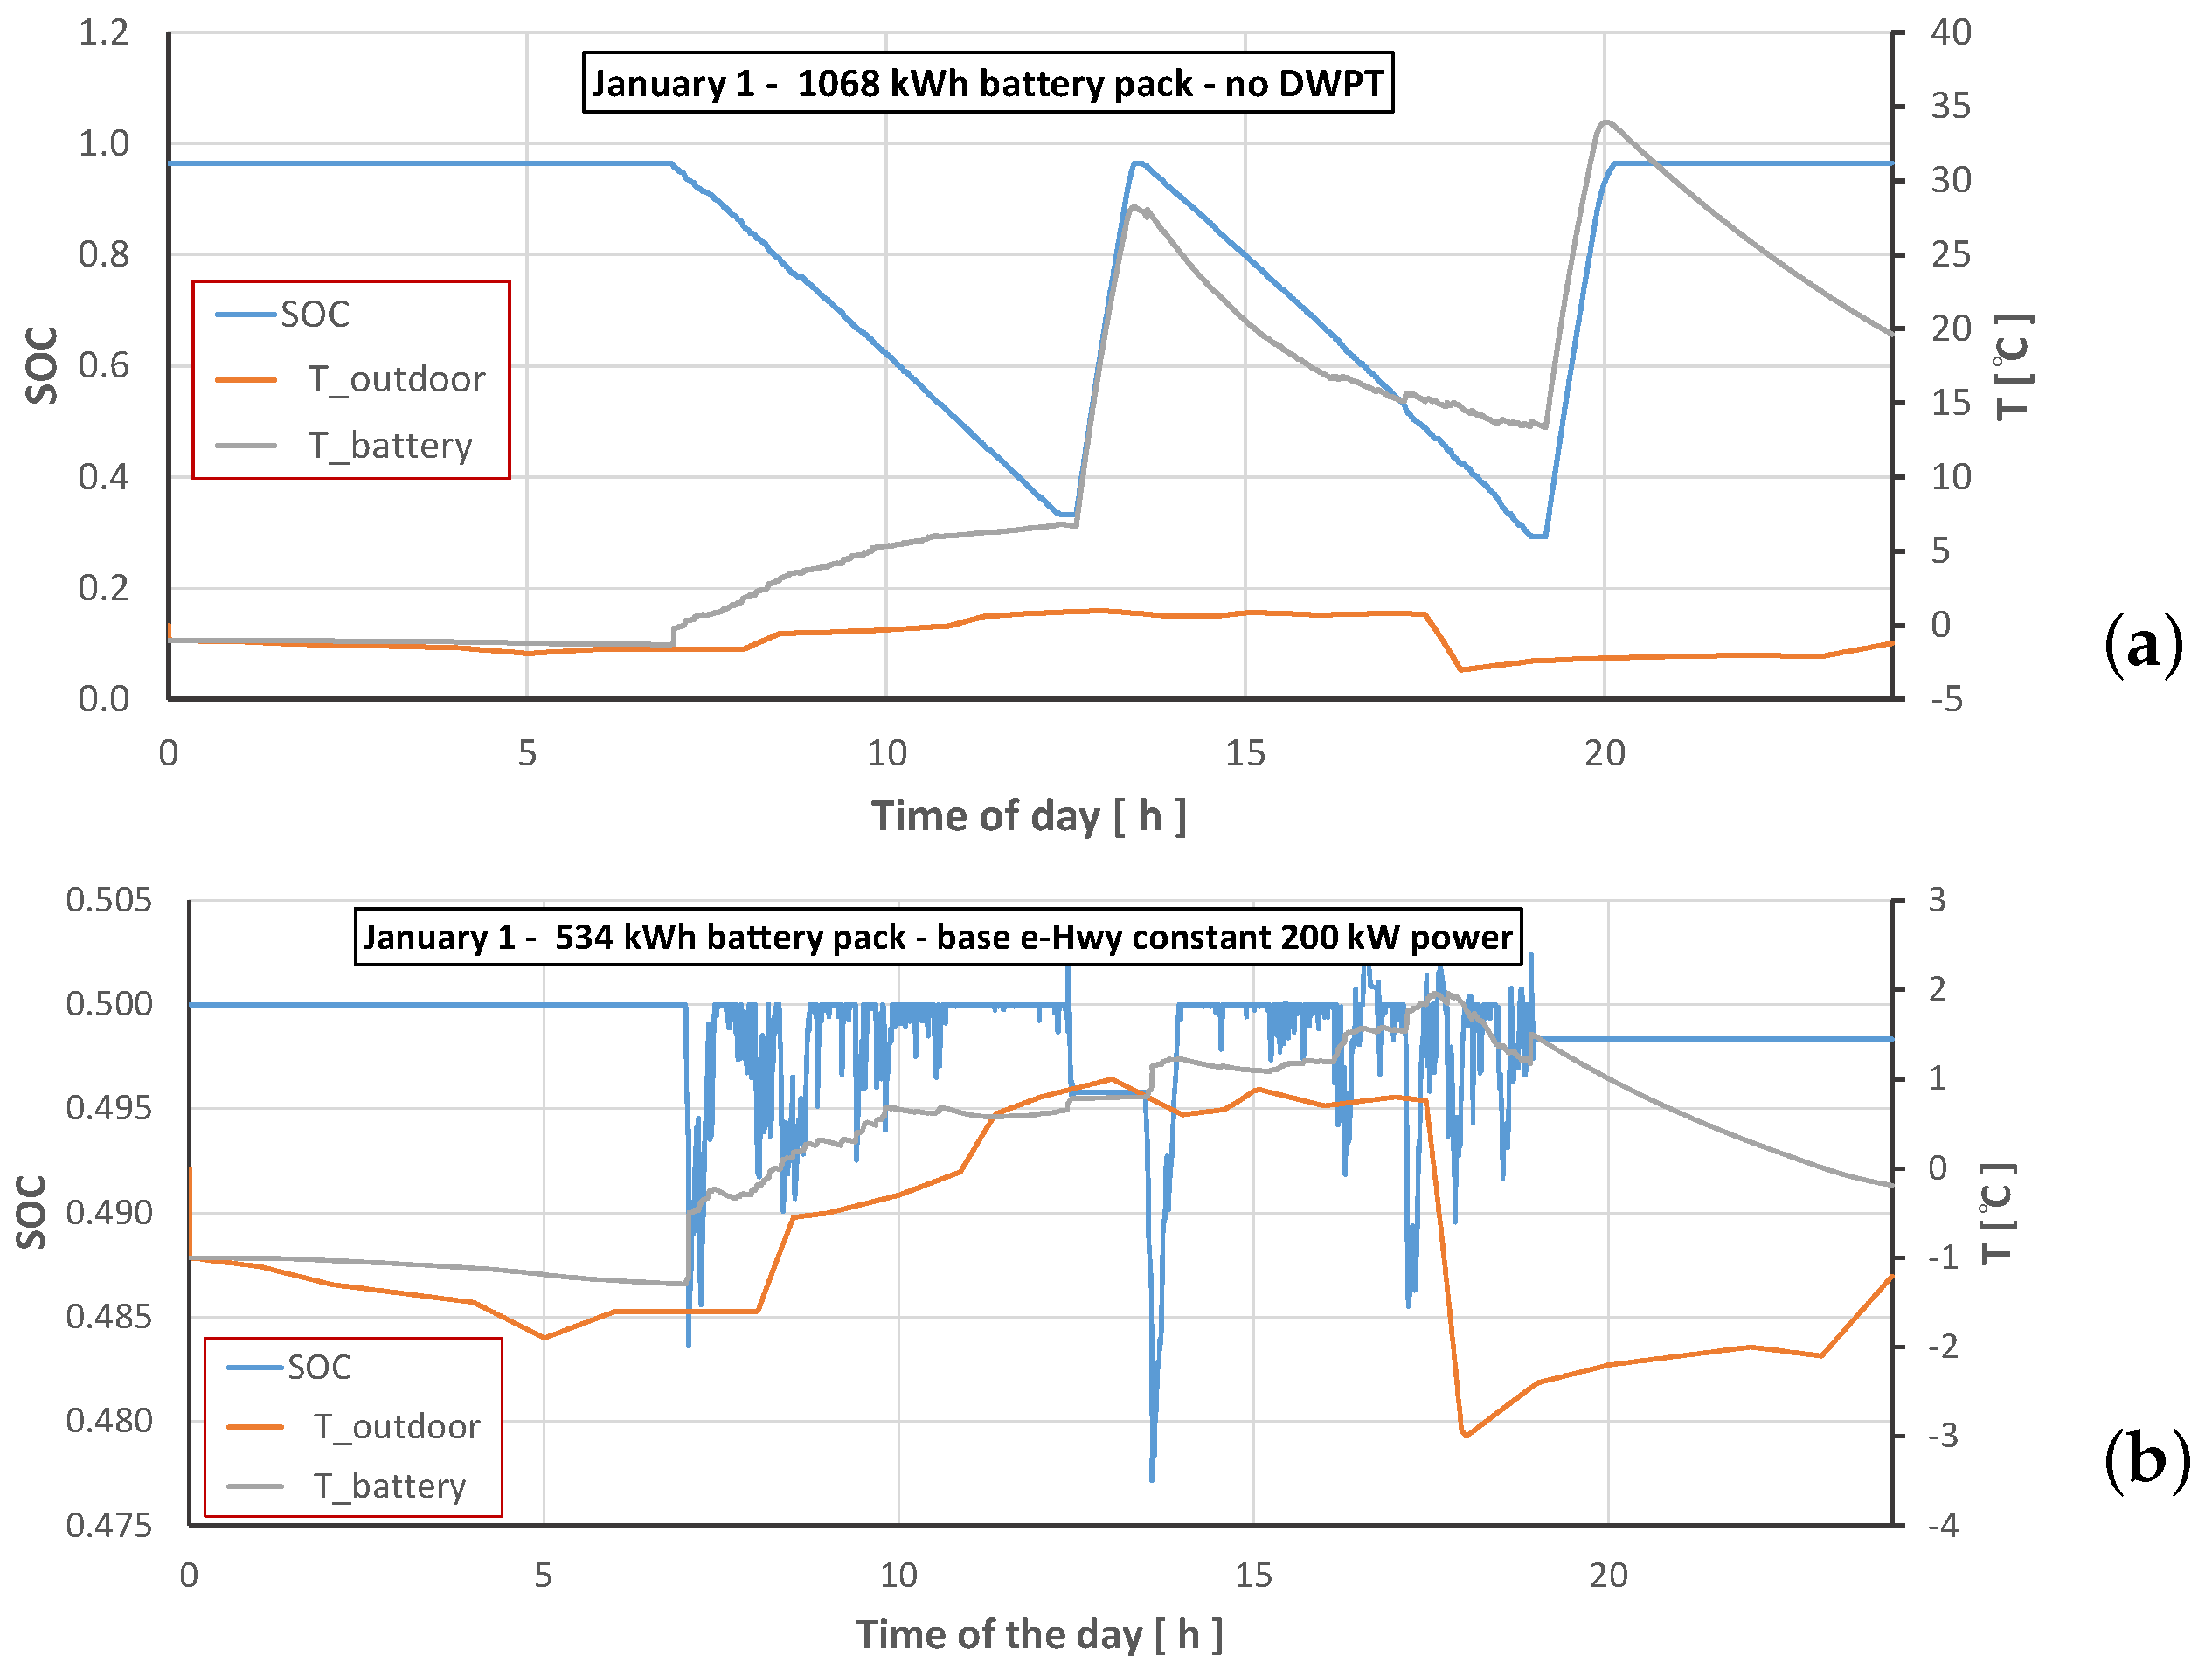
4.1. Daily Operation and Battery Life

Possible BET scenarios with DWPT are extensive and the cases considered here aim at first understanding the interplay among important input parameters in order to identify suitable operational conditions. Continuous and intermittent highway electrification were compared to investigate whether a modality of power provision analogous to pulsing could benefit battery performance and durability. The power flow logic employed here prioritized direct DWPT to the electric motor, and any additional available energy could recharge the battery when the state of charge was below 50%, while regenerative braking supplied recharge energy whenever it occurred. When BET power demands exceeded the 200 or 400 kW provision from the e-Hwy, the battery discharged the balance of the demand. With longer intermittency distances, the power flow occurred in longer and deeper cycling patterns. A reference case was simulated with a BET without DWPT and using post-trip 1 megawatt level recharging. For thermal control, the battery was not allowed to drop below −10 °C when operating. The energy required for this was not tracked, but based on [17], an estimate for heating energy would represent an overall additional 0.08%, considered negligible for this preliminary study.

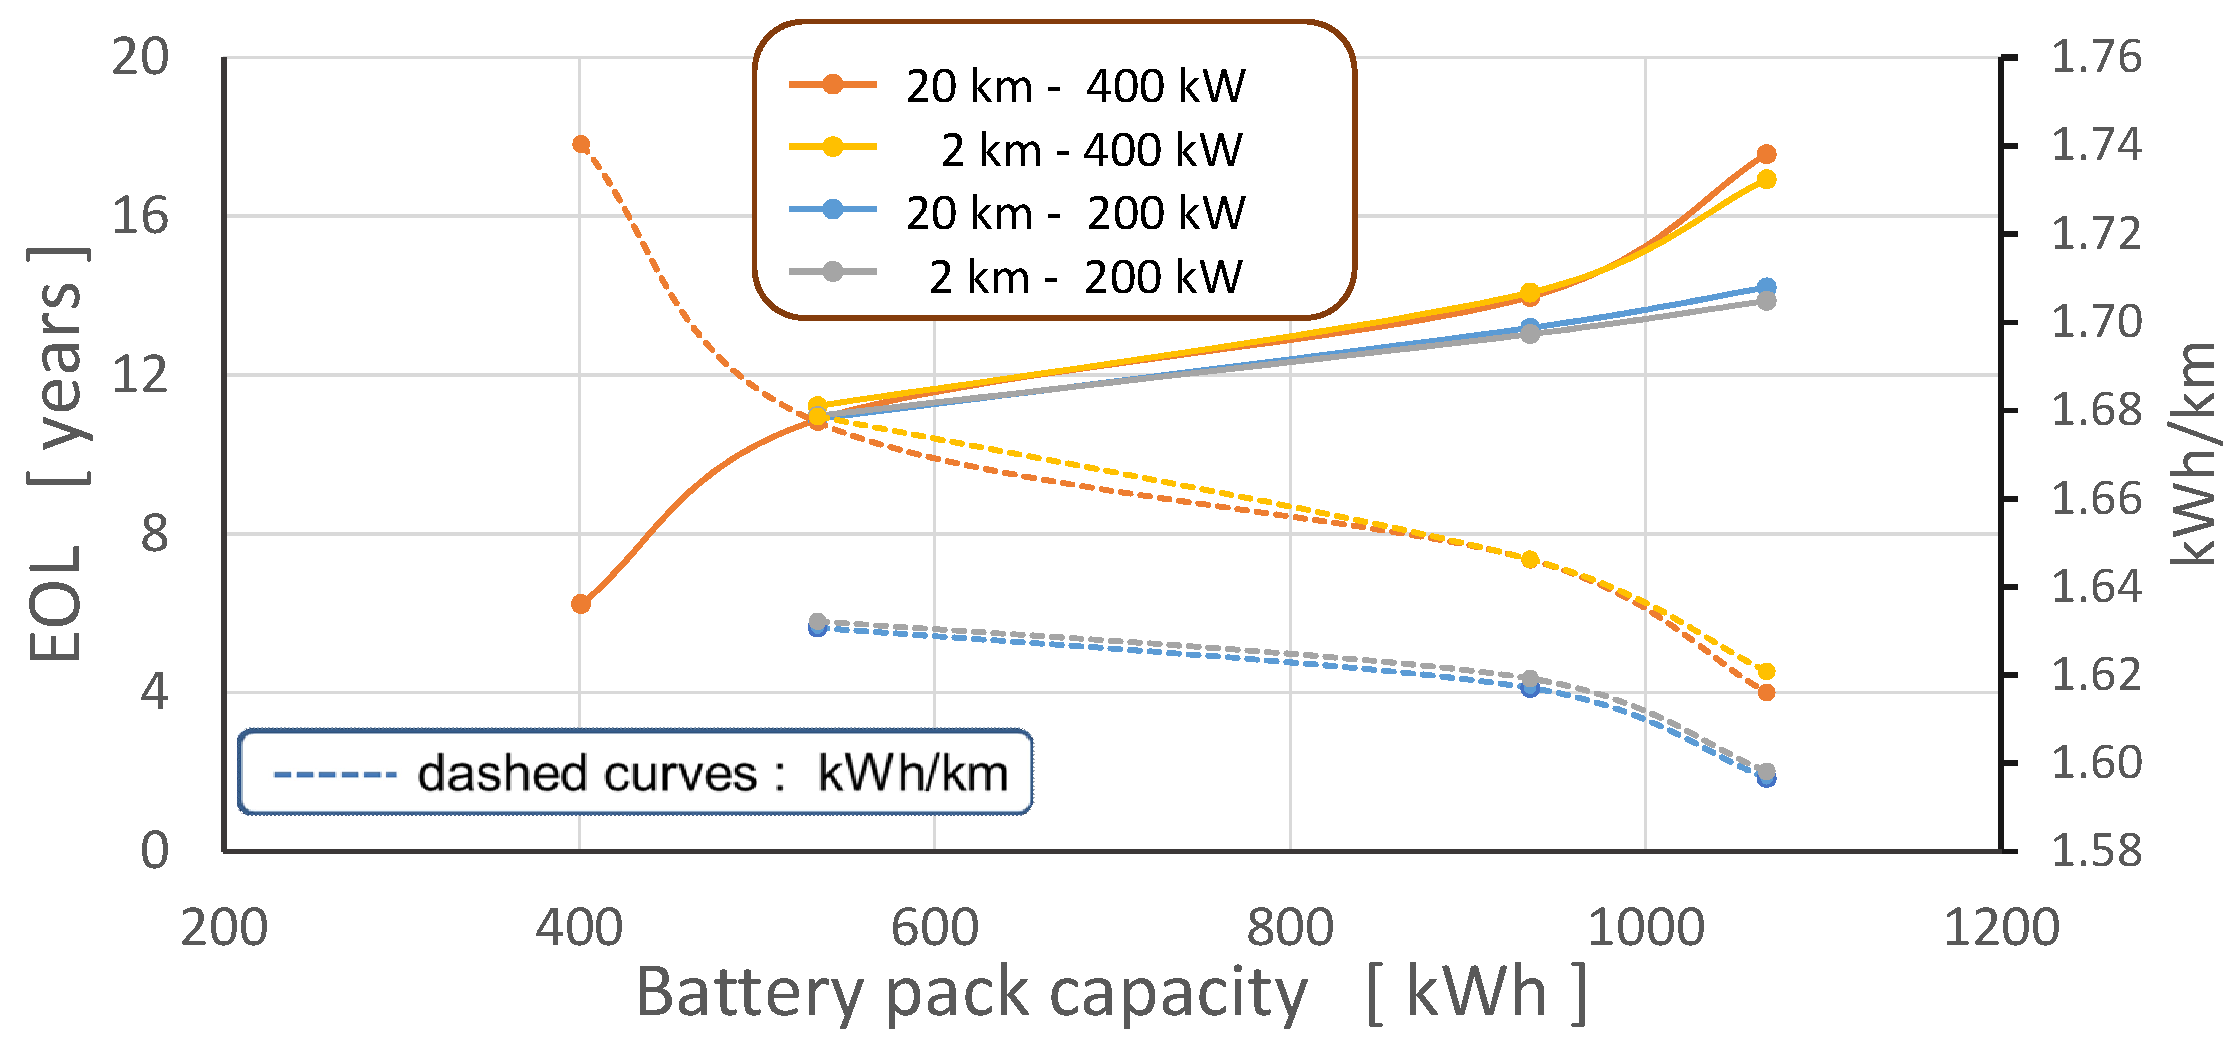
4.2. Reference and Base e-Hwy Cases

To illustrate the what happens concretely over the course of one day in the simulations, two example cases of driving are shown in Figure 6, both simulated over 24 h on 1 January, reflected in the outdoor temperatures shown. Things to note from Figure 6 are that for the no-DWPT base case, the battery SOC goes from a near fully charged state down to about 0.35 over the 540 km trip and then undergoes a complete recharge. These operations cause significant heating in the battery as well. For the case with e-Hwy power provision, the battery pack SOC varied only in a 3% range and ended the day at essentially the same level as it began. Note that for e-Hwy cases, the initial DOD set was 0.50, chosen so that the DOD would rarely move more than 0.10 units away from its intial set point. Battery degradation rates as a function of DOD are at their miniumum near DOD = 0.50. Thus, with e-Hwy power, no recharge operations were required, which absolved the battery pack of exposure to sustained high currents and significant temperature rises. For the electrified highway case, the significantly lower amount of power transfer to and from the battery also results in far smaller temperature swings.
It can be seen in Table 1 that the roughly 8.5 year lifetime determined for the reference case of BETs using megawatt charging, moved to values greater than 15 years for BETs using electrified highways, even for the 4 bank pack, and increased to over 20 years for the 8 bank pack. This value is approaching the calendar life of the battery pack determined as 26.7 years under the same climatic conditions. In general, long-haul trucks are known to typically last 7–8 years (specifically, 900,000 km or up to 17 years with light use) in Canada [20], so the results here show that the battery packs in the BETs simulated on the e-Hwy will normally not need replacement during the vehicle life. In terms of energy efficiency, a slight benefit can be seen for larger pack sizes in Table 1. The table also reports equivalent cycles alongside the EOL values. An equivalent cycle is defined as the battery discharging the amount of energy considered to be the equivalent of the Δ DOD range of its rated capacity. The ratio of equivalent cycles to EOL value is an indication of how hard the battery is worked over its life. From this point of view, non-intermittent e-Hwys seem to put the least stress on the battery packs.

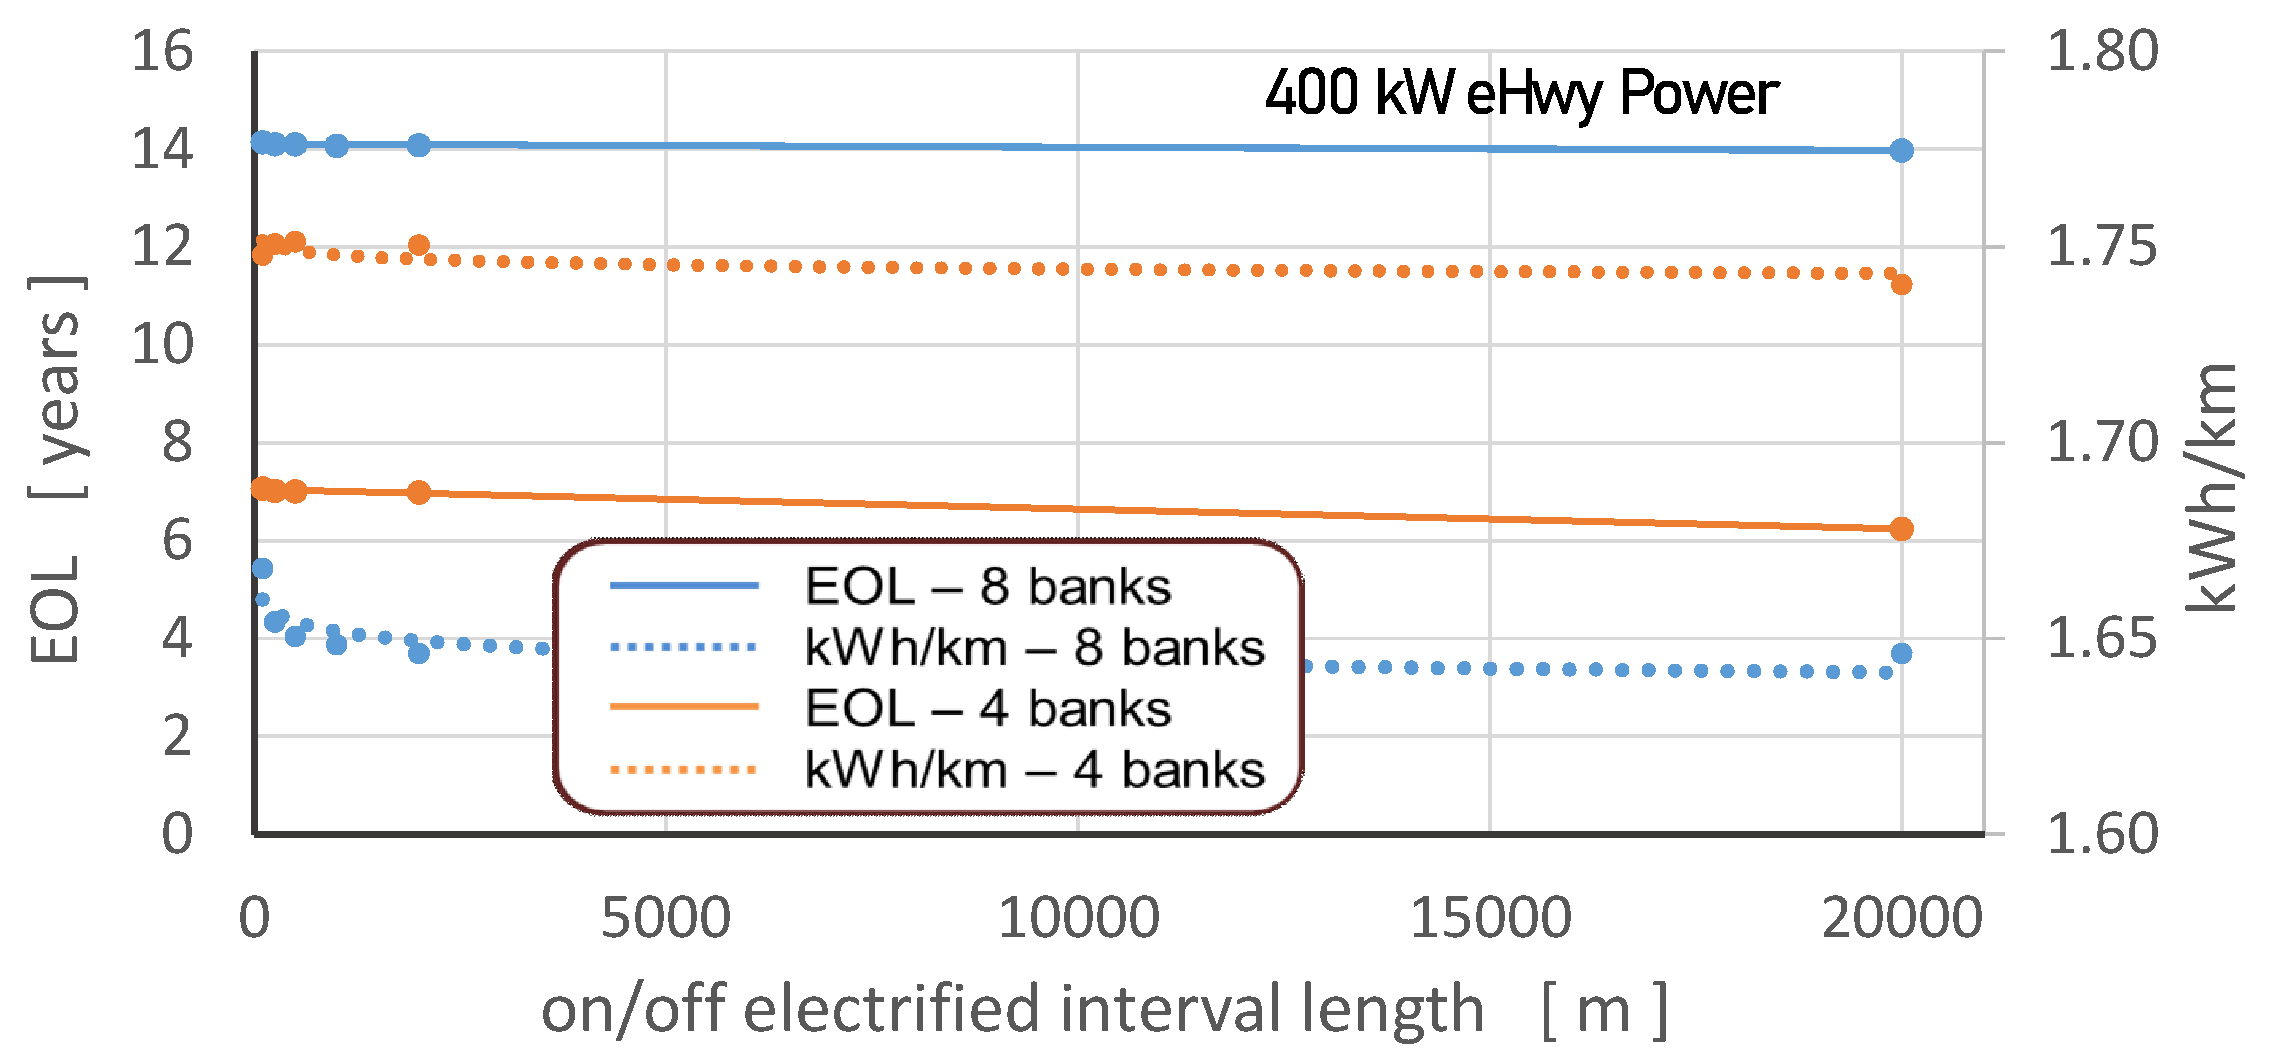
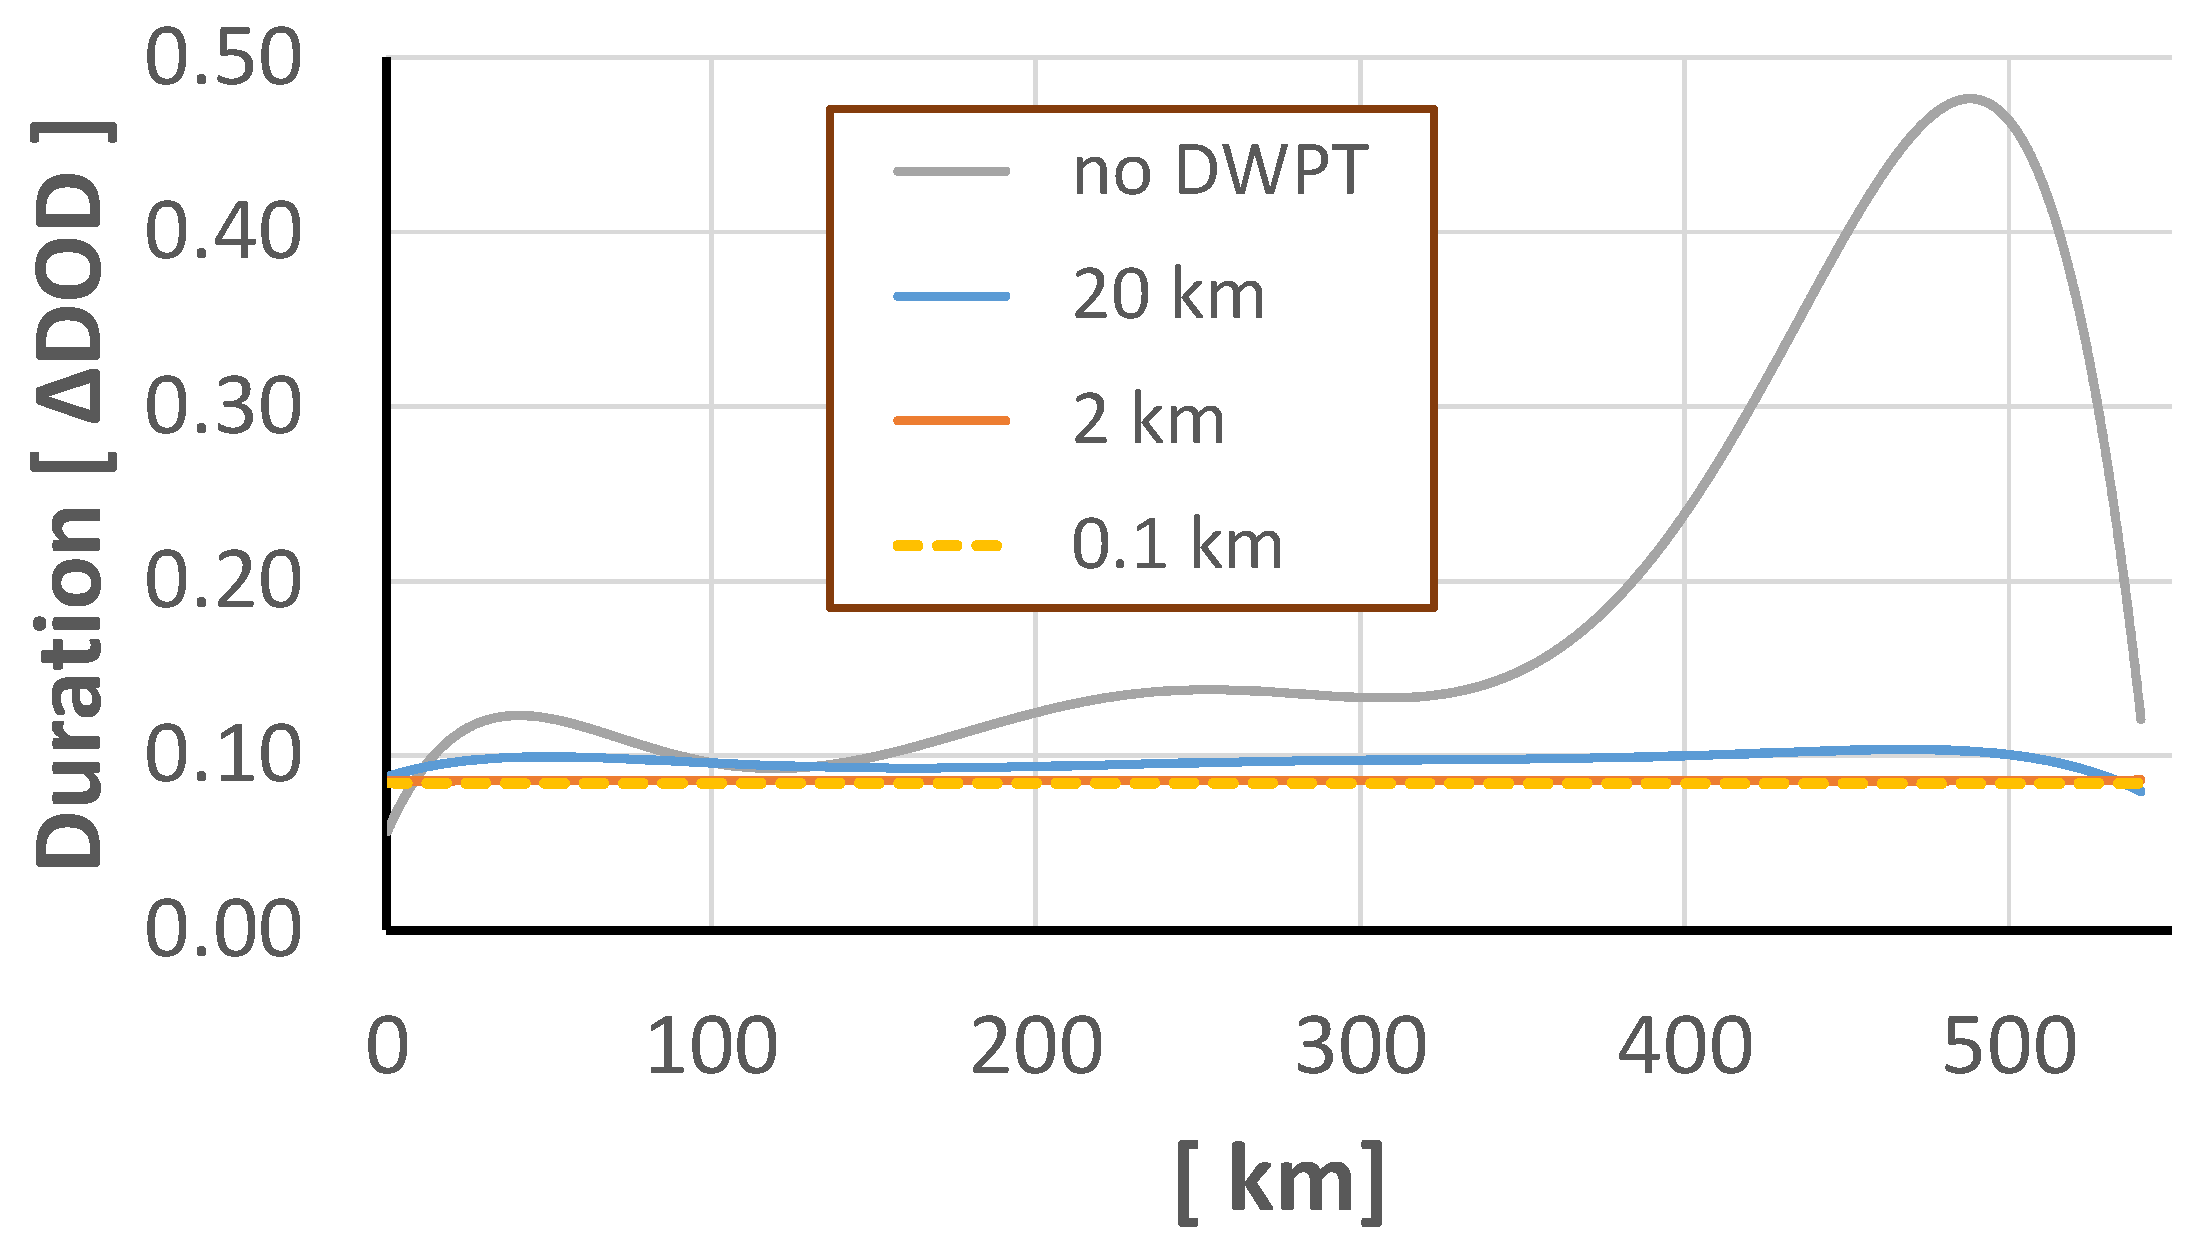
4.3. Intermittent e-Hwy Configurations

To make available the same amount of power over an equivalent distance, on/off intervals of equivalent segment length were simulated to assess the effects of intermittency in electrified highways. Initially, alternating powered and unpowered segments of 20 and 2 km were investigated.
The effect of the 200 kW and 400 kW e-Hwy power provision levels are shown in Figure 7, with battery pack capacity and 2 km and 20 km intermittency intervals as additional parameters. It can be seen that increased e-Hwy power benefits battery lifetime for large packs, and when comparing packs of equivalent capacity, smaller intermittent intervals provide slight lifetime gains. In general larger packs perform more efficiently, and the 2 km intervals showed slightly better energy efficiency compared to the 20 km intervals. At 200 kW e-Hwy power, significant energy from mid-trip recharging was required, notably with smaller battery packs, thus reducing BET lifetimes. While intermittent electrification has lower battery degradation on a per cycle basis, the truck battery was used much more than in the case of full electrification, leading to a shorter life (Table 1).
Much finer intervals of e-Hwy intermittency were investigated to see if such configurations could provide energy use benefits over the BET lifetime. Results in Table 1 already show slight benefits in battery lifetimes for 2 km on/off intervals compared to 20 km intervals, along with larger incremental gains as battery pack sizes increase. Regularly spaced on/off intervals shorter than 2 km were simulated; 1000 m, 500 m, 250 m and 100 m. A 100 km/h highway speed is 27.78 m/s, requiring less than four seconds to cover 100 m. In order to have adequate spatial resolution for on/off e-Hwy switching over 100 m intervals, a simulation time step of 0.5 s was required. For these cases, an e-Hwy with 400 kW power provision was simulated with e-trucks with 4 and 8 bank battery packs, traveling the Toronto to Montreal route with intermittent DWPT.
In Figure 8 a small lifetime benefit for 4-bank packs at shorter on/off electrified intervals can be observed. For an 8 bank pack, there is an essentially negligible benefit to very short intermittent intervals reflected by the near zero slope of the data. These output data confirm that larger battery packs have both longer life and more efficient performance. Based on the theoretical advances alluded to in Figure 5, it is understood that fast mode switching, and/or continuous operations that experience rest intervals (akin to pulse charging) will expose the electrodes to smaller build-ups of excess lithium, known to be a significant degradation driver.
Also shown in Figure 8 for the cases considered are curves with kWh/km values. The energy efficiency is very sensitive to many factors, and despite anticipated benefits of intermittency, the data show negligible benefits. The efficiency calculations show better performance with longer intervals which could possibly be a minor thermal effect given the lack of sophisticated thermal management modeled here. Over longer on/off intervals the battery will run slightly hotter, contributing to slight efficiency gains in generally cold operating environments.

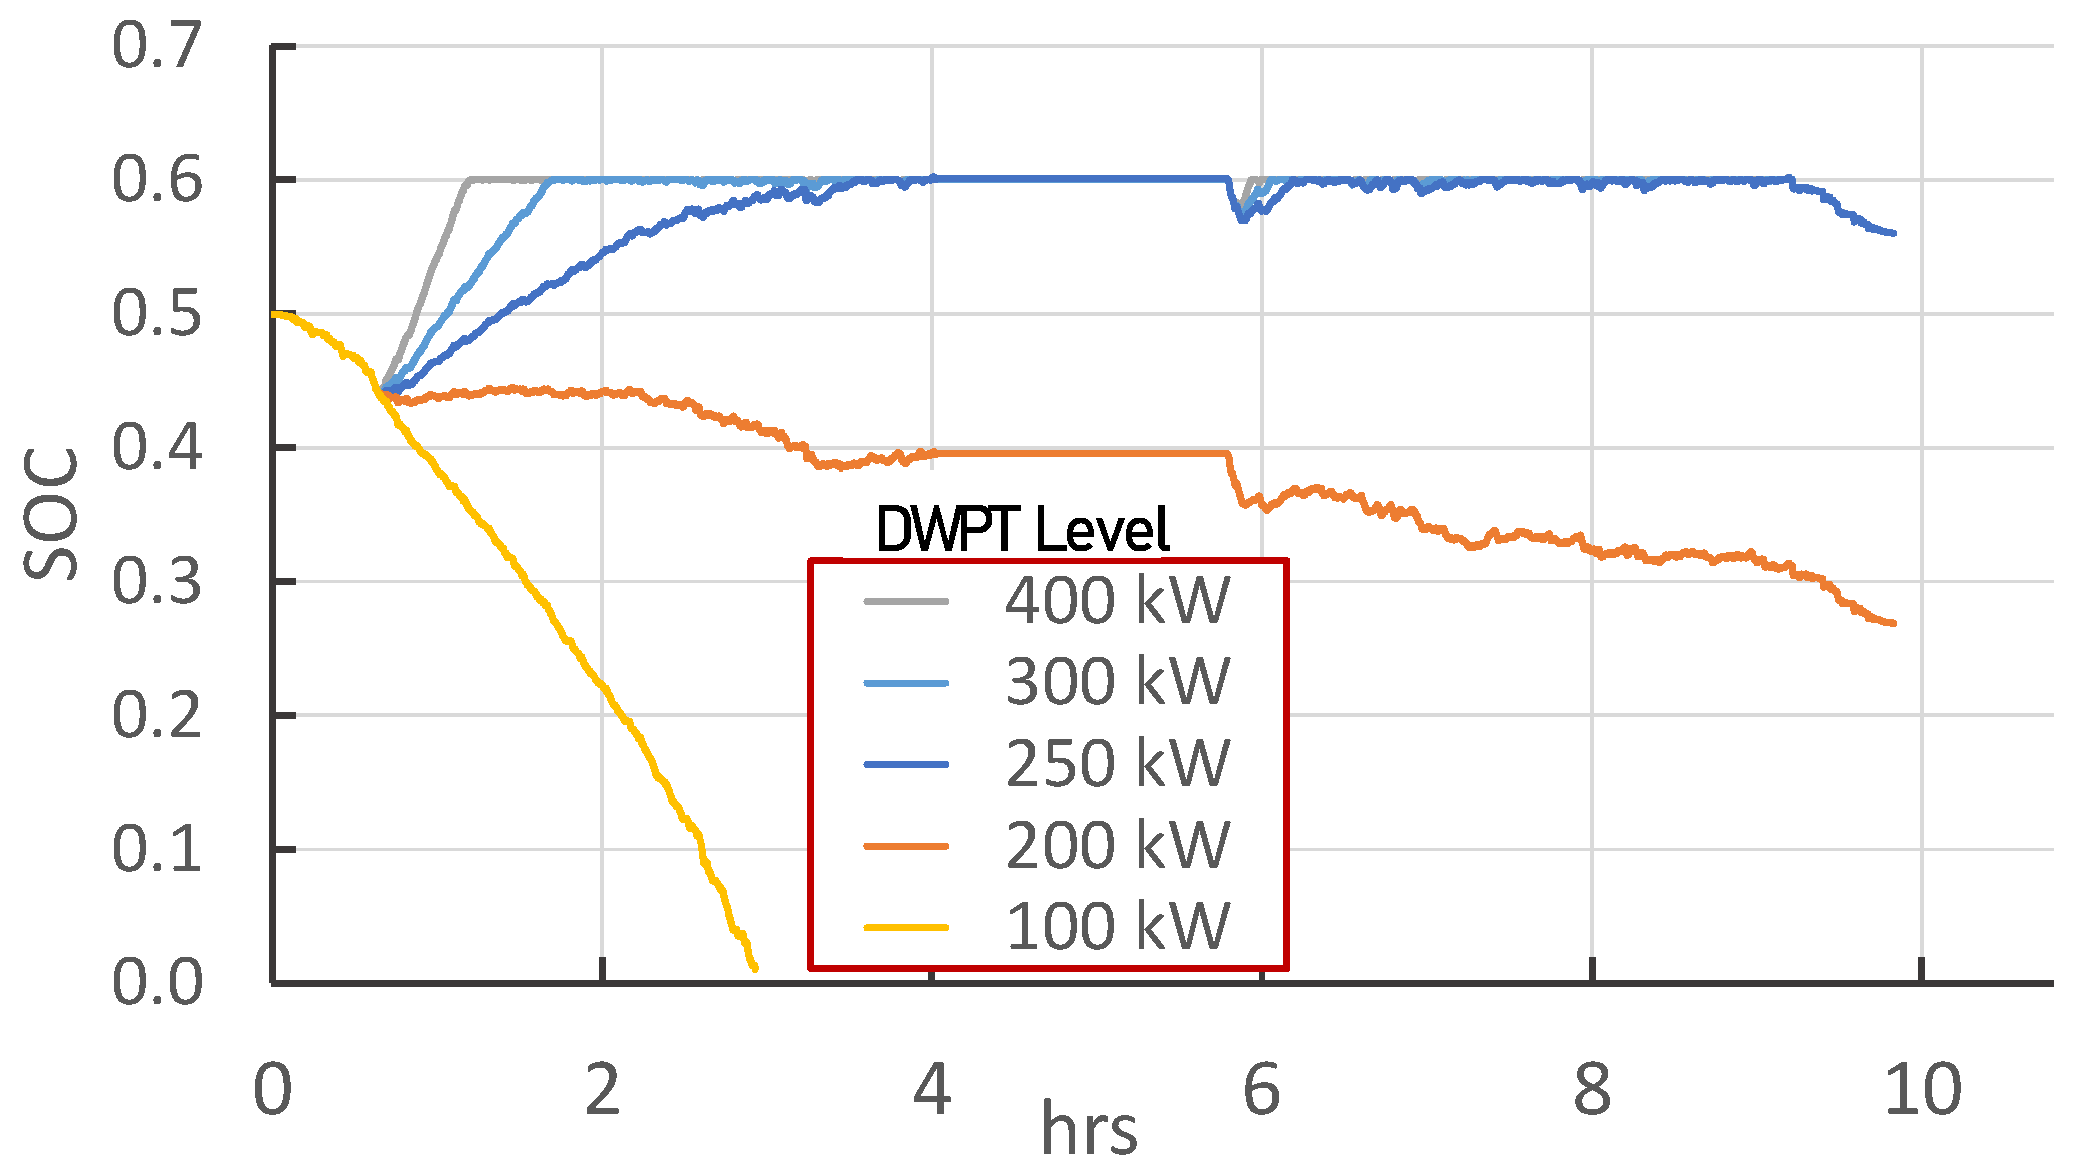
4.4. Effect of Highway Electrification Power Level

Some simulations were run to determine what level of e-Hwy power provision would be sufficient to no longer require off-highway recharging. This question arose in response to data reported in Table 1 where it can be seen that intermittent cases at P hwy levels of 200 kW show low EOL values since extensive mid-trip recharging was required in these cases to complete the driving duty. In these present cases (Figure 9), for a long haul truck of 36 tonnes, around 250 kW is a level that allows the truck with an eight bank battery to do whatever off-e-Hwy driving may be required in a day and maintain some charge in the battery, as well as be able to reach a desired on-highway operational SOC set point.
A few observations from Figure 9 merit some mention. For P hwy levels of 250 kW or higher, it can be seen that the e-Hwy power provision is more than enough to power the truck and that the SOC can reach a control set point. It simply takes longer at 250 kW compared to higher levels to regain the set point. At a P hwy level of 200 kW, the truck is able to complete the day’s driving but does so by depleting battery capacity. Such practice would not be sustainable day after day without off-highway recharging. Finally, for a P hwy level of 100 kW, the truck power demand is constantly more than what the highway supplies and the SOC drops steadily to depletion well before the 750 km trip is completed. Highway power levels much beyond what the truck would require in general would require extra levels of control to avoid large recharge currents which would contribute to more rapid battery degradation.

4.5. Highway Power Levels Allowing Intermittency

A series of simulations were run with high e-Hwy power levels to see if this could allow small battery pack sizes to complete driving duties on an intermittent e-Hwy with 20 km intervals of electrified and unpowered roadway. Figure 10 plots EOL values versus batter pack capacity for three levels of e-Hwy power provision. Larger battery sizes lead to larger EOL values through mitigation of high current values, whereas elevated P hwy levels shorten battery lifetimes through exposure to excessive current rates. These observations echo the findings discussed for Figure 9.

4.6. Discussion of the Operational Duration Effect

To better understand the limited benefits of small intermittent intervals shown in Figure 8, the Δ DOD parameter used to determine the f ( x ) term as raw simulation output can be seen in Figure 11 which shows the Δ DOD levels determined for 20 km, 2 km and 0.10 km e-Hwy intermittency over the Toronto to Montreal drive, as well as the main reference case of the BET with a 16 bank battery and no DWPT provision. The reference case shows about a 50% higher Δ DOD value for most of the trip, and it only becomes much higher for about the last 100 km of the trip where the route elevation features do not allow the Δ DOD value to relax like the intermittent cases. Thus the low duration driver values for degradation clearly contribute to intermittent cases with pack banks of 6 units or more having markedly longer lifetimes than the reference case.
The irregularity of the power demand produces Δ DOD values that average around 0.10 for the 20 km intervals. The increased irregularity obtained from reducing the on/off interval to 2 km drops the average Δ DOD levels by about 15%. Given that this is a small decrease that manifests mainly during brief operational durations to begin with, the benefits in terms of extending battery life are small. When going from 2 km to 0.10 km intermittency, the Δ DOD levels decrease by only about 2 percent. The main takeaway here is that micro-intermittency below 2 km provides negligible battery durability benefit for the scenarios examined. In hindsight, the results are consistent with the reference case depicted in Figure 6a. In that case, the entire 540 km trip was completed, depleting the SOC of an initially fully charged 16 bank battery by about 62%. Thus, even 20 km segments, proportionally would represent an SOC change (or Δ DOD) of around 2.3%, which would thus produce small Δ DOD-based degradation drivers. Relative to this, finer intermittency would simply be a slight incremental reduction of an already small quantity.

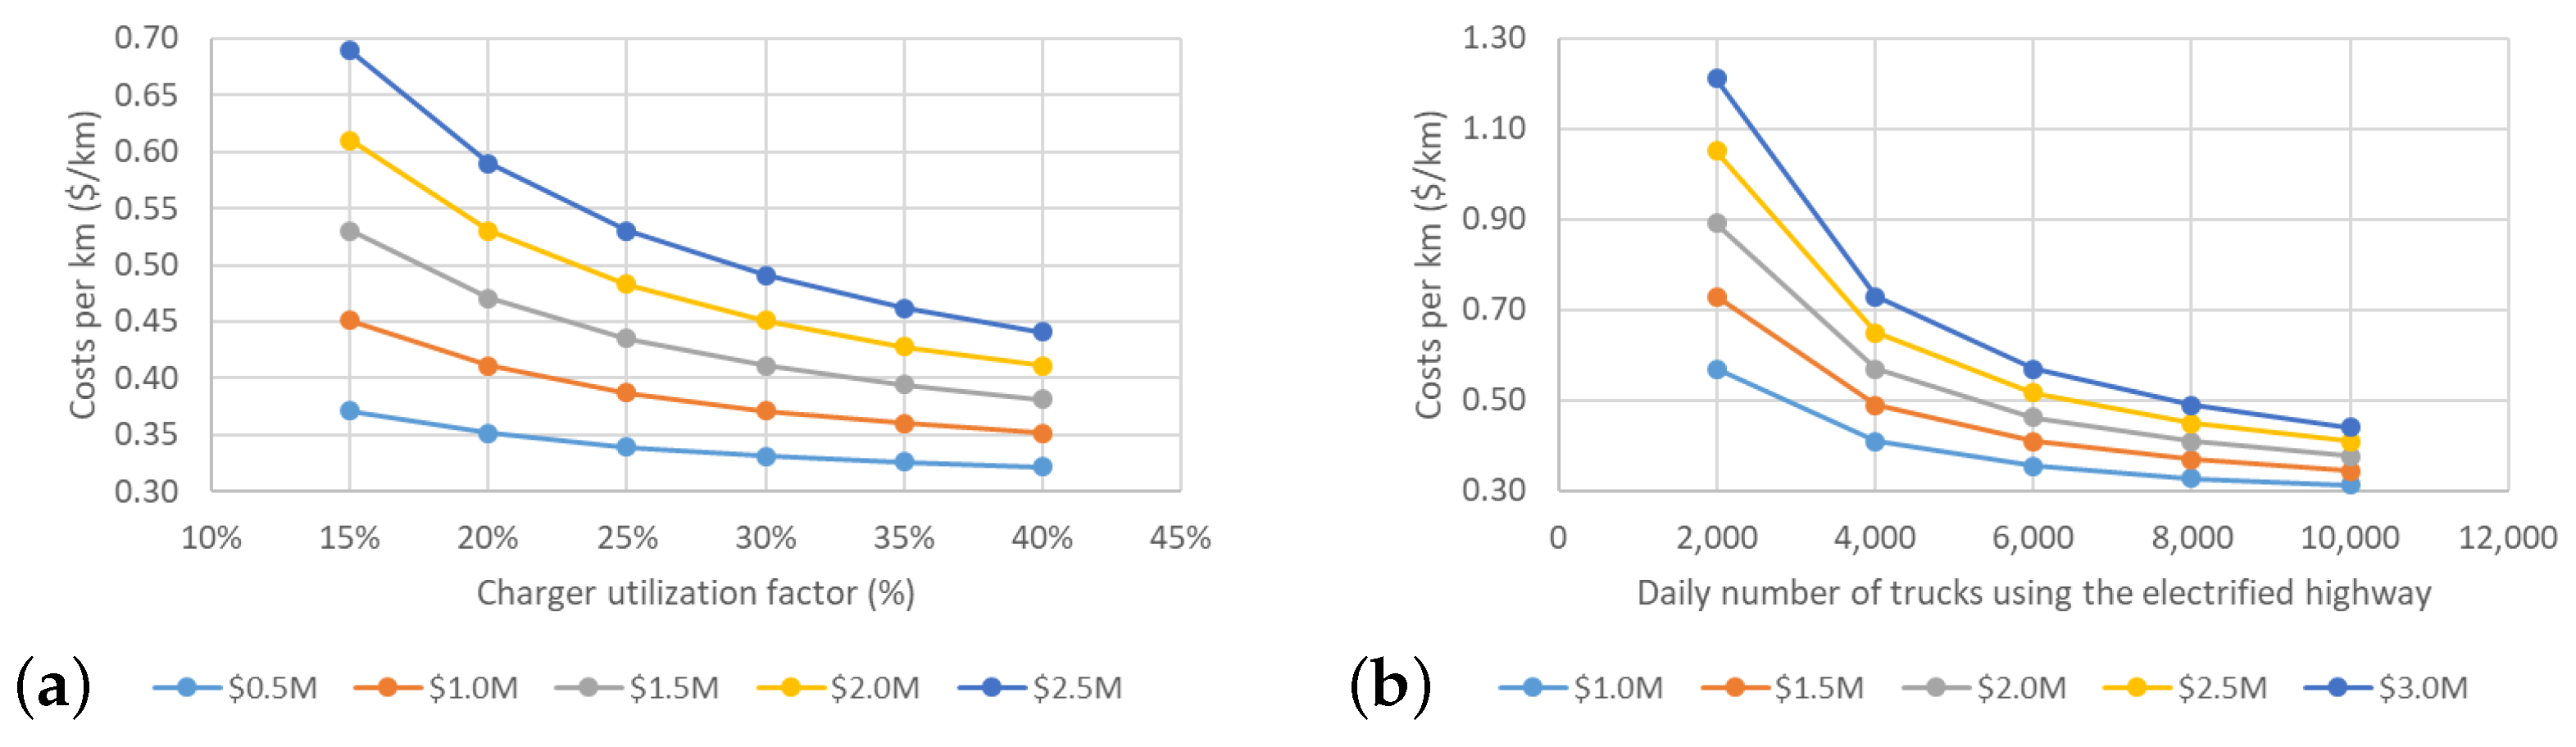
4.7. Economic Evaluation

The economics of the electric highways variants and of the reference case of megawatt charging were evaluated by comparing their total cost per km for the infrastructure, the electricity consumed, and the cost of battery degradation. The per km costs for the reference case of megawatt charging are displayed in Figure 12a. The costs strongly depend on the currently unknown costs to purchase and install megawatt chargers and on their utilization rate. There is also a wide range in cost forecasts for electrifying highways. Additionally, the cost per km will depend on the number of trucks using the e-Hwy. The resulting costs per km for a fully electrified highway are given Figure 12b.
The infrastructure costs were determined as an annual per truck cost, based on 8000 truck trips occurring on the route per day. The capital cost was spread over 20 years with 6% annual interest applied. Per km costs for the various trucking scenarios include contributions for capital, electricity and battery costs.
Intermittent electrification scenarios reduce investment costs through savings on the costs of the in-road part (for the 20 km and 2 km case) and on the costs for electricity distribution along the highway (only for the 20 km case). Savings for the 2 km case were therefore assumed to be half of those for the 20 km case. However, for most of the cases evaluated, the savings in investments were cancelled out by higher battery use costs and greater electricity losses (see Figure 13a, Table 2). Despite the higher investment costs, simulation results indicated a benefit of installing a larger battery in the truck than strictly necessary for intermittently electrified highways (Figure 13b).
Table 2 indicates that per km costs are similar for high usage scenarios for the middle of the current range of investment costs. More accurate investment cost data will be necessary to understand which technology will be more cost effective for the transportation sector.

5. Conclusions

This study has provided the rationale and context to incorporate temporal and current mode degradation drivers into BET usage simulations. Fundamental electrochemical derivations of these novel operational duration based drivers were presented in this paper. General preliminary findings are that electrified highways significantly increase BET battery life, but total energy consumption is similar to one megawatt recharging of BETs driving on highways without DWPT. However, electrified highways allow battery packs less than 50% of the size required with BETs using one megawatt recharging. Important parameters for transport trucks on electrified highways were identified as battery size, e-Hwy power provision level and route elevation features.
This study also evaluated the operation and economics of continuous and intermittent Electric Highways as alternatives to using megawatt chargers. Because all of these technologies are still under development, there is a large uncertainty regarding their investment costs. For all technologies, a high utilization rate is necessary to obtain low costs per km, and mid-range investment costs currently lead to similar costs per km for all technologies.
Intermittent electrification was shown to increase the number of equivalent cycles within the life of the battery, but requires more intense battery usage, decreasing the actual battery life in number of calendar years. Equipping trucks with larger batteries than necessary reduced cost per km due to longer battery life. For a 36 tonne transport truck, an e-Hwy power provision level of about 250 kW was identified as being suitable for sustainable long-haul driving without requiring off-highway recharging. e-Hwy power levels above this 250 kW are not of much additional benefit, as they only serve to shorten the times required to regain an on-road operational SOC set point, but at higher degradation levels from the higher currents they produce.
Going forward from this present study, subjects that will require further investigation will be ways to better exploit intermittent electrification of highways including electrified interval lengths and their configurations. Such further studies will need to be closely tied to economic evaluations of the entire system including installed equipment and the operation of BETs in the e-Hwy environment.

Author Contributions

K.D.: code development, simulation strategy, data analysis, manuscript preparation. H.R.: project commissioning, simulation strategy, technical oversight, techno-economic analysis. K.Q.: techno-economic analysis. E.S.: running simulations, organizing and presenting data. All authors have read and agreed to the published version of the manuscript.

Funding

Funding for this work was provided by the National Research Council of Canada and by Natural Resources Canada through the Program of Energy Research and Development (PERD).

Data Availability Statement

Not applicable.

Conflicts of Interest

The authors declare no conflict of interest.

Abbreviations

The following abbreviations are used in this manuscript:
BETbattery electric truck
BMSbattery management system
CPTconductive power transfer
DODdepth of discharge
DWPTdynamic wireless power transfer
e-Hwyelectrified roadway furnishing DWPT
EOLbattery EOL life value, in years
EVelectric vehicle
OCVopen-circuit voltage
P2Dpseudo two-dimensional
SEIsolid-electrolyte interface
SOCstate of charge
SOHstate of health

References

  1. Osieczko, K.; Zimon, D.; Płaczek, E.; Prokopiuk, I. Factors that influence the expansion of electric delivery vehicles and trucks in EU countries. J. Environ. Manag. 2021, 296, 113177. [Google Scholar] [CrossRef] [PubMed]
  2. Qiu, K.; Ribberink, H.; Entchev, E. Economic feasibility of electrified highways for heavy-duty electric trucks. Appl. Energy 2022, 326, 119935. [Google Scholar] [CrossRef]
  3. Triviño, A.; González-González, J.M.; Aguado, J.A. Wireless power transfer technologies applied to electric vehicles: A review. Energies 2021, 14, 1547. [Google Scholar] [CrossRef]
  4. Gustavsson, M.G.H. Research & Innovation for Electric Roads. In Proceedings of the EVS35 Symposium, Oslo, Norway, 11–15 June 2022. [Google Scholar]
  5. Dhayarkar, S.; Sontakke, S.; Shinde, V.; Ghuge, N. Electric Heavy Vehicle Transportation Highway (By Catenary System). ITM Web Conf. 2022, 44, 01004. [Google Scholar] [CrossRef]
  6. Gouvernement de France, Ministère de la Transition énérgetique, Système de Route électrique, Groupe de Travail no1. In Décarboner le Transport Routier de Marchandise par l’ERS, Enjeux et Stratégie; Trafigura: Singapore, 2021; 196p.
  7. Green Car Reports. Edelstein, S. Short-Loop Electric Bus Serves as a Proving Ground for Dynamic Wireless Charging. Available online: https://www.greencarreports.com/news/1131665_short-loop-electric-bus-serves-as-a-proving-ground-for-dynamic-wireless-charging (accessed on 12 January 2023).
  8. Google Earth. Available online: earth.google.com (accessed on 7 October 2021).
  9. Environment Canada, Historical Weather Data. Available online: climate.weather.gc.ca/historical_data/search_historic_data_e.html (accessed on 6 October 2021).
  10. Foote, A.; Onar, O.C.; Debnath, S.; Chinthavali, M.; Ozpineci, B.; Smith, D.E. Optimal sizing of a dynamic wireless power transfer system for highway applications. In Proceedings of the 2018 IEEE Transportation Electrification Conference and Expo, (ITEC), Long Beach, CA, USA, 13–15 June 2018; pp. 1–6. [Google Scholar]
  11. Tesla. Available online: www.tesla.com/enCA/semi (accessed on 2 October 2021).
  12. Darcovich, K.; Ribberink, H.; Michelet, C.; Lombard, K.; Ghorab, M. The Feasibility of Electric Vehicles as Taxis in a Canadian Context. In Proceedings of the 2019 Electric Vehicles International Conference (EV), Bucharest, Romania, 3–4 October 2019; pp. 1–6. [Google Scholar]
  13. Darcovich, K.; Recoskie, S.; MacNeil, D.D.; Darcovich, A. Operational intra-cycle temporal and current mode effects on battery capacity loss. eTransportation 2022, 13, 100185. [Google Scholar] [CrossRef]
  14. Darcovich, K.; Recoskie, S.; Fattal, F. Fast operational mode switching effects on battery degradation. J. Appl. Electrochem. 2020, 50, 111–124. [Google Scholar] [CrossRef]
  15. Darcovich, K.; MacNeil, D.D.; Recoskie, S.; Cadic, Q.; Ilinca, F. Comparison of cooling plate configurations for automotive battery pack thermal management. Appl. Therm. Eng. 2019, 155, 185–195. [Google Scholar] [CrossRef]
  16. Ribberink, H.; Lombardi, K.; Humphries, K.; Loiselle-Lapointe, A.; Stefopulos, N.; Varghese, S.; Pundsack, N. Impact of Ambient Temperature and Battery Activity on Internal Battery Temperatures of Electric Vehicles. In Proceedings of the 32nd International Electric Vehicle Symposium and Exhibition (EVS32), Lyon, France, 19–22 May 2019. [Google Scholar]
  17. Darcovich, K.; Recoskie, S.; Michelet, C.; Ribberink, H. The Impact of V2X Service under Local Climatic Conditions within Canada on EV Durability. eTransportation 2021, 9, 100124. [Google Scholar] [CrossRef]
  18. Gao, L.; Liu, S.; Dougal, R. Dynamic Lithium-Ion Battery Model for System Simulation. IEEE Trans. Components Packag. Technol. 2002, 25, 495–505. [Google Scholar]
  19. Qiu, K.; Ribberink, H.; Entchev, E. Technical and Economic Feasibility of Electrified Highways for Heavy-Duty Electric Trucks. In Proceedings of the Applied Energy Symposium: MIT A+B, Cambridge, MA, USA, 11–13 August 2021. Paper ID APEN-MIT-2021_122, 5p. [Google Scholar]
  20. Talebian, H.; Herrera, O.E.; Tran, M.; Mérida, W. Electrification of road freight transport: Policy implications in British Columbia. Energy Policy 2018, 115, 109–118. [Google Scholar] [CrossRef]
Figure 1. Map showing Toronto to Montreal highway driven, elevation profile shown in inset.
Wevj 14 00060 g001
Figure 2. (a) Schematic of recharge-rest-recharge sequence. (b) Schematic of discharge-rest-discharge sequence.
Wevj 14 00060 g002
Figure 3. Power flow configuration in electric truck used in simulations. Inset in green oval is the truck battery pack.
Wevj 14 00060 g003
Figure 4. Simulation algorithm flow chart.
Wevj 14 00060 g004
Figure 5. (a) Experimental capacity fade rates in Li-ion cells plotted as a function of cycle amplitude. (b) The same curve in dashed black for c (depth of discharge) intervals used as basis to determine relative instantaneous degradation factor f ( x ) for battery operation across any Δ DOD range. Here the function f_i is a discretized form of f ( x ) based on a 20-interval partition of the DOD range.
Wevj 14 00060 g005
Figure 6. Plots tracking ambient temperature, battery pack temperature and battery SOC over a 24-hour period on January 1. Plot (a) shows output from a simulation with a 16-bank pack and no DWPT. Plot (b) show simulation output for a truck with an 8-bank pack, and full e-Hwy coverage with 200 kW DWPT power provision.
Wevj 14 00060 g006
Figure 7. Battery lifetimes and energy use per km as a function of BET battery pack size on 2 km and 20 km interval intermittent e-Hwys at 200 kW and 400 kW power provision levels.
Wevj 14 00060 g007
Figure 8. Battery lifetimes and energy use per km as a function of intermittency interval length for 4 and 8 bank BET batteries.
Wevj 14 00060 g008
Figure 9. SOC level in truck with eight bank battery driving a distance of just over 750 km on an e-Hwy at a range of power provision levels.
Wevj 14 00060 g009
Figure 10. Battery lifetimes for 20 km e-Hwy intermittency at power provision levels ranging from 500 to 700 kW.
Wevj 14 00060 g010
Figure 11. Smoothed Δ DOD curves for the reference no DWPT case and 20 km, 2 km and 0.10 km e-Hwy on/off intervals.
Wevj 14 00060 g011
Figure 12. Costs per kilometer for the reference case of fast charging at a one megawatt power level for scenarios of different charger cost and charger utilization with a 16-bank truck battery (a) and for the 100% electrified highway for different levels of investment costs per km and highway utilization with a 4-bank truck battery (b).
Wevj 14 00060 g012
Figure 13. (a) Costs per kilometer driven for different electrification scenarios using a 267 kWh battery. (b) Costs for trucks with different battery sizes for intermittent electrification (20 km on/off), showing different levels of cost reduction from intermittent electrification with investment costs of $2.0 million/km and highway usage at 8000 trucks per day.
Wevj 14 00060 g013
Table 1. Battery life for different scenarios and battery sizes. End of life (EOL) values in years.
Battery
Size
(kWh) [banks]
Megawatt
Charging
P hwy = 200 kW
100% Electrified
Highway
P hwy = 400 kW
50% Electrified
(20 km on/off)
P hwy = 400 kW
50% Electrified
(2 km on/off)
equiv. cyclesEOLequiv. cyclesEOLequiv. cyclesEOLequiv. cyclesEOL
267 [4] 387215.8960596.2468886.98
401 [6] 308918.86723210.87766711.22
534 [8] 248120.12702213.97719414.08
1068 [16]42358.41
Table 2. Per km costs for different cost components.
Megwatt
Charging
100% Electrified
Highway
50% Electrified
(20 km on/off)
50% Electrified
(2 km on/off)
Battery size (kWh)1068267534267534267534
banks16484848
Battery use$0.048$0.006$0.010$0.016$0.015$0.015$0.014
Capital costs$0.102$0.161$0.161$0.136$0.136$0.148$0.148
Electricity$0.243$0.242$0.241$0.264$0.250$0.266$0.250
Total$0.394$0.409$0.412$0.417$0.401$0.429$0.413
Disclaimer/Publisher’s Note: The statements, opinions and data contained in all publications are solely those of the individual author(s) and contributor(s) and not of MDPI and/or the editor(s). MDPI and/or the editor(s) disclaim responsibility for any injury to people or property resulting from any ideas, methods, instructions or products referred to in the content.

