1. Introduction
This paper is an extended version of work published in [
1].
Global warming is felt all over the world. Droughts, forest fires and floods make climate change undeniable. The European Union (EU) therefore launched the Green Deal, a plan to make the EU climate neutral by 2050. Part of the Green Deal is the FitFor55 target, which states that greenhouse gas (GHG) emissions must be reduced by 55% by 2030 (compared to 1990).
Over 25% of GHG emissions in Europe derive from the transport sector [
2]. Research comparing CO
2 emissions—making up approximately 99% of GHG emissions for road transport [
3]—of internal combustion engine vehicles (ICEV) and its alternatives through a complete Life Cycle Assessment (LCA), found that electric vehicles (EVs) have the lowest CO
2 emissions [
4]. With the average European electricity mix, the level of GHG emissions of EVs is 17–30% lower than diesel and petrol vehicles, respectively [
5]. This shows the motivation behind the EU’s decision, in June 2022, to set a target for only fuel-free cars to be sold by 2035. EVs are therefore becoming increasingly important.
Shared autonomous electric vehicles (SAEVs) can reduce GHG emissions even further, thanks to their lower vehicle kilometres travelled (VKT) [
5], their smaller fleet [
6], and their energy efficient driving style [
7]. However they need locations where they can charge. Determining the allocation of charging infrastructure (CI) is an important issue, as this has an influence on the efficient routing of the SAEV fleet.
Another widely asked question, for EVs in general, is whether the energy grid will be able to handle the extra load demand. Research has found that the uncoordinated charging of many EVs may result in a peak load demand which causes financial losses, power losses, and electricity network congestion [
8]. Many grid problems (such as the degradation of voltage stability and increased power losses) are a result of the poor allocation of charging stations (CSs) in the distribution network [
9]. Therefore, a coordinated charging technique with V2G functionality and the proper allocation of CSs grid-wise are crucial.
Finally, we want to stress that “the potential of V2G is influenced by EVs availability, which depends on the owner acceptance, driving behaviour, willingness to participate, system readiness, technical constraints, market readiness, and regulations” ([
10], p. 9). Many of these factors differ between privately owned EVs and SAEVs. Also, SAEV fleet operators have different requirements regarding CI than individual EV owners (such as customer waiting time and total VKT rather than individual walking distance to a CS). Therefore, current studies on CI for regular EVs with the implementation of V2G technology, such as [
9,
11], are not suitable in an SAEV context. Other literature reviews that consider charging infrastructure planning, such as [
12], mainly include CI for regular EVs. However, too few studies on SAEV CI are included. Therefore, there is no elaborate view provided on the components needed to optimally allocate CSs for SAEVs.
This paper will investigate which elements are needed to decide on the CI when an SAEV fleet is combined with a V2G charging strategy. To the best of our knowledge, no research has yet been performed on such a location analysis. Therefore, the aim of this paper is to answer the following research questions:
- RQ1
What methodologies are used in deciding where to locate CSs for SAEVs and V2G, and which is/are the most popular?
- RQ2
What elements are important to take into account when locating SAEV and V2G CSs, both mobility- and energy-wise?
By answering these questions, this paper will provide the following contributions:
A detailed review that examines, separately for V2G and SAEVs, which location analysis methods have already been reported in the literature.
A discussion on the different decision variables, objective functions and constraints of the charging station placement problem both for SAEV and V2G.
An identification of the links and/or combinations that are still missing for the combination of SAEVs and V2G.
A research agenda that suggests a combination of mobility and grid components that should be considered in a model for optimal CS placement for SAEVs with V2G.
The remainder of the paper is structured as follows.
Section 1.1 and
Section 1.2 elaborate on the motivation and advantages for introducing V2G charging in an SAEV fleet.
Section 2 presents the methodology used for the collection of papers. Results are discussed in
Section 3.
Section 4 provides a discussion highlighting the most important findings from the results. In
Section 5, we propose future research directions and
Section 6 summarizes the main conclusions of the paper.
1.1. Motivation for V2G
Despite the fact that EVs do not have any direct tailpipe emissions, a large part of EVs’ well-to-wheel(i.e., electricity generation + transmission + battery charging + use to drive motor) (WTW) GHG emissions derive from electricity production. The electricity mix in energy production has a large impact on these WTW GHG emissions. An EV charged exclusively with coal-generated electricity has WTW GHG emissions of at least as high as an ICEV, while an EV charged exclusively with wind power would have WTW GHG emissions of 100 times lower [
5]. This indicates the importance of the implementation of renewable energy sources (RES) in the energy mix. The current share of RES in the European electricity mix is around 30–34% and could increase to 65–70% by 2030 [
13,
14]. However RES’s electricity generation depends on nature conditions, thus it is not consistent, lacks flexibility and is thereby less reliable [
14]. Moreover, the peak of solar PV and the peak of wind power generally do not coincide with the peak in energy demand. The imbalance between renewable energy production and (peak) energy demand is visualized in
Figure 1 by the so-called ‘duck-curve’ (named for its shape that resembles a duck), which shows a steeper increase in needs and a higher risk of overgeneration with a higher penetration of RES [
15,
16].
Flexibility needs to be introduced into the system to counter the variations in the duck-curve in order to ensure a balance between energy demand and energy supply to maintain a balanced grid [
14]. One of the most promising technologies in this context is V2G. V2G is a technology that supports a bi-directional power flow between the grid and EVs. The EV acts as a movable storage method of electrical energy, a battery on wheels one might say. It can absorb energy in periods of high electricity penetration and feed electricity back into the grid in situations of insufficient electricity generation [
17]. With this technique, EVs can provide ancillary services to the grid, such as voltage and frequency regulation, and act as spinning reserve (i.e., a quick response to the required needs) [
10,
17,
18]. Moreover, EVs can deliver active power support by flattening the grid load profile. This is achieved by peak-load shaving (sending power back to the grid when demand is high) and valley-filling/load-levelling (charging when demand is low), as illustrated in
Figure 2 [
10,
19,
20].
Finally, further potential services of EVs as storage systems, include grid congestion mitigation, renewable energy storage and reduction of renewable energy intermittence [
10]. All of these capabilities are crucial, since research showed that in a stress test, the net peak load demand could increase to up to 25% with forecasted EV adoption in 2035, and up to 50% in a full electrification scenario [
21]. Additionally, even at low adoption levels of EVs, EV charging can have a significant local impact on the distribution grid (more specifically on the expected lifetime of transformers) in the event of uncoordinated charging [
22]. Thanks to the aforementioned V2G services, a total of 600 GW of flexible capacity could be unlocked across China, the EU, the United States and India. In 2030, this could be associated with a reduction in electricity generation during peak demand of 380 TWh, leading to a reduction in CO
2 emissions of 330 million tonnes [
18]. The advantages of V2G are shown in
Figure 3a.
However V2G also has some challenges. Next to the fundamental issues of battery deterioration (due to more battery cycles) and the high investment cost for bidirectional chargers [
10,
18], user-related challenges are also at hand. Firstly, there is the social barrier for participation in V2G driven by range anxiety. Research found low values of probabilities of V2G services if it is not used for services in the EV owner’s own household. The availability of users providing the service during peak demand is lower than 20% [
23]. Secondly, for V2G deployment, communication between the EVs and the grid operator is necessary. Vehicle information, such as state of charge (SOC) and location of charging, needs to be gathered. When this is stored, user history can reveal information about the vehicle owner. This causes privacy issues and creates a need for high-level cybersecurity [
10,
18].
1.2. Motivation for SAEVs
Electrifying the fleet and striving for a larger share of RES (using V2G) significantly reduces GHG emissions, but this electrification creates emission issues at the production phase. Battery manufacturing causes GHG emissions from EV production to be 1.3–2 times higher than those of ICEV production [
5]. A solution to this is car- and ride-sharing. Next to the lower VKT [
5], which lowers the use stage emissions, a smaller fleet is needed to perform the same amount of household trips, which reduces production emissions. Research shows that if only 25% of all trips in the G7 (Canada, France, Germany, Italy, Japan, the United Kingdom, the United States, and the EU) were conducted as shared rides, production GHG emissions could be reduced by 13–20% [
24]. Therefore, shared EVs are a promising option to reduce GHG emissions, both in the production stage and the use stage.
Automating these shared EVs gives rise to new advantages. First, autonomous vehicles are more energy efficient than their non-autonomous EV counter parts due to their gentle driving style [
7] and efficiency of travel [
25]. For a platoon of connected autonomous EVs (CAEVs) it is possible to optimally plan their driving operations, taking into consideration the aerodynamic resistance forces and acceleration and deceleration manoeuvres. Researchers have designed an eco-driving control architecture for a platoon of CAEVs, and found that in a platoon of five CAEVs on a straight road the energy consumption of each vehicle was reduced by 3.5–4.6% compared to the baseline scenario where the energy-saving purpose was not taken into account [
26]. Next to this, the autonomy of SAEVs creates an extra opportunity in flexible charging, such as allowing the vehicles to move to charging locations during the day when they are not being used [
5]. This way, if an SAEV fleet is owned by a central company, the SAEVs’ charging scheme can be optimized. This enables charging to be more dispersed throughout the day, which cuts the peak charging demand. Moreover, SAEVs can be sent to locations with less impact to the grid [
27]. In addition, SAEVs have an advantage for customers cost wise. The lower operation costs of EVs compared to ICEVs will outweigh their current higher purchase cost, especially when used in a shared fleet. Furthermore, the fact that there is no need for a driver in SAEVs reduces the service cost even further, making SAEVs very attractive as a means of transport for customers [
5,
28]. An overview of all SAEV values is illustrated in
Figure 3b. However, it should be noted that policies or incentives are needed to encourage people to choose shared mobility [
25].
When an SAEV fleet operates as a mobility-on-demand service, and is owned by one company, communication between the vehicles is easier than when all vehicles are privately owned. Additionally, vehicle information is no longer linked to individuals. Therefore, privacy issues are less of a concern. Because of this, and since SAEVs have the flexibility to move to a charging station (CS) at any moment of the day, they are ideal candidates to take part in V2G operations. Furthermore, according to [
29] car-sharing organizations and mobility-as-a-service providers can easily integrate V2G. This claim has been investigated by several researchers. Melendez et al. [
30] optimize the operations of a system of charging hubs and a fleet of SAEVs. Iacobucci at al. [
31] propose a methodology for optimal charge scheduling with V2G along with optimized routing and relocation. However, in these studies the charging locations were chosen arbitrarily.
2. Materials and Methods
To provide an answer to the research questions defined earlier, we conducted a systematic search strategy using different keywords from various databases. Based on the relevance of the papers, 23 SAEV papers and 26 V2G papers were selected. In the sections below, a more detailed description of the search process is provided.
2.1. Search Strategy
The methodology used for this review is based on the methodological frameworks used by Bask et al. [
32] and Mualla et al. [
33]. They propose a three-stage procedure, which we adapted and visualized in
Figure 4.
2.1.1. Planning Stage
First, we define the keywords that characterize the research problem: ‘charging infrastructure’, ‘SAEV’, and ‘V2G’.
Then, a synonym search for every keyword is conducted. Looking at the first 50 results in Mendeley, synonyms are chosen (e.g., ‘bidirectional charging’ as a synonym for ‘vehicle-to-grid charging’). Likewise, wildcards (*) were used for alternate spellings and variations on a word (e.g., the truncation term ‘auto*’ was used to denote potential variations of ‘autonomous’ such as ‘automated’ or ‘automatic’). After this, the following two search strings are built: one for the CI for SAEVs, and one for the CI with V2G. The resulting search strings are provided in
Table 1.
The search was conducted in January 2022. We look for papers published after 2014 since the topic of this study is in a fast-evolving domain. Four databases are included: ISI Web of Science, ScienceDirect, Scopus and IEEE Xplore. For each database, the search string was adapted to the limitations and requirements of the database. For example, ScienceDirect does not support the use of wildcards (*). Next, quotation marks were sometimes included for more relevant results, and sometimes omitted when the use of quotation marks resulted in very few results, e.g., for Web of Science. An article was included if (1) the entire manuscript was written in English; either (2a) a form of shared (autonomous) electric transport was considered (autonomous was not considered as a hard requirement to not limit the search, which makes sense because e.g., a non-autonomous taxi-fleet would also resemble the travel behaviour of an SAEV fleet); or (2b) V2G strategy was included; and (3) location of charging infrastructure was determined.
2.1.2. Review Stage: Part 1
An overview of the paper selection is presented in
Figure 5. The search string for CI for SAEVs and V2G delivered, respectively, a total of 767 and 834 papers among the four databases. Coarse-grained inclusion is conducted, as shown in [
33], stopping the search after a sequence of 10 titles incoherent with the subject appeared. After this, we keep a total of 198 and 569 papers for SAEVs and V2G, respectively. The papers were screened according to the abstract. When it is clear from the abstract that no optimal CI allocation is solved, the paper is not included. This leaves a total of 72 and 204, respectively, for SAEVs and V2G. This high level of reduction is due to the fact that quotation marks were omitted in the search string for some databases, which resulted in many less relevant papers. After removing duplicate papers from the collection, there are 48 papers left about CI for SAEVs, and 162 papers about CI with V2G. Finally a fine-grained inclusion is conducted, leaving only the papers that are eligible after full-text-reading. There are 23 papers left discussing the optimal CI for SAEVs, and there are 26 papers left discussing the optimal CI with implementation of V2G.
The exclusion of SAEV-related papers is because the following topics were their focus: optimization of vehicle routing [
34,
35]; trip planning [
34,
36]; or optimal CS locations were sought for non-shared non-autonomous EVs [
37,
38]. Topics in V2G-related papers that are outside our scope and therefore excluded from the review include: optimization of charge scheduling [
39,
40,
41]; allocation of battery swap stations [
42]; safe and reliable communication between the EVs and the aggregator [
43,
44,
45]; the configuration of a V2G enabled charging station [
46]; and allocation of separate energy storage systems (ESS) instead of using EVs for energy storage [
47].
Finally, after the identification of relevant research, results were extracted and are discussed in the following section.
3. Results
In this section, we provide an overview of the methods and their components used for finding the optimal locations of CSs for SAEVs and V2G. In
Figure 6, it can be seen that various methods are used, including simulation, ad hoc placement, and optimization. From here, papers with the research question to find optimal locations for CSs based on V2G functionality are called ‘V2G papers’. Papers where CS locations are sought for an SAEV fleet are called ‘SAEV papers’.
In simulation, CSs are located using an agent-based model. This method is used in some reviewed SAEV papers, but not in V2G papers. Whenever a charging demand pops up, and there is no CS for the SAEV to reach with its remaining battery range, a new CS is generated at the location of the charging demand. This type of CS siting mimics the objective of a coverage model [
48,
49,
50]. The benefit of this method is that many parameters, actions, and results can be integrated in the model and thereby can be taken into account when determining a suitable placement for CSs. The drawback of this method is that it is computationally intensive. Therefore, usually only 5–10% of real-life trips are considered. However, linear up-scaling of the simulation results may yield an overestimation of the service levels [
51] and would thereby no longer be trustworthy.
In ad hoc placement, a variable is chosen to represent the extent to which a certain location is likely to be optimal for installing a CS. This likelihood variable differs between SAEV papers and V2G papers. SAEV papers focus on mobility, with the likelihood variable varying between average parking time, total number of parking events [
52], taxi arrival rate [
53], average vehicle-hour per day, and average vehicle-hour per vehicle [
54]. The V2G papers can be divided into three groups. The first group focuses on mobility, where CSs are placed at locations with high vehicle density [
55] based on the likelihood of finding oneself at a certain location [
56], at locations with the highest dwelling time [
57], or at locations with high energy demand (based on parking events associated to a recharge) [
58]. The second group focuses on energy aspects, where CSs are located at strong buses, defined as buses with a high voltage stability index [
59], or as buses with a high bus reliability index [
60]. Finally, one paper considers both mobility and energy aspects, added with a social aspect, placing CSs at the geographic overlap of areas with solar excess generation, high convenience and accessibility for EV drivers, and a low crime index [
61]. The benefit of ad hoc placement is that it is easy to apply as it is based on one likelihood parameter. However, this simplicity also leads to a disadvantage. When only one parameter can be taken into account, the complexity of reality can never be considered to an adequate level.
Optimization is a method where an objective function is minimized or maximized, while various constraints need to be satisfied. This methodology allows for the implementation of many aspects (which was a shortcoming for ad hoc placement), while also maintaining the ability to be solved relatively quickly using suitable algorithms (which was a shortcoming for simulation). An overview of the different algorithms adopted by researchers is given in [
12]. Since optimization is the most often used strategy, this technique will be the focus of this review and a detailed overview is provided in
Section 3.1.
Figure 6.
A classification of the methodologies used for the charging infrastructure allocation problem for (
a) SAEV papers and (
b) V2G papers. reworked from [
1]. (When one paper performs multiple strategies, all strategies are included as input for this chart. Voshoogi et al. [
62] and Gacias et al. [
63] consider three and two different optimization problems, respectively. Cocca et al. [
52] perform ad hoc placement based on three different likelihood variables, and they solve one optimization problem. Cai et al. [
54] also perform ad hoc placement based on three different likelihood variables. These four papers account for a total of six optimization methodologies and six ad hoc placement methodologies in the bar chart. This is why the total considered in the bar chart for SAEVs is higher than 23.).
3.1. Optimization Problems
For solving an optimization problem, one or more decision variables and objective functions need to be chosen. Next to this, a series of constraints needs to be considered. In this subsection, we compare the decision variables, objective functions and constraints between SAEV papers and V2G papers. This way, we gain insights in the components that are required for guaranteeing a stable grid, as well as a decent mobility service. In other words, from this review, we will learn how both fields can be brought together in one optimization problem. This will be summarized in
Section 4, together with the argumentation of the importance of these components, and the advantage of taking them into consideration in the optimization model.
3.1.1. Decision Variables
In all the reviewed papers, the locations of CSs are among the decision variables as a result of our screening process. However, other decision variables have also been included in some of the papers. A detailed overview of decision variables per paper is provided in
Appendix A,
Table A1.
A first difference between SAEV papers and V2G papers regarding the CSs is that SAEV papers focus more on the number of chargers (expressed in number of CSs and/or number of chargers per CS), while V2G papers focus more on capacity. The number of chargers is more closely related to mobility, as it has more to do with chargers being available for SAEVs (with no or minimal waiting time), while the capacity of chargers is more linked to energy. This gives a first hint of the difference in perspectives between SAEV papers and V2G papers.
Another difference concerns decisions about the fleet. Some papers take decisions in the fleet size that are necessary for satisfying mobility demand [
64,
65,
66,
67,
68], in the operations of the fleet (routing [
66] and charge scheduling [
67,
69]), and in the battery capacity of the fleet [
70]. Apart from [
69], all of these papers are SAEV papers. This indicates that SAEV papers focus more on mobility than V2G papers.
On the other hand, there are a variety of additional decision variables in V2G papers, most of them with a focus on energy, such as the siting and sizing of RESs [
71,
72,
73,
74,
75,
76]. Optimally locating both CSs and RESs strengthens the synergy between them to obtain the highest level of renewable energy, which is one of the advantages of V2G. Bilal et al. [
77] optimize the locations and capacities of capacitors. They found that this improves power loss and voltage profile. Wang et al. [
78] establish a collective planning of CSs and the distribution network.
Finally, some papers optimize the locations and capacities of parking lots (PL) [
79,
80,
81], to asses the economic viability of the V2G strategy by maximizing PL owners’ profit (which will be discussed in more detail in
Section 3.1.2).
3.1.2. Objective Functions
Looking at the objective functions, we can distinguish the following five main groups: Cost, Coverage, Customer, Revenue, and Grid. These are visualized in
Figure 7, and are elaborated on in more detail in
Appendix A,
Table A2.
Cost
Cost is the most used objective function overall, appearing both in SAEV and V2G papers. Many kinds of costs can be included, such as fleet cost, installation/construction cost, the cost of energy consumption, maintenance cost, and operation cost.
Fleet cost is considered solely in SAEV papers and denotes the purchase cost of an EV, which depends on the on-board battery capacity and fleet size [
64,
65,
66,
67], or solely the cost of the battery and assembly of non-electric vehicles [
70]. It must be noted that both the on-board battery capacity and the fleet size of an SAEV affect the required amount of CSs [
68,
82]. For the owner of an SAEV fleet, both fleet cost and installation cost are relevant factors to take into account.
Installation cost expresses the purchase of an CS, and sometimes also the construction of a parking place and the grid-connectivity construction. Including this cost in the objective function guarantees that the amount of CSs is limited to the necessary, and that CSs are integrated as much as possible in the existing distribution grid. This aspect is considered by both SAEV papers [
64,
66,
67,
68,
70,
83,
84,
85] and V2G papers [
77,
78,
79,
86,
87,
88].
The cost of energy consumption consists of the cost of charging a vehicle and the rebalancing cost. This cost is considered both by SAEV papers [
64,
67,
68,
83,
89] and V2G papers [
69,
71,
72,
86,
88], and is mainly used to schedule the charging (and discharging in a V2G context) scheme with volatile energy prices. In an SAEV context, this objective function ensures that CSs are located conveniently, avoiding large detours to reach a CS since this would increase energy consumption costs and rebalancing costs [
68].
The maintenance and operation cost is applicable both to vehicles and to the distribution network. For vehicles, this cost is related to the travel distance (VKT) and the battery degradation. Next to optimal routing purposes, travel distance (considered for SAEVs [
64,
67,
68]) is also influenced by the location of CSs. Battery degradation is a known issue in V2G and therefore important to take into consideration [
86,
87]. For the distribution network, this cost refers to the maintenance and operation of feeders and substations [
79].
Coverage
Three types of coverage can be maximized. These are the geographical coverage by CSs [
52,
62,
63,
82,
90,
91], the coverage of mobility demand [
62,
63,
89], and the coverage of traffic flow [
78]. All of these objective functions are related to mobility and used in SAEV papers, except for [
78] which is a V2G paper. In geographical coverage, CSs are uniformly distributed over the area, guaranteeing a scattered distribution. This provides the advantage that all areas have the ability to access CSs. However, this method is slightly controversial, as charging demand is usually not uniformly distributed. Therefore, it is essential to measure charging demand. Mobility demand, traffic flow, and charging demand are likely to coincide. Therefore, maximizing coverage of mobility demand and traffic flow will result in placing CSs there where they are needed the most. However, if mobility demand/traffic flow is the only measure taken into account, the model risks densely clustering CSs, leaving other areas completely unsatisfied. Therefore, a combination of both coverage methods would be recommended.
Customer
Customer convenience means a minimal waiting time and a maximal number of satisfied trips, and is only considered in SAEV papers [
52,
68,
85,
92], where serving the requested mobility in an enjoyable way is a main concern. With this objective function, CSs will most likely be placed in areas where the SAEVs are located, and is therefore similar to coverage of mobility demand, with similar benefits and disadvantages. In V2G papers, this objective function is not considered.
Revenue
Revenue focuses on profits that can be made by participating in V2G, and therefore, it is not surprising that this function is only considered in V2G papers. Several stakeholders that can potentially profit from V2G implementation are considered in the reviewed papers. It is important to assess the financial viability of the V2G strategy in order to convert this theory into practice. This objective function is meaningful for stakeholders that are interested in setting up a system where V2G services are delivered, and want to maximize their profit in this system. The treated stakeholders are PL owners [
79,
80,
81], distribution companies (DisCo) [
73,
74,
75], privately owned renewable energy systems (WG/PV) [
73,
74,
75], and energy storage (ES) owners [
75]. The calculations of their revenue are shown in
Table 2.
Grid
Grid impacts are considered as an objective function solely in V2G papers. These include mainly power or energy losses [
69,
71,
72,
75,
77,
78,
79,
80,
87,
88,
93,
94], and voltage deviation [
71,
72,
87,
93,
94]. Grid impacts are an essential aspect to take into account when placing CSs, as the location of CSs has an impact on the smooth operations of the grid [
95,
96]. Power or energy losses, however, can also be seen as a cost, since it represents energy that is paid for but not received. In some papers, network losses are seen as a part of total cost or revenue, as they only care for the financial loss [
75,
78,
79,
80].
3.1.3. Constraints
Constraints are equations or inequalities that need to be satisfied when solving the optimization problem. Some of them represent fundamental technicalities such as consistency (e.g., the fact that a customer may only depart the origin location if an empty seat in a vehicle is available), continuity (e.g., flow conservation, which means that vehicles/power entering a node must exit the same node), and integer constraints. These types of constraints are not included in the review.
Next to the technical constraints, there are several constraints specific to the problem that needs to be solved or to the point of view that is taken. A detailed overview is given in
Appendix A,
Table A3. Shown in
Figure 8 are the following six main groups of constraints: SOC, CS, Mobility, Budget, Charging, and Energy.
SOC
There are three types of SOC constraints. The first type is a constraint that claims that the SOC at the end of each operation cycle should be equal to the SOC at the beginning of that cycle. This ensures periodicity and mainly occurs in SAEV papers [
65,
67,
70]. The second type imposes a desired SOC for departure. Usually, this means an SOC of 100% when leaving the depot. This constraint mainly occurs in SAEV papers [
66,
67,
68,
92], since they are concerned with the operations of the SAEV fleet that needs to be able to serve mobility demand. The constraint is also considered in one V2G paper [
79]. The third type is a constraint that imposes upper (usually 80%) and lower (usually 20%) limits on the SOC. Bounds on the SOC are mainly to prevent battery damage due to overcharging and deep discharging. For V2G papers [
73,
74,
75,
79,
81,
94] this is an important constraint, because the higher number of cycles—due to participating in V2G—already causes battery degradation. The lower limit can also serve as a threshold. Is the SOC below the threshold, G2V starts. If the SOC is higher than the threshold, V2G starts [
80]. For SAEV papers [
62,
66,
70,
85,
92,
97], the lower limit also serves as a threshold to initiate the search for a CS and thus to generate charging demand.
CS
CS constraints are present in both the SAEV and V2G papers. These constraints all represent the size of the charging infrastructure. Limits or fixed values are placed on a number of variables, such as the number of CSs (mostly used in SAEV papers [
62,
80,
89,
92,
97]), and the capacity of the CS (mostly used in V2G papers) expressed in kW [
86] or in the number of charging points or parking places (usually restricted because of available place) [
70,
71,
72,
74,
78,
79,
80,
83,
88]. The upper limit on number of CSs can also be understood as a budget constraint (see later).
Mobility
The Mobility constraint imposes that all mobility requests must be satisfied. This constraint is considered by several SAEV papers [
64,
65,
66,
67,
68], but completely ignored by V2G papers. CSs must be located in regions with a high mobility demand to prevent SAEVs from needing to make a large detour to fulfil their charging needs. However, note that the same risk applies here as for the objective function coverage of mobility demand. Additionally, an SAEV fleet being able to satisfy all mobility demand depends on other factors as well. Firstly the fleet must be large enough, which is why in all these papers fleet size is optimized along with the CS locations. Secondly, there is a need for efficient vehicle routing and charge scheduling, which is why in some cases this is optimized along with the CS locations [
65,
66,
67].
Budget
Budget is a type of constraint used by SAEV papers to limit cost. A way to do this is by imposing a maximal budget that can be spent [
97]. Another way to do this is by fixing the total number of CSs beforehand [
52,
82,
90,
91]. For SAEV papers that maximize coverage or customer convenience, this is an important constraint to make sure that the number of located CSs does not exceed the requirements.
Charging
Charging constraints are mainly present in SAEV papers, but also in one V2G paper. This type occurs in two forms: first as a constraint that imposes that all charging demand must be satisfied [
64,
94,
97], and secondly as a constraint that chooses a daily charging reject rate (i.e., the probability that the vehicle cannot be charged at any of the charging stations without waiting) [
82,
84]. Again, assuming that charging demand occurs where there is high mobility demand, adding this constraint would have similar results as using objective function coverage of mobility demand.
Energy
Three types of energy-related constraints are considered. The first one limits the range of the
voltage profile (usually between 0.95 ppu and 1.05 ppu). This constraint is considered in one SAEV paper [
89] and almost all V2G papers [
69,
71,
72,
73,
74,
76,
77,
78,
79,
81,
86,
87,
88,
93,
94,
98,
99]. The second constraint is the so called
thermal constraint, which imposes an upper limit on the power or current running through transmission lines [
69,
71,
72,
73,
74,
77,
78,
79,
81,
88,
93,
94,
98,
99]. The third constraint takes the
power capacity of the substation into account [
73,
78,
79,
86]. The two latter Energy constraints are only considered in V2G papers. These constraints serve as a worthy alternative to the grid impacts objective function. Either of the two should be incorporated in the optimization model in order to guarantee smooth grid operations.
4. Discussion
Looking at the objective functions, we see that the overall cost of charging infrastructure is an important objective function both for SAEVs and V2G. However disregarding this function, we clearly see an overall trend appearing in
Figure 9a: the more important the objective function is considered to be in the SAEV papers, the less important it is in the V2G papers, and vica versa. Next to this, we see that SAEV papers mainly focus on mobility service (coverage and customer convenience), while V2G papers pay much attention to grid impacts and economic feasibility by looking at business models (revenue).
Looking at the constraints in
Figure 9b, we see that both SOC and CS constraints are important for SAEV and V2G papers. However, for the other constraints, we notice a similar trend as with the objective functions, i.e., importance is inversely proportional between SAEV and V2G papers. Where SAEV papers focus again more on mobility, V2G papers deem energy constraints most important.
Moreover, when SAEV papers do not have cost as an objective function to minimize, they need budget constraints to prevent the number of CSs from blowing up. The reviewed V2G papers did not need this kind of constraint.
From this research, it is clear that SAEV papers tend to ignore grid impacts and constraints, while V2G papers on their side usually do not take mobility aspects into account.
5. Research Agenda
The link between SAEV and V2G is still missing and must be bridged in future research. This section provides an answer to how we can bring both fields together in one optimization problem, and thereby improve current optimization models to suit an SAEV-V2G context. From this review, we detect six elements that are needed:
Avoid placing too many CSs;
Take restrictions on the power grid into consideration;
Satisfy charging and mobility demand;
Impose limits on the SOC to slow down battery degradation;
Higher integration of renewable energy;
Bring services to the grid.
5.1. Avoid Placing Too Many CSs
There are various ways to avoid placing an excessive amount of CSs. The first way is to include cost in the objective function. Installing a CS is expensive. By minimizing the total cost, the number of CSs will be limited to the minimum amount that is necessary to perform the needed SAEV and V2G operations. A second manner to limit CSs is by imposing a maximum allowed budget via a budget constraint. All expenses, including the construction of CSs, must stay below this limit. A third approach is to take the grid restrictions into account. A CS acts as an extra load in the distribution network. Too many CSs can cause instabilities in the grid. Therefore, minimizing grid impacts in the objective function or including grid constraints can help to bound the number of CSs.
Cost is a popular overlapping objective function for the allocation of SAEV’s and V2G’s CSs, which can be used to place CSs in the most efficient way. Efficient in this context means enough but not an excess of CSs to enable the SAEV fleet to perform their mobility and V2G operations. Depending on the goal, different kinds of cost must be included in the objective function of the optimization model. For instance, for the owner of an SAEV fleet who is also responsible for installing CSs, the costs that need to be considered are installation costs, fleet costs, maintenance and operation costs, and energy consumption costs. However for a distribution company, costs related to the fleet of SAEVs are irrelevant.
5.2. Restrictions on the Power Grid
We can respect the restrictions on the grid in two ways. Firstly, grid impacts can be minimized in the objective function. These grid impacts mainly include power losses and voltage deviation. When these are minimized, the damage to the grid is minimized as well. A second way is by imposing constraints related to the grid restrictions, such as limiting the voltage profile (related to minimizing voltage deviation) and power flowing through lines (related to minimizing power losses).
The benefit of using the objective function is that the goal is to optimally respect the grid restrictions. The advantage of using constraints is that when finding a feasible solution, it is assured that for this solution that the limits are respected.
5.3. Satisfy Charging/Mobility Demand
For an SAEV fleet to be accepted by customers, it is important that the fleet serves the customers’ mobility demand as well as possible. This can be incorporated in the optimization problem in different ways. The first way is to choose satisfied trips as an objective function and maximize this. A second way is to set a constraint that all mobility must be served (with a certain maximal waiting time). However, when the maximum allowed waiting time is too small, this constraint can lead to a lack of feasible solutions to the problem.
In order to move towards installing CSs, it is important to investigate how mobility demand can be converted into charging demand of an SAEV fleet. When charging demand is mapped in time and space, it is possible to impose a constraint that all SAEVs’ charging demand must be satisfied, to limit the maximal allowed charging reject rate, or to maximize satisfied charging needs as objective function.
Finally, with this component, it is crucial to avoid a situation where CSs are clustered too densely together, possibly leaving certain areas neglected.
5.4. Limits on SOC
It is important to avoid overcharging and deep discharging of the SAEVs’ battery in order to limit battery degradation. To accomplish this, upper and lower limits should be imposed on the SOC and be included as constraints of the optimization problem. For SAEVs that are performing trips, this lower bound serves as a threshold to indicate that the SAEV should find a charging opportunity. In V2G operations, the lower bound acts as a threshold that decides when the SAEV should switch from discharging (V2G) to charging (G2V). In an SAEV fleet with V2G operations, this is an important constraint to take into account.
5.5. Higher Integration of Renewable Energy
A large penetration of renewable energy in the energy mix is important to reach the potential reduction in GHG emissions in a world with SAEVs and V2G. Therefore, it is important to implement RESs in the grid and investigate their optimal locations and capacities. This can be achieved by adding the locations and capacities of RESs to the decision variables of the optimization model, which some researchers have already carried out in V2G papers [
71,
72,
73,
74,
75,
76,
87].
5.6. Bring Services to the Grid
EVs can bring ancillary services to the grid in order to limit the damage caused by charging many EVs. It is important to investigate where the grid could use this extra support.
6. Conclusions
The ability of SAEVs to reduce GHG emissions, together with the ability of V2G to assist in the grid and increase the share of RESs in electricity generation, makes it an interesting topic to explore the potential of an SAEV fleet participating in V2G services. We aimed to research how to find the optimal CI allocation for an SAEV-V2G system. However, to the best of the authors’ knowledge, no research has been conducted on the optimal CI allocation for the combination of both components. Therefore, this paper reviews papers that optimize the locations of CSs for SAEVs and V2G separately. The aim of this paper is to present a review of the current trends in charging infrastructure planning for SAEVs and for V2G purposes, to identify an overlap between the models for SAEV CI and V2G CI, and to present an approach to combine both fields. Three main methods for locating CSs were identified: simulation, ad hoc placement, and optimization models. It was observed that optimization models are the most popular method to locate CSs both for SAEV and V2G.
An overview of frequently used objective functions and constraints showed an overlap between SAEV and V2G optimization models. In both fields, cost appeared to be an important element to take into consideration. However, the overview also revealed a contrast in perspective taken by SAEV CI optimizers and V2G CI optimizers. SAEV papers focus on mobility, usually ignoring grid requirements and limitations. V2G papers on the other hand take the grid into account, but tend to forget about mobility requirements. To bridge this gap, this paper identified the most important elements for a CI optimization model where the SAEV side and the V2G side are combined.
It was found that six major components should be incorporated in a CI allocation optimization model for SAEVs with V2G operations, consisting of both mobility and grid components. These components are:
Restrict the number of CSs;
Take restrictions on the power grid into consideration;
Satisfy charging and mobility demand for the SAEVs;
Impose limits on the SOC to slow down battery degradation;
Integrate RESs in the decision variables;
Bring services to the grid.
For each of these components, the utility, advantages, and possible risks were discussed. To the best of the author’s knowledge, studies in the current literature only cover part of these components. Their research is appropriate to serve their specific goal. However, in the future, it would be interesting to explore the combination of SAEVs and V2G, and to find a method to optimally place CSs for this matter. To reach this goal, future research should try to incorporate all of the components presented in this paper. This overview can serve as a guideline for future researchers to determine the optimal placement of CSs for SAEVs with V2G operations.
Author Contributions
Conceptualization, O.V.d.b., C.D.C. and L.V.; methodology, O.V.d.b.; validation, O.V.d.b.; formal analysis, O.V.d.b.; investigation, O.V.d.b.; writing—original draft preparation, O.V.d.b.; writing—review and editing, O.V.d.b., S.W., C.D.C. and L.V.; visualization, O.V.d.b.; supervision, L.V. All authors have read and agreed to the published version of the manuscript.
Funding
This research received no external funding.
Data Availability Statement
Data sharing not applicable.
Conflicts of Interest
The authors declare no conflict of interest.
Abbreviations
The following abbreviations are used in this manuscript:
| CS | Charging Station |
| CI | Charging Infrastructure |
| GHG | Greenhouse gas |
| PV | Photovoltaics |
| RES | Renewable Energy Source |
| SAEV | Shared Autonomous Electric Vehicle |
| SAEV CI | Charging infrastructure for an SAEV fleet |
| V2G | Vehicle-to-grid |
| V2G CI | Charging Infrastructure for V2G purposes |
| WG | Wind Generation |
Appendix A
Table A1.
The different decision variables considered by SAEV and V2G papers.
Table A1.
The different decision variables considered by SAEV and V2G papers.
| | | Decision Variable |
|---|
| | | CS | Fleet | RES | PL | Cap. 1 | Subst. 2 | Other |
|---|
| Paper | Location | Capacity | No. Chargers | Power Level | Track Length (When Inductive) | Size | Charging Schedule | Routing | Battery Capacity | Location | Capacity | Size Hybrid RESs | Location | Capacity | No. Chargers | Location | Capacity | Location | Capacity | Service Area | Location Aggregator |
|---|
| SAEV | [52] | ✓ | | ✓ | | | | | | | | | | | | | | | | | | |
| [62] | ✓ | | | | | | | | | | | | | | | | | | | | |
| [63] | ✓ | | | | | | | | | | | | | | | | | | | | |
| [64] | ✓ | | ✓ | | | ✓ | | | | | | | | | | | | | | | |
| [65] | ✓ | | ✓ | | | ✓ | | | | | | | | | | | | | | | |
| [66] | ✓ | | | | | ✓ | | ✓ | | | | | | | | | | | | | |
| [67] | ✓ | | ✓ | | | ✓ | ✓ | | | | | | | | | | | | | | |
| [70] | ✓ | | ✓ | ✓ | ✓ | | | | ✓ | | | | | | | | | | | | |
| [83] | ✓ | | ✓ | | | | | | | | | | | | | | | | | | |
| [84] | ✓ | | ✓ | | | | | | | | | | | | | | | | | | |
| [85] | ✓ | | ✓ | | | | | | | | | | | | | | | | | ✓ | |
| [68] | ✓ | | ✓ | | | ✓ | | | | | | | | | | | | | | | |
| [89] | ✓ | | ✓ | | | | | | | | | | | | | | | | | | |
| [90] | ✓ | | | | | | | | | | | | | | | | | | | | |
| [82] | ✓ | | | | | | | | | | | | | | | | | | | | |
| [91] | ✓ | | ✓ | | | | | | | | | | | | | | | | | | |
| [92] | ✓ | | | | | | | | | | | | | | | | | | | | |
| [97] | ✓ | | ✓ | | | | | | | | | | | | | | | | | | |
| V2G | [99] | ✓ | | | | | | | | | | | | | | | | | | | | |
| [77] | ✓ | ✓ | | | | | | | | | | | | | | ✓ | ✓ | | | | |
| [86] | ✓ | ✓ | | | | | | | | | | | | | | | | | | | |
| [87] | | | | | | | | | | | | ✓ | ✓ | | | | | | | | |
| [88] | ✓ | ✓ | | | | | | | | | | | | | | | | | | | |
| [78] | ✓ | ✓ | | | | | | | | | | | | | | | | ✓ | ✓ | | |
| [79] | | | | | | | | | | | | | ✓ | ✓ | | | | | | | |
| [69] | | | | | | | ✓ | | | | | | | | | | | | | | ✓ |
| [71] | ✓ | ✓ | | | | | | | | ✓ | | | | | | | | | | | |
| [72] | ✓ | ✓ | | | | | | | | ✓ | ✓ | | | | | | | | | | |
| [80] | | | | | | | | | | | | | ✓ | | ✓ | | | | | | |
| [81] | | | | | | | | | | | | | ✓ | | | | | | | | |
| [73] | ✓ | | | | | | | | | ✓ | ✓ | | | | | | | | | | |
| [74] | ✓ | | | | | | | | | ✓ | | | | | | | | | | | |
| [75] | ✓ | ✓ | | | | | | | | ✓ | ✓ | | | | | | | | | | |
| [93] | ✓ | | | | | | | | | | | | | | | | | | | | |
| [94] | ✓ | | | | | | | | | | | | | | | | | | | | |
| [98] | | | | | | | | | | | | | | | | | | | | | ✓ |
| [76] | ✓ | ✓ | | | | | | | | ✓ | ✓ | | | | | | | | | | |
Table A2.
The different objective functions considered by SAEV and V2G papers. + = maximize; - = minimize.
Table A2.
The different objective functions considered by SAEV and V2G papers. + = maximize; - = minimize.
| | | Objective Function |
|---|
| | | Cost | Coverage | Customer | Revenue | Grid | Other |
|---|
| Paper | - Fleet | - CS Installation | - Energy Consumption | - Vehicle Maintenance | - CS Operating Cost | - Network Operation and Maintenance | - Distance to CS | + Demand | + Traffic Flow | - Waiting Time | + Satisfied Trips | + Served Trip Distance | + Parking Lot Owner | + Distribution Company | + Private System 1 | + ES Owner | - Power Losses | - Voltage Deviation | + Satisfied Charging | - Wasted Time 2 | + Charging Time | - VKT |
|---|
| SAEV | [52] | | | | | | | ✓ | | | | ✓ | | | | | | | | | | | |
| [62] | | | | | | | ✓ | ✓ | | | | | | | | | | | | | | |
| [63] | | | | | | | ✓ | ✓ | | | | | | | | | | | | | | |
| [64] | ✓ | ✓ | ✓ | ✓ | | | | | | | | | | | | | | | | | | |
| [65] | ✓ | | ✓ | ✓ | | | | | | | | | | | | | | | | | | |
| [66] | ✓ | ✓ | | | | | | | | | | | | | | | | | | | | ✓ |
| [67] | ✓ | ✓ | ✓ | ✓ | | | | | | | | | | | | | | | | | | |
| [70] | ✓ | ✓ | | | | | | | | | | | | | | | | | | | | |
| [83] | | ✓ | ✓ | | | | | | | | | | | | | | | | | | | |
| [84] | | ✓ | | | | | | | | | | | | | | | | | | | | |
| [85] | | ✓ | | | | | | | | | | ✓ | | | | | | | ✓ | | ✓ | |
| [68] | | ✓ | ✓ | ✓ | | | | | | ✓ | | | | | | | | | | | | |
| [89] | | | ✓ | | | | | ✓ | | | | | | | | | | | | | | |
| [90] | | | | | | | ✓ | | | | | | | | | | | | | | | |
| [82] | | | | | | | ✓ | | | | | | | | | | | | | | | |
| [91] | | | | | | | ✓ | | | | | | | | | | | | | | | |
| [92] | | | | | | | | | | | ✓ | | | | | | | | | | | |
| [97] | | | | | | | | | | | | | | | | | | | | ✓ | | |
| V2G | [99] | | | | | | | | | | | | | | | | | ✓ | | | | | |
| [77] | | ✓ | | | ✓ | | | | | | | | | | | | ✓ | | | | | |
| [86] | | ✓ | ✓ | ✓ | | | | | | | | | | | | | | | | | | |
| [87] | | ✓ | | ✓ | | | | | | | | | | | | | ✓ | ✓ | | | | |
| [88] | | ✓ | ✓ | | | | | | | | | | | | | | ✓ | | | | | |
| [78] | | ✓ | | | | | | | ✓ | | | | | | | | ✓ | | | | | |
| [79] | | ✓ | | | | ✓ | | | | | | | | | | | ✓ | | | | | |
| [69] | | | ✓ | | | | | | | | | | ✓ | | | | ✓ | | | | | |
| [71] | | | ✓ | | | | | | | | | | | | | | ✓ | ✓ | | | | |
| [72] | | | ✓ | | | | | | | | | | | | | | ✓ | ✓ | | | | |
| [80] | | | | | | | | | | | | | ✓ | | | | ✓ | | | | | |
| [81] | | | | | | | | | | | | | ✓ | | | | ✓ | | | | | |
| [73] | | | | | | | | | | | | | | ✓ | ✓ | | | | | | | |
| [74] | | | | | | | | | | | | | | ✓ | ✓ | | | | | | | |
| [75] | | | | | | | | | | | | | | ✓ | ✓ | ✓ | | ✓ | | | | |
| [93] | | | | | | | | | | | | | | | | | ✓ | ✓ | | | | |
| [94] | | | | | | | | | | | | | | | | | ✓ | ✓ | | | | |
| [98] | | | | | | | | | | | | | | | | | ✓ | | | | | |
| [76] | | | | | | | | | | | | | | | | | ✓ | | | | | |
Table A3.
The different constraints considered by SAEV and V2G papers. L = lower limit; U = upper limit.
Table A3.
The different constraints considered by SAEV and V2G papers. L = lower limit; U = upper limit.
| | | Constraint |
|---|
| | | SOC | CS | Mobility | Budget | Charging | Energy | Other |
|---|
| Paper | Periodicity | Departure SOC | SOC (L) | SOC (U) | No. CSs (U) | No. Chargers per CS | Capacity PL (U) | Power Capacity CS | Capacity CS | Satisfy All Demand | Maximal Budget | Fixed Number of CSs | Satisfy All Demand | Reject Rate (U) | Voltage Profile (LU) | Line Limit (U) | Capacity Substation | RES Generation (LU) |
|---|
| SAEV | [52] | | | | | | | | | | | | ✓ | | | | | | |
| [62] | | | ✓ | ✓ | ✓ | | | | | | | | | | | | | |
| [63] | | | | | ✓ | | | | | | | | | | | | | |
| [64] | | | | | | | | | | ✓ | | | ✓ | | | | | |
| [65] | ✓ | | | | | | | | | ✓ | | | | | | | | |
| [66] | | ✓ | ✓ | | | | | | | ✓ | | | | | | | | |
| [67] | ✓ | ✓ | | | | | | | | ✓ | | | | | | | | |
| [70] | ✓ | | ✓ | ✓ | | ✓ | | | | | | | | | | | | |
| [83] | | | | | | ✓ | | | | | | | | | | | | |
| [84] | | | | | | | | | | | | | | ✓ | | | | |
| [85] | | | ✓ | | | | | | | | | | | | | | | |
| [68] | | ✓ | | | | | | | | ✓ | | | | | | | | |
| [89] | | | | | ✓ | | | | | | | | | | ✓ | | | |
| [90] | | | | | | | | | | | | ✓ | | | | | | |
| [82] | | | | | | | | | | | | ✓ | | ✓ | | | | |
| [91] | | | | | | | | | | | | ✓ | | | | | | ✓ |
| [92] | | ✓ | ✓ | ✓ | ✓ | | | | | | | | | | | | | |
| [97] | | | ✓ | | ✓ | | | | | | ✓ | | ✓ | | | | | |
| V2G | [99] | | | | | | | | | | | | | | | ✓ | ✓ | | |
| [77] | | | | | | | | | | | | | | | ✓ | ✓ | | |
| [86] | | | | | | | | ✓ | | | | | | | ✓ | | ✓ | |
| [87] | | | | | | | | | | | | | | | ✓ | | | |
| [88] | | | | | | | | | ✓ | | | | | | ✓ | ✓ | | |
| [78] | | | | | | ✓ | | | | | | | | | ✓ | ✓ | ✓ | |
| [79] | | ✓ | ✓ | ✓ | | | ✓ | | | | | | | | ✓ | ✓ | ✓ | |
| [69] | | | | | | | | | | | | | | | ✓ | ✓ | | |
| [71] | | | | | | | | | ✓ | | | | | | ✓ | ✓ | | ✓ |
| [72] | | | | | | | | | ✓ | | | | | | ✓ | ✓ | | ✓ |
| [80] | | | ✓ | | ✓ | | ✓ | | | | | | | | | | | |
| [81] | | | | ✓ | | | | | | | | | | | ✓ | ✓ | | |
| [73] | | | ✓ | ✓ | | | | | | | | | | | ✓ | ✓ | ✓ | |
| [74] | | | ✓ | ✓ | | | | | ✓ | | | | | | ✓ | ✓ | | |
| [75] | | | ✓ | ✓ | | | | | | | | | | | | | | |
| [93] | | | | | | | | | | | | | | | ✓ | ✓ | | |
| [94] | | | ✓ | ✓ | | | | | | | | | ✓ | | ✓ | ✓ | | |
| [98] | | | | | | | | | | | | | | | ✓ | ✓ | | |
| [76] | | | | | | | | | | | | | | | ✓ | | | |
References
- Van den bergh, O.; De Cauwer, C.; Vanhaverbeke, L. Vehicle-to-grid strategy for shared autonomous electric vehicles: A review of the charging infrastructure’s impacts on energy and mobility. In Proceedings of the 35th International Electric Vehicle Symposium and Exhibition (EVS35), Oslo, Norway, 11–15 June 2022. [Google Scholar]
- European Network of Transmission System Operators for Electricity. ENTSO-E Position Paper on Electric Vehicle Integration into Power Grids; European Network of Transmission System Operators for Electricity: Brussels, Belgium, 2021; pp. 4–60. [Google Scholar]
- European Environment Agency. Transport and Environment Report 2021; Number 02; European Environment Agency: Copenhagen, Denmark, 2022. [Google Scholar]
- Van Mierlo, J.; Messagie, M.; Rangaraju, S. Comparative environmental assessment of alternative fueled vehicles using a life cycle assessment. Transp. Res. Procedia 2017, 25, 3435–3445. [Google Scholar] [CrossRef]
- European Environment Agency. Electric Vehicles from Life Cycle and Circular Economy Perspectives; Number 13; European Environment Agency: Copenhagen, Denmark, 2018; pp. 1–78. [Google Scholar]
- Sheppard, C.J.; Jenn, A.T.; Greenblatt, J.B.; Bauer, G.S.; Gerke, B.F. Private versus shared, automated electric vehicles for U.S. personal mobility: Energy use, greenhouse gas emissions, grid integration, and cost impacts. Environ. Sci. Technol. 2021, 55, 3229–3239. [Google Scholar] [CrossRef] [PubMed]
- Greenwald, J.M.; Kornhauser, A. It’s up to us: Policies to improve climate outcomes from automated vehicles. Energy Policy 2019, 127, 445–451. [Google Scholar] [CrossRef]
- El-Bayeh, C.Z.; Alzaareer, K.; Aldaoudeyeh, A.M.I.; Brahmi, B.; Zellagui, M. Charging and discharging strategies of electric vehicles: A survey. World Electr. Veh. J. 2021, 12, 11. [Google Scholar] [CrossRef]
- Deb, S.; Tammi, K.; Gao, X.Z.; Kalita, K.; Mahanta, P. A Hybrid Multi-Objective Chicken Swarm Optimization and Teaching Learning Based Algorithm for Charging Station Placement Problem. IEEE Access 2020, 8, 92573–92590. [Google Scholar] [CrossRef]
- Ravi, S.S.; Aziz, M. Utilization of Electric Vehicles for Vehicle-to-Grid Services: Progress and Perspectives. Energies 2022, 15, 589. [Google Scholar] [CrossRef]
- Deb, S.; Tammi, K.; Kalita, K.; Mahanta, P. Charging Station Placement for Electric Vehicles: A Case Study of Guwahati City, India. IEEE Access 2019, 7, 100270–100282. [Google Scholar] [CrossRef]
- Deb, S.; Tammi, K.; Kalita, K.; Mahanta, P. Review of recent trends in charging infrastructure planning for electric vehicles. Wires Energy Environ. 2018, 7, 1–26. [Google Scholar] [CrossRef] [Green Version]
- European Environment Agency. EU Renewable Electricity Has Reduced Environmental Pressures; Targeted Actions Help Further Reduce Impacts; Technical Report; European Environment Agency: Copenhagen, Denmark, 2021. [Google Scholar]
- Bossmann, T.; Barberi, P.; Fournié, L. Effect of High Shares of Renewables on Power Systems; EU Commission: Brussels, Belgium, 2018. [Google Scholar]
- Sheha, M.; Mohammadi, K.; Powell, K. Solving the duck curve in a smart grid environment using a non-cooperative game theory and dynamic pricing profiles. Energy Convers. Manag. 2020, 220, 113102. [Google Scholar] [CrossRef]
- California Independent System Operator. What the Duck Curve Tells Us About Managing a Green Grid; California Independent System Operator: Folsom, CA, USA, 2016. [Google Scholar]
- Garruto, R.; Longo, M.; Yaïci, W.; Foiadelli, F. Connecting parking facilities to the electric grid: A vehicle-to-grid feasibility study in a railway station’s car park. Energies 2020, 13, 3083. [Google Scholar] [CrossRef]
- Hannan, M.A.; Mollik, M.S.; Al-Shetwi, A.Q.; Rahman, S.A.; Mansor, M.; Begum, R.A.; Muttaqi, K.M.; Dong, Z.Y. Vehicle to grid connected technologies and charging strategies: Operation, control, issues and recommendations. J. Clean. Prod. 2022, 339, 130587. [Google Scholar] [CrossRef]
- Zhou, Y.; Li, X. Vehicle to grid technology: A review. In Proceedings of the 34th Chinese Control Conference (CCC), Hangzhou, China, 28–30 July 2015; pp. 9031–9036. [Google Scholar] [CrossRef]
- Shariff, S.M.; Iqbal, D.; Saad Alam, M.; Ahmad, F. A State of the Art Review of Electric Vehicle to Grid (V2G) technology. IOP Conf. Ser. Mater. Sci. Eng. 2019, 561, 012103. [Google Scholar] [CrossRef]
- Powell, S.; Cezar, G.V.; Min, L.; Azevedo, I.M.; Rajagopal, R. Charging infrastructure access and operation to reduce the grid impacts of deep electric vehicle adoption. Nat. Energy 2022, 7, 932–945. [Google Scholar] [CrossRef]
- Muratori, M. Impact of uncoordinated plug-in electric vehicle charging on residential power demand. Nat. Energy 2018, 3, 193–201. [Google Scholar] [CrossRef]
- Zagrajek, K. A Survey Data Approach for Determining the Probability Values of Vehicle-to-Grid Service Provision. Energies 2021, 14, 7270. [Google Scholar] [CrossRef]
- Hertwich, E.; Lifset, R.; Pauliuk, S.; Heeren, N.; Ali, S.; Tu, Q.; Ardente, F.; Berrill, P.; Fishman, T.; Kanaoka, K.; et al. Resource Efficiency and Climate Change: Material Efficiency Strategies for a Low-Carbon Future; United Nations Environment Programme: Nairobi, Kenya, 2020. [Google Scholar] [CrossRef]
- Pan, S.; Fulton, L.M.; Roy, A.; Jung, J.; Choi, Y.; Gao, H.O. Shared use of electric autonomous vehicles: Air quality and health impacts of future mobility in the United States. Renew. Sustain. Energy Rev. 2021, 149, 111380. [Google Scholar] [CrossRef]
- Coppola, A.; Lui, D.G.; Petrillo, A.; Santini, S. Eco-Driving Control Architecture for Platoons of Uncertain Heterogeneous Nonlinear Connected Autonomous Electric Vehicles. IEEE Trans. Intell. Transp. Syst. 2022, 23, 24220–24234. [Google Scholar] [CrossRef]
- Sossan, F.; Mukherjee, B.; Hu, Z. Impact of the Charging Demand of Electric Vehicles on Distribution Grids: A Comparison between Autonomous and Non-Autonomous Driving. In Proceedings of the 2020 15th International Conference on Ecological Vehicles and Renewable Energies (EVER), Monte-Carlo, Monaco, 10–12 September 2020. [Google Scholar] [CrossRef]
- Weiss, J.; Hledik, R.; Lueken, R.; Lee, T.; Gorman, W. The electrification accelerator: Understanding the implications of autonomous vehicles for electric utilities. Electr. J. 2017, 30, 50–57. [Google Scholar] [CrossRef]
- Sovacool, B.K.; Kester, J.; Noel, L.; Zarazua de Rubens, G. Actors, business models, and innovation activity systems for vehicle-to-grid (V2G) technology: A comprehensive review. Renew. Sustain. Energy Rev. 2020, 131, 109963. [Google Scholar] [CrossRef]
- Melendez, K.A.; Das, T.K.; Kwon, C. Optimal operation of a system of charging hubs and a fleet of shared autonomous electric vehicles. Appl. Energy 2020, 279, 115861. [Google Scholar] [CrossRef]
- Iacobucci, R.; McLellan, B.; Tezuka, T. Optimization of shared autonomous electric vehicles operations with charge scheduling and vehicle-to-grid. Transp. Res. Part Emerg. Technol. 2019, 100, 34–52. [Google Scholar] [CrossRef]
- Bask, A.; Rajahonka, M. The role of environmental sustainability in the freight transport mode choice: A systematic literature review with focus on the EU. Int. J. Phys. Distrib. Logist. Manag. 2017, 47, 560–602. [Google Scholar] [CrossRef]
- Mualla, Y.; Najjar, A.; Daoud, A.; Galland, S.; Nicolle, C.; Yasar, A.U.H.; Shakshuki, E. Agent-based simulation of unmanned aerial vehicles in civilian applications: A systematic literature review and research directions. Future Gener. Comput. Syst. 2019, 100, 344–364. [Google Scholar] [CrossRef]
- Hoché, T.; Barth, D.; Mautor, T.; Burghout, W. Charging management of shared taxis: Neighbourhood search for the E-ADARP. In Proceedings of the 2020 IEEE 23rd International Conference on Intelligent Transportation Systems (ITSC), Rhodes, Greece, 20–23 September 2020. [Google Scholar] [CrossRef]
- Yi, Z.; Smart, J.; Shirk, M. Energy impact evaluation for eco-routing and charging of autonomous electric vehicle fleet: Ambient temperature consideration. Transp. Res. Part Emerg. Technol. 2018, 89, 344–363. [Google Scholar] [CrossRef]
- Shaikh, P.W.; Mouftah, H.T. Connected and Autonomous Electric Vehicles Charging Reservation and Trip Planning System. In Proceedings of the 2021 International Wireless Communications and Mobile Computing (IWCMC), Harbin City, China, 28 June–2 July 2021; pp. 1135–1140. [Google Scholar] [CrossRef]
- Datta, A.; Ledbetter, B.K.; Rahman, M.A. Optimal Deployment of Charging Stations for Electric Vehicles: A Formal Approach. In Proceedings of the IEEE 37th International Conference on Distributed Computing Systems Workshops (ICDCSW), Atlanta, GA, USA, 5–8 June 2017; pp. 83–90. [Google Scholar] [CrossRef]
- Ravlić, M.; Erdelić, T.; Carić, T. Optimizing charging station locations for fleet of electric vehicles using Multi-Source Weber Problem. In Proceedings of the Elmar—International Symposium Electronics in Marine, Zadar, Croatia, 12–14 September 2016; pp. 111–114. [Google Scholar] [CrossRef]
- Yagcitekin, B.; Uzunoglu, M. A double-layer smart charging strategy of electric vehicles taking routing and charge scheduling into account. Appl. Energy 2016, 167, 407–419. [Google Scholar] [CrossRef]
- Hajidavalloo, M.R.; Shirazi, F.A.; Mahjoob, M.J. Performance of different optimal charging schemes in a solar charging station using dynamic programming. Optim. Control. Appl. Methods 2020, 41, 1568–1583. [Google Scholar] [CrossRef]
- Kontic, M.; Mujovic, S.; Calasan, M. Electric vehicles as a mean for peak power curtailment in micro grids. In Proceedings of the 2019 20th International Symposium on Power Electronics (Ee), Novi Sad, Serbia, 23–26 October 2019; pp. 1–5. [Google Scholar] [CrossRef]
- Rezaee Jordehi, A.; Javadi, M.S.; Catalão, J.P.S. Optimal placement of battery swap stations in microgrids with micro pumped hydro storage systems, photovoltaic, wind and geothermal distributed generators. Int. J. Electr. Power Energy Syst. 2021, 125, 106483. [Google Scholar] [CrossRef]
- Inala, K.P.; Kumar Bose, S.; Kumar, P. Impact of communication network on V2G system in a smart grid scenario. In Proceedings of the 2019 IEEE 16th India Council International Conference (INDICON), Rajkot, India, 13–15 December 2019; pp. 1–4. [Google Scholar] [CrossRef]
- Nasrallah, Y.Y.; Al-Anbagi, I.; Mouftah, H.T. Mobility impact on the performance of electric vehicle-To-grid communications in smart grid environment. In Proceedings of the 2015 IEEE Symposium on Computers and Communications (ISCC), Larnaca, Cyprus, 6–9 July 2015; pp. 764–769. [Google Scholar] [CrossRef]
- Kippke, M.A.; Arboleya, P.; El Sayed, I. Communication infrastructure for E-mobility charging stations V2G applications. In Proceedings of the 2020 8th International Conference on Power Electronics Systems and Applications: Future Mobility and Future Power Transfer (PESA), Hong Kong, China, 7–10 December 2020; pp. 1–3. [Google Scholar] [CrossRef]
- Tan, K.M.; Ramachandaramurthy, V.K.; Yong, J.Y. Latest Electric Vehicle Charging Technology for Smart Grid Application. In Proceedings of the 2018 IEEE 7th International Conference on Power and Energy (PECon), Kuala Lumpur, Malaysia, 3–4 December 2018; pp. 366–371. [Google Scholar] [CrossRef]
- Sarker, M.R.; Pandžic, H.; Sun, K.; Ortega-Vazquez, M.A. Optimal operation of aggregated electric vehicle charging stations coupled with energy storage. IET Gener. Transm. Distrib. 2018, 12, 1127–1136. [Google Scholar] [CrossRef]
- Chen, T.D.; Kockelman, K.M.; Hanna, J.P. Operations of a shared, autonomous, electric vehicle fleet: Implications of vehicle & charging infrastructure decisions. Transp. Res. Part Policy Pract. 2016, 94, 243–254. [Google Scholar] [CrossRef] [Green Version]
- Bauer, G.S.; Greenblatt, J.B.; Gerke, B.F. Cost, energy and environmental impact of automated electric taxi fleets in Manhattan. Angew. Chem. Int. Ed. 2018, 6, 951–952. [Google Scholar] [CrossRef] [Green Version]
- Loeb, B.; Kockelman, K.M.; Liu, J. Shared autonomous electric vehicle (SAEV) operations across the Austin, Texas network with charging infrastructure decisions. Transp. Res. Part Emerg. Technol. 2018, 89, 222–233. [Google Scholar] [CrossRef]
- Kaddoura, I.; Schlenther, T. The impact of trip density on the fleet size and pooling rate of ride-hailing services: A simulation study. Procedia Comput. Sci. 2021, 184, 674–679. [Google Scholar] [CrossRef]
- Cocca, M.; Giordano, D.; Mellia, M.; Vassio, L. Free floating electric car sharing design: Data driven optimisation. Pervasive Mob. Comput. 2019, 55, 59–75. [Google Scholar] [CrossRef]
- Funke, S.A.; Burgert, T. Can charging infrastructure used only by electric taxis be profitable? A case study from Karlsruhe, Germany. IEEE Trans. Veh. Technol. 2020, 69, 5933–5944. [Google Scholar] [CrossRef]
- Cai, H.; Jia, X.; Chiu, A.S.; Hu, X.; Xu, M. Siting public electric vehicle charging stations in Beijing using big-data informed travel patterns of the taxi fleet. Transp. Res. Part Transp. Environ. 2014, 33, 39–46. [Google Scholar] [CrossRef] [Green Version]
- Sah, B.; Kumar, P.; Rayudu, R.; Bose, S.K.; Inala, K.P. Impact of Sampling in the Operation of Vehicle to Grid and Its Mitigation. IEEE Trans. Ind. Inform. 2019, 15, 3923–3933. [Google Scholar] [CrossRef]
- Waldron, J.; Rodrigues, L.; Gillott, M.; Naylor, S.; Shipman, R. Decarbonising Our Transport System: User Behaviour Analysis to Assess the Transition to Electric Mobility. In Proceedings of the 35th PLEA Conference on Passive and Low Energy Architecture (PLEA). Planning Post Carbon Cities, A Coruña, Spain, 1–3 September 2020; Volume 1, pp. 689–694. [Google Scholar] [CrossRef]
- Tarroja, B.; Zhang, L.; Wifvat, V.; Shaffer, B.; Samuelsen, S. Assessing the stationary energy storage equivalency of vehicle-to-grid charging battery electric vehicles. Energy 2016, 106, 673–690. [Google Scholar] [CrossRef]
- De Gennaro, M.; Paffumi, E.; Giogrgio, M. Customer-driven design of the recharge infrastructure and Vehicle-to-Grid in urban areas: A large-scale application for electric vehicles deployment. Energy 2015, 82, 294–311. [Google Scholar] [CrossRef]
- Velamuri, S.; Cherukuri, S.H.C.; Sudabattula, S.K.; Prabaharan, N.; Hossain, E. Combined Approach for Power Loss Minimization in Distribution Networks in the Presence of Gridable Electric Vehicles and Dispersed Generation. IEEE Syst. J. 2021, 16, 3284–3295. [Google Scholar] [CrossRef]
- Archana, A.N.; Rajeev, T. A Novel Reliability Index Based Approach for EV Charging Station Allocation in Distribution System. IEEE Trans. Ind. Appl. 2021, 57, 6385–6394. [Google Scholar] [CrossRef]
- Sultan, V.; Bitar, H.; Alzahrani, A.; Hilton, B. Electric Vehicles Charging Infrastructure Integration Into The Electric Grid Considering The Net Benefits To Consumers. In Proceedings of the 7th International Conference on Smart Grids, Green Communications and IT Energy-Aware Technologies (ENERGY), Barcelona, Spain, 21–25 May 2017; pp. 21–26. [Google Scholar]
- Vosooghi, R.; Puchinger, J.; Bischoff, J.; Jankovic, M.; Vouillon, A. Shared autonomous electric vehicle service performance: Assessing the impact of charging infrastructure. Transp. Res. Part Transp. Environ. 2020, 81, 102283. [Google Scholar] [CrossRef] [Green Version]
- Gacias, B.; Meunier, F. Design and operation for an electric taxi fleet. OR Spectr. 2015, 37, 171–194. [Google Scholar] [CrossRef] [Green Version]
- Zhang, H.; Sheppard, C.J.; Lipman, T.E.; Moura, S.J. Joint Fleet Sizing and Charging System Planning for Autonomous Electric Vehicles. IEEE Trans. Intell. Transp. Syst. 2020, 21, 4725–4738. [Google Scholar] [CrossRef] [Green Version]
- Luke, J.; Salazar, M.; Rajagopal, R.; Pavone, M. Joint Optimization of Autonomous Electric Vehicle Fleet Operations and Charging Station Siting. In Proceedings of the IEEE Conference on Intelligent Transportation Systems, Proceedings, ITSC, Indianapolis, IN, USA, 19–22 September; pp. 3340–3347. [CrossRef]
- Ma, B.; Hu, D.; Wu, X. The Location Routing Problem of the Car-Sharing System with Autonomous Electric Vehicles. KSCE J. Civ. Eng. 2021, 25, 3107–3120. [Google Scholar] [CrossRef]
- Sheppard, C.J.; Bauer, G.S.; Gerke, B.F.; Greenblatt, J.B.; Jenn, A.T.; Gopal, A.R. Joint Optimization Scheme for the Planning and Operations of Shared Autonomous Electric Vehicle Fleets Serving Mobility on Demand. Transp. Res. Rec. 2019, 2673, 579–597. [Google Scholar] [CrossRef]
- Zhao, D.; Li, X.; Cui, J. A simulation-based optimization model for infrastructure planning for electric autonomous vehicle sharing. Comput.-Aided Civ. Infrastruct. Eng. 2021, 36, 858–876. [Google Scholar] [CrossRef]
- Gao, S.; Jia, H.; Liu, J.; Liu, C. Integrated configuration and charging optimization of aggregated electric vehicles with renewable energy sources. Energy Procedia 2019, 158, 2986–2993. [Google Scholar] [CrossRef]
- Mohamed, A.A.; Zhu, L.; Meintz, A.; Wood, E. Planning Optimization for Inductively Charged On-Demand Automated Electric Shuttles Project at Greenville, South Carolina. IEEE Trans. Ind. Appl. 2020, 56, 1010–1020. [Google Scholar] [CrossRef]
- Moradi, M.H.; Abedini, M.; Hosseinian, S.M. Improving operation constraints of microgrid using PHEVs and renewable energy sources. Renew. Energy 2015, 83, 543–552. [Google Scholar] [CrossRef]
- Mozafar, M.R.; Moradi, M.H.; Amini, M.H. A simultaneous approach for optimal allocation of renewable energy sources and electric vehicle charging stations in smart grids based on improved GA-PSO algorithm. Sustain. Cities Soc. 2017, 32, 627–637. [Google Scholar] [CrossRef]
- Shojaabadi, S.; Abapour, S.; Abapour, M.; Nahavandi, A. Simultaneous planning of plug-in hybrid electric vehicle charging stations and wind power generation in distribution networks considering uncertainties. Renew. Energy 2016, 99, 237–252. [Google Scholar] [CrossRef]
- Masoumian, S.M.A.; Alfi, A.; Jordehi, A.R. Using not-dominated sorting backtracking search algorithm for optimal power system planning in the vicinity of the electric vehicle charging station and scattered generation sources under uncertainty conditions. Int. J. Nonlinear Anal. Appl. 2021, 12, 161–172. [Google Scholar] [CrossRef]
- Khanghah, B.Y.; Anvari-Moghaddam, A.; Guerrero, J.M.; Vasquez, J.C. Combined solar charging stations and energy storage units allocation for electric vehicles by considering uncertainties. In Proceedings of the 2017 IEEE International Conference on Environment and Electrical Engineering and 2017 IEEE Industrial and Commercial Power Systems Europe (EEEIC/I&CPS Europe), Milan, Italy, 6–9 June 2017. [Google Scholar] [CrossRef] [Green Version]
- Raja S, C.; Kumar N M, V.; J, S.k.; Nesamalar J, J.D. Enhancing system reliability by optimally integrating PHEV charging station and renewable distributed generators: A Bi-Level programming approach. Energy 2021, 229, 120746. [Google Scholar] [CrossRef]
- Bilal, M.; Rizwan, M. Integration of electric vehicle charging stations and capacitors in distribution systems with vehicle-to-grid facility. In Energy Sources, Part A: Recovery, Utilization and Environmental Effects; Taylor & Francis: Oxfordshire, UK, 2021; pp. 1–30. [Google Scholar] [CrossRef]
- Wang, S.; Dong, Z.Y.; Luo, F.; Meng, K.; Zhang, Y. Stochastic Collaborative Planning of Electric Vehicle Charging Stations and Power Distribution System. IEEE Trans. Ind. Inform. 2018, 14, 321–331. [Google Scholar] [CrossRef]
- Mozaffari, M.; Abyaneh, H.A.; Jooshaki, M.; Moeini-Aghtaie, M. Joint Expansion Planning Studies of EV Parking Lots Placement and Distribution Network. IEEE Trans. Ind. Inform. 2020, 16, 6455–6465. [Google Scholar] [CrossRef]
- Amarena, F.; Chicco, G.; Neyestani, N.; Damavandi, M.Y.; Catalao, J.P. Location of parking lots for plug-in electric vehicles considering traffic model and market participation. In Proceedings of the 2017 IEEE Manchester PowerTech, Manchester, UK, 18–22 June 2017. [Google Scholar] [CrossRef]
- Rahmani-Andebili, M.; Venayagamoorthy, G.K. SmartPark placement and operation for improving system reliability and market participation. Electr. Power Syst. Res. 2015, 123, 21–30. [Google Scholar] [CrossRef]
- Zhang, H.; Sheppard, C.J.; Lipman, T.E.; Zeng, T.; Moura, S.J. Charging infrastructure demands of shared-use autonomous electric vehicles in urban areas. Transp. Res. Part Transp. Environ. 2020, 78, 102210. [Google Scholar] [CrossRef]
- Ran, C.; Zhang, Y.; Yin, Y. Demand response to improve the shared electric vehicle planning: Managerial insights, sustainable benefits. Appl. Energy 2021, 292, 116823. [Google Scholar] [CrossRef]
- Yang, J.; Dong, J.; Hu, L. A data-driven optimization-based approach for siting and sizing of electric taxi charging stations. Transp. Res. Part Emerg. Technol. 2017, 77, 462–477. [Google Scholar] [CrossRef] [Green Version]
- Miao, H.; Jia, H.; Li, J.; Qiu, T.Z. Autonomous connected electric vehicle (ACEV)-based car-sharing system modeling and optimal planning: A unified two-stage multi-objective optimization methodology. Energy 2019, 169, 797–818. [Google Scholar] [CrossRef]
- Rajamand, S. Optimal electrical vehicle charging park in residential-commercial microgrid based on probability of vehicles routing and cost minimization approach. Int. J. Energy Res. 2021, 45, 8593–8605. [Google Scholar] [CrossRef]
- Rahbari, O.; Vafaeipour, M.; Omar, N.; Rosen, M.A.; Hegazy, O.; Timmermans, J.M.; Heibati, S.; Bossche, P.V.D. An optimal versatile control approach for plug-in electric vehicles to integrate renewable energy sources and smart grids. Energy 2017, 134, 1053–1067. [Google Scholar] [CrossRef]
- Prasomthong, J.; Ongsakul, W.; Meyer, J. Optimal placement of vehicle-to-grid charging station in distribution system using Particle Swarm Optimization with time varying acceleration coefficient. In Proceedings of the 2014 International Conference and Utility Exhibition on Green Energy for Sustainable Development (ICUE), Pattaya, Thailand, 19–21 March 2014. [Google Scholar]
- Azin, B.; Yang, X.T.; Marković, N.; Liu, M. Infrastructure enabled and electrified automation: Charging facility planning for cleaner smart mobility. Transp. Res. Part Transp. Environ. 2021, 101, 103079. [Google Scholar] [CrossRef]
- Kang, N.; Feinberg, F.M.; Papalambros, P.Y. Autonomous electric vehicle sharing system design. J. Mech. Des. Trans. ASME 2017, 139, 011402. [Google Scholar] [CrossRef]
- Zhou, P.; Wang, C.; Yang, Y. Design and Optimization of Electric Autonomous Vehicles with Renewable Energy Source for Smart Cities. In Proceedings of the IEEE INFOCOM 2020—IEEE Conference on Computer Communications, Toronto, ON, Canada, 6–9 July 2020; pp. 1399–1408. [Google Scholar] [CrossRef]
- Liang, X.; Correia, G.H.D.A. An optimal charging location model of an automated electric taxi system considering two types of charging. In Proceedings of the 2020 Forum on Integrated and Sustainable Transportation Systems (FISTS), Delft, The Netherlands, 3–5 November 2020; pp. 264–271. [Google Scholar] [CrossRef]
- Aljanad, A.; Mohamed, A.; Shareef, H.; Khatib, T. A novel method for optimal placement of vehicle-to-grid charging stations in distribution power system using a quantum binary lightning search algorithm. Sustain. Cities Soc. 2018, 38, 174–183. [Google Scholar] [CrossRef]
- Ahmad, F.; Khalid, M.; Panigrahi, B.K. An enhanced approach to optimally place the solar powered electric vehicle charging station in distribution network. J. Energy Storage 2021, 42, 103090. [Google Scholar] [CrossRef]
- Deb, S.; Tammi, K.; Kalita, K.; Mahanta, P. Impact of Electric Vehicle Charging Station Load on Distribution Network. Energies 2018, 11, 178. [Google Scholar] [CrossRef] [Green Version]
- Dubey, A.; Santoso, S. Electric Vehicle Charging on Residential Distribution Systems: Impacts and Mitigations. IEEE Access 2015, 3, 1871–1893. [Google Scholar] [CrossRef]
- Lokhandwala, M.; Cai, H. Siting charging stations for electric vehicle adoption in shared autonomous fleets. Transp. Res. Part Transp. Environ. 2020, 80, 102231. [Google Scholar] [CrossRef]
- Gupta, K.; Achathuparambil Narayanankutty, R.; Sundaramoorthy, K.; Sankar, A. Optimal location identification for aggregated charging of electric vehicles in solar photovoltaic powered microgrids with reduced distribution losses. In Energy Sources, Part A: Recovery, Utilization, and Environmental Effects; Taylor & Francis: Oxfordshire, UK, 2020; pp. 1–16. [Google Scholar] [CrossRef]
- Chakraborty, R.; Das, D.; Das, P. Optimal Placement of Electric Vehicle Charging Station with V2G Provision using Symbiotic Organisms Search Algorithm. In Proceedings of the 2022 IEEE International Students’ Conference on Electrical, Electronics and Computer Science (SCEECS), Bophal, India, 19–20 February 2022; pp. 1–6. [Google Scholar] [CrossRef]
| Disclaimer/Publisher’s Note: The statements, opinions and data contained in all publications are solely those of the individual author(s) and contributor(s) and not of MDPI and/or the editor(s). MDPI and/or the editor(s) disclaim responsibility for any injury to people or property resulting from any ideas, methods, instructions or products referred to in the content. |
© 2023 by the authors. Licensee MDPI, Basel, Switzerland. This article is an open access article distributed under the terms and conditions of the Creative Commons Attribution (CC BY) license (https://creativecommons.org/licenses/by/4.0/).


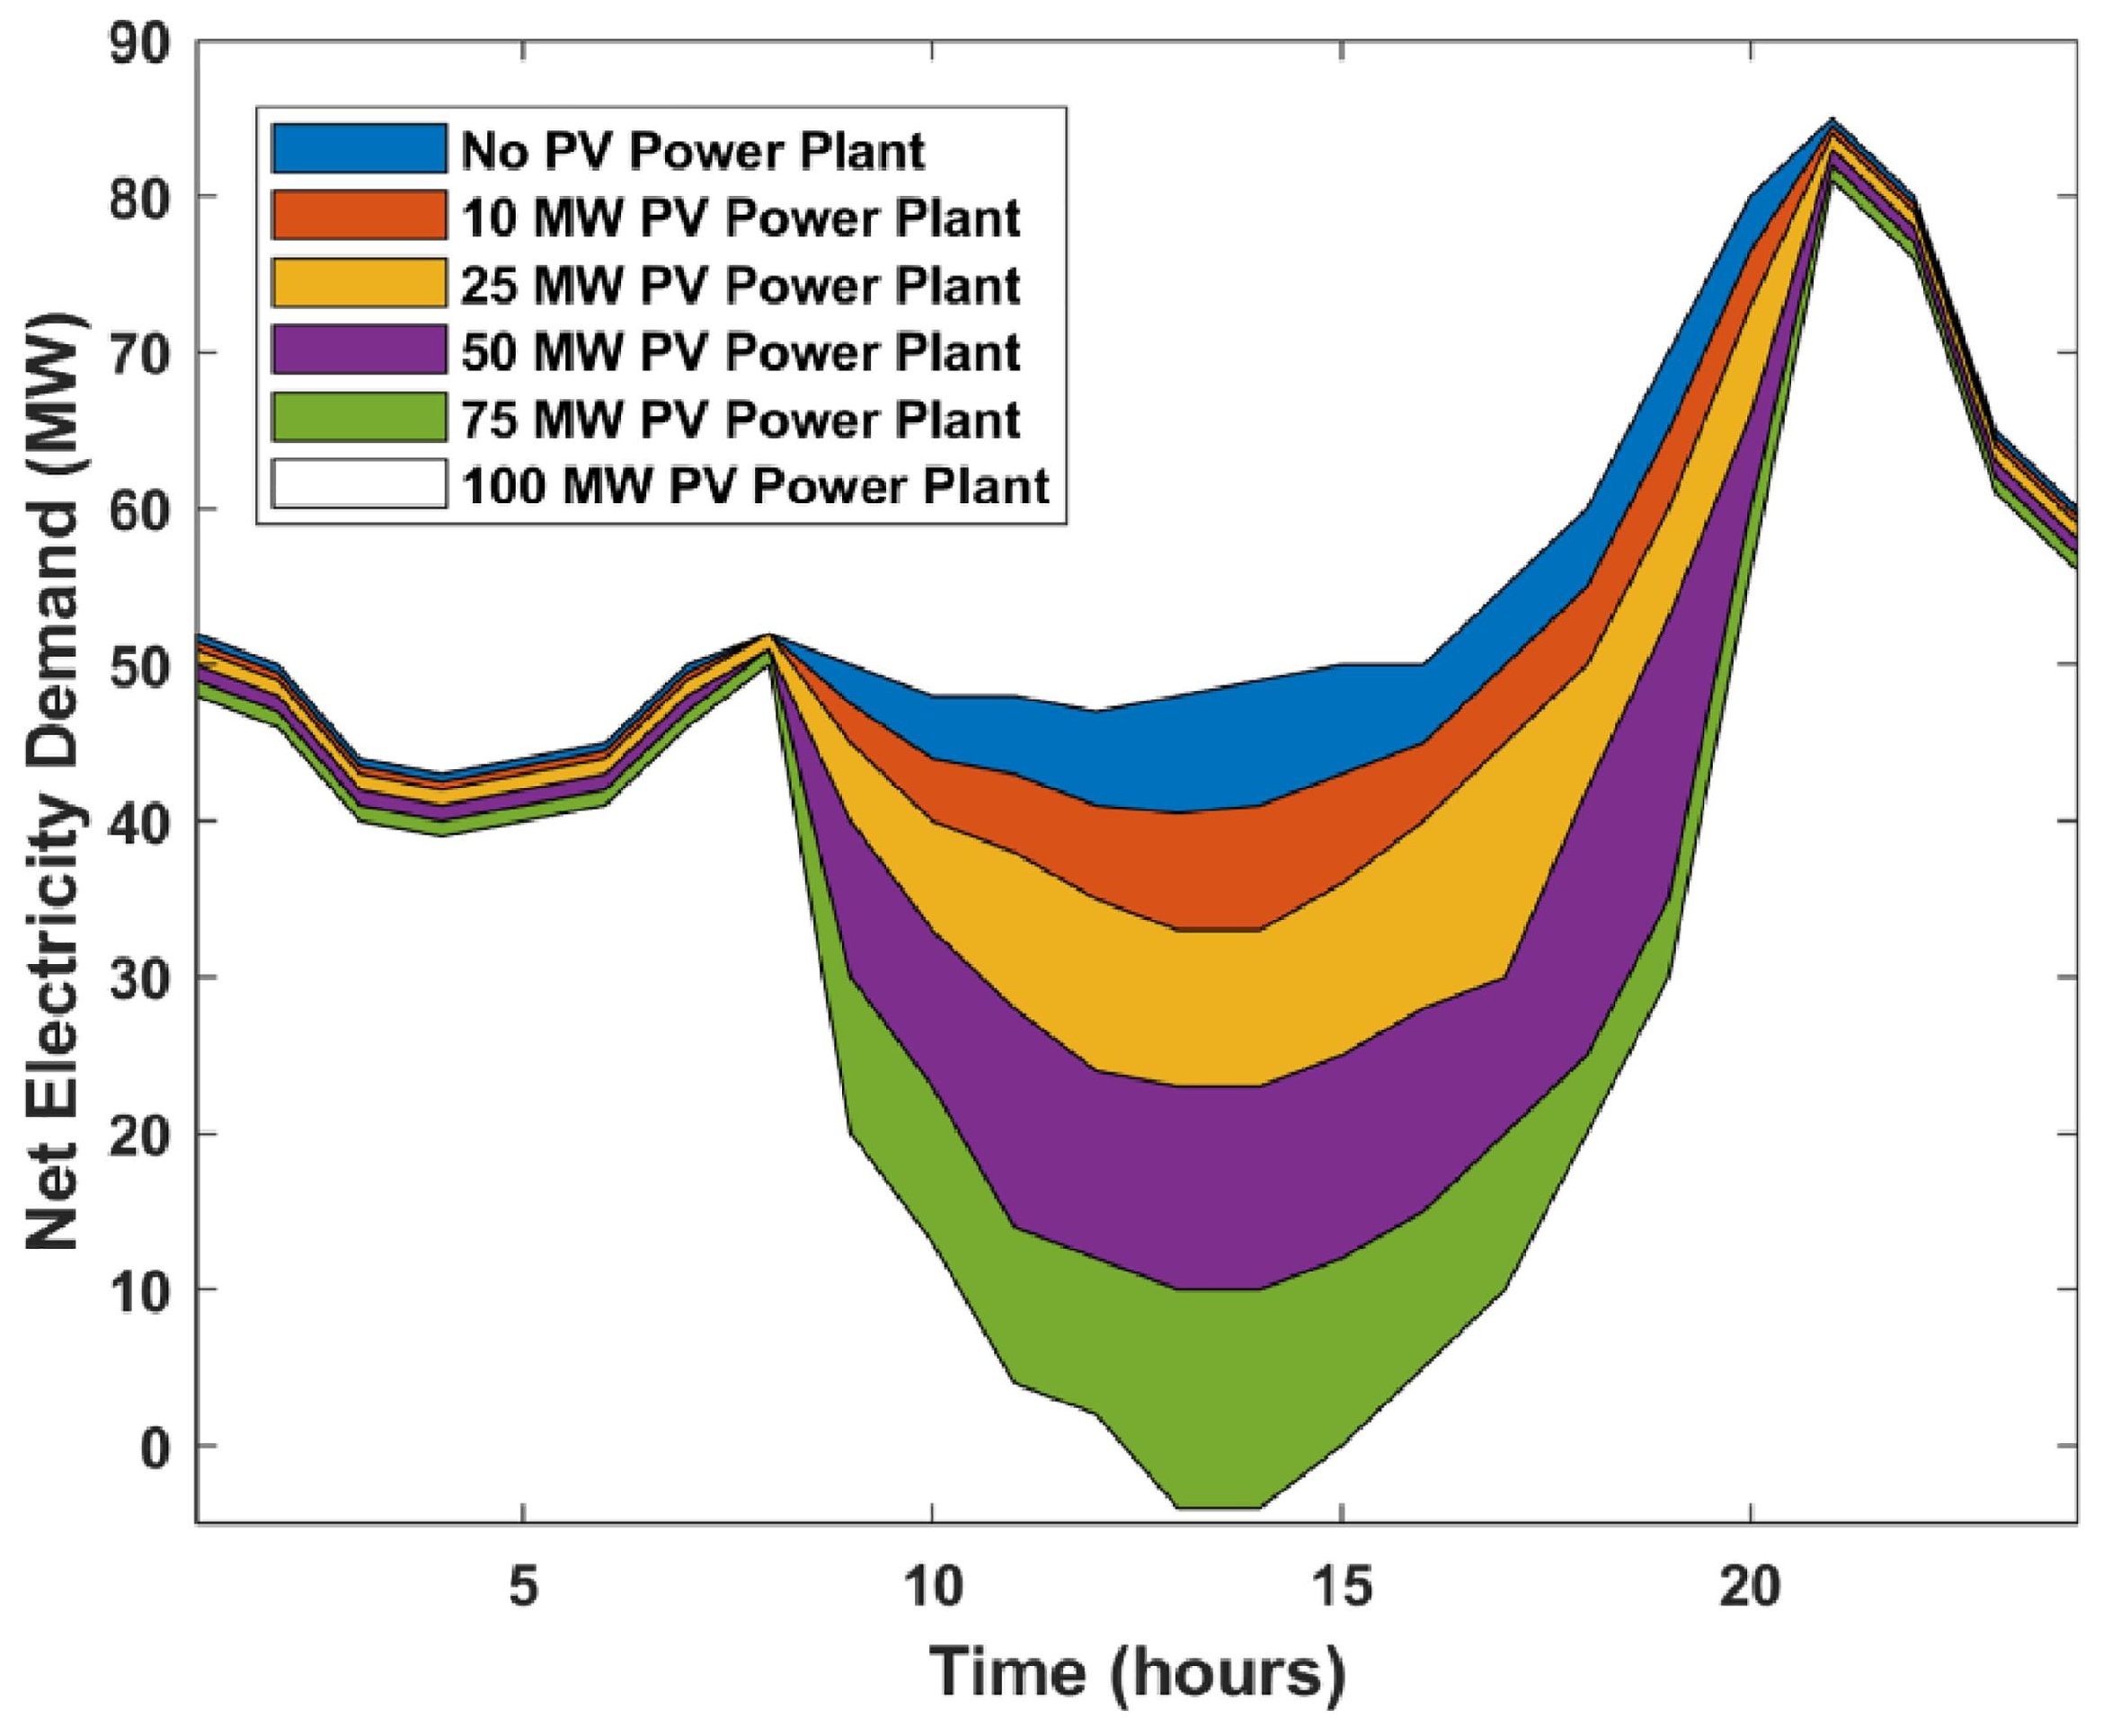
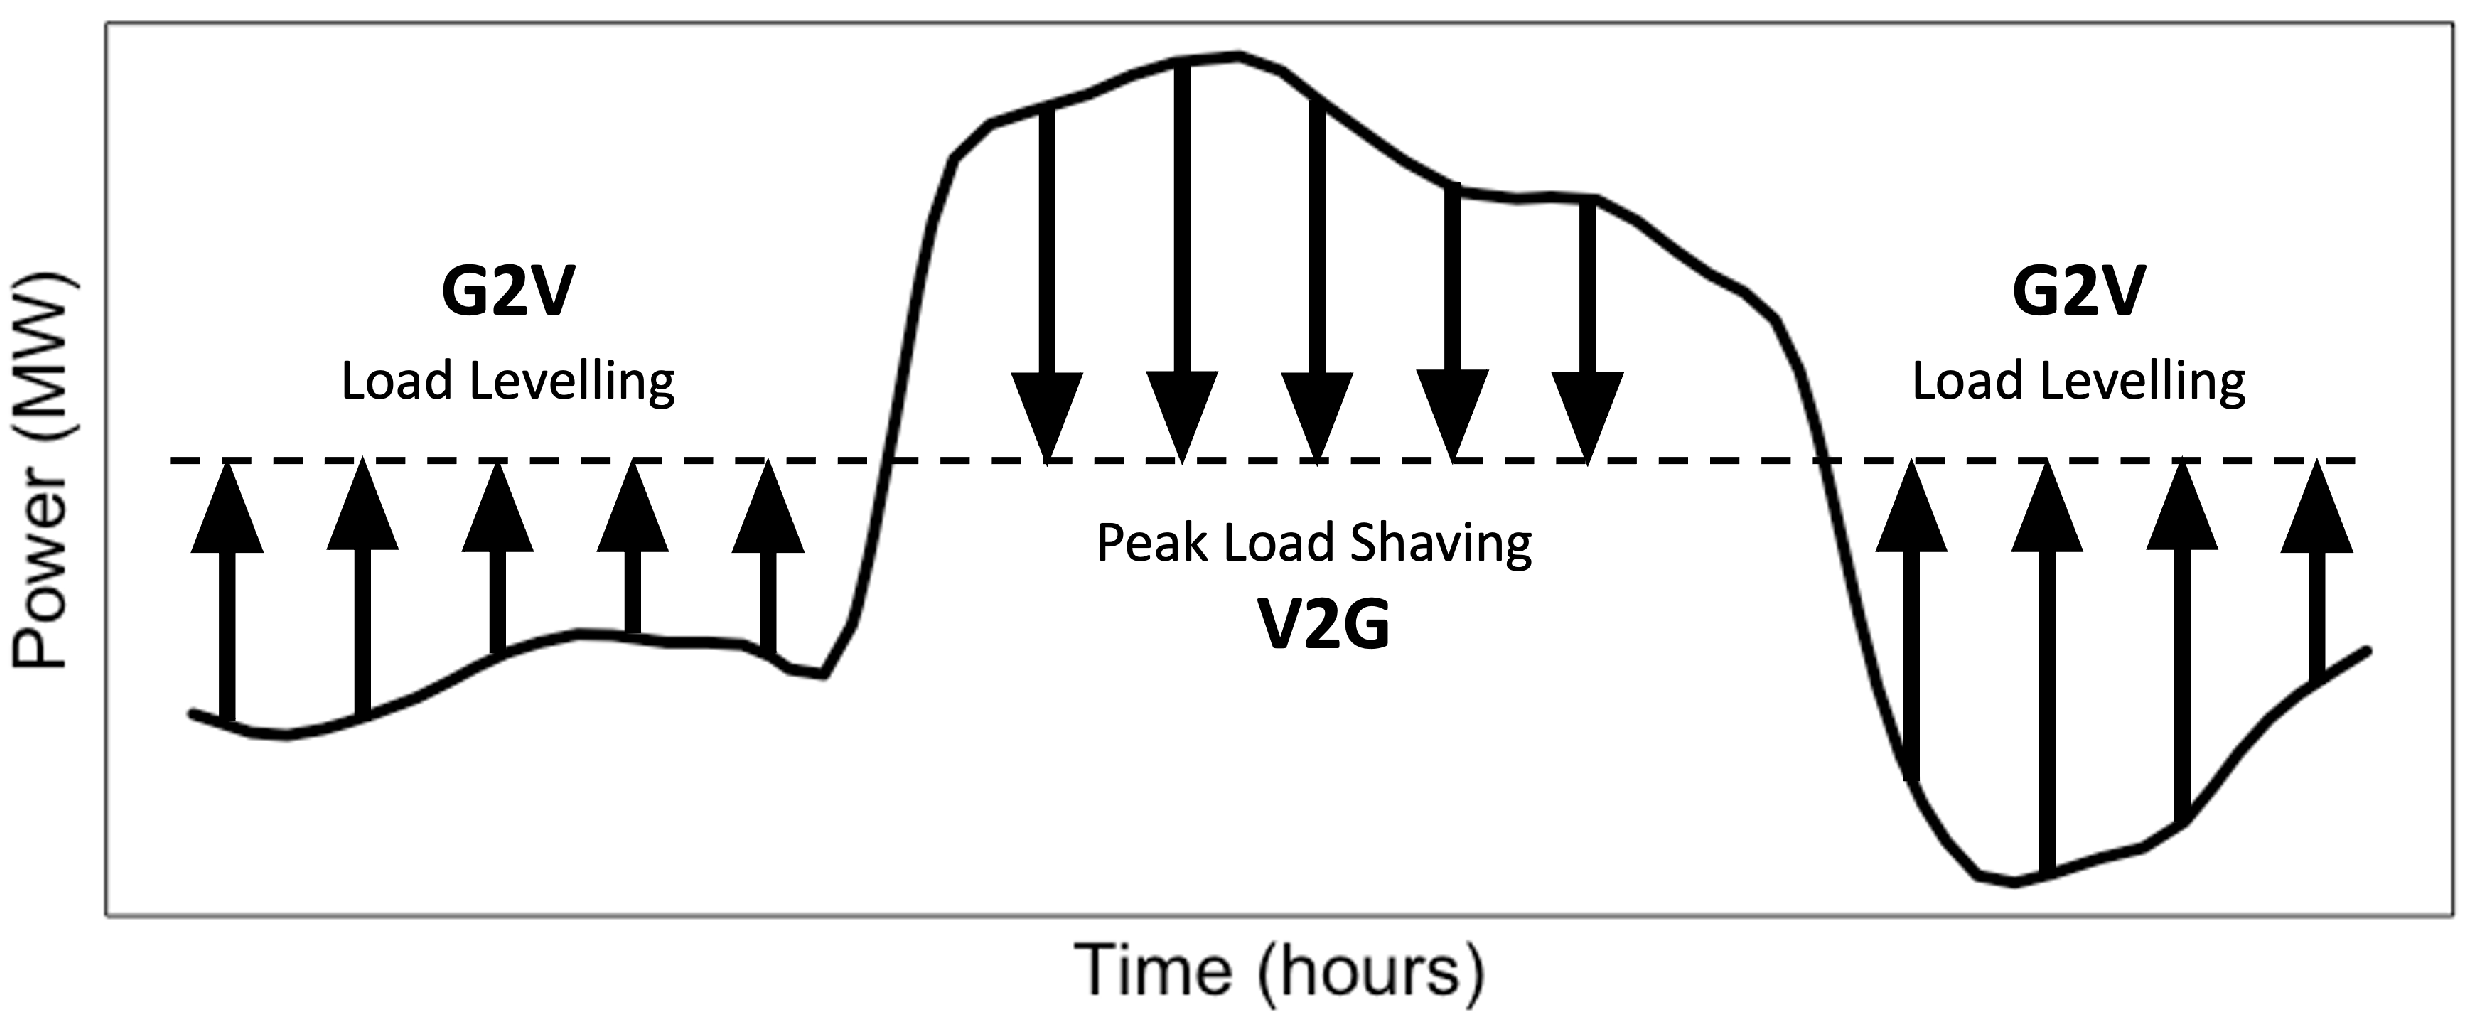
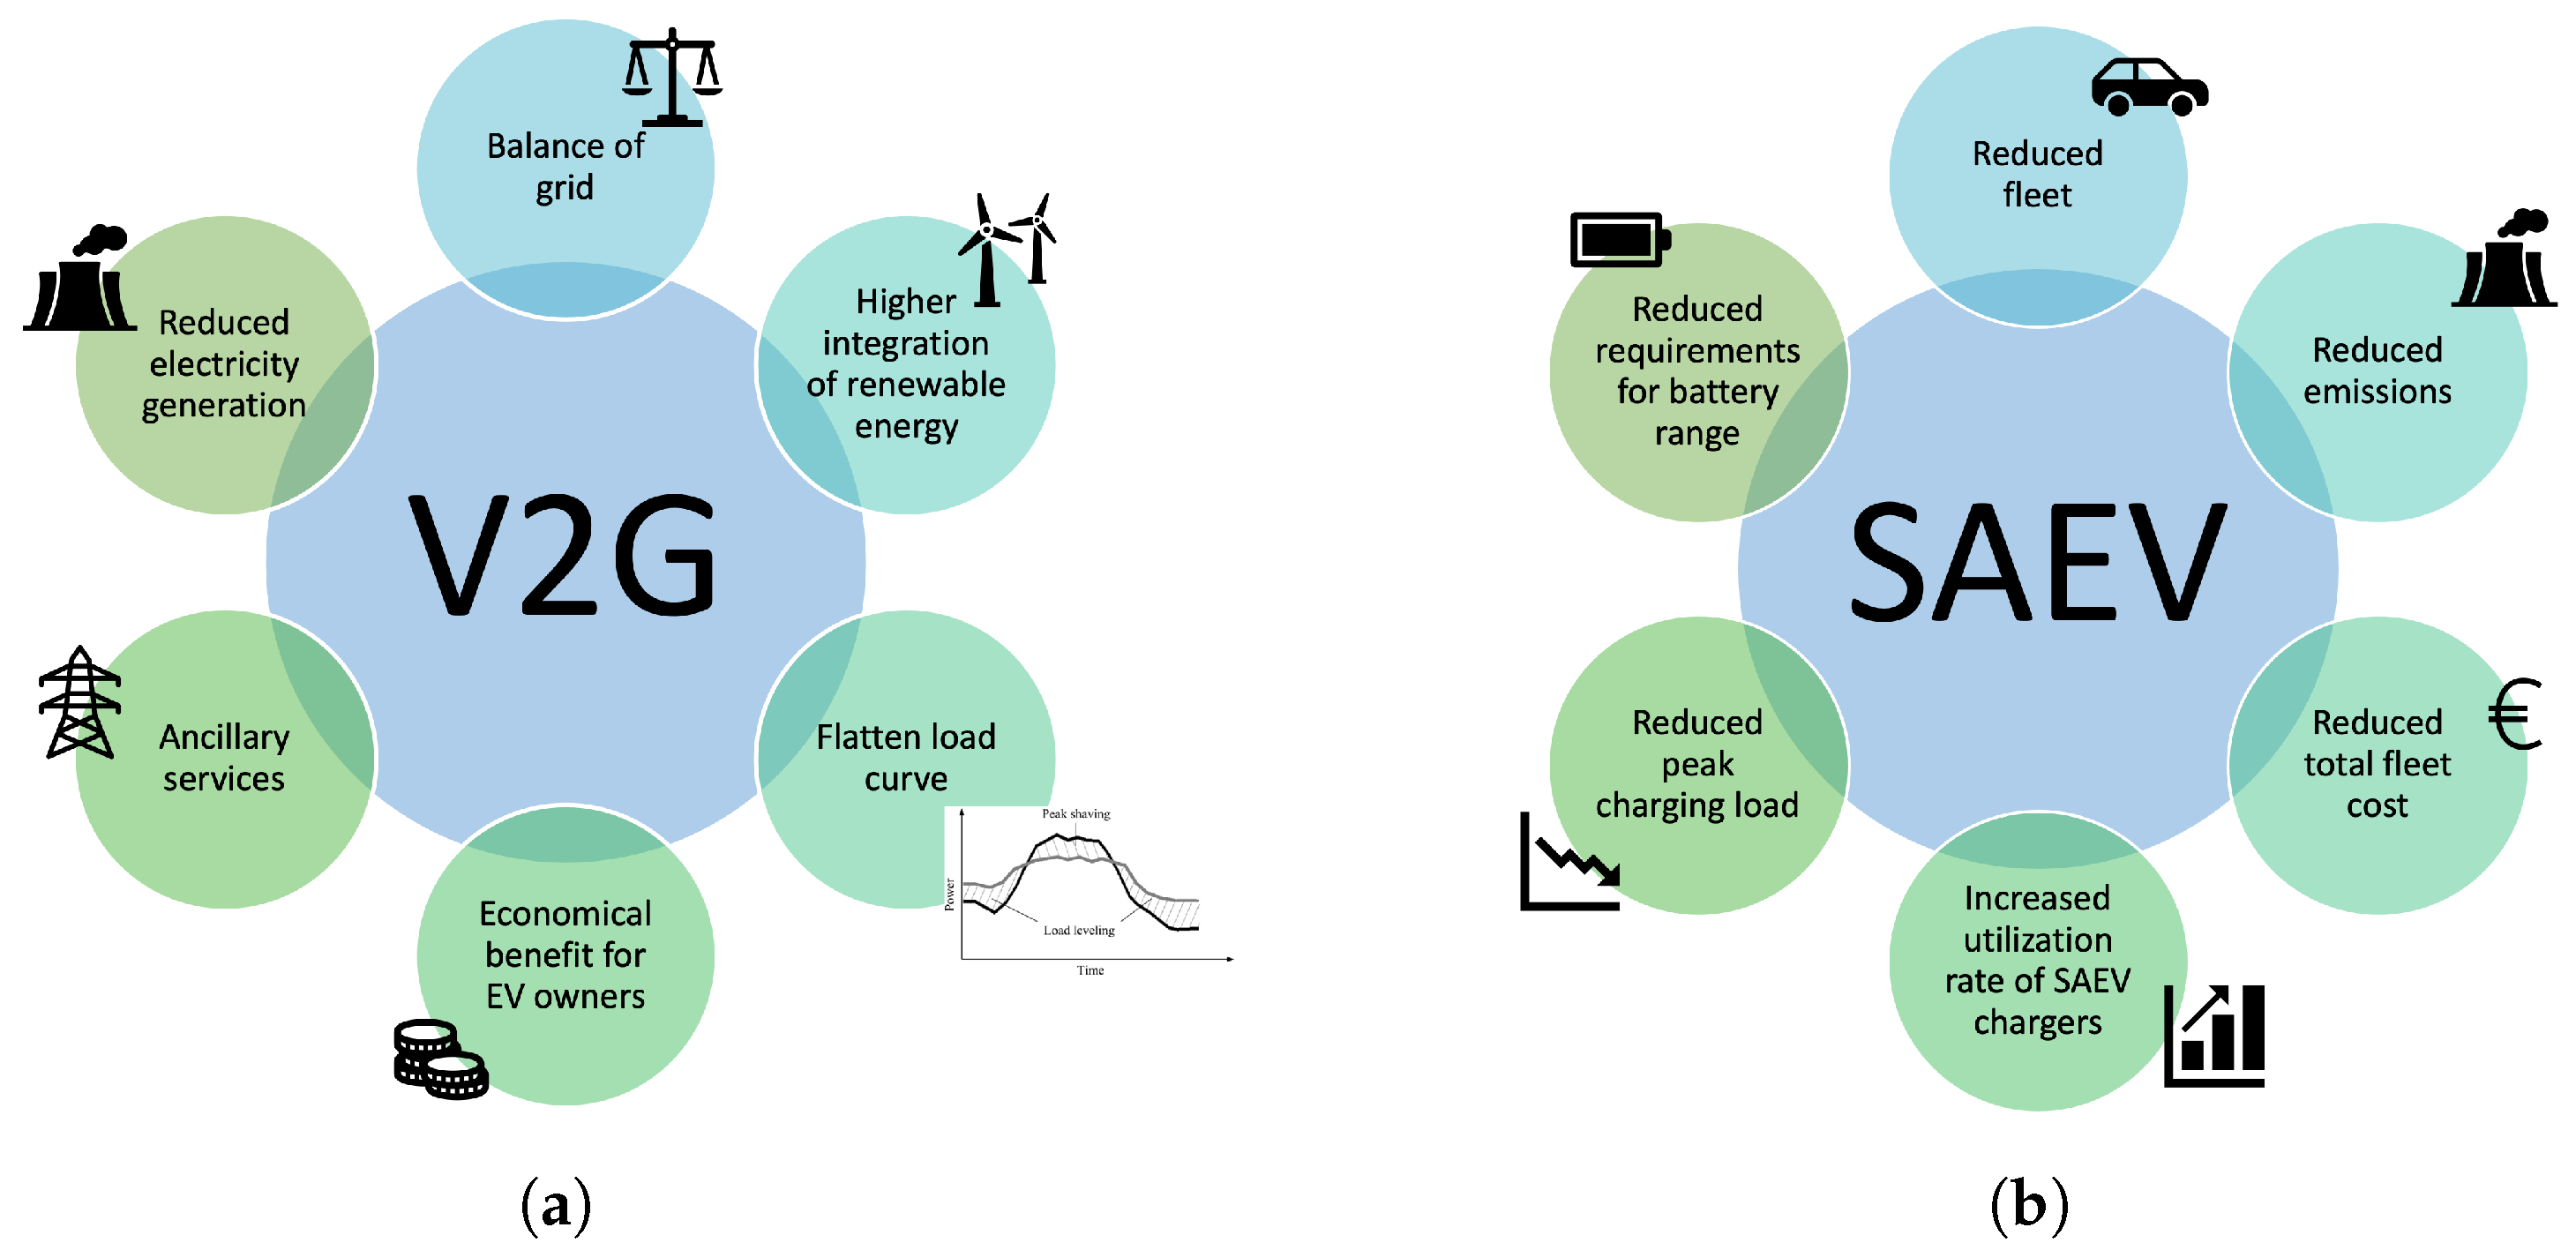
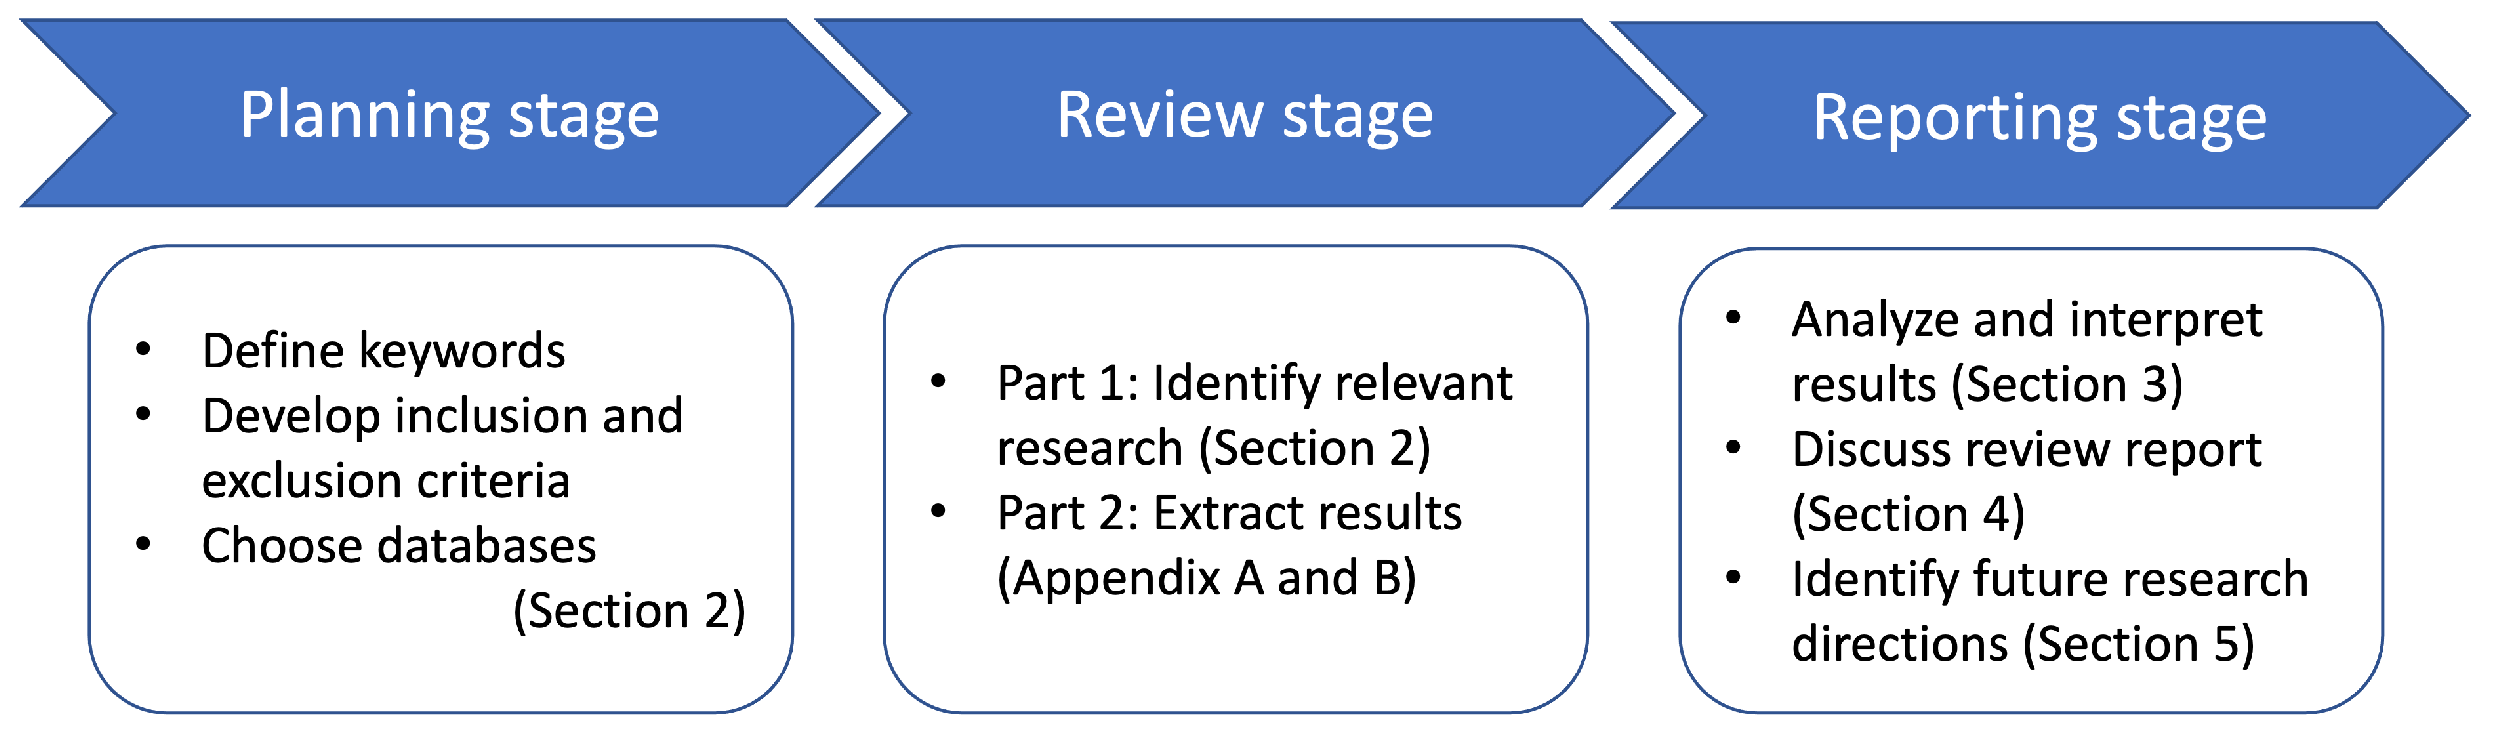
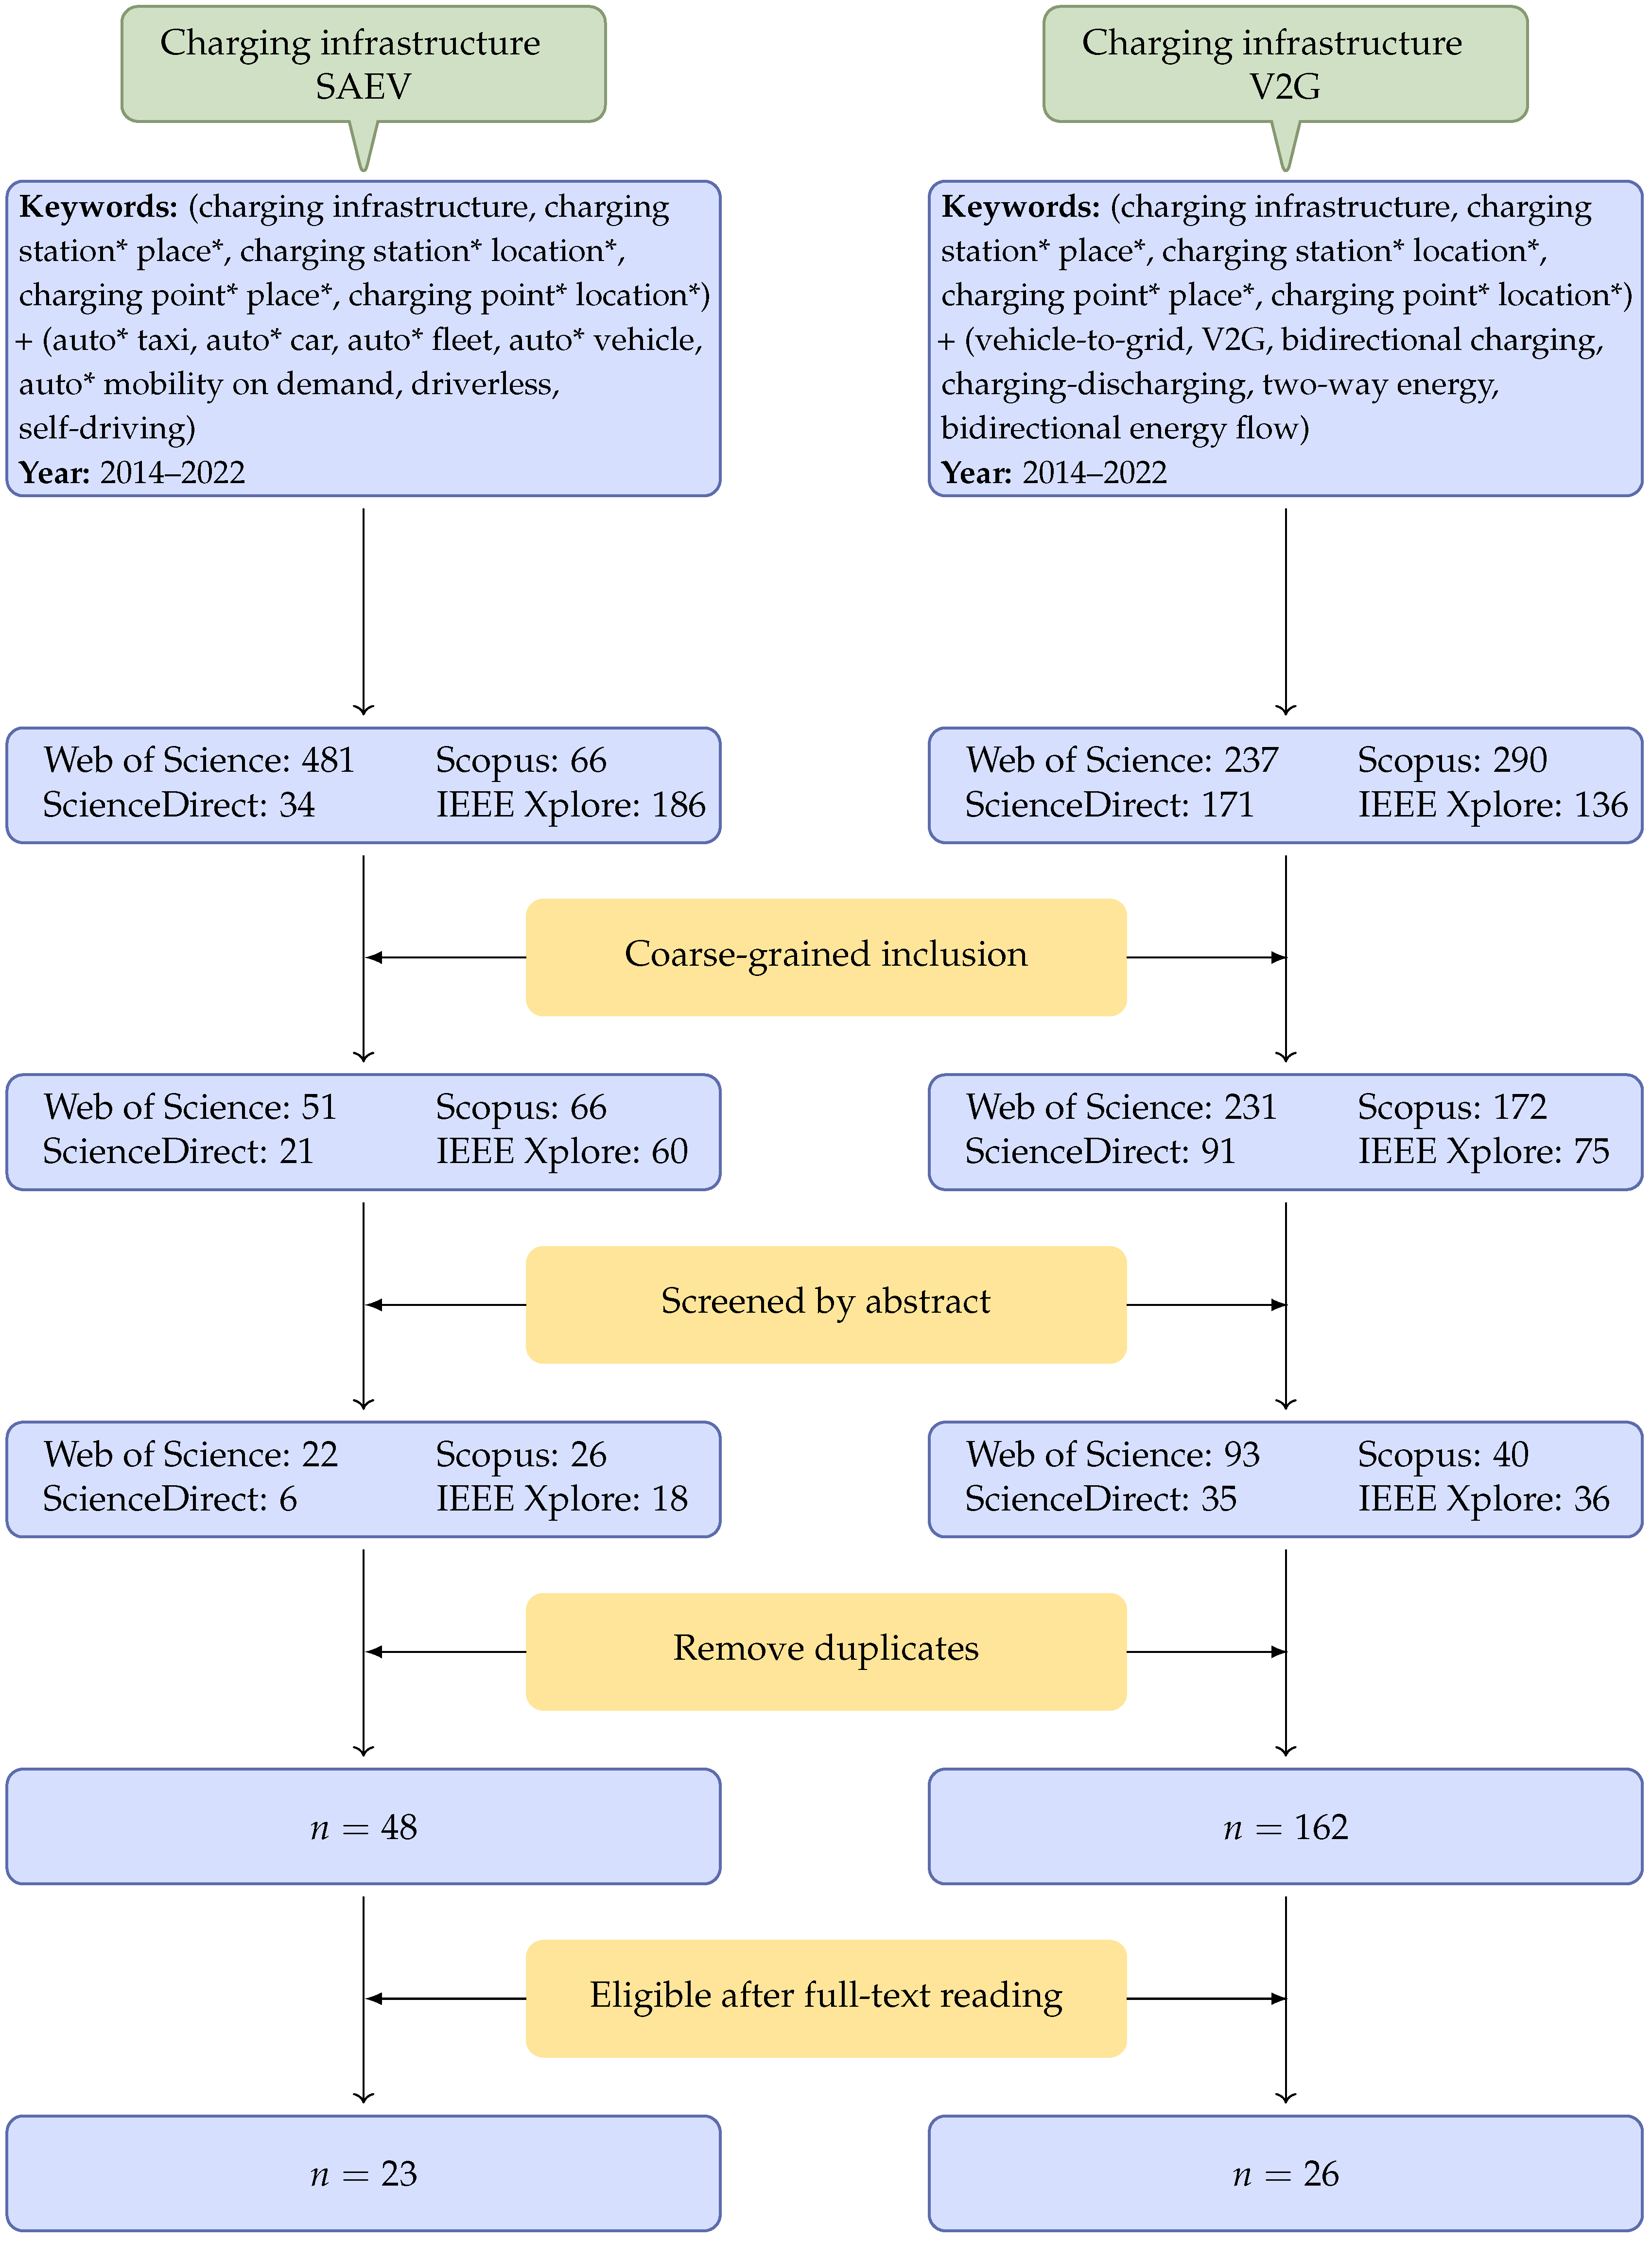
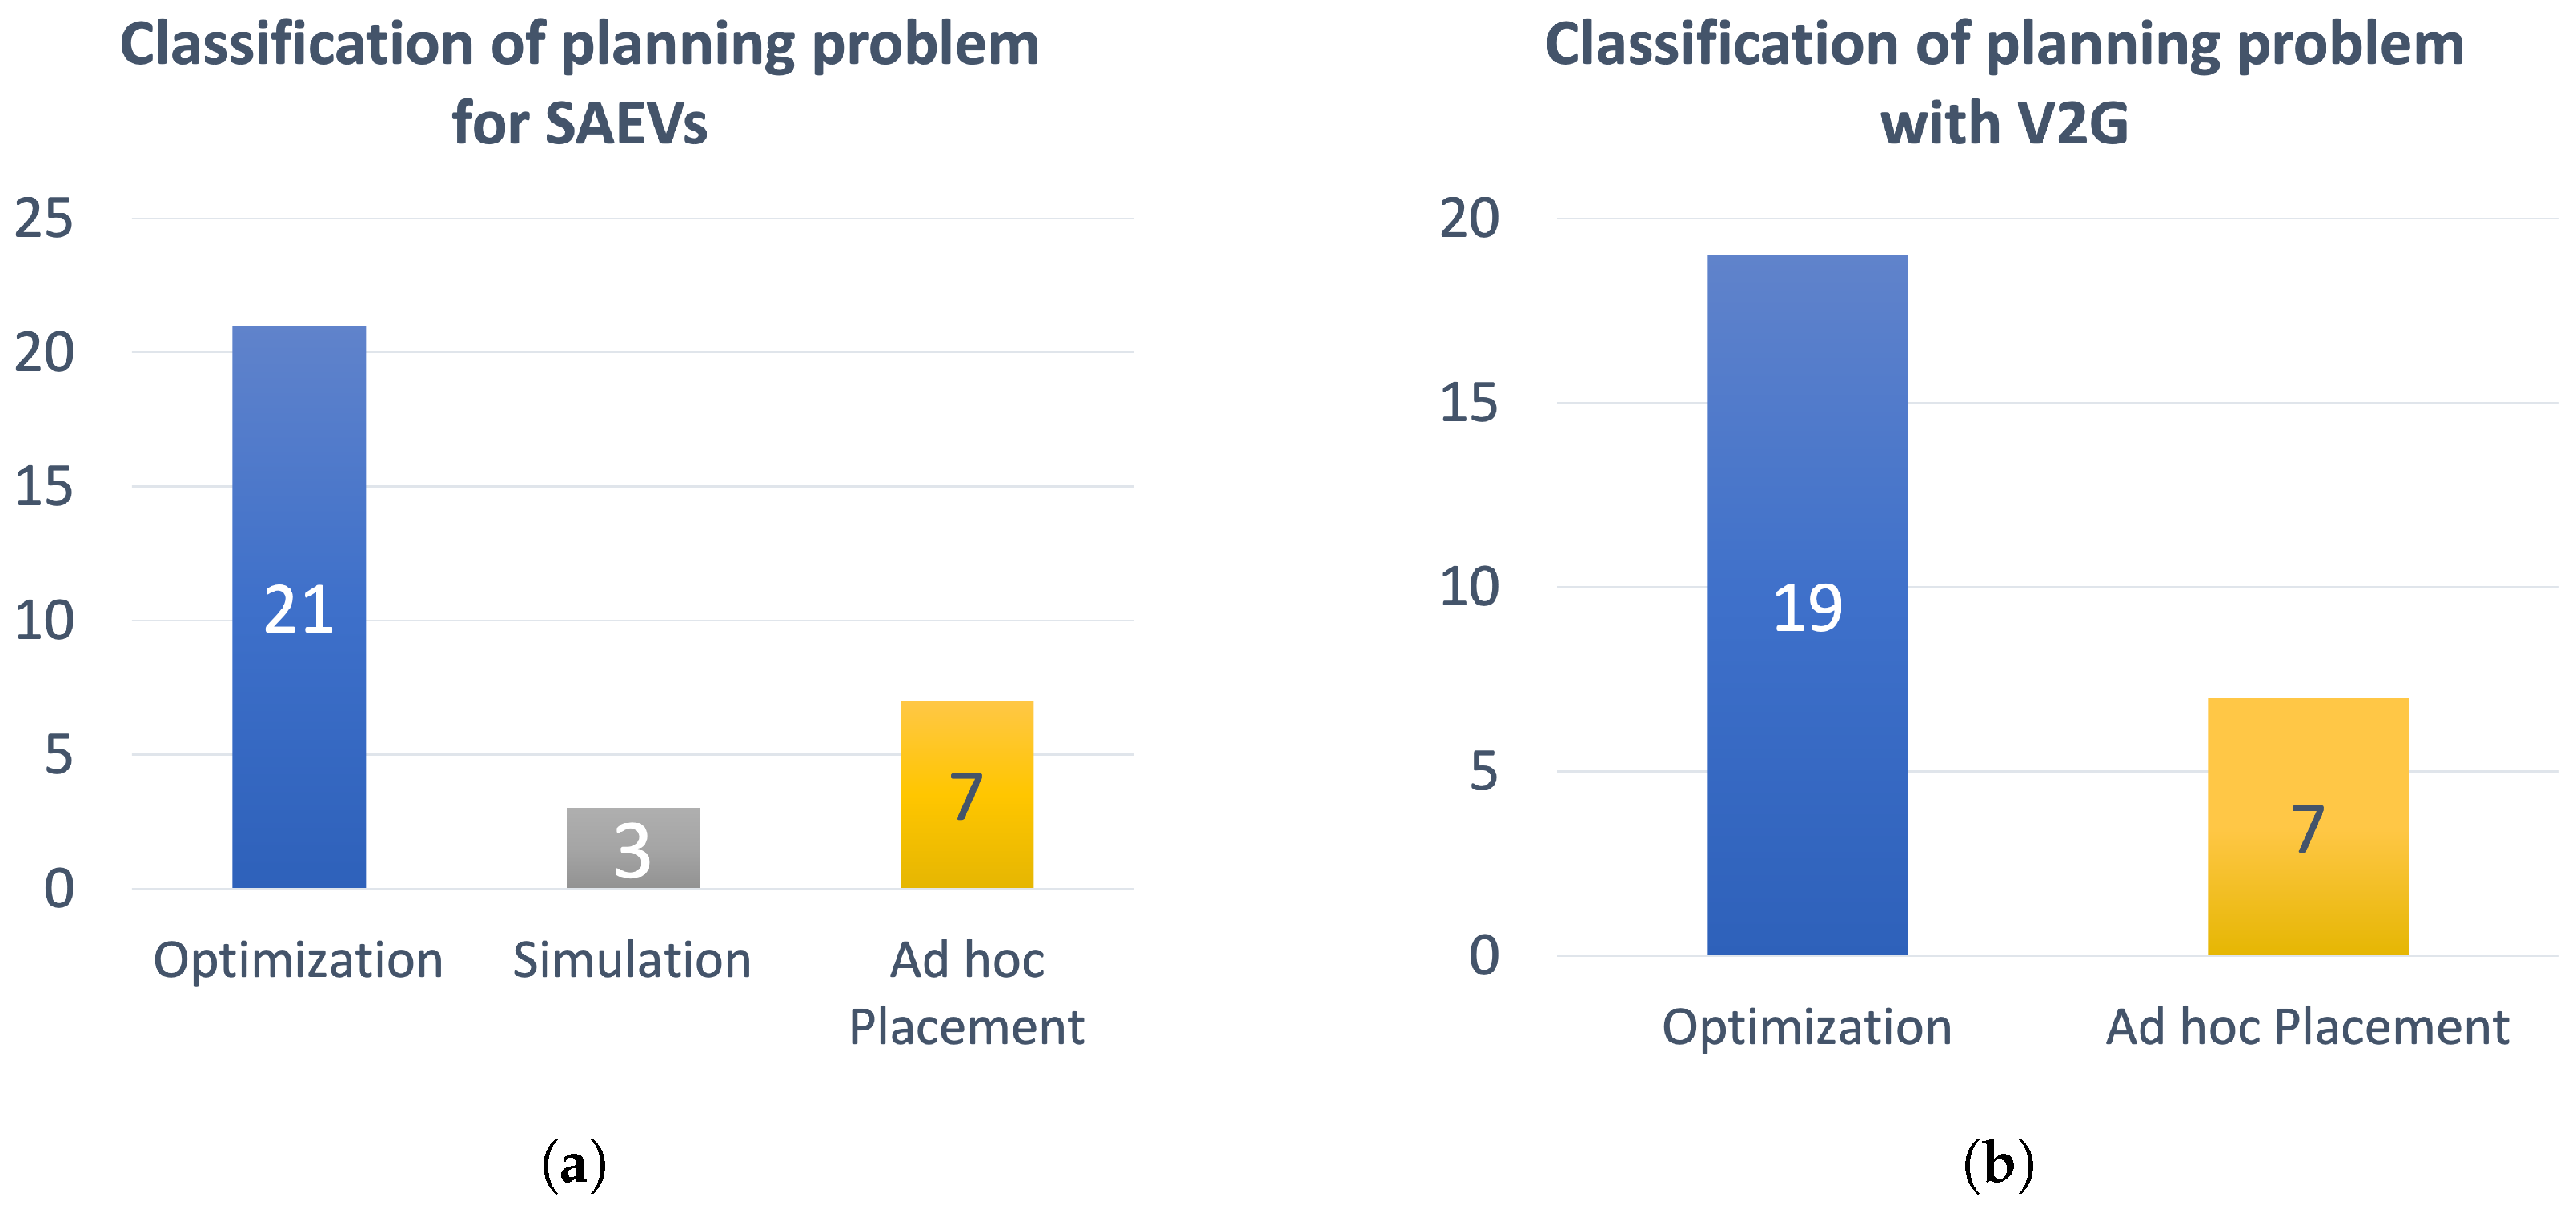
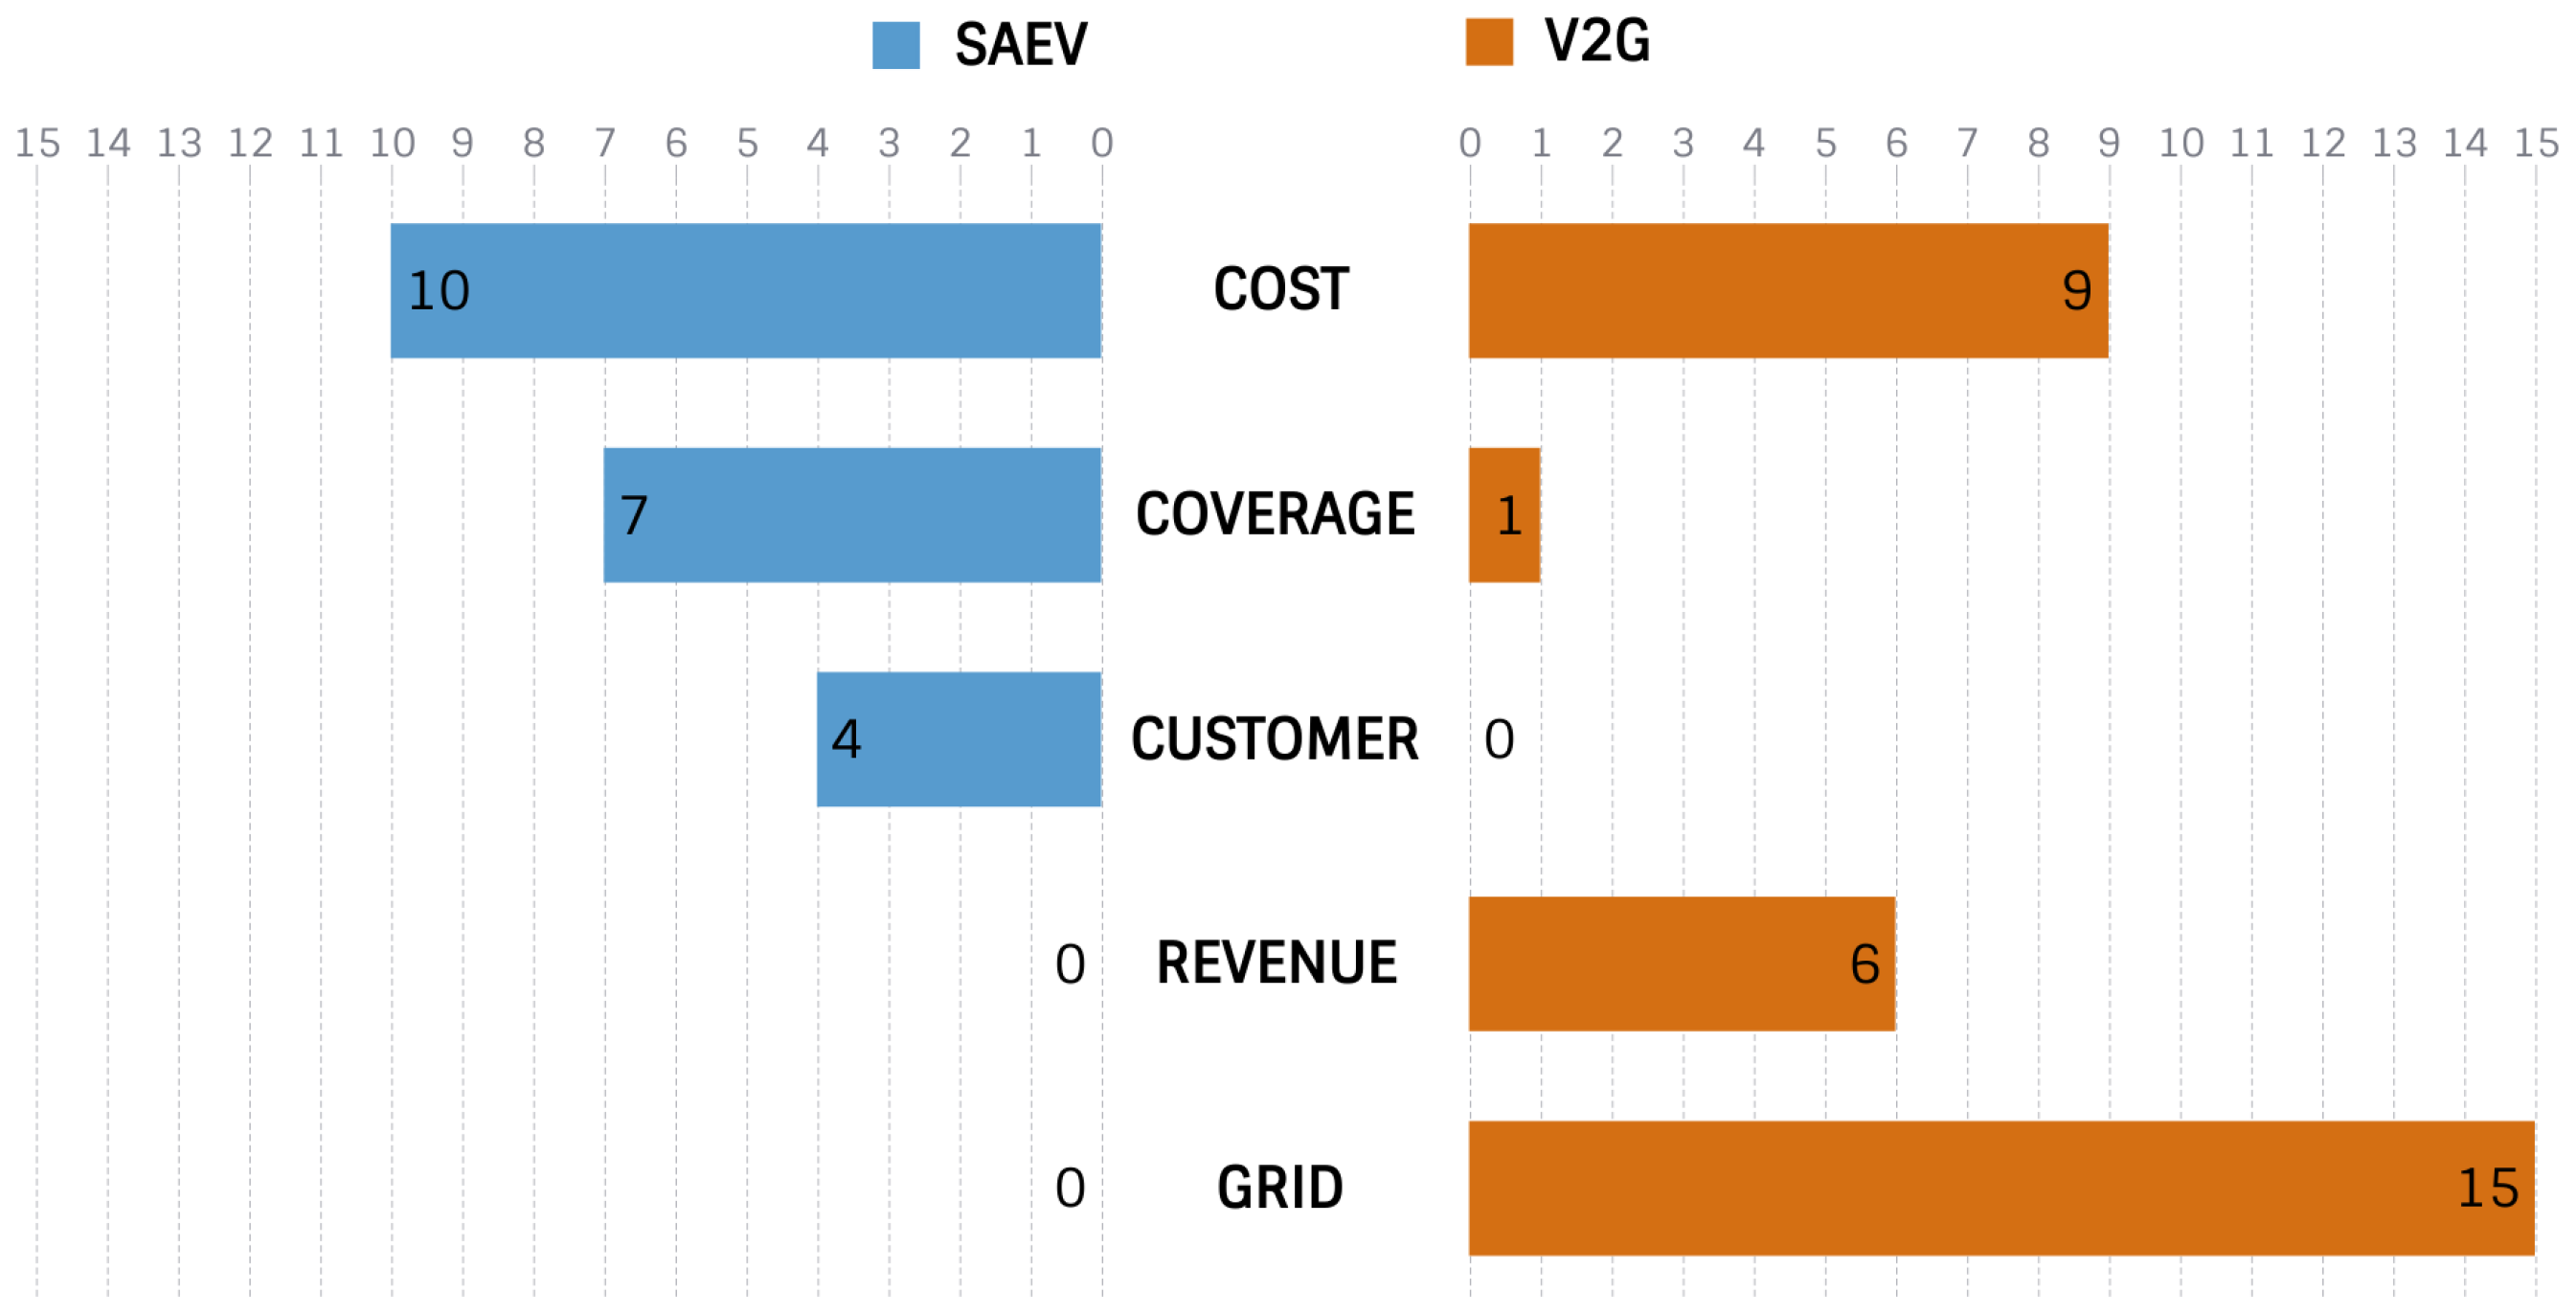
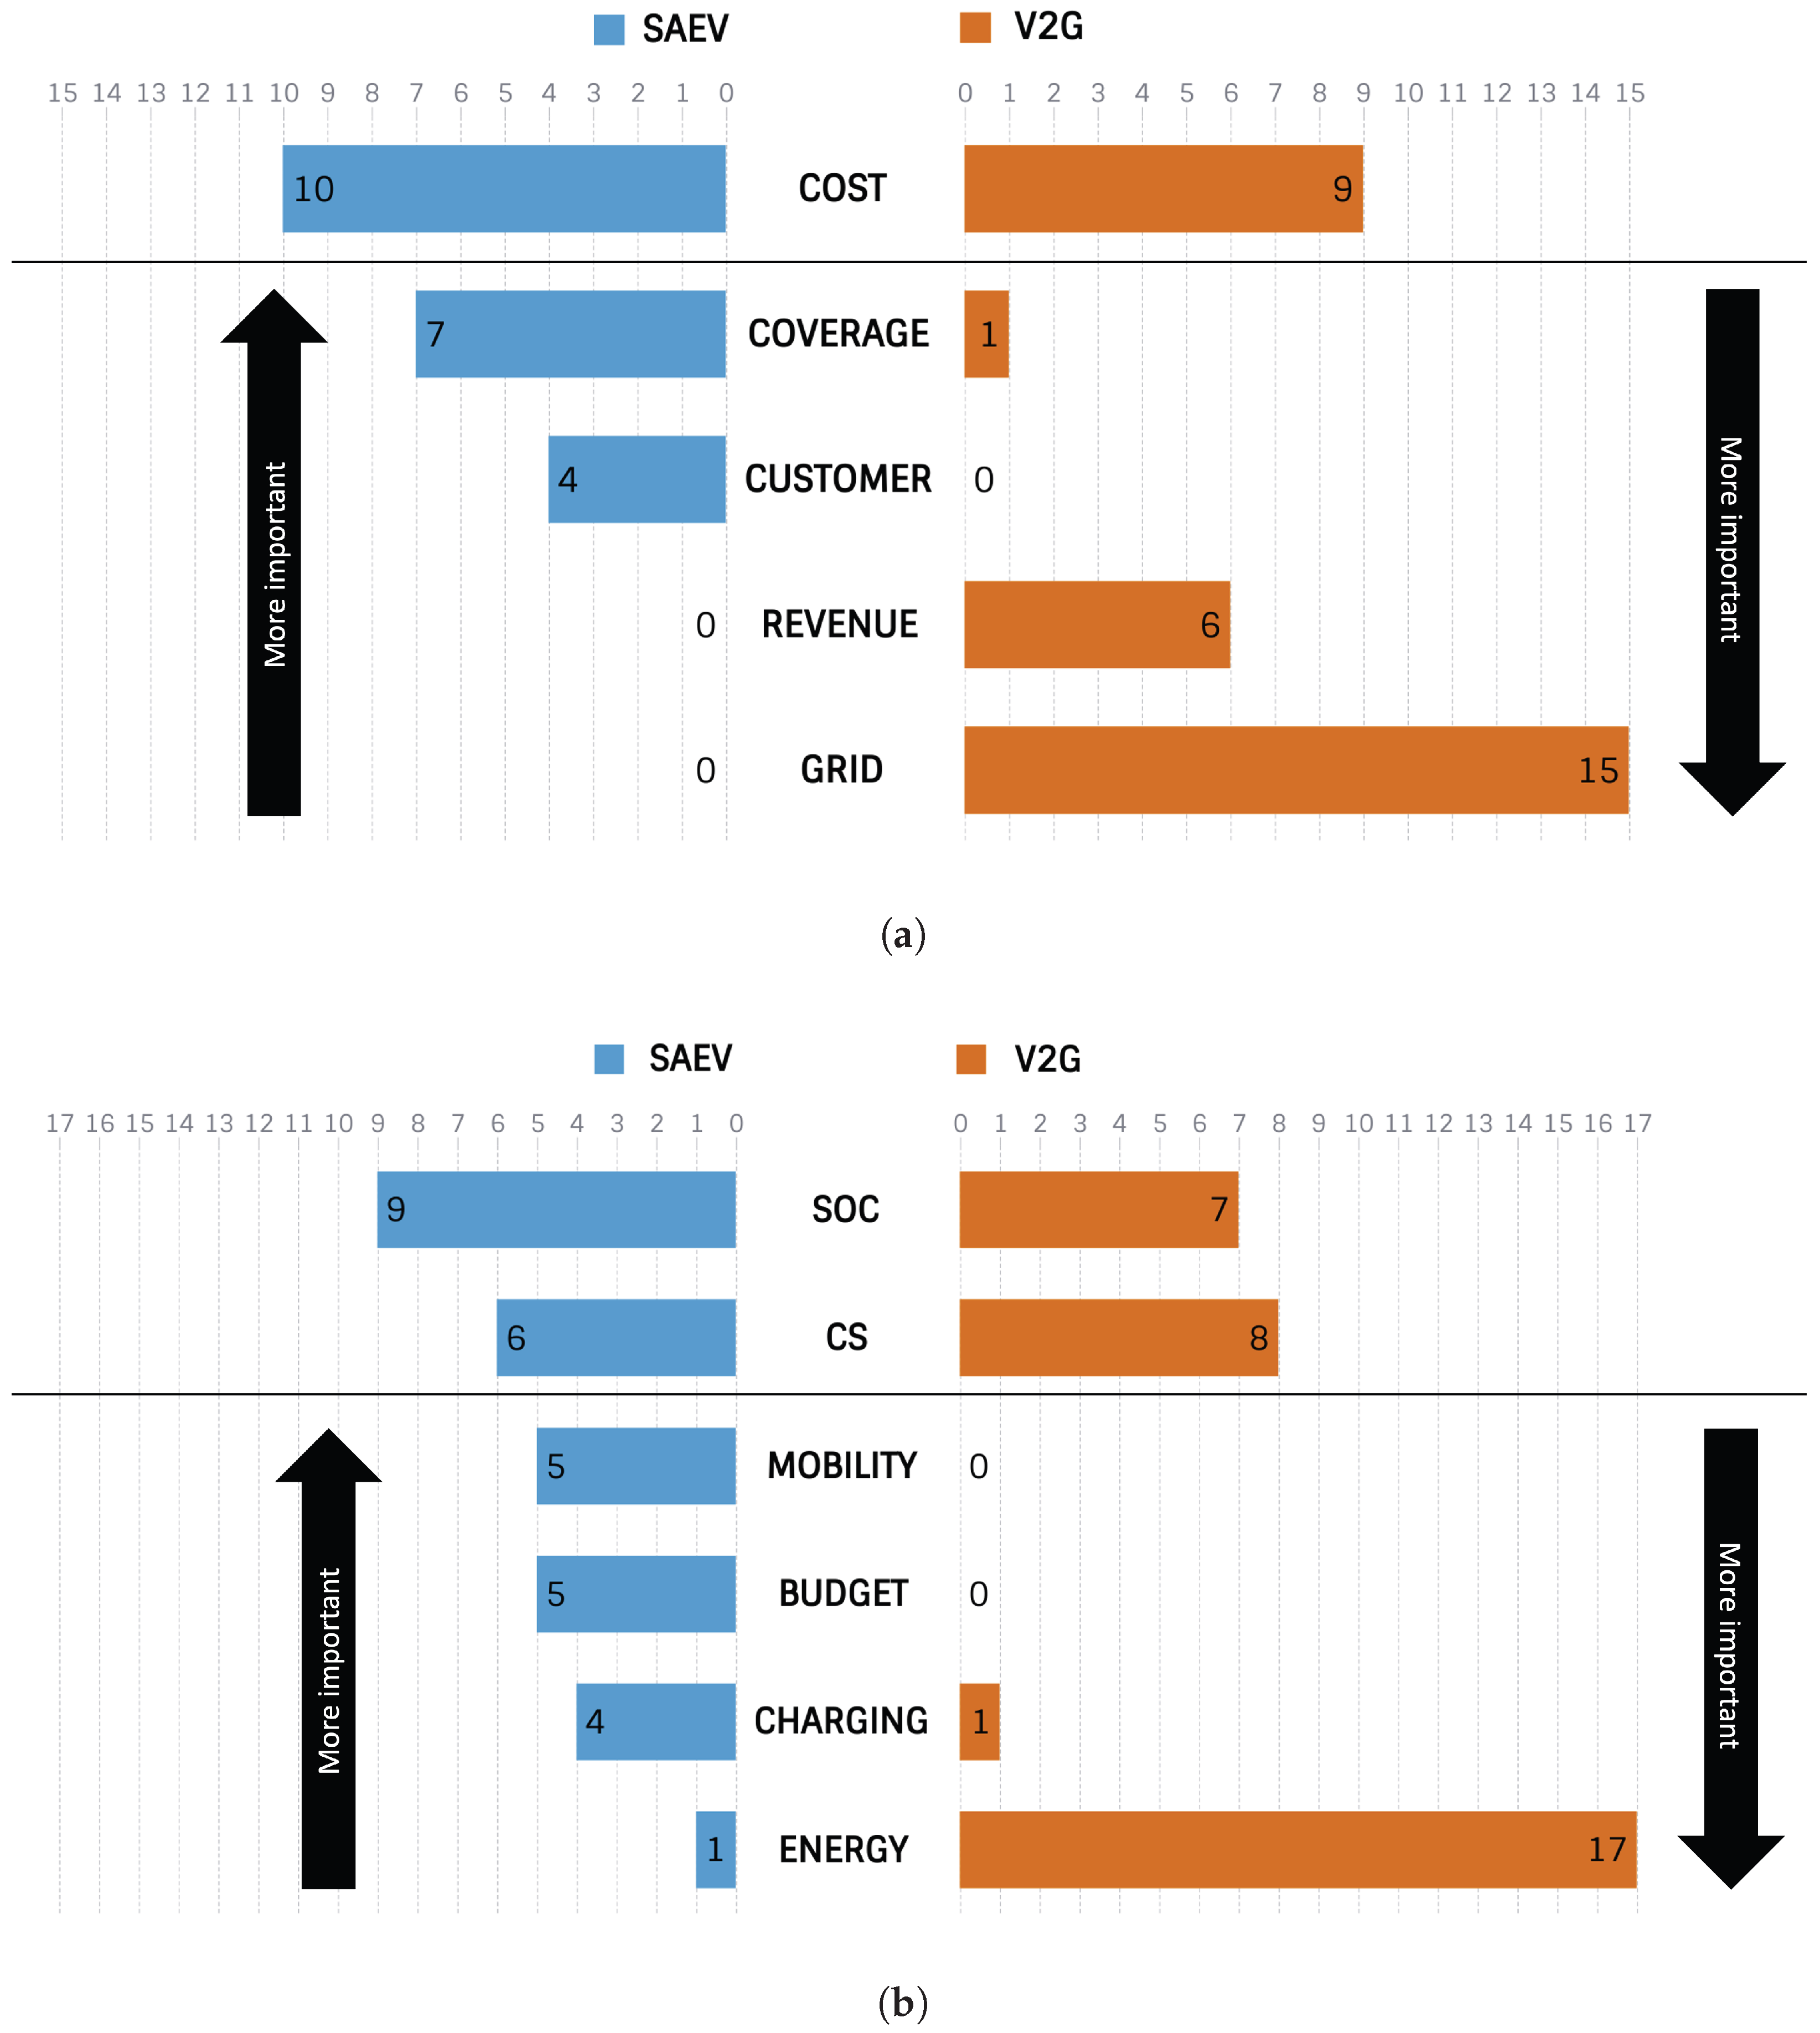


