
Indoor Occupancy Sensing via Networked Nodes (2012–2022): A Review


Abstract
:1. Introduction
2. Comparison with Contemporary Review Articles
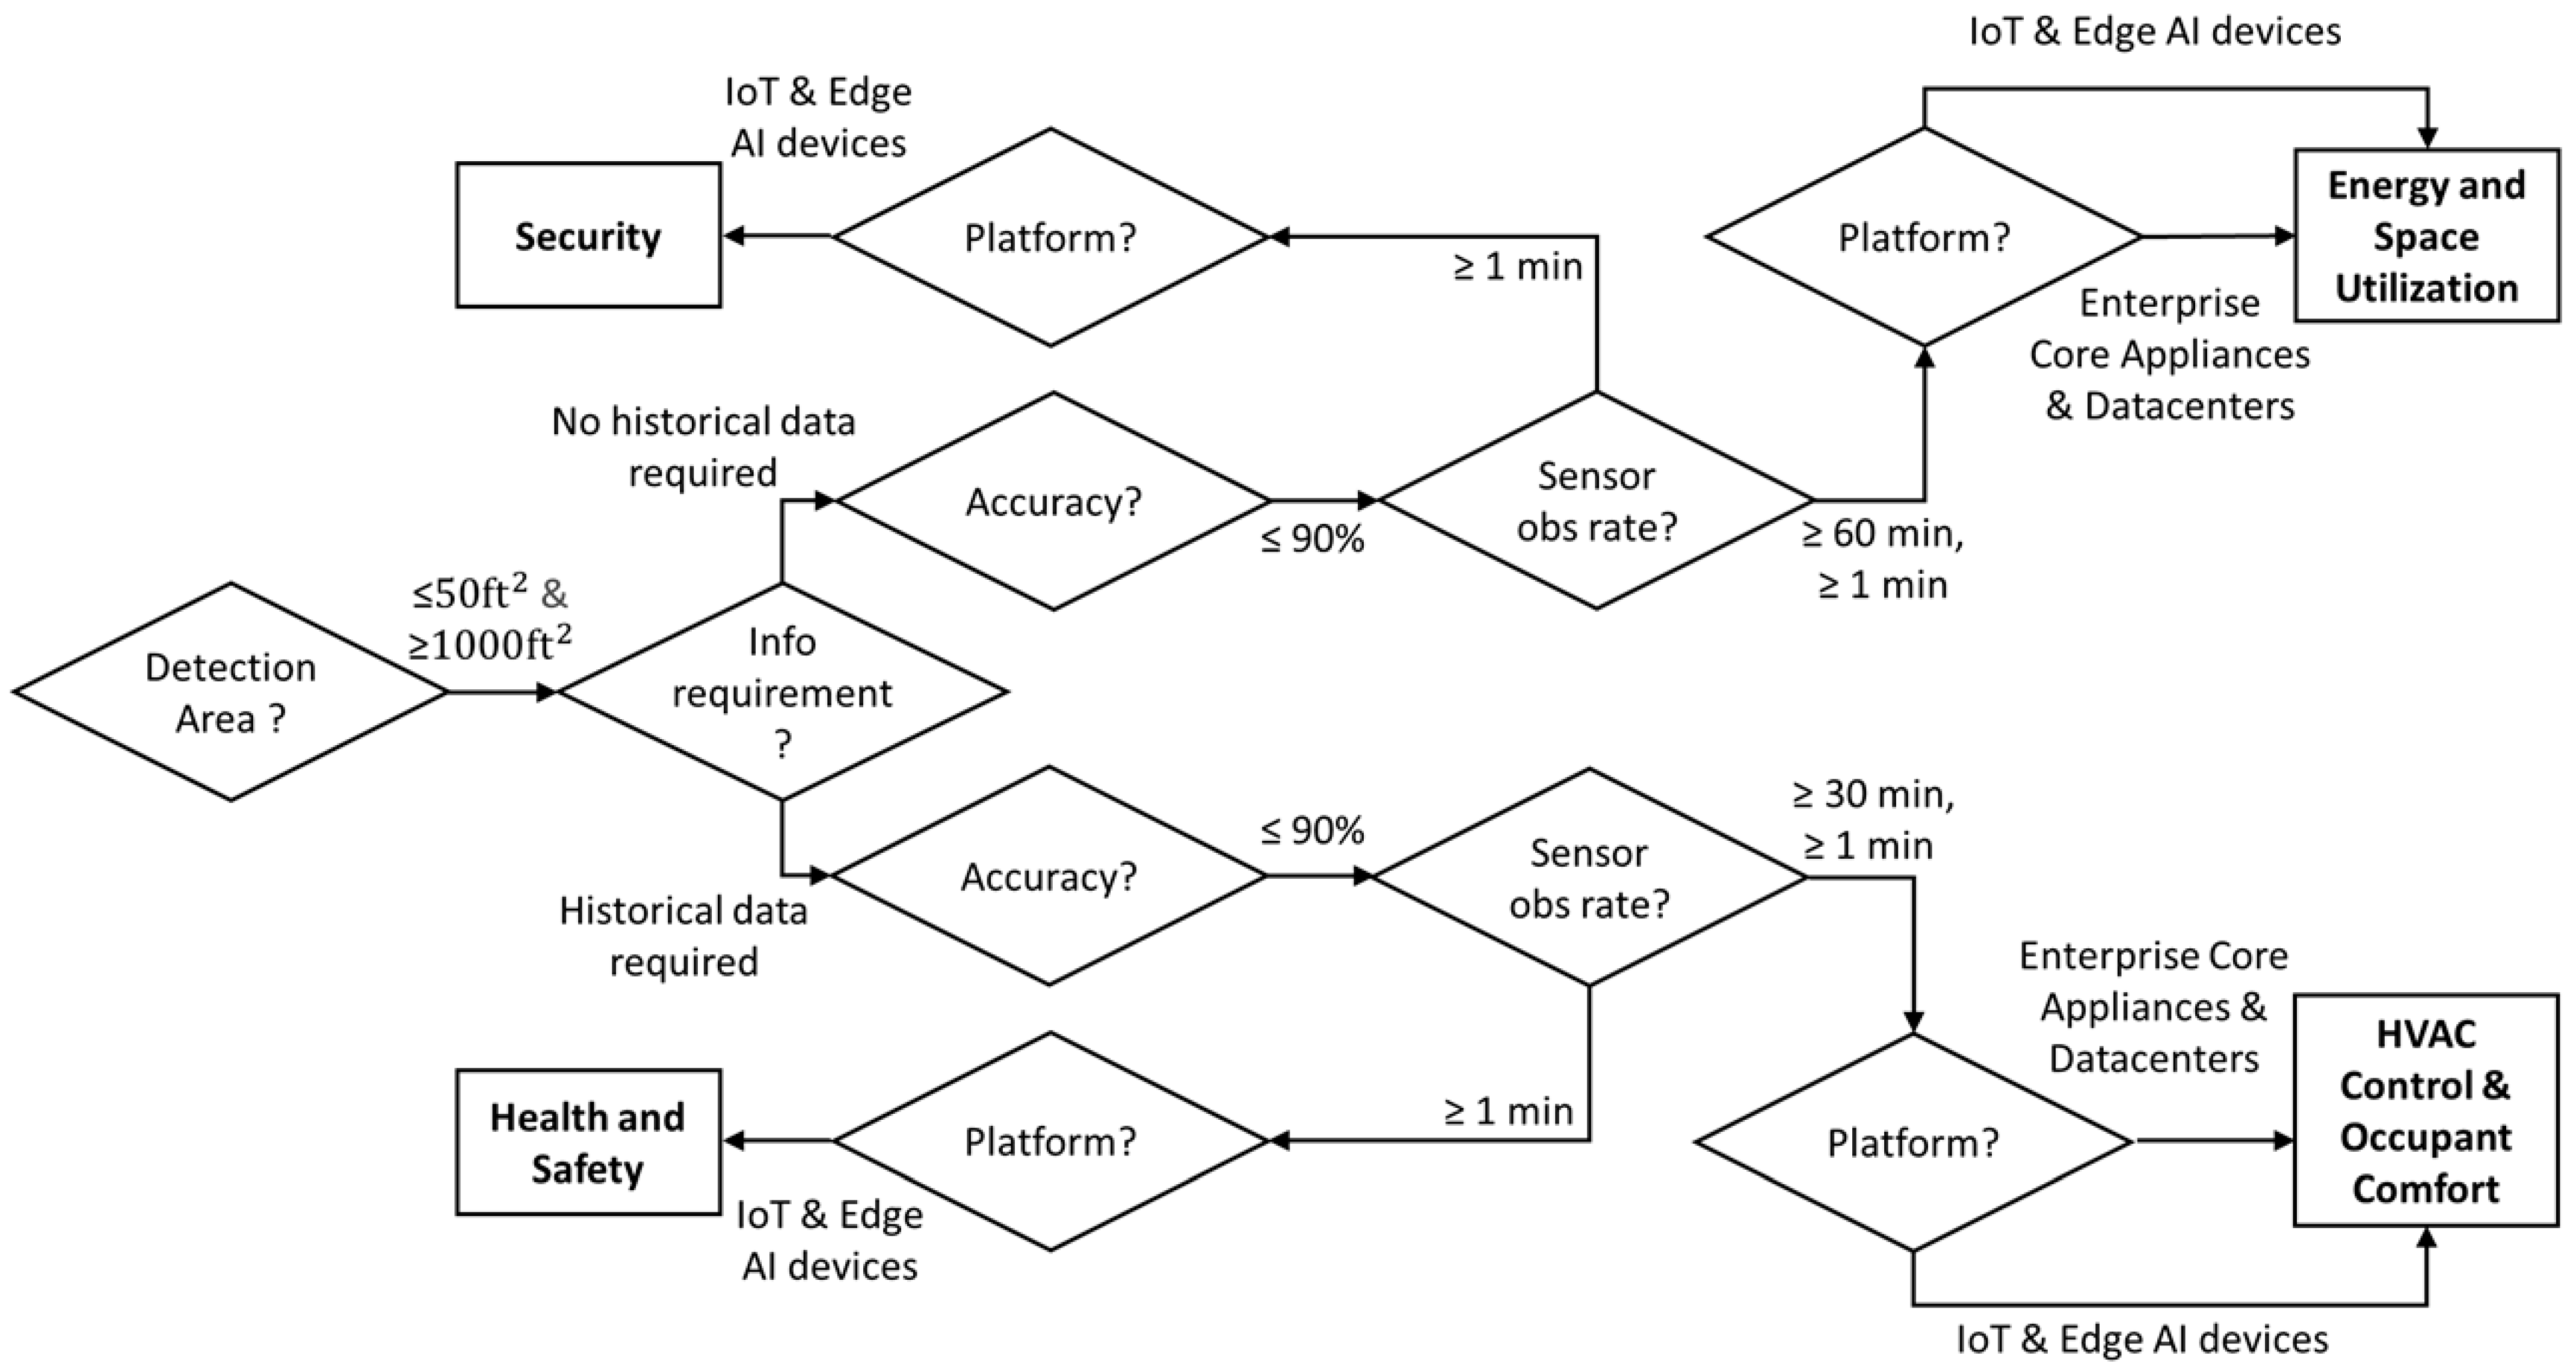
- The review’s primary objective is to guide a method selection process for occupancy sensing via a decision-making process that relies on quantifiable parameters called ADPs. A flowchart that illustrates the method selection process based on ADPs is presented in Figure 1.
- The review limits its focus by only considering methods employing networked sensor nodes and making it mandatory to use PIR technology in combination with other underlying sensing technologies. PIR was explicitly chosen to judge the algorithmic performance of occupancy sensing methods; these need to perform on a standard modality. PIR is the most frequently used occupancy sensing modality [14].
- The review comments on the conformity of reviewed articles to the claimed application areas based on the conformance criteria attached to ADPs which is detailed in Section 4.
3. Methodology
4. Occupancy Sensing Gaps and ADP Identification
5. Solutions to Application Mapping
- A solution can only be used in Energy and Space Utilization applications if and only if these are scalable, i.e., NDD is low. Energy and Space utilization is usually measured across an entire commercial or residential unit. Any solution with a relatively high NDD is essentially non-scalable due to additional infrastructure costs.
- Health and Safety and Security applications require high occupant tracking and detection accuracy. The solutions usually achieve this at the expense of high NDD. Even though such solutions have high accuracy (≥95%), these cannot be employed for HVAC Control, and Occupant Comfort and Energy and Space Utilization applications as scalability is infeasible.
- Although NN-based classification and regression techniques achieve relatively high accuracy, the network training input size is fixed. Thus, any missing sensor time-series data would need to be imputed for the model to be able to produce an inference. Moreover, the pre-requisite of collecting a dataset must be satisfied to deploy any NN.
- Sensors such as CO2 and VOC require almost 30 min to respond reliably to occupancy. Likes of PIR, temperature and light sensors can register occupancy several times a second. This disparity and the resulting advantage of high frequency sensors should be kept in mind while comparing the accuracies for various presented solutions.
- Sensors such as CO2 and VOC are sometimes placed at the ventilation ducts in some of the methods listed in Table 4. Under such scenarios, NDD tends to be very low for these sensors, thus presenting an advantage for using these sensors.
6. Accuracy and Suitability Analysis
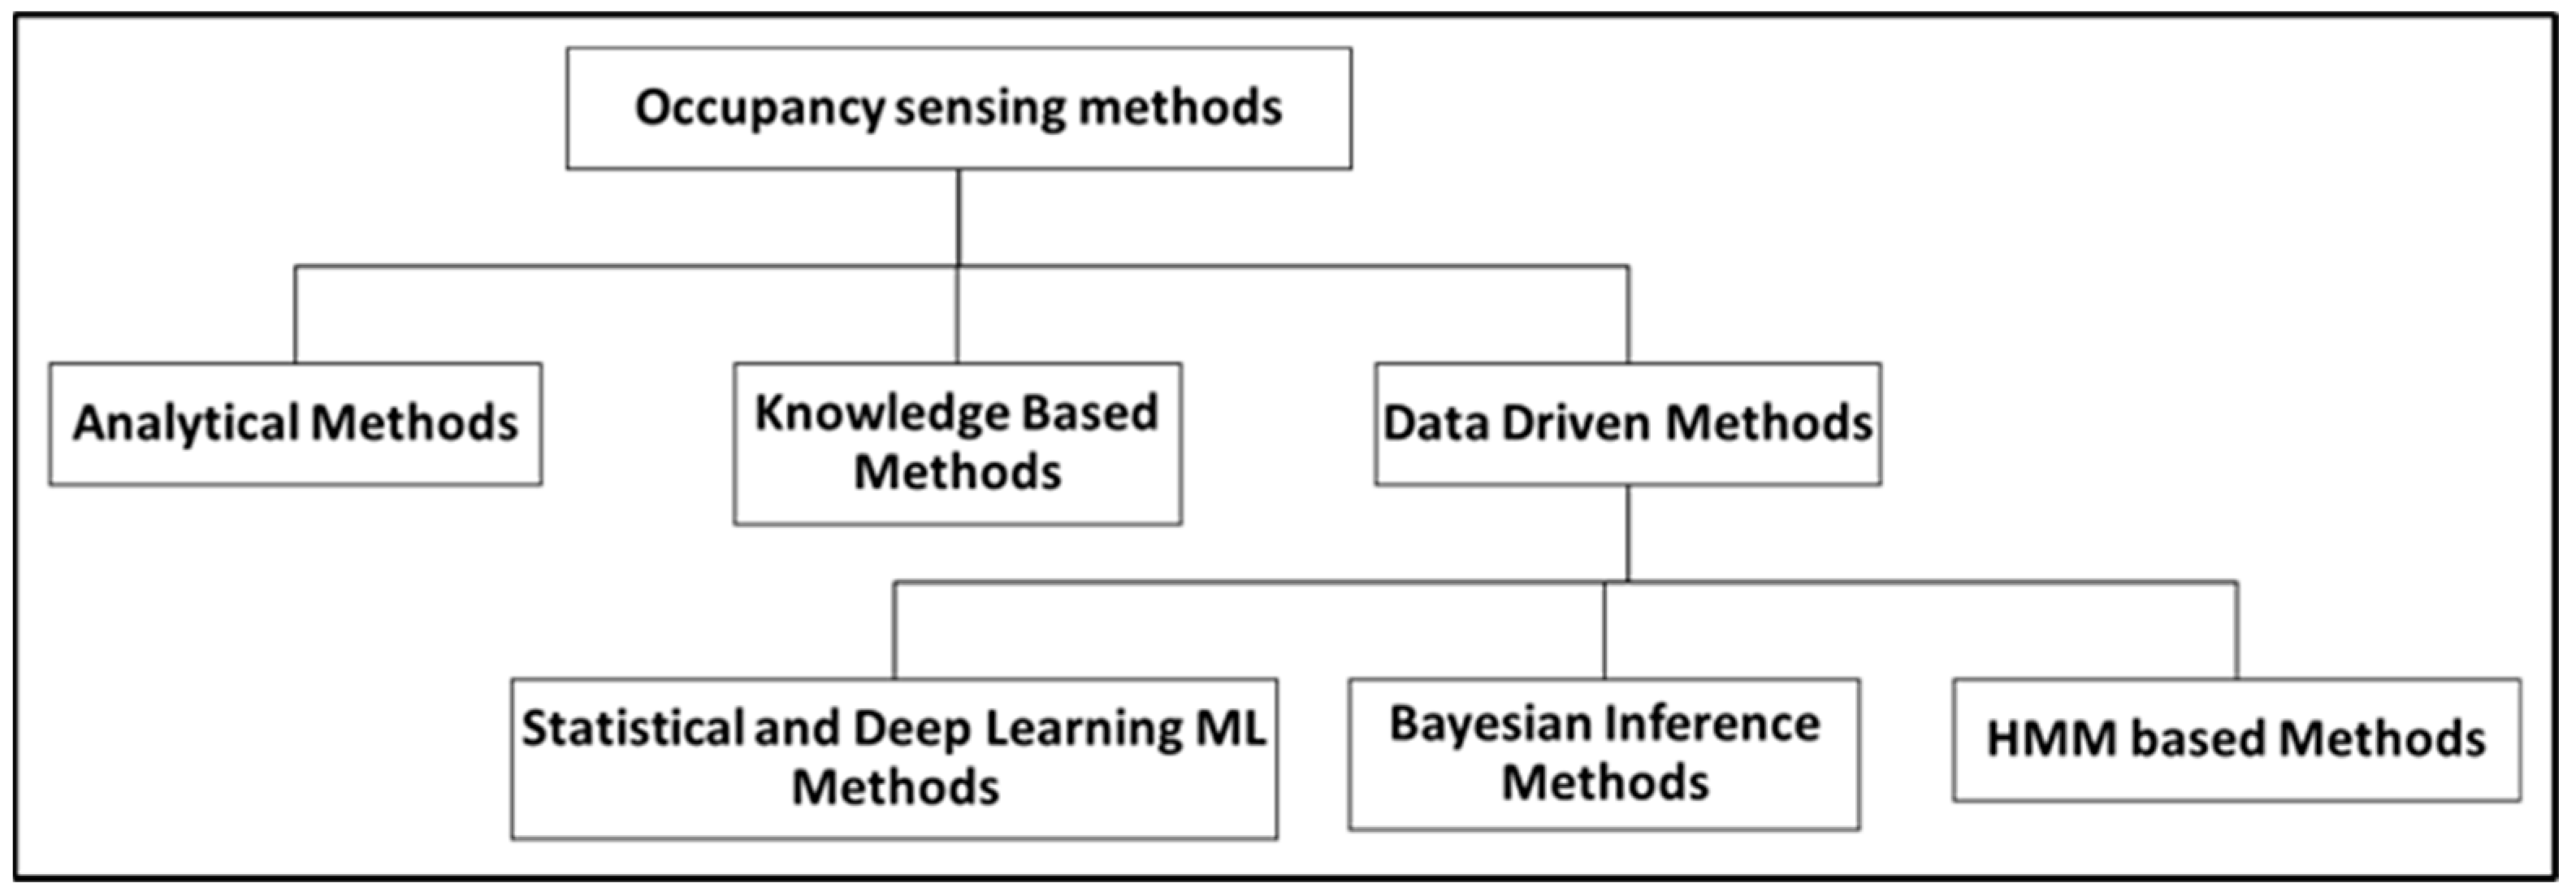
- Statistical and deep learning ML methods
- Bayesian inference methods
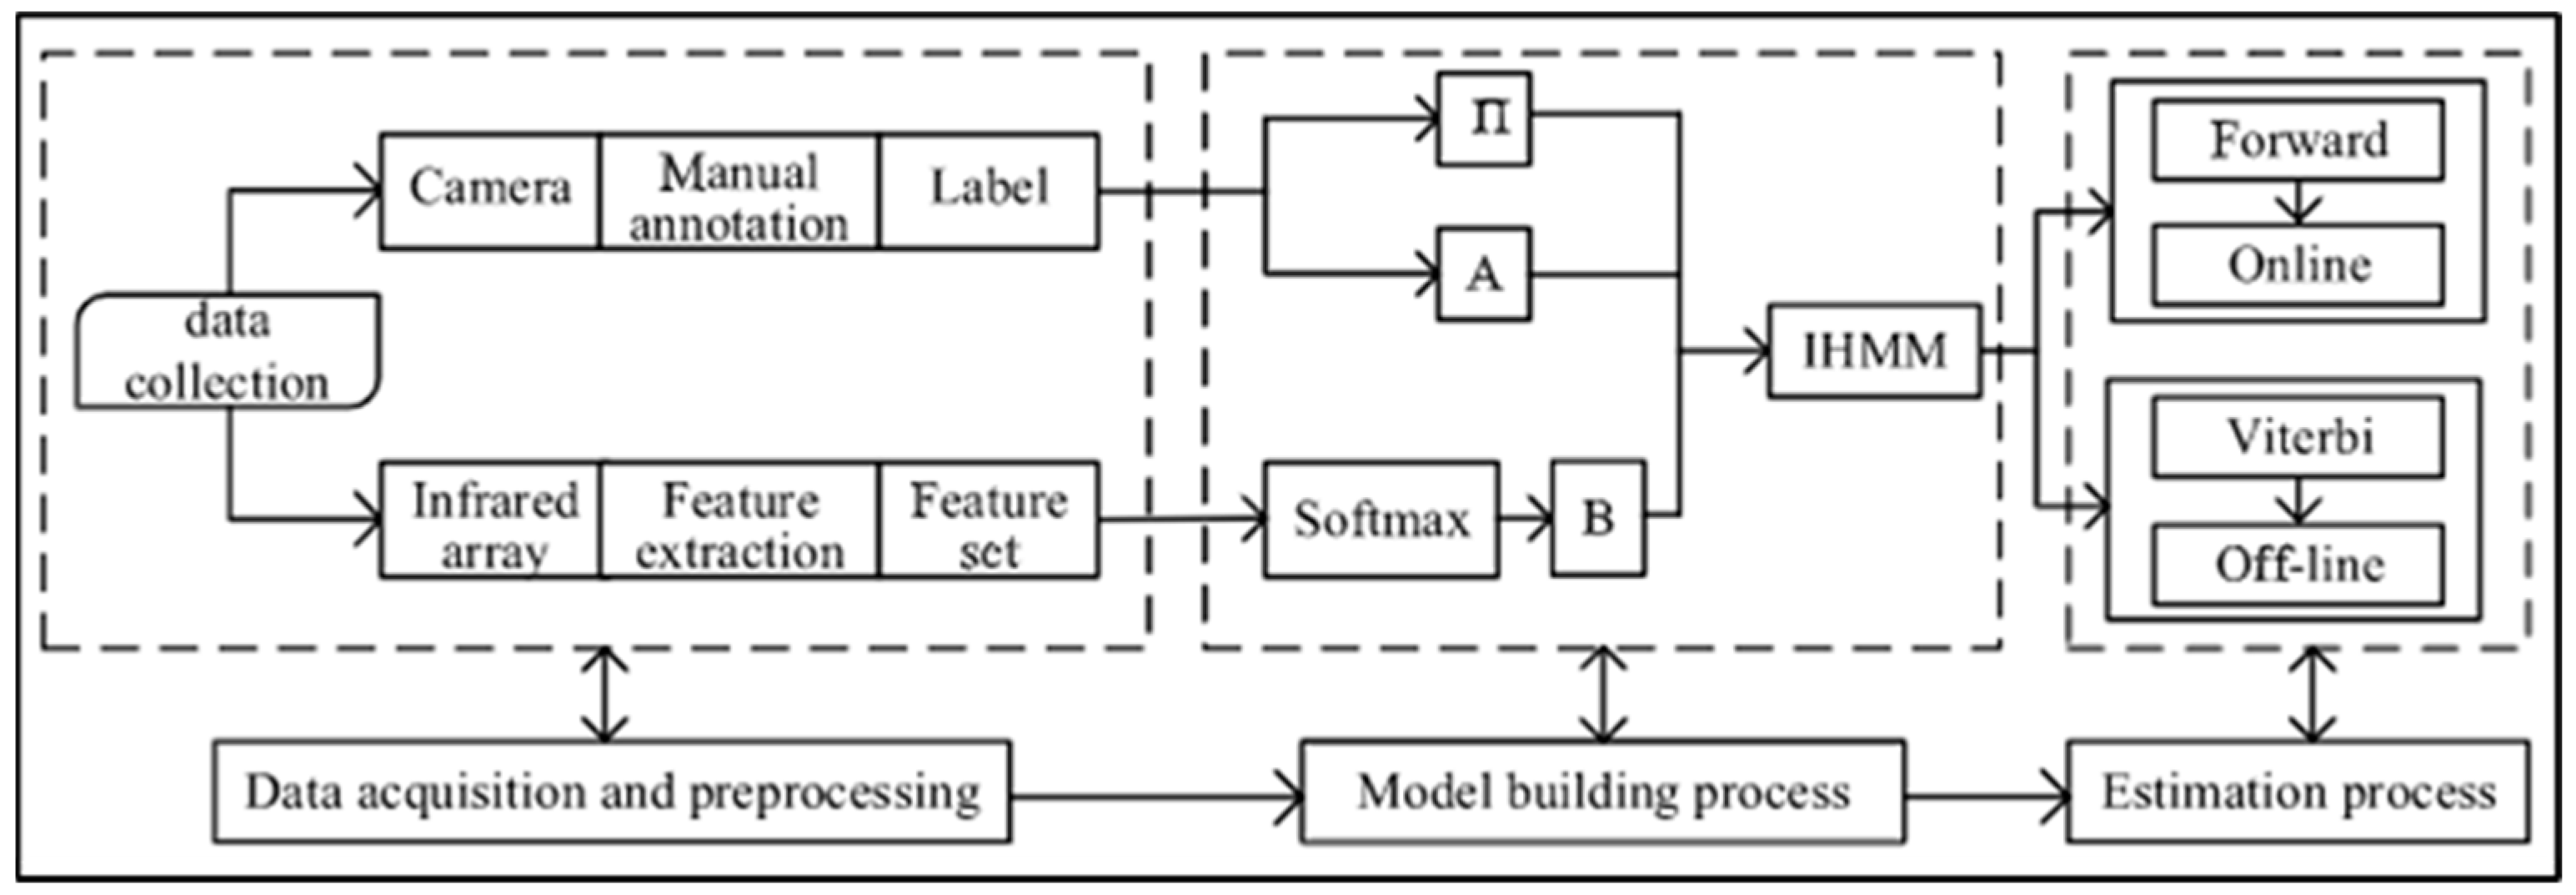
- HMM-based methods
Comments on Solution Conformance to the Claimed Application Areas
7. Discussion and Future Trends
8. Conclusions
Author Contributions
Funding
Conflicts of Interest
Abbreviations
| AI | Artificial Intelligence | ML | Machine Learning |
| ADP | Application-desired Parameters | MTBF | Mean Time Before Failure |
| AR | Autoregressive | NDD | Node Deployment Density |
| ARM | Advanced RISC Machine | NEMA | National Electrical and Manufacturers Association |
| ASHRAE | American Society of Heating, Refrigerating and Air-Conditioning Engineers | NN | Neural Networks |
| AWT | Absolute Water Content | NFPA | National Fire Protection Association |
| CEC | California Energy Commission | ODLL | On-device Lifelong Learning |
| CPE | Customer Premise Equipment | PF | Particle Filter |
| EM | Electromagnetic | PIR | Passive Infrared |
| FFNN | Feed-Forward NN | QDA | Quadratic Discriminant Analysis |
| FoV | Field-of-View | RF | Radiofrequency |
| HMM | Hidden Markov Model | RH | Relative Humidity |
| HVAC | Heating Ventilation and Air-Conditioning | SLEEPIR | Synchronized Low Energy Electronically chopped PIR |
| IHMM | Inhomogeneous HMM | SoC | System-on-a-Chip |
| IBC | International Building Code | SVM | Support Vector Machine |
| IECC | International Energy Conservation Code | TVOC | Total VOC |
| IR | Infrared | VOC | Volatile Organic Compounds |
| IoT | Internet of things | WEKA | Waikato Environment for Knowledge Analysis |
| KNN | K-Nearest Neighbor | ||
| LDA | Linear Discriminant Analysis | ||
| MCU | Microcontroller Unit |
References
- Zhang, W.; Wu, Y.; Calautit, J.K. A review on occupancy prediction through machine learning for enhancing energy efficiency, air quality and thermal comfort in the built environment. Renew. Sustain. Energy Rev. 2022, 167, 112704. [Google Scholar] [CrossRef]
- Bae, Y.; Bhattacharya, S.; Cui, B.; Lee, S.; Li, Y.; Zhang, L.; Im, P.; Adetola, V.; Vrabie, D.; Leach, M.; et al. Sensor impacts on building and HVAC controls: A critical review for building energy performance. Adv. Appl. Energy 2021, 4, 100068. [Google Scholar] [CrossRef]
- Erickson, V.L.; Cerpa, A.E. Thermovote. In Proceedings of the Fourth ACM Workshop on Embedded Sensing Systems for Energy-Efficiency in Buildings-BuildSys 12, New York, NY, USA, 6 November 2012. [Google Scholar] [CrossRef]
- Karmann, C.; Schiavon, S.; Graham, L.T.; Raftery, P.; Bauman, F. Comparing temperature and acoustic satisfaction in 60 radiant and all-air buildings. Build. Environ. 2017, 126, 431–441. [Google Scholar] [CrossRef] [Green Version]
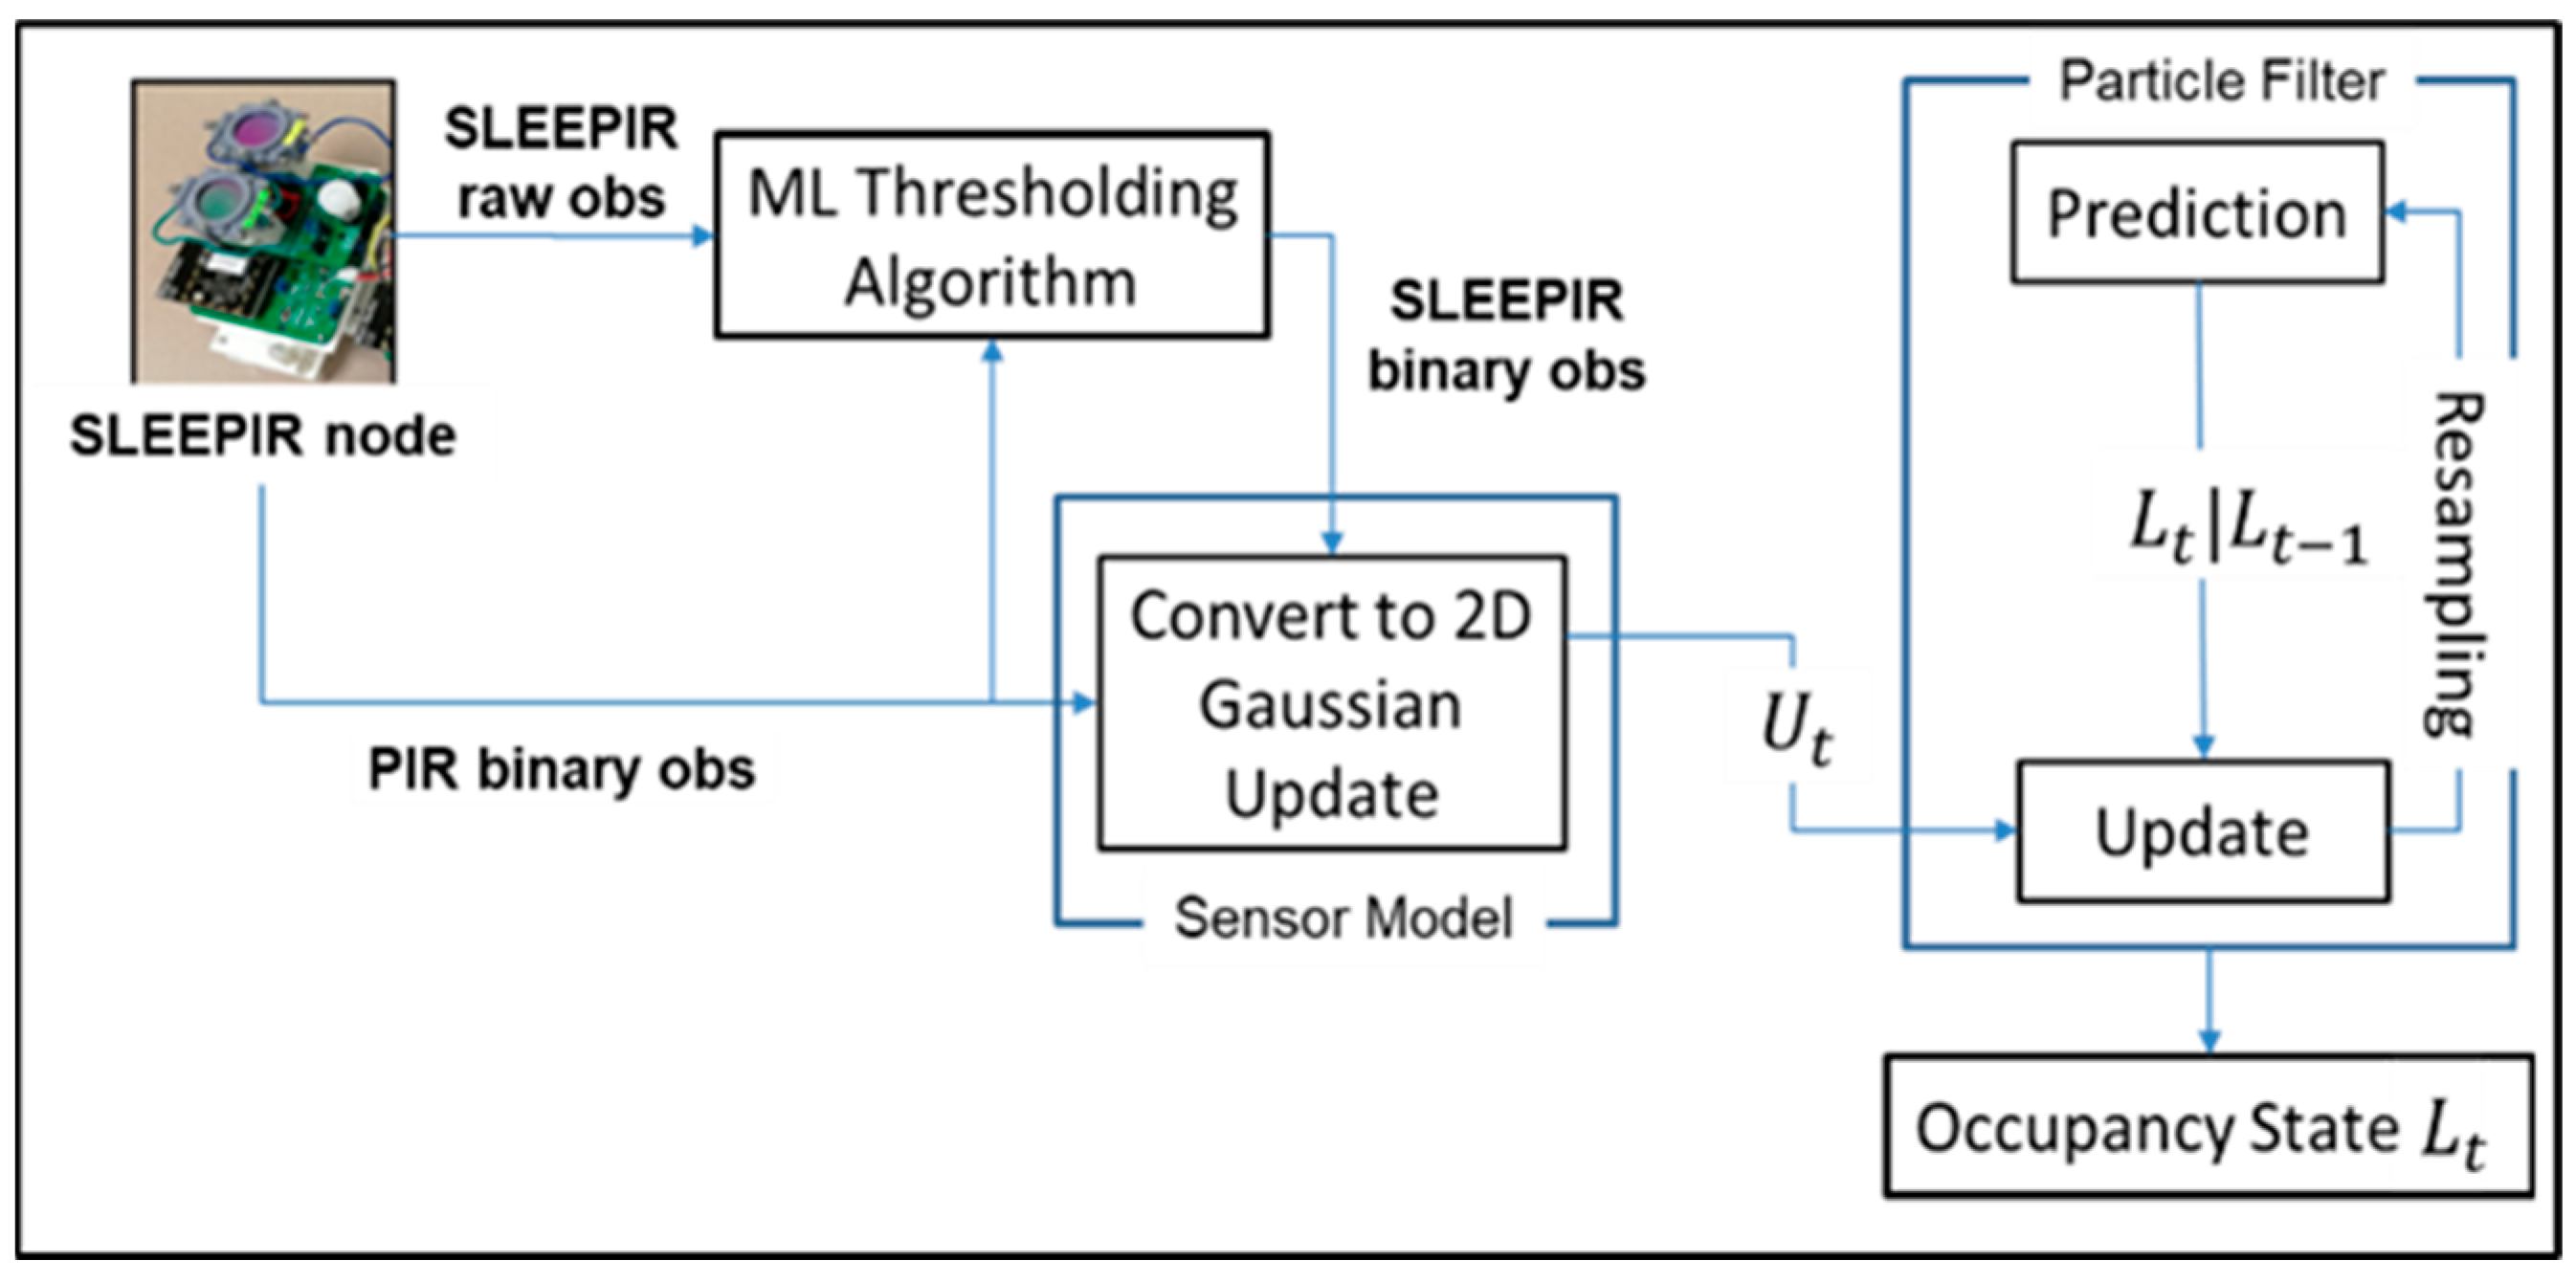
- Emad-Ud-Din, M.; Chen, Z.; Wu, L.; Shen, Q.; Wang, Y. Indoor Occupancy Estimation Using Particle Filter and SLEEPIR Sensor System. IEEE Sens. J. 2022, 22, 17173–17183. [Google Scholar] [CrossRef]
- Zhang, L.; Leach, M.; Bae, Y.; Cui, B.; Bhattacharya, S.; Lee, S.; Im, P.; Adetola, V.; Vrabie, D.; Kuruganti, T. Sensor impact evaluation and verification for fault detection and diagnostics in building energy systems: A review. Adv. Appl. Energy 2021, 3, 100055. [Google Scholar] [CrossRef]
- Adeogun, R.; Rodriguez, I.; Razzaghpour, M.; Berardinelli, G.; Christensen, P.H.; Mogensen, P.E. Indoor Occupancy Detection and Estimation Using Machine Learning and Measurements from an IoT LoRa-based Monitoring System. In Proceedings of the 2019 Global IoT Summit (GIoTS), Aarhus, Denmark, 17–21 June 2019; pp. 1–5. [Google Scholar] [CrossRef] [Green Version]
- Giri, D.; Shreya, S.; Kumari, P.; Yadav, R. Indoor human occupancy detection using Machine Learning classification algorithms & their comparison. IOP Conf. Ser. Mater. Sci. Eng. 2021, 1110, 012020. [Google Scholar] [CrossRef]
- Maaspuro, M. Infrared occupancy detection technologies in building automation-A review. ARPN J. Eng. Appl. Sci. 2018, 13, 8055–8068. [Google Scholar]
- Rueda, L.; Agbossou, K.; Cardenas, A.; Henao, N.; Kelouwani, S. A comprehensive review of approaches to building occupancy detection. Build. Environ. 2020, 180, 106966. [Google Scholar] [CrossRef]
- Nastasi, B.; Markovska, N.; Puksec, T.; Duić, N.; Foley, A. Renewable and sustainable energy challenges to face for the achievement of Sustainable Development Goals. Renew. Sustain. Energy Rev. 2022, 157, 112071. [Google Scholar] [CrossRef]
- Cao, N.; Ting, J.; Sen, S.; Raychowdhury, A. Smart Sensing for HVAC Control: Collaborative Intelligence in Optical and IR Cameras. IEEE Trans. Ind. Electron. 2018, 65, 9785–9794. [Google Scholar] [CrossRef]
- Dong, B.; Kjærgaard, M.B.; De Simone, M.; Gunay, H.B.; O’Brien, W.; Mora, D.; Dziedzic, J.; Zhao, J. Sensing and Data Acquisition. In Exploring Occupant Behavior in Buildings; Springer International Publishing: Berlin/Heidelberg, Germany, 2018; pp. 77–105. [Google Scholar]
- Feagin, B., Jr.; Poplawski, M.E.; Day, J.T. A Review of Existing Test Methods for Occupancy Sensors. United States. 18 August 2020. Available online: https://www.osti.gov/biblio/1668746 (accessed on 17 February 2023).
- Ding, Y.; Han, S.; Tian, Z.; Yao, J.; Chen, W.; Zhang, Q. Review on occupancy detection and prediction in building simulation. Build. Simul. 2022, 15, 333–356. [Google Scholar] [CrossRef]
- Sayed, A.N.; Himeur, Y.; Bensaali, F. Deep and transfer learning for building occupancy detection: A review and comparative analysis. Eng. Appl. Artif. Intell. 2022, 115, 105254. [Google Scholar] [CrossRef]
- Trivedi, D.; Badarla, V. Occupancy detection systems for indoor environments: A survey of approaches and methods. Indoor Built Environ. 2020, 29, 1053–1069. [Google Scholar] [CrossRef]
- Ahmad, J.; Larijani, H.; Emmanuel, R.; Mannion, M.; Javed, A. Occupancy detection in non-residential buildings–A survey and novel privacy preserved occupancy monitoring solution. Appl. Comput. Inform. 2021, 17, 279–295. [Google Scholar] [CrossRef]
- Natarajan, A.; Krishnasamy, V.; Singh, M. Occupancy detection and localization strategies for demand modulated appliance control in Internet of Things enabled home energy management system. Renew. Sustain. Energy Rev. 2022, 167, 112731. [Google Scholar] [CrossRef]
- Azimi, S.; O’Brien, W. Fit-for-purpose: Measuring occupancy to support commercial building operations: A review. Build. Environ. 2022, 212, 108767. [Google Scholar] [CrossRef]
- Rodriguez, I.; Lauridsen, M.; Vasluianu, G.; Poulsen, A.N.; Mogensen, P. The Gigantium Smart City Living Lab: A Multi-Arena LoRa-based Testbed. In Proceedings of the 2018 15th International Symposium on Wireless Communication Systems (ISWCS), Lisbon, Portugal, 28–31 August 2018. [Google Scholar] [CrossRef] [Green Version]
- Gunay, B.; Nagy, Z.; Miller, C.; Ouf, M.; Dong, B. Using Occupant-Centric Control for Commercial HVAC Systems. ASHRAE J. 2021, 63, 30–40. (In English) [Google Scholar]
- California Energy Commission. Building Energy Efficiency Standards for Residential and Nonresidential Buildings: For the 2022 Building Energy Efficiency Standards Title 24, Part 6, and Associated Administrative Regulations in Part 1 (Building Energy Efficiency Standards-Title 24); California Energy Commission: Sacramento, CA, USA, 2022. [Google Scholar]
- International Code Council. International Building Code. 2021. Available online: https://search.library.wisc.edu/catalog/999907647602121 (accessed on 17 February 2023).
- NFPA 99; Standard for Health Care Facilities. N.F.P. Association: New York, NY, USA, 2021.
- International Code Council. International Energy Conservation Code; International Code Council, Inc.: Country Club Hills, IL, USA, 2021. [Google Scholar]
- Jeong, S.-M.; Ahn, J.; Choi, Y.K.; Lim, T.; Seo, K.; Hong, T.; Choi, G.H.; Kim, H.; Lee, B.W.; Park, S.Y.; et al. Development of a wearable infrared shield based on a polyurethane–antimony tin oxide composite fiber. NPG Asia Mater. 2020, 12, 32. [Google Scholar] [CrossRef] [Green Version]
- George, B.; Zangl, H.; Bretterklieber, T.; Brasseur, G. Seat Occupancy Detection Based on Capacitive Sensing. IEEE Trans. Instrum. Meas. 2009, 58, 1487–1494. [Google Scholar] [CrossRef]
- Zhang, Y.; Rasmussen, K. Detection of Electromagnetic Interference Attacks on Sensor Systems. In Proceedings of the 2020 IEEE Symposium on Security and Privacy (SP), San Francisco, CA, USA, 18–21 May 2020. [Google Scholar] [CrossRef]
- Abdelgawad, A.; Bayoumi, M. Data Fusion in WSN. In Resource-Aware Data Fusion Algorithms for Wireless Sensor Networks; Springer: New York, NY, USA, 2012; pp. 17–35. [Google Scholar]
- Tryon, D.L. Bayes’ Network and Smart Sensors–Occupancy Detection. Ph.D. Thesis, The University of Nebraska-Lincoln, Ann Arbor, MI, USA, 2020. [Google Scholar]
- Singh, A.P.; Jain, V.; Chaudhari, S.; Kraemer, F.A.; Werner, S.; Garg, V. Machine Learning-Based Occupancy Estimation Using Multivariate Sensor Nodes. In Proceedings of the 2018 IEEE Globecom Workshops (GC Wkshps), Abu Dhabi, United Arab Emirates, 9–13 December 2018; pp. 1–6. [Google Scholar] [CrossRef] [Green Version]
- Hailemariam, E.; Goldstein, R.; Attar, R.; Khan, A. Real-time occupancy detection using decision trees with multiple sensor types. In Proceedings of the 2011 Symposium on Simulation for Architecture and Urban Design, Boston, MA, USA, 3–7 April 2011; pp. 141–148. [Google Scholar]
- Ekwevugbe, T.; Brown, N.; Pakka, V.; Fan, D. Real-time building occupancy sensing using neural-network based sensor network. In Proceedings of the 2013 7th IEEE International Conference on Digital Ecosystems and Technologies (DEST), Menlo Park, CA, USA, 24–26 July 2013. [Google Scholar] [CrossRef]
- Yang, Z.; Li, N.; Becerik-Gerber, B.; Orosz, M. A Multi-Sensor Based Occupancy Estimation Model for Supporting Demand Driven HVAC Operations. In Proceedings of the 2012 Symposium on Simulation for Architecture and Urban, San Diego, CA, USA, 26 March 2012. [Google Scholar]
- Ai, B.; Fan, Z.; Gao, R.X. Occupancy estimation for smart buildings by an auto-regressive hidden Markov model. In Proceedings of the 2014 American Control Conference, Portland, OR, USA, 4–6 June 2014. [Google Scholar] [CrossRef]
- Wang, C.; Jiang, J.; Roth, T.; Nguyen, C.; Liu, Y.; Lee, H. Integrated sensor data processing for occupancy detection in residential buildings. Energy Build. 2021, 237, 110810. [Google Scholar] [CrossRef]
- Pedersen, T.; Nielsen, K.; Petersen, S. Method for room occupancy detection based on trajectory of indoor climate sensor data. Build. Environ. 2017, 115, 147–156. [Google Scholar] [CrossRef]
- Ding, Y.; Chen, W.; Wei, S.; Yang, F. An occupancy prediction model for campus buildings based on the diversity of occupancy patterns. Sustain. Cities Soc. 2021, 64, 102533. [Google Scholar] [CrossRef]
- Sheikh Khan, D.; Kolarik, J.; Anker Hviid, C.; Weitzmann, P. Method for long-term mapping of occupancy patterns in open-plan and single office spaces by using passive-infrared (PIR) sensors mounted below desks. Energy Build. 2021, 230, 110534. [Google Scholar] [CrossRef]
- Kim, S.H.; Moon, H.J. Case study of an advanced integrated comfort control algorithm with cooling, ventilation, and humidification systems based on occupancy status. Build. Environ. 2018, 133, 246–264. [Google Scholar] [CrossRef]
- Yuan, Y.; Li, X.; Liu, Z.; Guan, X. Occupancy Estimation in Buildings Based on Infrared Array Sensors Detection. IEEE Sens. J. 2020, 20, 1043–1053. [Google Scholar] [CrossRef]
- Chen, Z. Data Processing for Device-Free Fine-Grained Occupancy Sensing Using Infrared Sensors. Ph.D. Thesis, Texas A&M University, Ann Arbor, MI, USA, 2021. [Google Scholar]
- Wu, L.; Gou, F.; Wu, S.-T.; Wang, Y. SLEEPIR: Synchronized Low-Energy Electronically Chopped PIR Sensor for True Presence Detection. IEEE Sensors Lett. 2020, 4, 2500204. [Google Scholar] [CrossRef]
- Fayed, N.S.; Elmogy, M.M.; Atwan, A.; El-Daydamony, E. Efficient Occupancy Detection System Based on Neutrosophic Weighted Sensors Data Fusion. IEEE Access 2022, 10, 13400–13427. [Google Scholar] [CrossRef]
- Lin, J.; Zhu, L.; Chen, W.M.; Wang, W.C.; Gan, C.; Han, S. On-Device Training Under 256KB Memory. arXiv 2022, arXiv:2206.15472. [Google Scholar]
- Azizi, S.; Rabiee, R.; Nair, G.; Olofsson, T. Effects of Positioning of Multi-Sensor Devices on Occupancy and Indoor Environmental Monitoring in Single-Occupant Offices. Energies 2021, 14, 6296. [Google Scholar] [CrossRef]
- Ebadat, A.; Bottegal, G.; Varagnolo, D.; Wahlberg, B.; Hjalmarsson, H.; Johansson, K.H. Blind identification strategies for room occupancy estimation. In Proceedings of the 2015 European Control Conference (ECC), Linz, Austria, 15–17 July 2015; pp. 1315–1320. [Google Scholar] [CrossRef]
- Becker, V.; Kleiminger, W. Exploring zero-training algorithms for occupancy detection based on smart meter measurements. Comput. Sci.-Res. Dev. 2018, 33, 25–36. [Google Scholar] [CrossRef]
- Jin, M.; Jia, R.; Kang, Z.; Konstantakopoulos, I.; Spanos, C. PresenceSense: Zero-training Algorithm for Individual Presence Detection Based on Power Monitoring. In Proceedings of the BuildSys 2014-1st ACM Conference on Embedded Systems for Energy-Efficient Buildings, Memphis, TN, USA, 3 November 2014. [Google Scholar] [CrossRef]
- Filho, C.P.; Marques, E.; Chang, V.; dos Santos, L.; Bernardini, F.; Pires, P.F.; Ochi, L.; Delicato, F.C. A Systematic Literature Review on Distributed Machine Learning in Edge Computing. Sensors 2022, 22, 2665. [Google Scholar] [CrossRef] [PubMed]
- Cai, H.; Gan, C.; Zhu, L.; Han, S. TinyTL: Reduce Memory, Not Parameters for Efficient On-Device Learning. In Proceedings of the Neural Information Processing Systems 2020, Online, 6–12 December 2020. [Google Scholar]
- Hayes, T.; Kanan, C. Online Continual Learning for Embedded Devices. arXiv 2022, arXiv:2203.10681. [Google Scholar]
- Petersen, S.; Pedersen, T.H.; Nielsen, K.U.; Knudsen, M.D. Establishing an image-based ground truth for validation of sensor data-based room occupancy detection. Energy Build. 2016, 130, 787–793. [Google Scholar] [CrossRef]
- Hobson, B.; Lowcay, D.; Gunay, H.B.; Ashouri, A.; Newsham, G.R. Opportunistic occupancy-count estimation using sensor fusion: A case study. Build. Environ. 2019, 159, 106154. [Google Scholar] [CrossRef]


| Reference | Review Study Title | Study Gaps |
|---|---|---|
| [15] | Review on occupancy detection and prediction in building simulation |
|
| [10] | A comprehensive review of approaches to building occupancy detection |
|
| [16] | Deep and transfer learning for building occupancy detection |
|
| [17] | Occupancy detection systems for indoor environments: A survey of approaches and methods |
|
| [18] | Occupancy detection in non-residential buildings: A survey and novel privacy preserved occupancy monitoring solution |
|
| [19] | Occupancy detection and localization strategies for demand modulated appliance control in Internet of Things (IoT) enabled home energy management system |
|
| [2] | Sensor impacts on building and HVAC controls: A critical review for building energy performance |
|
| [8] | Indoor human occupancy detection using Machine Learningclassification algorithms and their comparison |
|
| [20] | Fit-for-purpose: Measuring occupancy to support commercial buildingoperations: A review |
|
| References | Application Area | Gaps |
|---|---|---|
| [5,12,20,21,22,23,24,25] | HVAC Control and Occupant Comfort |
|
| [12,20,21,22,25,26,27,28,29,30,31] | Health and Safety |
|
| [23,25,26,32,33,34] | Energy and Space Utilization |
|
| [35,36,37,38,39,40] | Security |
|
| Application Area | ADPs |
|---|---|
| HVAC Control and Occupant Comfort | Accuracy requirement (ASHRAE): ≥90% Info requirement: Historical/expected occupancy info Execution platforms: Enterprise core appliances, Datacenters, IoT and Edge AI devices Min sensor obs rate (ASHRAE): ≤30 min Max sensor failure rate: No quantification found. Still a research gap [2] Feasible Detection Area (ASHRAE): Office (≤250 ft2), storage (≥50 ft2 and ≤1000 ft2) Feasible Detection Area (CEC): Office (≤250 ft2), multipurpose rooms (≤1000 ft2), indoor spaces (≤300 ft2) Feasible Detection Area (IECC): Indoor spaces (≤300 ft2) |
| Health and Safety | Accuracy requirement (IBC, NFPA): ≥95% Info requirement: Historical/expected occupancy info Execution platforms: IoT, Edge AI devices Min sensor obs rate: ≤1 min (dictated by sensor limitations) Max sensor failure rate (IBC, NFPA): 0.01% Feasible Detection Area (CEC): Lightening control not permitted for shutoff control in healthcare facilities or Egress lightening where power consumption ≤0.1 W/ft2 |
| Energy and Space Utilization | Accuracy requirement (ASHRAE, IECC): ≥90% Info requirement: Contiguous indoor spaces need to be monitored to enable tracking applications. No historical or expected occupancy data needed. Execution platforms: Enterprise core appliances, Datacenters, IoT, Edge AI devices Min sensor obs rate:Hourly Max sensor failure rate: No quantification found. Still a research gap [2] Feasible Detection Area (CEC): Indoor spaces (≤300 ft2), storage rooms (≥50 ft2 and ≤1000 ft2), office space (≤250 ft2). |
| Security | Accuracy requirement (IBC): ≥95% Info requirement: Moderate NDD to enable tracking applications. Execution Platforms: IoT, Edge AI devices Min sensor obs rate: ≤1 min (dictated by sensor limitations) Max sensor failure rate (IBC): 0.01% Feasible Detection Area (CEC): Indoor spaces (≤300 ft2), storage rooms (≥50 ft2 and ≤1000 ft2), office space (≤250 ft2). |
| Solution | Data Filtering and Fusion Techniques | Input Data Streams | Detection Measure | NDD | Spatial/Temporal Resolution and Average Accuracy | Author Claimed Application Areas |
|---|---|---|---|---|---|---|
| [31] | Bayesian Occupancy Model | PIR sensor nodes | Bayesian Inference based on Prior Probability computed over historical data and Sensor Model output | Multiple Zones, 60 s, 71% | Energy and Space Utilization | |
| [32] | SVM, LDA, QDA, RF-based ML algorithms | PIR, Light, Temperature, Sound, CO2 | ML Inference | Single Zone, 30 s, 98.4% | Health and Safety, Security, HVAC Control and Occupant Comfort | |
| [33] | Decision Tree | PIR, Sound, Power use, CO2 | ML Inference | Single Zone, 60 s, 97.9% | Health and Safety, Security, HVAC Control and Occupant Comfort | |
| [35] | RBF-based Neural Network | PIR, Humidity, Light, Sound, Temperature, CO2 | ML Inference | Multiple Zones, 60 s, 87.62% | Energy and Space Utilization | |
| [34] | Statistical Feature-based FFNN | PIR, Temperature, Sound, CO2 | ML Inference | 27 sensor nodes in an open-plan office space with max 8 occupants | Multiple Zones, 5 min, 75% | Energy and Space Utilization |
| [5] | Particle Filter-based Estimator | SLEEPIR, PIR, Temperature | Threshold placed on presence probability | Zone-level, 60 s, 96.2% | HVAC Control and Occupant Comfort, Energy and Space Utilization | |
| [36] | AR HMM | PIR, Temperature, Reed switches, Airspeed, CO2 | Expectation Maximization algorithm applied to find the local optimal solution for AR HMM | 19 sensor nodes in a lab with max 10 occupants | Multiple Zones, 20 s, 84% | Energy and Space Utilization |
| [41] | Multinomial Logistic Regression | PIR, Power usage, Temperature, Humidity, Light, Door sensors, CO2 | Predicted probability of the occupants being active, inactive or away | Multiple Zones, 60 s, 94.9% | HVAC Control and Occupant Comfort | |
| [37] | RF, Decision Tree, KNN, SVM | PIR, Temperature | ML Inference | Multiple Zones variable time, 99% | Energy and Space Utilization | |
| [7] | FFNN | PIR, Humidity, Light, Pressure, Temperature, CO2, TVOC, Sound, Door and Window sensor | ML Inference | Multiple Zones, 60 s, 94.3% | HVAC Control and Occupant Comfort, Energy and Space Utilization | |
| [38] | Trajectory Analysis of Indoor Climate Sensor data | PIR, Temp, CO2, VOC, RH, AWT, Sound | 2-min and 5-min trends of sensor data are analyzed to determine occupancy probability | Single Zone, 5 min, 77.8% | HVAC Control and Occupant Comfort | |
| [39] | Gaussian Distribution Model | PIR | Gaussian distribution used to fit the occupancy profiles. An accumulative function of Gaussian distributions for all sensors is used to predict occupancy | Multiple Zones, 60 min, 85% | Energy and Space Utilization | |
| [40] | Multi-sensor Aggregation | PIR | Aggregation of PIR triggers over 5 min duration | Multiple Zones, 5 min, 87.5% | HVAC Control and Occupant Comfort, Energy and Space Utilization | |
| [42] | Inhomogeneous HMM | PIR | Posterior probability evaluated via Maximum a posteriori and Viterbi Algorithm | Single Zone, 60 s, 99% | HVAC Control and Occupant Comfort, Energy and Space Utilization |
| Solution | ADPs |
|---|---|
| [31] | Accuracy: 71.0% Information requirement: Prior probabilities for Bayesian model were calculated using four weeks of historical data. Execution Platforms: Samsung SmartThings Hub Sensor observation rate: 60 s Sensor Failure rate: High MTBF as per datasheet for ZMOTION® ZEPIR0AA PIR sensor Detection Area: |
| [32] | Accuracy: 98.4% Information requirement: Labeled dataset for ML Execution Platforms: ARM based Beaglebone SoC Sensor observation rate: 30 s Sensor Failure rate: Unspecified PIR sensor Detection Area: |
| [33] | Accuracy: 97.9% Information requirement: Labeled dataset for ML Execution Platforms: PC/Server Sensor observation rate: 60 s Sensor Failure rate: PIR Sensor MTBF unknown (Phidgets 1111 IR Motion Sensor) Detection Area: |
| [35] | Accuracy: 87.6% Information requirement: Labeled dataset for ML Execution Platforms: Arduino Black Widow single-board MCU, MATLAB on PC/Server Sensor observation rate: 60 s Sensor Failure rate: Unspecified PIR sensor Detection Area: |
| [34] | Accuracy: 75.0% Information requirement: Labeled dataset for ML Execution Platforms: HOBO U series event loggers, MATLAB and WEKA on PC/Server Sensor observation rate: 5 min Failure rate: Unspecified PIR sensor Detection Area: < |
| [5] | Accuracy: 96.2% Information requirement: Sensor data for correlation evaluation, Labeled dataset for ML Execution Platforms: Onboard SoC (EFR32BG13, Silicon Labs) onboard nodes, Edge AI (Raspberry Pi 4) Sensor observation rate: 60 s Sensor Failure rate: >10,000 h (Panasonic® EKMB1391111K) Detection Area: |
| [36] | Accuracy: 84.0% Information requirement: time-series data correlations need to be evaluated pre-deployment. Execution Platforms: wireless measurement nodes, PC/Server Sensor observation rate: 20 s Failure rate: Unspecified PIR sensor Detection Area: < |
| [41] | Accuracy: 94.9% Information requirement: Labeled dataset for ML Execution Platforms: BACnet ™ for sensor connectivity, R on Workstation Sensor observation rate: 60 s Failure rate: Unspecified PIR sensor Detection Area: |
| [37] | Accuracy: 99.0% Information requirement: Domain knowledge, Labeled dataset for ML Execution Platforms: NI Compact DAQ, scikit-learn on ARM based Beaglebone Black SoC Sensor observation rate: Variable Failure rate: Unspecified PIR sensor Detection Area: |
| [7] | Accuracy: 94.3% Information requirement: Labeled dataset for ML Execution Platforms: Arduino Uno, ARM based Kerlink® IoT Wirnet 868 Station Sensor observation rate: 60 s Failure rate: >10000 h (Panasonic® PaPIRs EKMB) Detection Area: |
| [38] | Accuracy: 77.8% Information requirement: Some method parameters and thresholds are set empirically for each sensor node. Execution Platforms: Arduino Mega, PC/Server Sensor observation rate: 5 min Failure rate: High MTBF as per datasheet (RE 200 B) Detection Area: |
| [39] | Accuracy: 85% Information requirement: Historical sensor data required for past twenty-four days. Execution Platforms: PC/Server Sensor observation rate: 60 min Failure rate: High MTBF as per datasheet (HPC005 infrared people counter) Detection Area: |
| [40] | Accuracy: 87.5% Information requirement: No historical data required. Execution Platforms: SmartThings cloud platform, IoT devices Sensor observation rate: 5 min Failure rate: High MTBF as per datasheet (T3L-SS014, IM6001-MTP01, STS-IRM-25) Detection Area: |
| [42] | Accuracy: 99% Information requirement: Prior ground-truth and historical sensor data required for parameter training. Execution Platforms: MATLAB 2016a, Pycharm Sensor observation rate: 60 s Failure rate: High MTBF as per datasheet (AMG8853) Detection Area: |
Disclaimer/Publisher’s Note: The statements, opinions and data contained in all publications are solely those of the individual author(s) and contributor(s) and not of MDPI and/or the editor(s). MDPI and/or the editor(s) disclaim responsibility for any injury to people or property resulting from any ideas, methods, instructions or products referred to in the content. |
© 2023 by the authors. Licensee MDPI, Basel, Switzerland. This article is an open access article distributed under the terms and conditions of the Creative Commons Attribution (CC BY) license (https://creativecommons.org/licenses/by/4.0/).
Share and Cite
Emad-Ud-Din, M.; Wang, Y. Indoor Occupancy Sensing via Networked Nodes (2012–2022): A Review. Future Internet 2023, 15, 116. https://doi.org/10.3390/fi15030116
Emad-Ud-Din M, Wang Y. Indoor Occupancy Sensing via Networked Nodes (2012–2022): A Review. Future Internet. 2023; 15(3):116. https://doi.org/10.3390/fi15030116
Chicago/Turabian StyleEmad-Ud-Din, Muhammad, and Ya Wang. 2023. "Indoor Occupancy Sensing via Networked Nodes (2012–2022): A Review" Future Internet 15, no. 3: 116. https://doi.org/10.3390/fi15030116