
CvAMoS—Event Abstraction Using Contextual Information

Department of Applied Mathematics and Computer Science, Technical University of Denmark, 2800 Kongens Lyngby, Denmark
*
Author to whom correspondence should be addressed.
†
These authors contributed equally to this work.
Future Internet 2023, 15(3), 113; https://doi.org/10.3390/fi15030113
Submission received: 9 February 2023
/
Revised: 3 March 2023
/
Accepted: 15 March 2023
/
Published: 18 March 2023
(This article belongs to the Special Issue IoT-Based BPM for Smart Environments)
Abstract
:Process mining analyzes events that are logged during the execution of a process, with the aim of gathering useful information and knowledge. Process discovery algorithms derive process models that represent these processes. The level of abstraction at which the process model is represented is reflected in the granularity of the event log. When a process is captured by the usage of sensor systems, process activities are recorded at the sensor-level in the form of sensor readings, and are therefore too fine-grained and non-explanatory. To increase the understandability of the process model, events need to be abstracted into higher-level activities that provide a more meaningful representation of the process. The abstraction becomes more relevant and challenging when the process involves human behavior, as the flexible nature of human actions can make it harder to identify and abstract meaningful activities. This paper proposes CvAMoS, a trace-based approach for event abstraction, which focuses on identifying motifs while taking context into account. A motif is a recurring sequence of events that represents an activity that took place under specific circumstances depicted by the context. Context information is logged in the event log in the form of environmental sensor readings (e.g., the temperature and light sensors). The presented algorithm uses a distance function to deal with the variability in the execution of activities. The result is a set of meaningful and interpretable motifs. The algorithm has been tested on both synthetic and real datasets, and compared to the state of the art. CvAMoS is implemented as a Java application and the code is freely available.
1. Introduction
Process mining [1] analyzes events that are logged during the execution of a business process, with the aim of gathering useful information and knowledge. Process discovery is the task of generating a process model, starting from an event log, such that it represents the process as it is collected in the event log. The main scope of the discovery is to obtain a process model that is understandable by the experts and that can be used to verify if the process executions are the expected ones. The quality of the process model is reflected in the quality of the data used for the derivation.
When data in the event log are recorded in a too fine-grained fashion, the process model becomes too complex and no longer interpretable, and is thus less effective in extracting knowledge regarding the underlying process. For example, a process captured by the use of sensor systems. Events collected by sensor systems correspond to changes in the sensor states. Instead, the activities in a process model must be at a higher level of abstraction in order to be interpreted as the execution of a behavior performed by a human being rather than a sensory behavior. For this reason, sensor events cannot be interpreted by process experts and need to be abstracted in form of higher-level activities that exist at the process level.
When the process refers to human behavior, the abstraction problem becomes more relevant and challenging. Sensor systems are a valuable means to automatically capture human-related processes. The way human beings behave can be intended as the execution of a series of activities in order to accomplish a goal [2], that fits in the definition of a business process [1]. However, there is a significant difference between a business process and a human-related process [3]. The former is typically structured and composed of a well-defined sequence of activities. The latter is unstructured [4], and activities are combined based on the specific instance, i.e., they are case-dependent. Indeed, the process participant decides the activities to be executed and their execution order, leading to a flexible structure of the process [5]. As a consequence, the set of activities is not completely known ex-ante, and the way the activities are combined varies from execution to execution and is influenced by the context. The context is a set of measures that defines the circumstances under which the process instance is executed. However, sensor systems provide environmental data that can represent the context, such as the temperature or the weather. On the one hand, we have information collected by sensor systems that are too fine-grained, while on the other hand, there is complexity in aggregating the events and understanding the activities performed. As mentioned above, including the context in the abstraction of activities is crucial as it allows us to distinguish behaviors based on the changes in the context.
The ability to capture and analyze human-related processes represents a valuable opportunity in many fields. One of the areas that can benefit from these techniques is healthcare. Sensors can be used to monitor the treatment process of patients in hospitals to improve the quality of service, or they can be used to track the surgery process inside a hospital for better management [6]. Processes in hospitals are strongly influenced by contextual factors such as the weather or particular events. A different use case in the context of personalized healthcare is the analysis of the routine of patients suffering from dementia, to monitor the course of the disease [7]. The integration between sensor systems and process modeling is also recognized in other areas such as smart factories [8]. In particular, the integration between event processing and process management enables the monitoring and control of factory processes based on real-time data, where the process refers to both machine and manual activities. However, all of the aforementioned cases highlight the need to bridge the gap between the different levels of granularity at which the data are collected and the expected process activities. Although this problem has received substantial interest in the literature, there is a lack of approaches able to abstract activities while considering other attributes, i.e., the context.
In this paper, we present CvAMoS, an event abstraction technique that aims to identify recurring sequences of activities while also considering contextual variables. In particular, the approach works on the sensors that have detected the execution of an activity, as well as environmental sensors that have recorded the state of the environment while the activity was being performed. Our goal is to identify recurring patterns of sensor events and interpret them as higher-level activities that can be represented at the process level. The proposed method is an extension of a previous version [9] that only focused on recognizing common sequences of activities that show a high-level of similarity among traces. The research undertaken aims to tackle the following research questions.
- RQ1
- (Identification) Is the approach capable of identifying meaningful patterns of behavior starting from low-level events?
- RQ2
- (Context) Is the approach able to distinguish patterns based on their execution context?
- RQ3
- (Filter) Is the approach capable of abstracting an event log by aggregating patterns?
- RQ4
- (Time) Is the algorithm applicable, from a computation time point of view? Is the approach capable of abstracting the patterns in terms of time?
CvAMoS focuses on the identification of recurring patterns of behavior, at the trace level, in the form of sub-traces that show a high-level of commonalities. The algorithm considers environmental sensors while identifying the patterns, in order to distinguish them based on the state of the environment. The approach generates a list of patterns, which can then be used to abstract the original event log. The objective is therefore to recognize a series of activities that are common in most traces, under the same set of circumstances. The sequences illustrate a specific configuration of sensor measurements that can be linked to the execution of a higher-level activity. To better explain the functionalities of the approach, let us consider the example of a person living in a smart apartment equipped with presence sensors. The sensor system also produces continuous values on the weather conditions. The sensors allow for capturing activities as well as contextual variables such as the weather. Let us consider an environment in which it is snowing, and the person is more likely to go to the window often to admire the view. Let us consider another day when the weather is foggy and rainy, in this case going to the window often could be linked to anomalous behavior (i.e., there is no apparent reason for such action, which is therefore considered anomalous). Having information regarding the context allows distinguishing between these two activities, which can be labeled as go to the window while it is snowing and go to the window while it is foggy. The objective of CvAMoS is to recognize a series of activities that are common in the traces, while taking into consideration continuous variables that describe the context. The rest of the paper is structured as follows. Section 2 introduces the related work. The solution is presented in Section 4 that is then evaluated in Section 5 including a discussion of the results, and the limitation of the approach. Section 7 concludes the paper.
2. Related Work
Event abstraction is a well-known research problem, not only in the field of process mining. There are numerous works that approach the problem from different angles and tackle it with different techniques. A non-exhaustive review of the literature is presented by van Zelst et al. [10] in which they propose a taxonomy of event abstraction methods. Additionally, Diba et al. [11] discuss the importance of bridging the gap between the granularity at which data are recorded and at which they should be analyzed. They present all the steps from event extraction and correlation to abstraction, and they review several related approaches. This highlights the importance of developing effective methods to abstract events in order to better understand and analyze processes. However, the abstraction is still an open challenge. In the context of this paper, we only focus on approaches suitable for the application to sensor data that describe human behavior processes.
The first point to discuss regards the involvement of an expert in the abstraction. Expert knowledge is crucial to obtain information on the process and on the activities carried out. When the expert takes an active role in the abstraction, we talk about supervised approaches. Supervised techniques require a deep understanding of the data by an expert, who must be able to provide detailed information on the collected process. The recognition process consists in the provisioning of an approximate mapping between events and labeled activities, then the algorithm translates the actual observed events according to the map. However, when the process to be analyzed refers to human behavior and is collected by sensors, high variability and complexity characterize the data, making the intervention of an expert unsuitable for the manual labeling of the activities. Nonetheless, the knowledge of the expert is necessary to have information on sensory correlations, to identify groups of sensors involved in the execution of a specific activity, for the evaluation and verification of the correctness of the result. What is more, in a supervised approach, the set of activities to identify is limited to the specified one. Consequently, researchers focused on other methodologies to abstract events, oriented towards a “bottom-up approach”, where the set of possible activities is elicited directly from the data, enabling the discovery of activities that were not foreseen beforehand. If the abstraction starts from the data, the set of identifiable activities is larger and more pertaining to the reality observed in the log. On the other side, unsupervised approaches rely completely on the algorithm for the identification of patterns. The main drawback is that they usually generate a massive amount of possible patterns, without providing any additional information. Since the generation did not leverage domain knowledge, many of the patterns could be not of interest, meaningless, or difficult to interpret. Given that, the role of the expert should be deemed a fundamental part in the abstraction, but not the main driver.
Two categories of approaches can be identified in the literature, and are the model- and trace-based abstractions. The model-based aims to identify activities in the form of process models, while the trace-based focuses on the identification of activities at the trace-level.
2.1. Model-Based Approaches
A model-based approach is the one proposed by Leotta et al. [12], consisting in a visual process map to discover habits in smart homes. The approach considers the log as a complex sequence of events and aims to identify sub-sequences of events that correspond to a specific action. These sub-sequences are then visualized as graphs on a floor-map. Deriving meaningful activities from the sub-sequences is a daunting task as the algorithm identifies very short paths. Consequently, the granularity of the abstraction remains too fine.
Mannhardt et al. [13] proposed a supervised event abstraction method that considers not only the sequence of events, but also the temporal and resource relationships between events. Given a set of activity patterns, they build an abstracted model. After that, they use alignment techniques [14] to map low-level events in the event log to activities in the abstraction model. The approach was later extended in an unsupervised version [15]. The extended version makes use of Local Process Model [16] (LPM) to represent the set of patterns. A set of LPMs is derived from the log, and each model represents a high-level activity. LPMs describe small patterns, composed of four to five transitions. Pruning functions are then applied to the set, and the resulting models are used for the abstraction using the method proposed in the previous version. Additionally, LPMs can suffer from the over-generalization problem. A process model is a representation of the behavior collected in the log, meaning that the model should generalize and not be strict to the behavior observed in the log. This can lead to the criticism that the model overgeneralizes the activity, therefore the same LPM could be matched by potentially infinite different sequences of low-level events.
2.2. Trace-Based Approaches
On the other hand, trace-based approaches focus on the identification of commonalities between traces. Lu et al. [17] propose a semi-supervised event abstraction technique, based on an interactive approach. To overcome the generalization problem, traces in the event log are visualized in a dotted chart format instead of a process model format. The user can detect and extract patterns of interest from the visualized log. The occurrences of these patterns can then be highlighted in the visualization in order to be explored and compared to other occurrences. The patterns can also be modified and extended using contextual knowledge. Another solution is proposed by de Leoni et al. [18], a technique that aims to divide traces into batch sessions. Each trace is seen as a sequence of sessions of events. The sessions are then converted into vectors which abstract the behavior observed inside the sessions. The sessions are clustered based on similarity in order to identify common patterns and group similar activities together. The centroids of the clusters are visualized on a heatmap and used for naming the activity. Finally, they use the results of the clustering to abstract the original log by aggregating the events in each cluster into higher-level activities. Domain knowledge is used to adjust and support clusters labeling and to create an abstracted log. The approach has the drawback of relying on the choice of the session threshold parameter for trimming sessions, which can have significant impacts on the analysis by potentially leading to incorrect activity identification. Furthermore, the heatmap visualization does not clearly represent the activities, making the labeling process difficult.
Despite advances in this field, the main problem of event abstraction remains. In particular, there is no dominant trend between model- and trace-based approaches. Although several studies have shown good results, there has been limited consideration of the level of granularity in the data source. Only a few studies in the literature have been able to effectively handle low-level sensor data (e.g., the work of Mannhardt et al. [15]).
A first attempt to tackle this problem was made in an earlier version of the work presented in this paper. The work [9] aims to identify recurring sequences of events in the traces. The approach takes into account the variability of behaviors and the generalization problem, by implementing a distance function to verify the patterns. In addition, the distance function is enriched by a cost map that allows us to define the dependency degree between sensor identifiers. The approach is inspired by the bioinformatics field, from the well-known problem of protein sequence classification [19]. The protein sequence classification aims at identify the family of a given protein sequence based on its composition. However, the sequence does not always provide a clear indication of its family, and can be very large and complex. Similarly, in process mining, event abstraction involves simplifying large sequences of events by the identification of patterns in order to improve and understand the process. Nonetheless, none of the approaches mentioned above consider the context as part of the abstraction. In some works, the context is interpreted as the attributes of an activity in the event log, such as the time or the resource. Instead, the context is a broader dimension [20], which includes, among other things, the environment. Therefore, we propose an event abstraction technique that considers the state of the environment when the patterns were collected.
3. Background
In this section, we provide the basic notions that will be used for the rest of the paper. Please note that all definitions presented in this section are already utilized in the process mining community and we use them according to standard literature.
Definition 1
(Event). Let us call the set of case identifiers , let be the set of possible activity names, and let be the set of extra attributes, each of which comprises a name ( is the set of all possible names) and a value ( is the set of all possible values). The set of all possible events, also known as event universe, is (Here, indicates the powerset, i.e., the set of all sub-sets). An event is an element from the event universe.
In the context of this paper, the set contains activity names at the finest granularity level, e.g., the sensors being triggered. The set of all possible sequences of events is . When multiple events share the same case identifier, we group them together into a sequence: (with ).
Definition 2
(Trace). For each sequence of events sharing the same case ID, we consider the activities these events refer to and we call this trace. For example, given , such that all events in s have the same case ID (i.e., ), the trace is .
We refer to as the length of trace t. To access the i-th element of trace t, we use the notation . Given two traces and , it is possible to concatenate them such that .
Definition 3
(Sub-trace operator). Given a trace , we can use the sub-trace operator to extract the sequence of events in the trace such that where and . Please note that the result of the application of the sub-trace operator is a trace.
Definition 4
(Event-log). An event log is a multi-set of traces where, for each trace, we can know how often it is actually observed in the data.
To know the multiplicity of a trace t in the event log , we use the notation . The notation indicates that trace t appears at least once in (i.e., ). With , we indicate the number of traces in the log, including their multiplicity.
4. Approach
The approach proposed in this paper aims at identifying recurring sequences of activities within a low-level event log (e.g., where activities refer to sensor data), which can be abstracted and interpreted as higher-level activities. The proposed algorithm, called CvAMoS, is a motif search algorithm that focuses on the identification of recurring and variable patterns while considering contextual attributes. CvAMoS is implemented as a Java application and the code is freely available (See the Data Availability Statement for the details).
The origin of the algorithm can be traced to the biology field, more specifically to the quorum Planted Motif Search [21] (qPMS). qPMS is a method for finding motifs (recurring patterns) in biological sequences of proteins. The algorithm searches for instances of the pattern in the sequences provided as input, such that each motif occurs in most of the sequences, up to a given distance. We have implemented a first extension of this algorithm (called vAMoS [9]) that is able to deal with an event log and the concept of traces, together with a more accurate mechanism for the identification and verification of the motifs. CvAMoS is an extension of vAMoS, which is enriched with contextual variables. The objective of CvAMoS is to identify sequences of events that occur frequently in the traces, but introducing the notion of context in the motifs construction. vAMoS was different from qPMS in a few respects, but in particular for the introduction of the concept of cost. The cost can be expressed as the similarity, e.g., given two traces and a maximum cost, it is possible to identify common parts of the traces that are similar (up to the cost). The improvement of CvAMoS with respect to vAMoS is the distinction between events and contextual events. Contextual events are attributes of a motif, and describe the state of the environment while the motif was recorded.
4.1. Overview
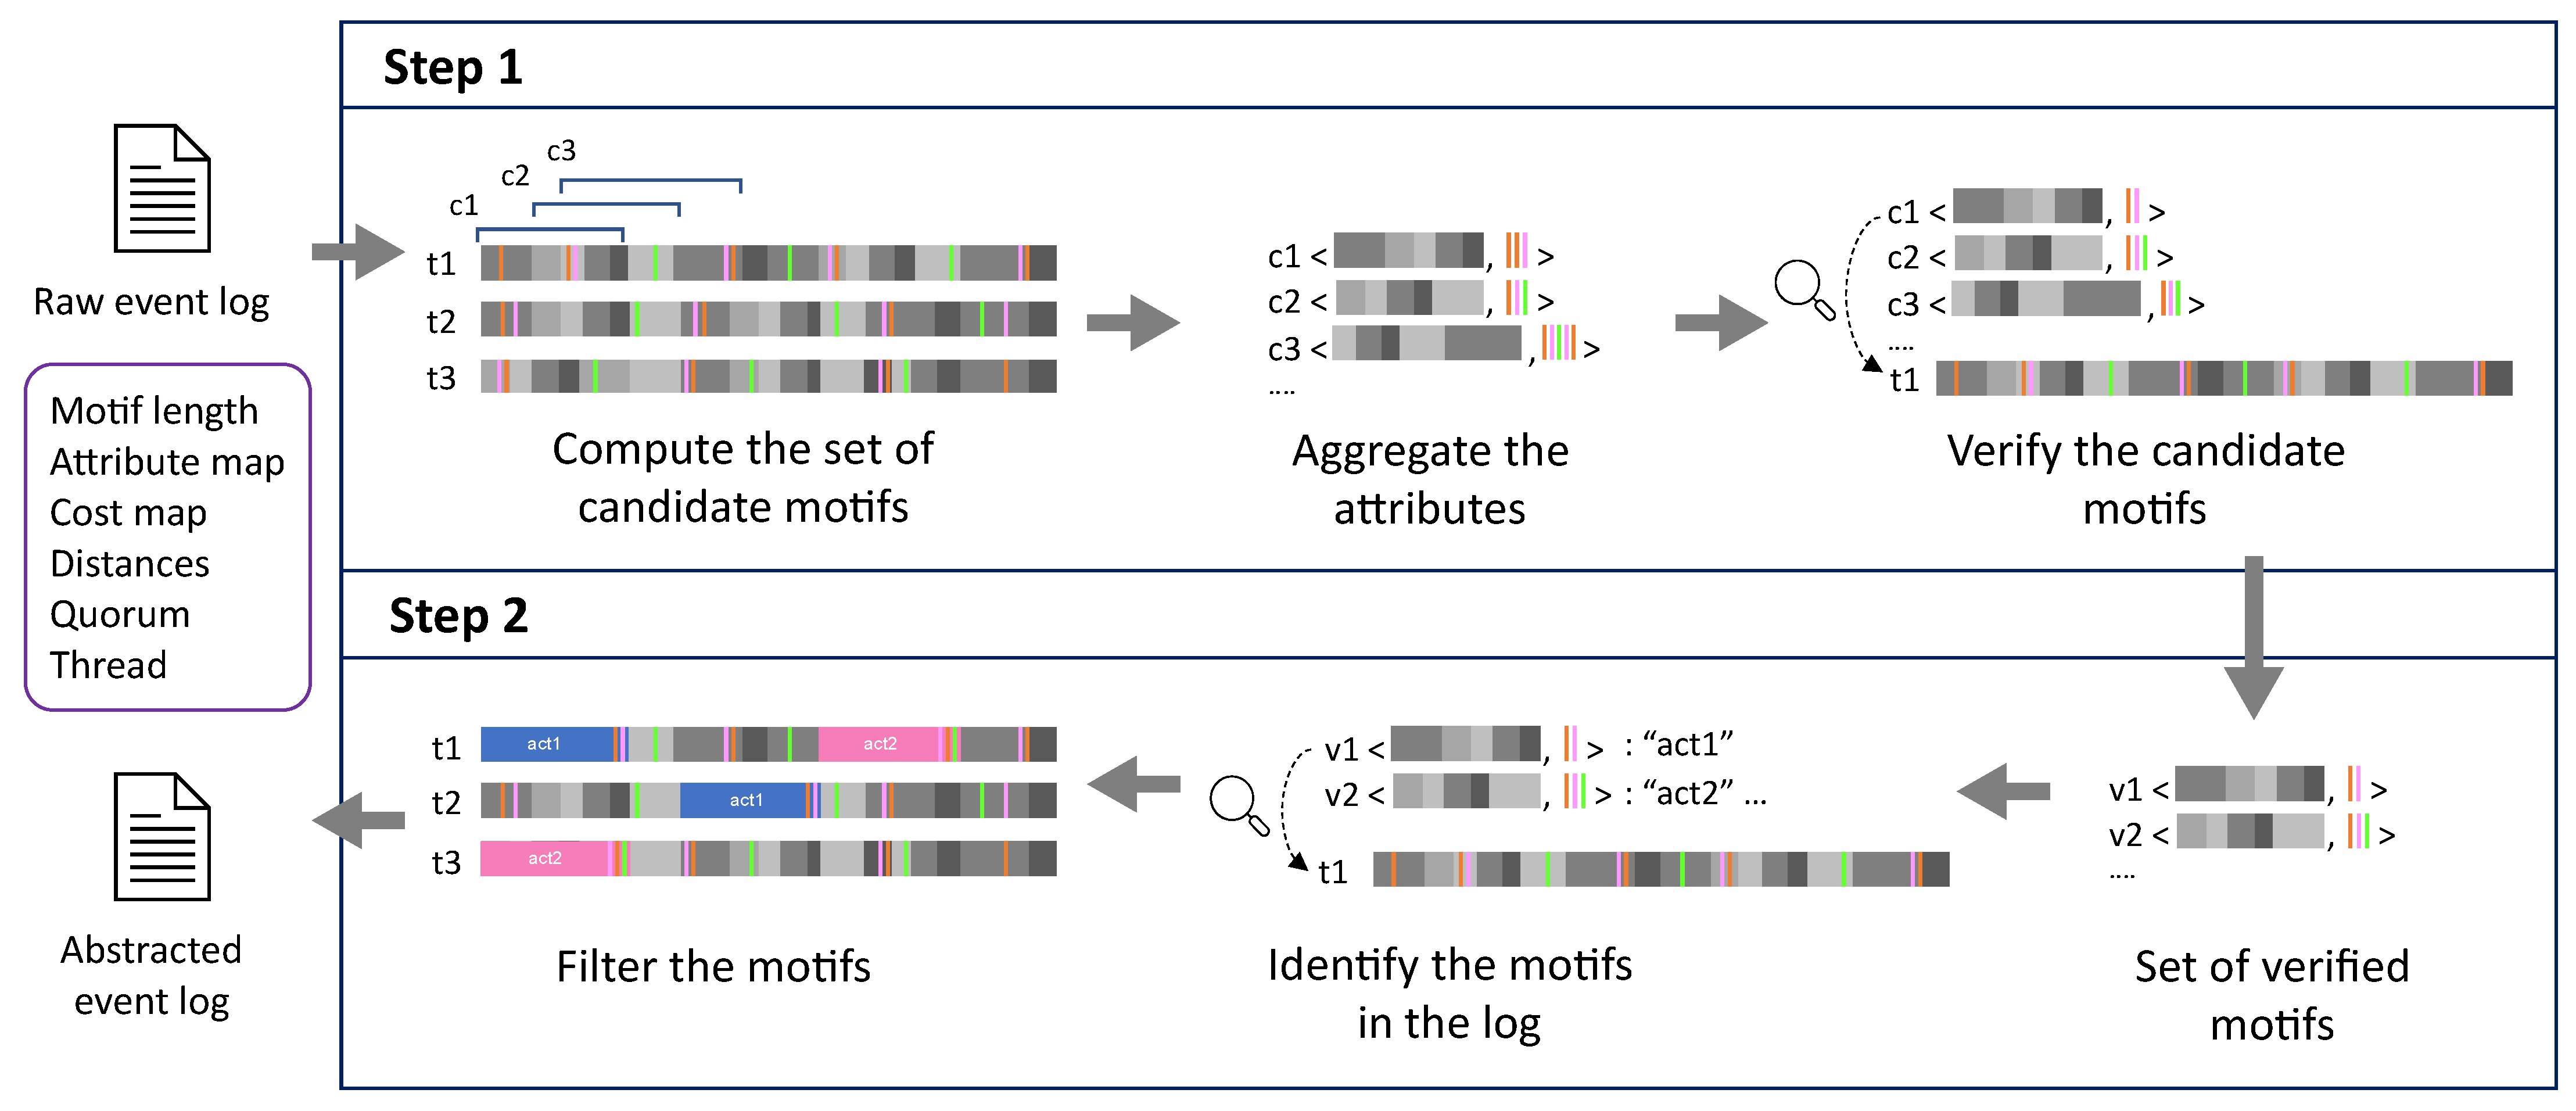
The approach is divided into two phases, the first consists of the identification and verification of the motifs, while the second step consists of the replacement of the sub-traces containing the motifs in the original event log (i.e., the abstraction). An overview of the approach is illustrated in Figure 1. To obtain the motifs, we first need to construct a set of candidate motifs, and then verify them. The construction of the set of candidate motifs is a crucial part of the approach, as the verified motifs will be a subset of this set. For the construction of the set of candidate motifs, different lines of thought were considered. The first involves the construction of all possible sequences of activities (i.e., , cf. Definition 1), but this would be unfeasible, especially since most of the candidates would be completely irrelevant (being very different from any trace on the event log). The second one (i.e., the one implemented in vAMoS) considers a two-step approach: it firstly identifies small sub-traces that compose the “alphabet”, and then combines the elements of the alphabet in order to populate the set of candidate motifs. To some extent, the approach followed in vAMoS is powerful, as it allows us to construct a larger set of candidate motifs that is populated also by non-observed sequences. This means that the algorithm is more tolerant of the variability as there are more and different candidates to evaluate. Furthermore, the way the set of motifs is constructed, and the fact that the approach also considers sequences that never appeared in the log, causes an explosion in the generation of the candidate motifs. To overcome this problem, we opted to focus only on observed sequences. In CvAMoS, the set of candidates is based only on observed sequences, while the variability is still guaranteed by the distance function. The verification of the candidate motifs verifies whether a given motif is observed in a minimum number of traces, up to a certain dissimilarity. The similarity checking verifies both the motif and the corresponding set of attributes. Hence, a list of verified motifs is returned. The second step consists of the filtering of the verified motifs in the event log, in order to obtain the abstracted event log. As indicated in Figure 1, the second step checks the verified motifs in the log, and filters them by replacing the instance in the trace with the activity label. In the rest of the section, we provide a detailed description of all the components of the approach, along with a formal definition for each of them. In particular, the two steps of the proposed approach are explained in detail.
4.2. Step 1: Construction of the Set of Motifs
The first step of the approach consists of the construction of the set of motifs that will be then verified. In this paper, a motif is not only a sequence of events, but also considers the context. In the event log, we can distinguish between events referring to the execution of an activity, and events that are referring to the state of the environment, usually in the form of continuous measurement (e.g., temperature, noise level). The former is part of the motif, while the latter belongs to the set of attributes of the given motif (i.e., the context). The information regarding which attributes should be considered as environment and which refer to the execution of activities should be provided by the user in the form of an “attribute map”. Additionally, the attribute map should contain aggregation operators (which indicate how environment attributes are aggregated) as well as the maximum tolerance from the aggregated value.
Definition 5
(Attribute map). An attribute map is a triplet , where is the set of all attribute names (cf. Definition 1), is an aggregation operator, and σ is the maximum approximation tolerance (which is a scalar value). We indicate with the set of all attribute names of , with the aggregation operator associated with attribute name n, and with the σ tolerance associated with attribute name n.
For example, given an activity , the attribute map could be which means that the attribute label temp should be aggregated using the mean, and values with distance 2 from such a mean should be considered as equal.
Therefore, a candidate motif can be defined as follows:
Definition 6
(Candidate Motif). Given a trace , a starting index i, a target motif length such that , and an attribute map , a candidate motif c is defined as a tuple where is the sub-trace, and is the relation mapping all attribute names contained in to the corresponding aggregated values (according to the respective aggregation function in ) computed over .
Considering again the example from the previous definition, the component of a candidate motif would contain the mean value of all the temp attribute values computed on all events in the sub-trace.
Definition 7.
Given an event log , a motif length , and an attribute map , we call the set of all candidate motifs that can be seen on all traces part of . To compute all motifs an iterative approach can be adopted, by iterating all traces and extracting all possible motifs for each trace (i.e., all possible sub-traces of length ).
During the construction of a candidate motif, several attributes sharing the same attribute name are identified. However, the following verification task requires a single value for each attribute name. The aggregation operator, defined in the attribute map (see Definition 5), serves this purpose. Hence, these attribute values are aggregated according to the attribute map. A candidate motif, therefore, includes the attribute values already aggregated.
The candidate motifs now need to be verified. The verification establishes whether a candidate motif can be considered an actual motif, by checking the requirements of distance, activity cost, attribute cost, and quorum. The motif must appear in a given percentage of traces (quorum), up to a certain dissimilarity (distance), according to the interchangeability relations provided by the user (costs), and according to the context defined by the attributes.
The activity cost is a relation indicating the similarity (or dissimilarity) between pairs of activities: the cost value can be used to indicate whether two activities can be performed interchangeably or not (i.e., whether one is an acceptable replacement of the other).
Definition 8
(Activity Cost Relation). The relation indicates the extent of the interchangeability of two activities. For example, given two activities if is close to 0, then and are interchangeable (i.e., they are equivalent); if the value is close to 1 it means they are not.
The relation is expected to be provided by the user since it is heavily domain dependent. If the user does not specify a cost for a certain pair of activities, a cost of 1 is assumed.
The capability of setting activity costs is particularly relevant every time an activity is mapped by, for example, two proximity sensors that are physically very close to each other. In this setting, these will usually be triggered simultaneously and therefore could be considered interchangeable. Another example of how this concept can be applied is to consider two activities that are completely unrelated and cannot be performed in the same context. In this case, it would be appropriate to assign a cost value close to 1 to reflect that these activities cannot be interchanged.
The cost relation is used to compute the distance. The distance function quantifies the similarity between two traces. The distance is firstly computed in terms of activities and then in terms of attributes. The activity distance can be defined as follows:
Definition 9
(Activity distance). Given two traces and with the same length (i.e., ) and given the relation, the activity distance between and is defined as the sum of the costs for each pair of activities of the respective traces:
To check the similarity between the activities in the motif and the activities in the sub-trace, CvAMoS implements the Hamming distance as a distance function, by computing the number of positions at which the corresponding activities are different. The cost map is used by this function to evaluate the similarity. The activity distance tackles the problem of the variability of the behaviors, meaning that there could be a slightly different configuration in how the same behavior appears in different instances, and this difference is tolerated by the distance. If the activity distance is within an acceptable threshold, the attribute distance is checked.
Definition 10
(Attribute Distance). Given two traces and and given an attribute map . Let us call with and the application of operator o on the attribute values names n of trace t. The attribute distance between the two traces is defined as:
The attribute distance between two traces is calculated by comparing the values of their set of attributes, and quantifying the difference between these values. To simplify, the distance between two attribute values, sharing the same attribute name, is computed as the absolute difference between these values, but considering the maximum approximation tolerance. Accordingly, the attribute distance between two traces is the sum of these differences. Only differences that exceed the tolerance value are included in the attribute distance calculation.
Definition 11
(Overall Distance). Given two traces and , given an attribute map , an activity cost , a maximum activity cost , and a maximum attribute cost , the distance between the two traces is defined as:
It follows from the above that two traces can be considered similar if their activity distance is less than the given threshold and their attributes must match too (according to the tolerance) within the respective distance .
We can slightly adapt this definition to compare traces and candidate motifs too:
Definition 12.
Given a trace t and a candidate motif , given the attribute map used to construct c, the activity cost , a maximum activity cost and a maximum attribute cost , we can verify whether the candidate motif is verified by the trace with the following:
The last concept to be discussed is the quorum. The quorum is the minimum relative amount of traces in which the candidate motif must appear in order to be considered as an actual motif. Since the objective is to look for recurrent sequences, the quorum value allows defining how recurrent the motif should be to be considered relevant. With this, we can now define a motif:
Definition 13
(Motif, or verified motif). Given an event log and candidate motif , a maximum activity cost and attribute cost , an activity cost relation , and a quorum q, we call c motif (or verified motif), if
In other words, to verify whether a candidate motif is indeed a motif, we check in all the traces of the event log if there is at least one sub-trace (of the same length as the motif) that matches it in terms of both activities and attributes, according to the two distance thresholds provided , (as described in Equation (1)). If the amount of traces containing the motif satisfies the quorum q, the candidate motif is returned as a motif.
Definition 14
(Set of motifs). We call the set of all motifs. This set comprises all candidate motifs that are verified (cf. Definition 13).
Algorithm 1 describes in detail the procedure for the verification of a set of candidates motifs: for each candidate motif the number of traces where it appears is computed (lines 4–9) by checking each possible sub-trace (with same length as the candidate motif) of each trace in the log (lines 4–5). If the candidate motif is contained in a trace (i.e., its activity distance is less than a parameter, cf. line 6), then their attributes are verified (line 7). If the distance between the attributes is less than the attribute distance parameter, a counter is incremented by the multiplicity of the trace in the log (line 8) and the procedure can skip to the next trace (line 9). If the number of traces containing the candidate motif satisfies the quorum, then the candidate motif becomes verified and hence it is added to the list of motifs to be returned (lines 11–12).
| Algorithm 1: Verification of candidates motifs. |
 |
The algorithm has linear complexity, meaning that the amount of time required for the algorithm to complete increases in direct proportion to the size of the input data. In this case, it is given by the number of events in the event log times the size of the set of candidate motifs. The current implementation of CvAMoS exports the list of verified motifs in an XES file.
4.3. Step 2: Replacement of the Motifs in the Event Log
Once obtained a list of verified motifs, i.e., a list of candidate motifs that fulfill the requirements of the parameter provided such as distances, quorum, cost, and attribute maps, they can be replaced in the event log. The replacement of the motifs allows the abstraction of the events in the log into more abstract structures. Each motif can be labeled with an activity name. In order to replace a verified motif, we need to check all the instances of the motif inside the traces (still considering the distances, the cost relation, and the attribute map). Once the instance is identified and verified, it is replaced by the abstracted activity label. A simplified version of the algorithm is reported in Algorithm 2. Please note that the index handling in line 8 is simplified for space reasons, but should handle the case of multiple motifs on the same trace as well as multiple instances of one motif on the same trace.
Additionally, in this case, the algorithm has linear complexity, given by the number of events in the event log multiplied by the size of the set of verified motifs. The complexity of this algorithm can be considered acceptable for offline processing of the data. The current implementation of CvAMoS allows saving the abstracted event log as an XES file.
| Algorithm 2: Replacement of verified motifs. |
 |
To recap, CvAMoS is an event abstraction technique able to handle contextual variables during the identification of the motifs. A motif is a recurrent pattern inside the event log and it is composed of a list of events and a list of attributes that characterize the execution. The procedure for the identification of the motifs takes into account several parameters provided by the user. The parameters include a maximum distance value for the activities, a maximum distance value for the attributes, a cost map to define the interchange cost between activities, an attribute map to define the aggregation operator and the tolerance value for the attributes, and a quorum value. The approach first derives a set of candidate motifs starting from the observed sub-traces. Each sub-trace is then verified and eventually returned as a verified motif. The verified motif can be labeled and replaced in the event log. In this last phase, the instantiation of each motif is verified in the traces and, when found, it is replaced with the activity label.
5. Evaluation
To evaluate the approach introduced in this paper, we decided to opt for a two-fold validation. The first one is based on synthetic data and well-defined configurations, while the second one is based on the application on a real data set. The objective of the evaluation is to be able to reply to the research questions introduced in Section 1. Using synthetic data for the first evaluation allows us to verify the functioning of the approach, as well as manipulate the different parameters, such as the attributes, the motif length, the distances and the cost. On the other hand, using a real dataset for the second evaluation allows us to assess the performance of the approach in a more realistic scenario, and to measure its ability to recognize motifs in a real dataset as well as to verify the computation time required by the algorithm. All the evaluations are made by comparing our solution against another approach in the literature, the event abstraction using LPMs [15] (referred to as LPM).
5.1. Evaluation on Synthetic Datasets
The objective of the event abstraction is to recognize motifs referring to activities in a log, hence the first goal of the evaluation is to verify the performance of the algorithm in identifying a list of predefined patterns (i.e., RQ1). To accomplish this goal, we identified a series of eight patterns that both CvAMoS and LPM had to recognize. The patterns were devised starting from real behavior referring to possible human routines and patterns, followed by a careful scrutiny of existing datasets [22,23] in order to find a match. For each pattern, we constructed an event log, composed of four traces and about 150 events. Each trace contains one or more sub-traces that match the pattern. The patterns are presented in Table 1, and a process model is drawn for each of them.
Patterns P1, P2, P3, P6, P7, and P8 have an extended version that includes a noise activity in the corresponding sub-trace. The extra activity is added to test the algorithms’ ability to handle noise when identifying a pattern.
The second goal of the evaluation is to verify if the algorithm is able to deal with contextual variables (RQ1), i.e., to recognize motifs and distinguish them according to the state of the environment. To achieve the goal, we created a second version of the above-mentioned logs, which includes context. Each trace in the log contains multiple instances of the same pattern. The events related to the environment temperature are added to the event logs. The temperature is collected in the form of continuous measurements. In the first half of each trace, there are events related to a thermometer whose temperature is 10 degrees, while in the second half, a thermometer continuously collects a temperature of 20 degrees. As a consequence, the algorithm should be able to identify the defined patterns under the two contextual perspectives. This last case is not compared to LPM, as LPM is not able to deal with the context.
To interpret the result of the algorithms, and obtain a valuable evaluation, we defined two metric values. To explain the metrics, a parallelism with precision and recall can be made. In the first metric, Q1, we identify the verified motifs (precision), i.e., the ability of the algorithm to produce a motif that perfectly fits the given pattern. The second metric, Q2, verifies that the number of verified motifs is the expected one (recall), i.e., it checks if the algorithm produces at least one trace that cannot be explained by the pattern. For simplicity reasons, we made Q1 and Q2 produce values of 1 or 0. The combination of these two values, which we call quality rate (QR), follows the idea of accuracy:
We designed the metric so that QR has a value of 1 if exactly the expected patterns are identified as verified motifs and no extra ones; a value of 0 would indicate that none of the expected patterns are reflected in the verified motifs. Please note that we tested on all patterns, and for 6 of them, we have their version including noise, thus ending up with 14 total patterns (8 + 6 extended with noise).
We also computed the total time required to conduct the experiments. The values have been calculated on an Intel Core i7-10710U 1.61 GHz CPU and 16 GB of RAM, equipped with Windows 10 Professional and Java 16.0.1, and the times are the result of the average of the time taken for each execution (i.e., for each pattern).
Once the evaluation criteria were defined, we set three different configurations for the algorithms to be compared (R1–R3). To create fair configurations, we elicited similarities between the parameters of LPM and CvAMoS: the max number of transitions in LPM can be associated with the motif length in CvAMoS; the min occurrence in LPM can be related to the quorum in CvAMoS; the min non-fitting events instead result in the activity distance. The attribute distance is not considered in these configurations as the focus is only on the activities. The detailed configurations for R1, R2, and R3 are shown in Table 2.
In the first run (R1), we used the default settings for LPM, in which the max number of transitions is set to four out of five. In CvAMoS, the motif length is equal to the length of the patterns to be identified. The number of results to produce is limited to one in LPM, in order to investigate the algorithm’s capability to identify a perfect match on the first try. For the occurrences we had to make an assumption: in LPM, the value refers to the frequency of occurrence in the entire log, while the quorum refers to the percentage of traces in which the pattern appears. Hence, min occurrences is set equal to the amount of traces in each log. The non-fitting events and the activity distance are both set to zero.
The following run (R2) foresees relaxation in the settings. In LPM, a higher number of models is produced. In addition, the projection is changed to the Markov clustering as the authors in the paper claim it has better performance in terms of computational complexity. On the other hand, CvAMoS increases the activity distance value.
The third run (R3) has parameters set toward optimization for both algorithms. The LPM can now represent duplicate transition, as well as the number of expected models is doubled. CvAMoS has longer motifs and consequently motif length as well. Distance and quorum are relaxed too.
The two additional runs (R4, R5) are only applied to CvAMoS. The objective of these is to verify that motifs with attributes are correctly identified. The settings are shown in Table 3. The motif length is set to the length of the motif to be recognized. In this case, the attribute distance is crucial. The activity distance and the attribute distance are both set to zero in R4 to verify the precision, and they are increased in R5 to verify the behavior of the algorithm in handling noise.
The outputs of the runs are evaluated according to the metrics defined above, i.e., Q1, Q2, as well as the time.
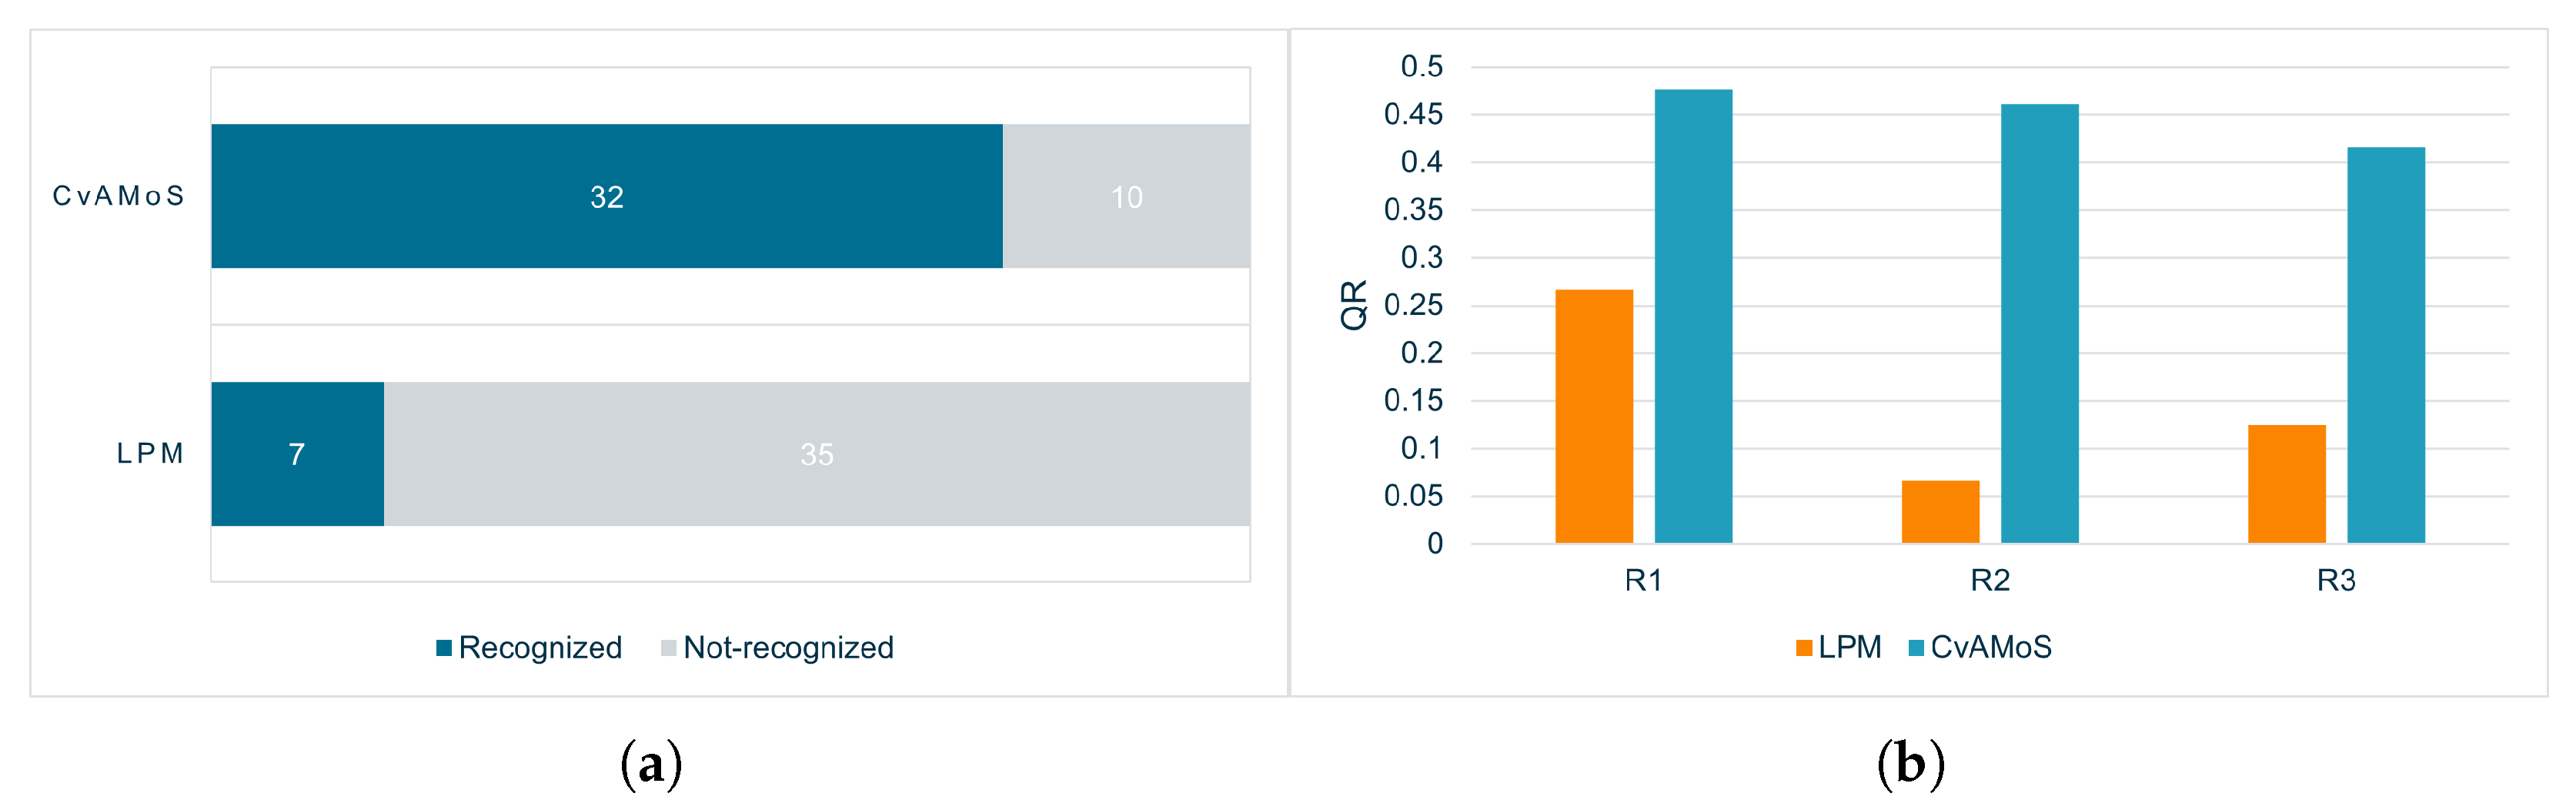
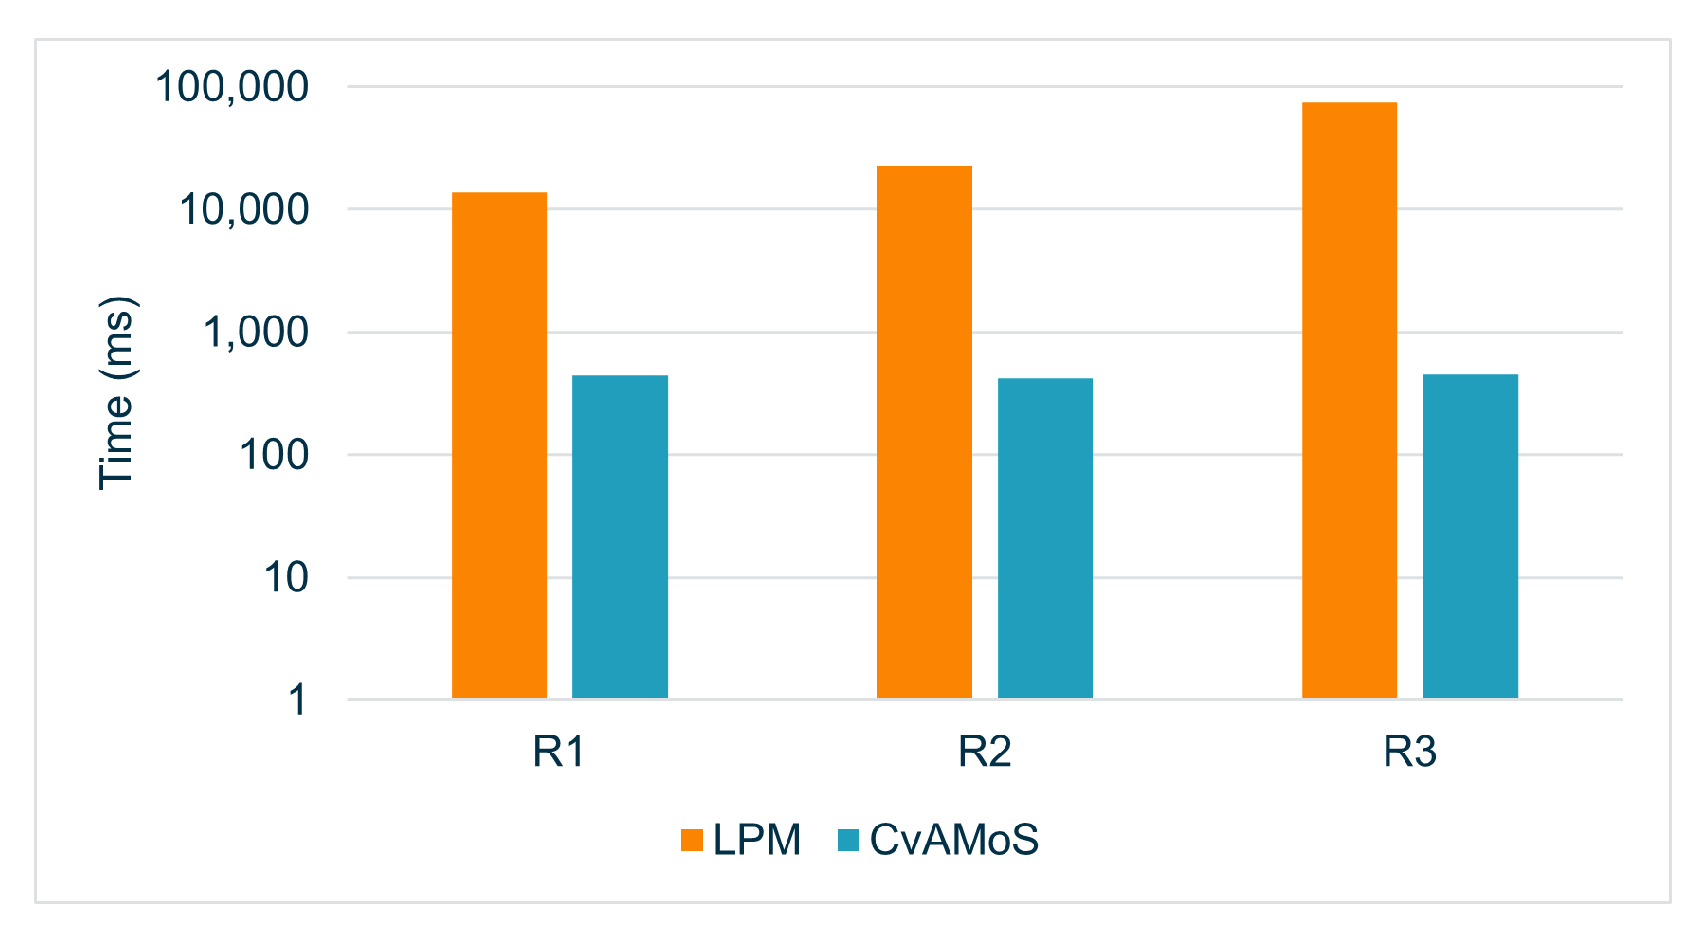
The first point to discuss regards the evaluation of the first three runs: R1, R2, and R3. The main difference in the results of the two algorithms in these three configurations lies in the precision in recognizing the given pattern. The values of Q1 are shown in Figure 2a: considering the three runs, with a total of 42 executions for each algorithm (8 + 6 patterns * 3 configurations), Q1 holds only 7 times for LPM, but 32 times for CvAMoS. Therefore, LPM was able to derive a model representing the given pattern only in a limited number of cases with respect to the other algorithm. The performance of Q2 instead is affected by the number of outputs to produce for LPM and the activity distance for CvAMoS (it allows us to return motifs with d non-matching activities). However, the combination of 0 for Q1 and 1 for Q2 means that the algorithm is not only unable to identify the given pattern, but identifies more than one non-fitting trace. Figure 2b plots the values of QR. The third metric evaluated is the computation time. There is no evidence that an increase/decrease in the computation time influences the performance of the algorithms. The time, in a logarithmic scale, is shown in Figure 3. For both algorithms, the computation time rises for each run, partly due to the considerable expansion of the number of candidate motifs/models. Although a greater number of candidates is synonymous with greater precision in the results for CvAMoS, this is not observed for LPM.
The second point to discuss regards the evaluation of R4 and R5. In this case, only CvAMoS is applied, and the capability of the algorithm to deal with contextual variables is tested. The result of the runs is shown in Table 4, which reports the QR values for each application. In R4, four cases returned a perfect result, meaning that the algorithm was able to identify instances of the same pattern, but with different attributes, and that it did not generate non-fitting patterns (QR is 1). In four cases, no motif was found (QR is 0). However, this last information does not refer only to this case; in fact, the algorithm was never able to identify, even in the previous runs, the patterns P4 and P6, due to their variability. In the last run, R5 has better results in the identification of the patterns, as the algorithm failed in only two cases (still P4 and P6). However, in all the remaining cases, the value of QR is 0.5, as Q2 is always true, meaning that the algorithm was able to identify the target patterns, but also generated non-fitting sequences.
To summarize, the results obtained using a synthetic dataset show that:
- Considering the first three runs (R1–R2–R3), in R1, CvAMoS showed better performances in terms of time and QR compared to LPM. In fact, it recognized the highest amount of patterns (QR is 0.48) in a short period of time (440 ms). In the same run, LPM showed the highest QR score, that is 0.26.
- In the last two runs (R4–R5), CvAMoS alone performed better in the run R4 rather than in R5, showing a higher value of QR (0.53 vs. 0.46 as shown in Table 4). Furthermore, in R4 CvAMoS recognized 10 patterns out of 14, while in R5 it correctly identified 12 out of 14 patterns.
5.2. Evaluation on a Real Dataset
The evaluation on a real dataset compares the results of the two approaches CvAMoS and LPM. We select the CASAS dataset [23] for this task. The dataset contains sensor data collected in a smart apartment, where a single person is living. The log is labeled (i.e., high-level activities), but no information is given on how and when the activities are performed. Therefore, we decided to not consider the actual labeling and just use the real raw data for our experiment. We first selected 15 cases, composed of 95,000 events (generated starting from 39 sensors). As the resident did not have guidelines to follow, it cannot be assumed that the behaviors were recurrent. To be able to handle the dataset and to understand the daily behaviors, it was necessary to preprocess the dataset and reduce its size. The first filter applied aims to reduce the recording interval, keeping only events from 08:00 to 12:59. Then, sensor readings not necessary for the recognition of activities (i.e., OFF values) were filtered out. The last step was to merge duplicate consequent events. The resulting log consists of 15 cases, 12,977 events, still with 39 sensors involved.
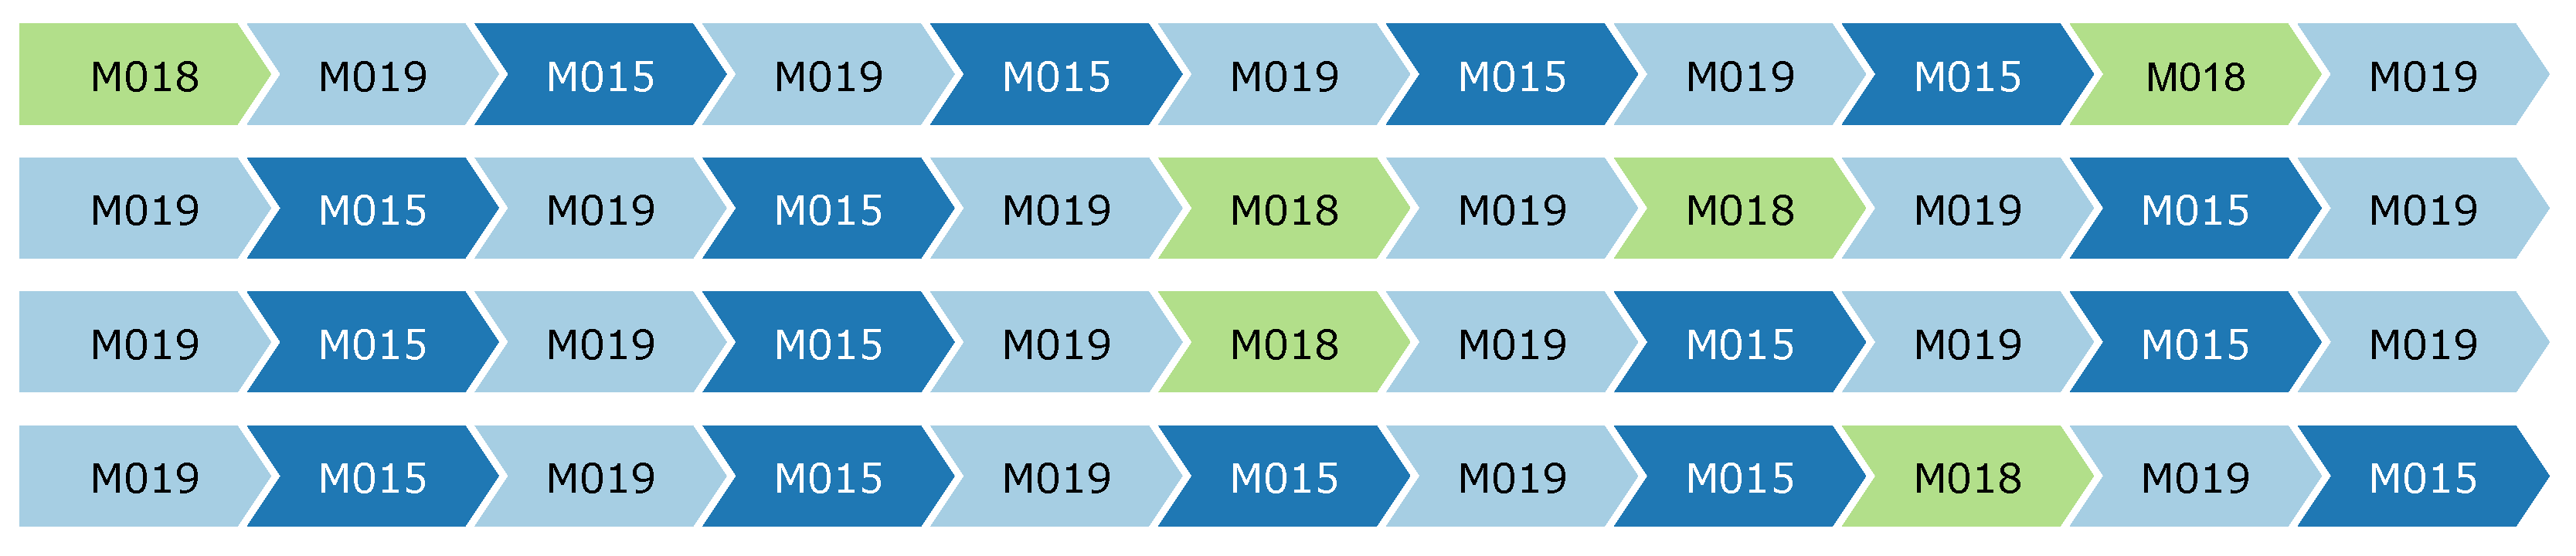
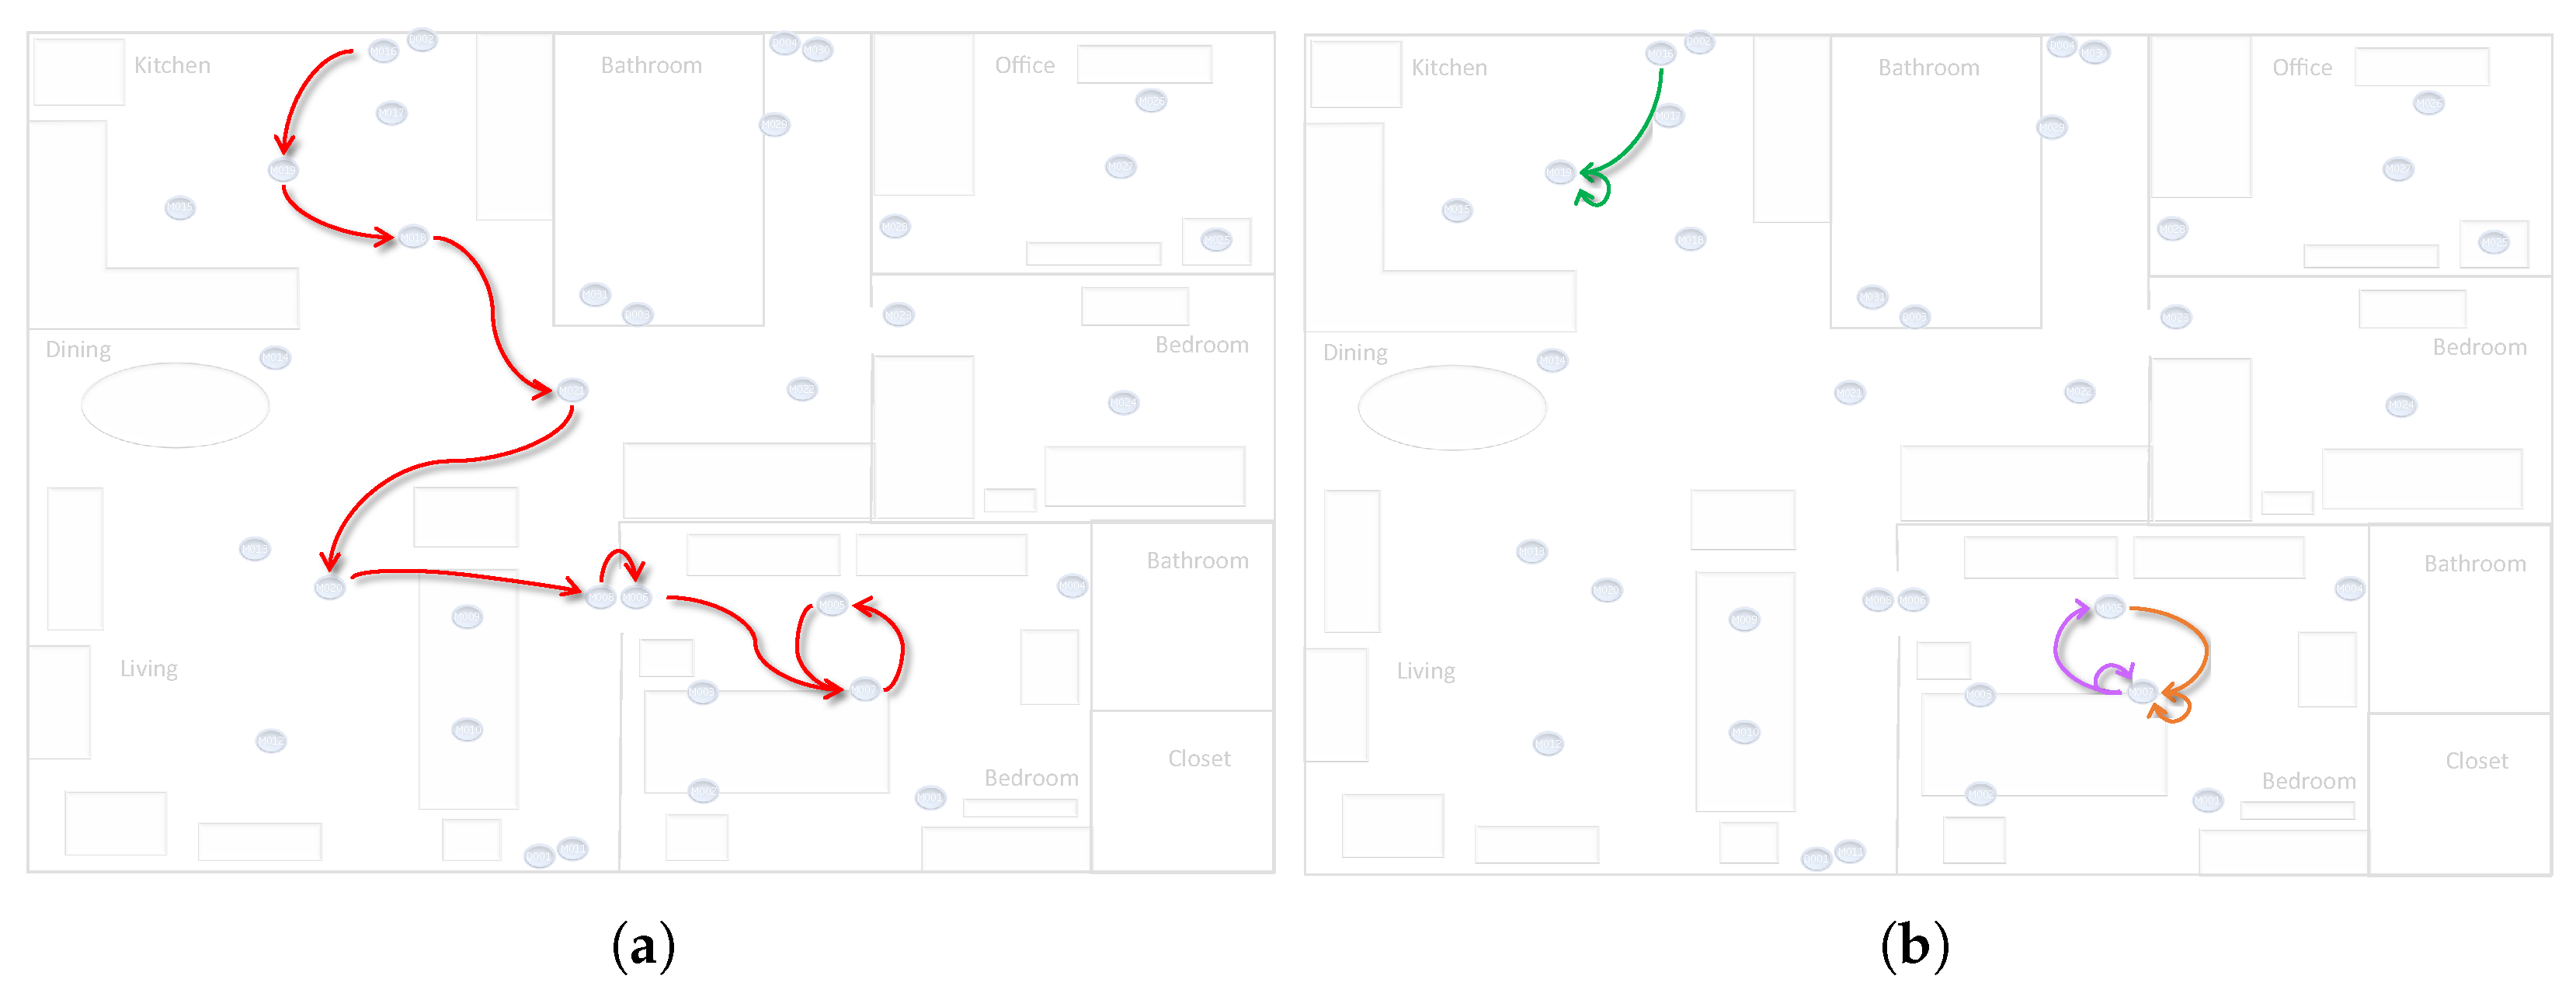
The event log is used as input for the two abstraction algorithms. The key of CvAMoS is its ability to work with the context. Therefore, temperature sensors in the dataset are considered as contextual attributes and included in the attribute map. A tolerance value of 4, and the mean as an aggregation operator are set for all of the unique attribute identifiers. In the end, a total of 2151 events in the log are classified as contextual events. CvAMoS can be applied in an iterative way, meaning that for each run it returns a set of motifs, which can be filtered in the event log, and then the algorithm can be re-applied to identify further motifs. For each run, we defined a specific setting for the parameters. We started by searching motifs from a certain motif length and with low distances values, and then in subsequent iterations, when the algorithm could no longer identify verified motifs, we steadily increased the distances parameters and reduced the quorum. After each run, the returned set of verified motifs is analyzed and eventually separated into different files to be labeled in the log with different higher-level activity labels. To visualize the motifs, we used the Process Mining ToolKit [24], while the selection process was supported by the use of the floor-map of the environment. A list of verified motifs describing a behavior involving the same set of sensors placed close together in the environment was most likely labeled with the same activity label. An example is reported in Figure 4, where the algorithm returned four motifs that show a high level of similarity. The three sensors involved are placed in the same area in the environment, and their behavior describes the same sequence, thereby they can be interpreted as the same activity.
A total of 61 patterns are identified after 27 iterations. The abstraction did not cover the entire event log, but it considerably reduced the number of events. Table 5 shows the results of the abstraction. In each row, the top bar depicts the events (and their duration) for the trace in the original event log. Each activity identifier is plotted using a different shade of purple. The second bar highlights in yellow shades the abstracted motifs (and their duration), in the corresponding abstracted trace. The other columns of the table report the amount of events for each trace in the original event log, and the amount of events not abstracted. The last column shows the percentage of the events in each trace that is abstracted in motifs.
As can be noticed from the table, more than 50% of each trace is abstracted, in only 61 motifs, meaning that there is a recurrence of the motifs in the event log. C5 instead presents a low percentage of events abstracted, that is the 21.7%. However, even if the percentage seems low, the initial amount of events was very big, resulting in around 450 events grouped into motifs. In C12, the highest number of events have been abstracted, i.e., 595, while C14 is the most abstracted trace with only 90 events left as not abstracted. The last perspective to consider is the computation time. Table 6 reports the time needed for each run, in milliseconds. In each run, we divided the work between seven and nine threads. The total amount needed by the algorithm to run all the configurations is around 9.5 min. The findings suggest that there is no correlation between the computation time and the number of patterns returned as there are other variables to consider, comprising the motif length and distances, but mainly the attributes set. Algorithm 1 explains that a candidate motif is first checked per se, and then the attributes are verified. If a candidate motif does not contain any attributes, this second step is skipped, reducing the computation time. In addition, the size of the attribute set also impacts the processing times. It is important to note that the computation time reported in the table only includes the time the algorithm takes to identify and verify the motifs. The manual work of the expert, that is to go through the motifs, filter, and split them is not taken into account, but still remains in the range of minutes for each execution. The filtering of the motifs in the log, i.e., the replacement, is not monitored, as it always takes less than 2 s.
Once obtained the results with CvAMoS, we tuned the parameters for the application of LPM accordingly. The LPM algorithm is included in the ProM tool (See https://promtools.org/ (accessed on 1 December 2022)). The abstraction consists of two steps: firstly, the plugin Search for Local Process Models is used to derive the models, then each model needs to be converted from an Accepting Petri Net to a Petri Net and replaced in the log by the use of the Log abstraction plugin. The searching algorithm was set to produce 61 models, with the number of transitions set to the maximum (i.e., 5). The minimum number of occurrences of each LPM in the log is set at 7, to allow the algorithm to discover a larger set of recurring and less recurring patterns. The algorithm took 19.5 min to execute and produce the result. The time only includes the identification of the models. The second step, which includes the verification, labeling, and filtering in the log, is not included. Even if the objective of LPM is to represent small patterns, between three and five activity nodes (i.e., transitions), the majority of the identified patterns are represented by the alternation between two sensors, thereby it is challenging to interpret them in the form of higher-level activities.
We decided not to show the two abstracted event logs in the form of process models as the resulting model is strongly influenced by the choice of the discovery algorithm. As discussed in other works [3,25] there is a lack of modeling languages able to faithfully represent human-related processes. Consequently, we focus the comparison only on the visualization of the obtained motifs/models. As mentioned above, the models obtained by LPM are short and difficult to interpret, while the motifs obtained by CvAMoS are more meaningful. For simplicity, only one clear example is reported in Figure 5. The figure compares a motif obtained by CvAMoS with the patterns obtained by LPM, referring to the same behavior. Figure 5a shows a motif identified by CvAMoS, that can be explained as the behavior of going from the kitchen to the bedroom. The motif has a length of 12 and can be identified in 8 out of 15 traces, with one occurrence per trace. To make a fair analogy with the results obtained by LPM, we tried to reconstruct the same behavior using the obtained models. As highlighted in Figure 5b, none of the models covered the path between the two rooms, but only the alternation between three couples of sensors is identified.
To summarize, the results obtained using a real dataset show that:
- CvAMoS, after 27 iterations, abstracted 52% of the total original event log, with a maximum of 67.30% in C14 and a minimum of 21.7% in C5.
- The abstraction is computationally faster compared to LPM: it took 9.5 min in total, with an average execution time of 21 s. LPM needed in total 19.5 min to execute.
- The identified motifs appear to be meaningful and can be interpreted as higher level activities, i.e., they can explain and describe a behavior. An example is shown in Figure 5.
6. Discussion
The approach presented in the paper aims at abstracting activities that are recorded in an event log in the form of raw sensor data. Activities are recurring sequences of events, which are distinguished by the state of the environment when they are performed. The algorithm is compared to another approach from the literature, the event abstraction using LPM. In order to reply to the research questions introduced in Section 1, two evaluations are performed: the first on a synthetic dataset and the second one on a real dataset.
The evaluation using synthetic data consists of a controlled experiment with the objective of verifying the ability of the approach to identify significant sequences of events, which also include the context. In the first experiment, the findings revealed that CvAMoS was able to recognize almost the entire set of the target patterns even if the precision was not perfect as the algorithm also identified non-expected motifs. On the contrary, LPM identified a very small percentage of the target patterns. In the second experiment on the synthetic dataset, only CvAMoS was applied. Additionally, in this case, the algorithm correctly recognized the target patterns, distinguishing them by the context. Unlike the previous experiment, the algorithm was very precise. In particular, it perfectly recognized the patterns in five cases out of fourteen, without producing other non-fitting motifs. This is an important finding in the evaluation of the approach, as it demonstrates the capability of the algorithm in identifying motifs based on the context. The correct identification of the patterns leads to a positive response for RQ1, which questions the approach with respect to its ability to identify meaningful patterns. In this case, the meaningful patterns are the given target patterns. What is more, the algorithm correctly distinguished the patterns based on their context, confirming the ability of the algorithm to deal with the context, i.e., RQ2.
As a second evaluation, we assessed the performances of the algorithm on a real dataset, i.e., the CASAS dataset. Since no ground truth is given regarding the context, we cannot draw any conclusions about RQ2, even if the verified motifs returned by CvAMoS show different contextual attributes. Table 5 depicts the result of the abstraction. Given the possibility to filter the identified patterns in the event log, we can obtain an abstracted log which contains all the aggregated patterns. The abstraction generated 61 different activity labels obtained in 27 iterations. As can be noticed from the colored bars, a considerable part of the original event log is abstracted in motifs, meaning that recurring sub-traces are simplified and replaced with an activity label. Considering that the algorithm replaced the identified patterns with activity labels, obtaining an abstracted event log, RQ3 can be positively answered. Furthermore, the obtained motifs are explicable and can be interpreted as higher-level activities. When comparing our results to those obtained by LPM, it is clear the difference in the expressiveness of the patterns. In fact, LPM only identified models representing the alternation between two or three sensors, and part of them are duplicates. Overall, these findings are in accordance with the drawbacks of the LPM algorithm [26]. The result validates the capability of CvAMoS to satisfy RQ1 as well.
The last aspect to consider is the computation time. The time collected in both cases relates only to the execution of the algorithm and does not include the time required for an expert to supervise the results, filter, and label them. What is more, the computation time also depends on the number of candidates to be evaluated. In this version of CvAMoS, we tried to reduce this set by considering only observed sequences. As a consequence, the time needed for the verification of the candidate motifs is reduced. Even so, it is important to note that in this experiment, the set of candidates is still in the tens of thousands for each run, and the maximum time a run takes to execute is 35 s. This last experiment shows that the implemented algorithm is able to withstand a high event load on a standard laptop. In addition, since the motifs obtained by CvAMoS were more explanatory, the abstraction task was not complex, hence not time consuming. On the other hand, LPM needs twice the time to run. Furthermore, by considering LPM an unsupervised approach, thus avoiding the manual verification and labeling of the models, greatly reduced the total processing time. All things considered, CvAMoS can be applied on a real dataset, requiring low processing time, and positively answering RQ4 as well.
7. Conclusions and Future Work
In this paper, we present a trace-based approach to perform event abstraction. The novelty of the approach lies in its ability to deal with the context during the identification of the patterns. CvAMoS is able to identify common sequences of events in an event log, up to a certain dissimilarity, and distinguish them based on contextual attributes. Contextual information is obtained using sensors that capture the state of the environment while the activity in the pattern is being performed. This information is already included in the raw event log, usually in the form of continuous sensor values (e.g., the temperature sensor). The performance of the algorithm is verified by a dual assessment, the first based on a synthetic dataset and the second on a real dataset. The findings revealed that the algorithm is capable of identifying a set of candidate motifs, without providing prior knowledge. The identified motifs are structured enough to be self-explainable or that can be easily interpreted (RQ1). What is more, the key factor of this paper is the ability of the algorithm to discriminate motifs based on contextual attributes (RQ2). In fact, the algorithm constructs the set of candidate motifs by considering contextual variables, and then considers the context also in the evaluation of the set of motifs. The verified motifs can be filtered in the event log to obtain an abstracted event log (RQ3). Lastly, the algorithm showed good time performance in both evaluations, especially when applied to a real dataset. The algorithm has linear complexity, meaning that the time required to execute increases according to the size of the event log and to the size of the set of candidate motifs. Despite this, the algorithm can be employed on large datasets and maintain reliable performance (RQ4). All things considered, the experiments and the comparison suggest that CvAMoS is a valid technique that can be used in the processing of event logs, to translate low-level events into higher-level meaningful activities, while considering the context.
As a future work, we plan to include a visualization tool for the algorithm, as it simplifies the abstraction as well as reduces the processing time of filtering and labeling. The visualization can also support the evaluation of the context. Moreover, a more refined way to check the contextual attribute distance may be implemented, since it now supports only a few aggregation operators. In addition, it would be interesting to investigate the performances of the approach in different application scenarios.
Author Contributions
Conceptualization, G.D.F. and A.B.; methodology, G.D.F. and A.B.; software, G.D.F. and A.B.; validation, G.D.F. and A.B.; formal analysis, G.D.F. and A.B.; investigation, G.D.F. and A.B.; resources, G.D.F. and A.B.; data curation, G.D.F.; writing–original draft preparation, G.D.F.; writing–review and editing, G.D.F. and A.B.; visualization, G.D.F. and A.B.; supervision, A.B. All authors have read and agreed to the published version of the manuscript.
Funding
This research received no external funding.
Data Availability Statement
The approach presented in this paper, CvAMoS, is implemented as a Java application. The source code is available in the following repository: https://github.com/gemmadifederico/Cvamos (accessed on 9 February 2023). All the datasets used during the evaluation of the approach can be found at https://doi.org/10.5281/zenodo.7613326, together with the detailed results.
Conflicts of Interest
The authors declare no conflict of interest.
References
- Van Der Aalst, W. Process Mining: Data Science in Action; Springer: Berlin/Heidelberg, Germany, 2016; Volume 2. [Google Scholar]
- Banovic, N.; Buzali, T.; Chevalier, F.; Mankoff, J.; Dey, A.K. Modeling and understanding human routine behavior. In Proceedings of the 2016 CHI Conference on Human Factors in Computing Systems, San Jose, CA, USA, 7–12 May 2016; pp. 248–260. [Google Scholar]
- Di Federico, G.; Burattin, A.; Montali, M. Human Behavior as a Process Model: Which Language to Use? In Proceedings of the ITBPM@ BPM, Rome, Italy, 10 September 2021; pp. 18–25. [Google Scholar]
- Stefanini, A.; Aloini, D.; Benevento, E.; Dulmin, R.; Mininno, V. A process mining methodology for modeling unstructured processes. Knowl. Process Manag. 2020, 27, 294–310. [Google Scholar] [CrossRef]
- Di Ciccio, C.; Marrella, A.; Russo, A. Knowledge-intensive processes: Characteristics, requirements and analysis of contemporary approaches. J. Data Semant. 2015, 4, 29–57. [Google Scholar] [CrossRef] [Green Version]
- Fernandez-Llatas, C. Interactive Process Mining in Healthcare; Springer: Berlin/Heidelberg, Germany, 2021. [Google Scholar]
- Fernández-Llatas, C.; Benedi, J.M.; García-Gómez, J.M.; Traver, V. Process mining for individualized behavior modeling using wireless tracking in nursing homes. Sensors 2013, 13, 15434–15451. [Google Scholar] [CrossRef] [PubMed] [Green Version]
- Seiger, R.; Malburg, L.; Weber, B.; Bergmann, R. Integrating process management and event processing in smart factories: A systems architecture and use cases. J. Manuf. Syst. 2022, 63, 575–592. [Google Scholar] [CrossRef]
- Di Federico, G.; Burattin, A. vAMoS: EVent Abstraction via Motifs Search. In Proceedings of the Business Process Management Workshops: BPM 2022 International Workshops, Münster, Germany, 11–16 September 2022; Revised Selected Papers. pp. 101–112. [Google Scholar]
- Van Zelst, S.J.; Mannhardt, F.; de Leoni, M.; Koschmider, A. Event abstraction in process mining: Literature review and taxonomy. Granul. Comput. 2021, 6, 719–736. [Google Scholar] [CrossRef]
- Diba, K.; Batoulis, K.; Weidlich, M.; Weske, M. Extraction, correlation, and abstraction of event data for process mining. Wiley Interdiscip. Rev. Data Min. Knowl. Discov. 2020, 10, e1346. [Google Scholar] [CrossRef]
- Leotta, F.; Mecella, M.; Sora, D. Visual process maps: A visualization tool for discovering habits in smart homes. J. Ambient. Intell. Humaniz. Comput. 2020, 11, 1997–2025. [Google Scholar] [CrossRef]
- Mannhardt, F.; Leoni, M.D.; Reijers, H.A.; Van Der Aalst, W.M.; Toussaint, P.J. From low-level events to activities—A pattern-based approach. In Proceedings of the International Conference on Business Process Management, Rome, Italy, 6–10 September 2021; pp. 125–141. [Google Scholar]
- Carmona, J.; van Dongen, B.; Solti, A.; Weidlich, M. Conformance Checking; Springer: Berlin/Heidelberg, Germany, 2018. [Google Scholar]
- Mannhardt, F.; Tax, N. Unsupervised Event Abstraction using Pattern Abstraction and Local Process Models. arXiv 2017, arXiv:1704.03520. [Google Scholar]
- Tax, N.; Sidorova, N.; Haakma, R.; van der Aalst, W.M. Mining local process models. J. Innov. Digit. Ecosyst. 2016, 3, 183–196. [Google Scholar] [CrossRef]
- Lu, X.; Fahland, D.; Andrews, R.; Suriadi, S.; Wynn, M.T.; ter Hofstede, A.H.; van der Aalst, W.M. Semi-supervised log pattern detection and exploration using event concurrence and contextual information. In On the Move to Meaningful Internet Systems, Proceedings of the OTM 2017 Conferences: Confederated International Conferences: CoopIS, C&TC, and ODBASE 2017, Rhodes, Greece, 23–27 October 2017; Proceedings, Part I; Springer: Berlin/Heidelberg, Germany, 2017; pp. 154–174. [Google Scholar]
- De Leoni, M.; Dündar, S. Event-log abstraction using batch session identification and clustering. In Proceedings of the ACM SAC, Brno, Czech Republic, 30 March–3 April 2020; pp. 36–44. [Google Scholar]
- Melman, P.; Roshan, U.W. K-means-based feature learning for protein sequence classification. In Proceedings of the BICOB, Las Vegas, NV, USA, 19–21 March 2018. [Google Scholar]
- Koschmider, A.; Mannhardt, F.; Heuser, T. On the contextualization of event-activity mappings. In Proceedings of the Business Process Management Workshops: BPM 2018 International Workshops, Sydney, NSW, Australia, 9–14 September 2018; Revised Papers 16. pp. 445–457. [Google Scholar]
- Nicolae, M.; Rajasekaran, S. qPMS9: An efficient algorithm for quorum planted motif search. Sci. Rep. 2015, 5, 7813. [Google Scholar] [CrossRef] [PubMed] [Green Version]
- Koschmider, A.; Leotta, F.; Serral, E.; Torres, V. BP-Meets-IoT 2021 Challenge Dataset. Available online: http://pros.webs.upv.es/sites/bp-meet-iot2021/ (accessed on 1 October 2022).
- Cook, D.J. Learning setting-generalized activity models for smart spaces. IEEE Intell. Syst. 2010, 2010, 1. [Google Scholar] [CrossRef] [PubMed] [Green Version]
- Berti, A.; Li, C.Y.; Schuster, D.; van Zelst, S.J. The process mining toolkit (pmtk): Enabling advanced process mining in an integrated fashion. In Proceedings of the ICPM Demo Track 2021, Eindhoven, The Netherlands, 1 November 2021. [Google Scholar]
- Di Federico, G.; Burattin, A. Do You Behave Always the Same? A Process Mining Approach. In Proceedings of the Process Mining Workshops: ICPM 2022 International Workshops, Bozen-Bolzano, Italy, 23–28 October 2022; Springer: Cham, Stwizerland, 2023. [Google Scholar]
- Brunings, M.; Fahland, D.; van Dongen, B. Defining meaningful local process models. In Transactions on Petri Nets and Other Models of Concurrency XVI; Springer: Berlin/Heidelberg, Germany, 2022; pp. 24–48. [Google Scholar]
Figure 1.
Overview of the CvAMoS approach.

Figure 2.
Q1 and QR metrics for the three configurations (higher is better). (a) Q1 for the executions R1, R2, and R3. (b) Aggregated QR for R1, R2, and R3.
Figure 2.
Q1 and QR metrics for the three configurations (higher is better). (a) Q1 for the executions R1, R2, and R3. (b) Aggregated QR for R1, R2, and R3.

Figure 3.
Computation time for R1, R2, and R3 (lower is better, logarithmic scale).

Figure 4.
Verified motifs to which the same activity label has been assigned (Picture obtained from the Process Mining ToolKit).
Figure 4.
Verified motifs to which the same activity label has been assigned (Picture obtained from the Process Mining ToolKit).

Figure 5.
Comparison between a motif obtained by CvAMoS and a tentative to reconstruct it by using the patterns obtained by LPM. (a) Motif obtained by CvAMoS. (b) Patterns obtained by LPM.
Figure 5.
Comparison between a motif obtained by CvAMoS and a tentative to reconstruct it by using the patterns obtained by LPM. (a) Motif obtained by CvAMoS. (b) Patterns obtained by LPM.


Table 1.
Set of patterns and corresponding explanation.
| Pattern | Explanation |
|---|---|
| P1 | A sensor is triggered several times in a row, meaning that a person is executing an activity for a certain amount of time and which is captured by a single sensor, e.g., . |
| P2 | The pattern involves two sensors that are in sync, and thus alternating. Usually, sensors in close proximity are synchronized, e.g., a person is executing an activity in a limited space and causes the activation of two sensors, such as . |
| P3 | The pattern involves two sensors, that are not in sync. The situation is the same as P2, but the sensors can trigger in any order, e.g., . |
| P4 | The pattern involves several sensors and the execution starts and ends with the same being triggered. In between, any other sensor can be fired in any order, e.g., entering a room, moving, and leaving: the first and last triggers are door sensors, resulting in . |
| P5 | The pattern involves three sensors, that are in sync. The execution starts and ends with the same sensor, e.g., entering a room, executing an activity that involves two sensors, and leaving the room: . |
| P6 | The pattern involves a set of sensors. The set is limited, but there is no order. The situation is similar to P4, but without boundaries, e.g., . |
| P7 | The pattern is composed of a movement in a direction and then backward, e.g., walking down a corridor and then coming back: . |
| P8 | The pattern involves a constant sensor that is activated in sync with the alternation of others sensors, e.g., while executing two activities in parallel such as watching the television and moving around the room, . |
Table 2.
Algorithm configurations for the identification evaluation.
| R1 | R2 | R3 | ||
|---|---|---|---|---|
| LPM | Max transitions | 4 | 5 | 5 |
| No. of LPMs | 1 | 5 | 10 | |
| Min occurrences | 4 | 4 | 3 | |
| Min determinism | 0.5 | 0.5 | 0.5 | |
| Min non fitting ev. | F | 2 | 2 | |
| Projection | None | Markov | Markov | |
| Duplicate trans. | F | F | T | |
| CvAMoS | Motif length | 6 | 6 | 12 |
| Quorum | 1 | 1 | 0.8 | |
| Max activity distance | 0 | 1 | 2 |
Table 3.
Algorithm configuration for the evaluation with context.
| R4 | R5 | ||
|---|---|---|---|
| CvAMoS | Motif length | 6 | 6 |
| Quorum | 0.7 | 0.7 | |
| Max activity distance | 0 | 1 | |
| Max attribute distance | 0 | 1 |
Table 4.
QR metrics for the two runs R4 and R5 on CvAMoS.
| P1 | P1–Pn | P2 | P2–Pn | P3 | P3–Pn | P4 | P5 | P5–Pn | P6 | P7 | P7–Pn | P8 | P8–Pn | ||
|---|---|---|---|---|---|---|---|---|---|---|---|---|---|---|---|
| R4 | 1 | 0.5 | 0.5 | 0.5 | 1 | 0 | 0 | 0.5 | 0.5 | 0 | 1 | 1 | 1 | 0 | 0.526316 |
| R5 | 0.5 | 0.5 | 0.5 | 0.5 | 0.5 | 0.5 | 0 | 0.5 | 0.5 | 0 | 0.5 | 0.5 | 0.5 | 0.5 | 0.461538 |
Table 5.
CASAS dataset before and after abstraction.
| ID | Scarf-Plot | # EVS Before | # EVS Not Abstracted | % Abstacted EVS |
|---|---|---|---|---|
| C4 |  | 718 | 276 | 61.6% |
| C5 |  | 2109 | 1652 | 21.7% |
| C6 |  | 866 | 384 | 55.7% |
| C7 |  | 813 | 411 | 49.4% |
| C8 |  | 702 | 284 | 59.5% |
| C9 |  | 782 | 308 | 60.6% |
| C10 |  | 335 | 119 | 64.5% |
| C11 |  | 647 | 246 | 62.0% |
| C12 |  | 931 | 336 | 63.9% |
| C13 |  | 841 | 340 | 59.6% |
| C14 |  | 275 | 90 | 67.3% |
| C15 |  | 365 | 147 | 59.7% |
| C16 |  | 570 | 198 | 65.3% |
| C17 |  | 319 | 117 | 63.3% |
| C18 |  | 553 | 214 | 61.3% |
Each activity identifier is represented by a different shade of purple. Yellow shadows represent abstracted motifs.
Table 6.
Computation time for the experiments with CvAMoS.
| Run ID | Motifs Verified | Time (ms) |
|---|---|---|
| conf1 | 37 | 34,714 |
| conf2 | 9 | 26,945 |
| conf3 | 1 | 35,080 |
| conf4 | 23 | 31,702 |
| conf5 | 5 | 26,520 |
| conf6 | 28 | 26,601 |
| conf7 | 2 | 26,677 |
| conf8 | 3 | 13,948 |
| conf9 | 100 | 10,792 |
| conf10 | 2 | 19,458 |
| conf11 | 442 | 16,110 |
| conf12 | 7 | 25,207 |
| conf13 | 2 | 18,949 |
| conf14 | 2 | 22,433 |
| conf15 | 47 | 24,468 |
| conf16 | 16 | 26,584 |
| conf17 | 1 | 25,848 |
| conf18 | 11 | 25,995 |
| conf19 | 1 | 18,761 |
| conf20 | 57 | 10,017 |
| conf21 | 2 | 6039 |
| conf22 | 7 | 8694 |
| conf23 | 3 | 17,204 |
| conf24 | 15 | 31,006 |
| conf25 | 7 | 15,599 |
| conf26 | 2 | 13,793 |
| conf27 | 41 | 12,599 |
| Total time (ms) | 571,743 | |
Disclaimer/Publisher’s Note: The statements, opinions and data contained in all publications are solely those of the individual author(s) and contributor(s) and not of MDPI and/or the editor(s). MDPI and/or the editor(s) disclaim responsibility for any injury to people or property resulting from any ideas, methods, instructions or products referred to in the content. |
© 2023 by the authors. Licensee MDPI, Basel, Switzerland. This article is an open access article distributed under the terms and conditions of the Creative Commons Attribution (CC BY) license (https://creativecommons.org/licenses/by/4.0/).
Share and Cite
MDPI and ACS Style
Di Federico, G.; Burattin, A. CvAMoS—Event Abstraction Using Contextual Information. Future Internet 2023, 15, 113. https://doi.org/10.3390/fi15030113
AMA Style
Di Federico G, Burattin A. CvAMoS—Event Abstraction Using Contextual Information. Future Internet. 2023; 15(3):113. https://doi.org/10.3390/fi15030113
Chicago/Turabian StyleDi Federico, Gemma, and Andrea Burattin. 2023. "CvAMoS—Event Abstraction Using Contextual Information" Future Internet 15, no. 3: 113. https://doi.org/10.3390/fi15030113
Note that from the first issue of 2016, this journal uses article numbers instead of page numbers. See further details here.