
IoT-Portrait: Automatically Identifying IoT Devices via Transformer with Incremental Learning

1
School of Cyber Science and Engineering, Wuhan University, Wuhan 430072, China
2
Key Laboratory of Aerospace Information Security and Trusted Computing Ministry of Education, Wuhan University, Wuhan 430072, China
*
Author to whom correspondence should be addressed.
Future Internet 2023, 15(3), 102; https://doi.org/10.3390/fi15030102
Submission received: 2 February 2023
/
Revised: 28 February 2023
/
Accepted: 28 February 2023
/
Published: 7 March 2023
(This article belongs to the Section Internet of Things)
Abstract
:With the development of IoT, IoT devices have proliferated. With the increasing demands of network management and security evaluation, automatic identification of IoT devices becomes necessary. However, existing works require a lot of manual effort and face the challenge of catastrophic forgetting. In this paper, we propose IoT-Portrait, an automatic IoT device identification framework based on a transformer network. IoT-Portrait automatically acquires information about IoT devices as labels and learns the traffic behavior characteristics of devices through a transformer neural network. Furthermore, for privacy protection and overhead reasons, it is not easy to save all past samples to retrain the classification model when new devices join the network. Therefore, we use a class incremental learning method to train the new model to preserve old classes’ features while learning new devices’ features. We implement a prototype of IoT-Portrait based on our lab environment and open-source database. Experimental results show that IoT-Portrait achieves a high identification rate of up to 99% and is well resistant to catastrophic forgetting with a negligible added cost both in memory and time. It indicates that IoT-Portrait can classify IoT devices effectively and continuously.
1. Introduction
Over the past few years, the Internet of Things (IoT) has witnessed rapid growth on a global scale. Various IoT devices, including daily necessities and professional equipment, are becoming increasingly popular and continuously expanding the volume and diversity of the entire cyberspace. According to Statista’s forecast, the number of IoT devices connected worldwide will reach 75.44 billion by 2025 [1].
With the proliferation of IoT devices, smart homes and cities are increasingly equipped with a lot of IoT devices. Nevertheless, operators of such smart environments may not know which IoT assets they own, nor can they know in real time whether each IoT device normally works to defend against cyber attacks. These pose a threat to network security and device security. When an IoT device is attacked, it may stop working and even leak personal privacy data. Thus, operators need sufficient visibility of the types of deployed devices, and device identification is one of the critical methods to enhance system visibility.
Some works utilize machine learning techniques to learn traffic characteristics of devices and identify the device during runtime [2,3,4,5,6,7,8,9,10,11,12,13,14,15]. However, there are some limitations of existing works as follows:
- Existing works based on machine learning [3,4,5,6,7,8,9,10,11], such as gradient boosting [5] and random forest classification algorithms [3,6], require manual feature extraction and feature filtering. Some works use deep learning [12,13,14,15] to extract features automatically, but they still need to label samples manually. Due to the amount and diversity of IoT devices, these manual works will take a lot of time and effort;
- The classification model can only identify the devices in the training set. When a new device joins the network, the old classifier cannot recognize it. One solution is to save all past samples and retrain the model with past samples and new device samples when needed. However, this will take a lot of memory space to save past samples, and it will take a long time to retrain the model. Meanwhile, in real task scenarios, the past samples cannot be fully preserved due to privacy, data storage, and computing power limitations. Therefore, the new model’s performance in the old classes will drop catastrophically after learning the new task, which is called catastrophic forgetting.
In this paper, we analyzed the network behaviors of multiple IoT devices and observed that there are some characteristics in the network traffic that can identify specific devices. Based on this discovery, we propose IoT-Portrait, an end-to-end automatic IoT device identification framework that classifies IoT devices by mining critical and unique features of devices in traffic. IoT-Portrait automatically collects the network traffic information of various devices and learns the network behavior characteristics through an attention-based transformer [16] network without feature extraction. In addition, IoT-Portrait uses a comprehensive active device scanning process to automatically obtain fine-grained non-traffic information (e.g., operating system, device manufacturer, device type, product model). This information is then used as labels for our transformer model. After training the classification model, IoT-Portrait only needs to collect the network traffic of devices. After a small number of preprocessing operations, the device details can be obtained through the classification model. Furthermore, we further investigate how to make our model avoid catastrophic forgetting [17] on old knowledge when new devices join the network. We apply the class incremental method to IoT-Portrait, which will learn new knowledge while retaining old knowledge and strike a balance between the model’s stability and plasticity.
The main contributions of this paper are as follows:
- We propose IoT-Portrait, an automatic IoT device identification framework, using a transformer network to mine the significant characteristics of the IoT device in the traffic and improve the effectiveness of IoT device identification;
- We consider scenarios where the categories of devices increase after model training, and we do not save all old class samples. We compare several methods of resisting catastrophic forgetting and find that IoT-Portrait can achieve a small drop of accuracy using only a little storage space for old exemplars;
- We implement the IoT-Portrait prototype and evaluate it on our lab environment and open-source database. The results show that IoT-Portrait achieves a high device identification rate of up to 99% and is well resistant to catastrophic forgetting with a negligible added cost both in memory and time.
The rest of the paper is organized as follows. Section 2 discusses the related works and our novelty. Section 3 analyzes IoT devices’ traffic characteristics. Section 4 presents the system overview and design details of IoT-Portrait. In Section 5, we evaluate the proposed framework and present the experimental results. Section 6 discusses the limitations of our work and future works. Section 7 offers some concluding remarks.
2. Novelty and Related Work
2.1. Device Identification
IoT device identification has attracted increasing attention from both academia and industry since it makes IoT devices visible to the management system. Many efforts have been devoted to device identification. In this section, we analyze several works on device identification mainly following two methodologies, scanning-based active fingerprinting and learning-based passive recognition, and highlight our innovations different from other works.
One of the most popular active scanning tools for OS fingerprinting is Nmap [18]. It sends different probing packets to the target and discovers services on the target by analyzing the responses. Shodan [19] and Censys [20] are popular Internet-connected device search engines. They discover connected devices on the Internet using scanning, such as Nmap, with different protocols (e.g., HTTP, SSH, FTP, and Telnet), and manually generate device rules in banner grabbing. ARE [21] retrieves data from the application layer (HTML) of an IoT device by using traditional intrusive scanning tools, and then generates descriptions on relevant websites for device annotations with web crawlers. It defines a transaction as a mapping between a unique response and the product description to identify IoT devices. However, scanning-based active fingerprinting, as an intrusive solution, may have a negative impact on the performance of resource-constrained and low-power IoT devices. Moreover, this approach cannot achieve timely recognition for less-opened IoT devices.
Learning-based passive recognition utilizes machine learning techniques to learn traffic characteristics of devices, sniff the traffic, and identify the device during runtime. ProfilIoT [3] is the first work that uses machine learning to learn device network behavior for device identification. It shows that the type of IoT devices can be recognized based on the observed traffic characteristics, such as TCP window size and payload length. IoT-Sentinel [6] implements a recognition scheme based on the random forest algorithm in classical machine learning. It also includes an SDN-based model, which implements vulnerable traffic’s interception and filtering mechanism to build a better security system. IoT-Sense [5] analyzes the behavior of a device and generates its fingerprint from a small amount of flow data. It also evaluates the impact of different feature combinations on recognition results. Manuel et al. [14] designed a network traffic classifier for IoT devices using CNN and RNN, and investigated the impact of the features chosen. HomeMole [15] is a traffic-analysis system that can automatically infer the IoT devices behind a smart home network. It uses a bidirectional LSTM model that is able to identify IoT devices based on the sniffed packets. However, the above learning-based solutions require complicated feature extraction and extensive manual labeling, especially since the dramatic increase in training data of IoT requires a large number of resources.
2.2. Compare with Previous Works
IoT-Portrait uses a transformer model to learn the network behavior characteristics of IoT devices. Transformer architecture is based on the attention mechanism, which can identify relationships between sequence elements so that it can obtain the time-series correlation on the device packets. In addition, IoT-Portrait acquires comprehensive device information by active device scanning and uses this information as the traffic’ label without manual effort. In addition, although there have been proposals to solve the problem of catastrophic forgetting in class incremental learning, these works are basically in the field of computer vision. To the best of our knowledge, IoT-Portrait is the first work that applies the class incremental learning method to IoT device identification, which not only expands the usage scenarios of our device identification framework but also verifies the feasibility of class incremental learning in IoT device identification.
3. Analysis of IoT Traffic
Network communication characteristics form another category of device information. Since attributes of network behaviors include information such as the source and destination of the data packets, timestamps, and protocols, the behavioral representation of devices is often complicated and diverse. We analyzed the network behaviors of five representative IoT devices to identify the statistical properties of specific traffic attributes. The analysis results are shown in Table 1. From the analysis, we find that the difference between IoT devices and traditional computers is the regularity in network behaviors of IoT devices, which can be used to fingerprint them.
3.1. IP and MAC Addresses of Device’s Communication Endpoints
IoT devices usually communicate with limited specific endpoints, such as cloud servers. Therefore, the address information of the specific communication endpoints in the traffic data can be used as a feature of the device. As shown in Table 1, SmartThings Hub and NetGear Station communicate with 12 and 21 IP addresses, respectively. In addition, the other devices communicate with 4, 6, and 4 IP addresses, while traditional PCs may communicate with tens of thousands of IP addresses [22]. This shows that IoT devices have far fewer communication endpoints than traditional PCs, mobile phones, and tablets. Usually, the same type of IoT devices have the same cloud servers, and server objects of the same device are often limited to a specific range. This is consistent with a previous study [23], which finds that most IoT devices communicate with an average of fewer than ten servers daily, and the number of target cloud servers is entirely consistent among some IoT devices. Therefore, IP and MAC addresses of the communication endpoints can be used as a criterion to identify IoT devices.
3.2. Specific Ports
In addition to IP and MAC addresses, communication ports can also be used as another criterion. IoT devices usually use specific ports to communicate with cloud servers. In contrast, non-IoT devices may use a much more comprehensive range of services with thousands of infrequent ports [22], so the port number can also be used to identify IoT devices accordingly. For commonly used ports, we can also infer the services they might use. For instance, SmartThings Hub primarily connects to the server’s TCP port 433, which is used by default for HTTPS service. The target port of NetGear Station is mainly UDP port 10001, which takes more than 98% of all packets. The rest of the packets go to TCP port 80, indicating the HTTP service. Over 95% of the packets of WoShida Cam go to the server’s TCP port 44730.
3.3. Specific Use of Protocols
Different from PCs, IoT devices show specific characteristics through the use of protocols. For example, we find that SmartThings Hub repeatedly queries the domain name ntp01.alro.com through the DNS protocol and performs time synchronization via the NTP protocol. NetGear Station queries the DNS server, mainly for domain name gm.iotplatform, every 300 seconds and sends ten consecutive ping packets every 320 seconds. Moreover, it also broadcasts MDNS packets every 60 seconds, which are usually used for device identification in a local area network (LAN).
3.4. Regular Packet Rate
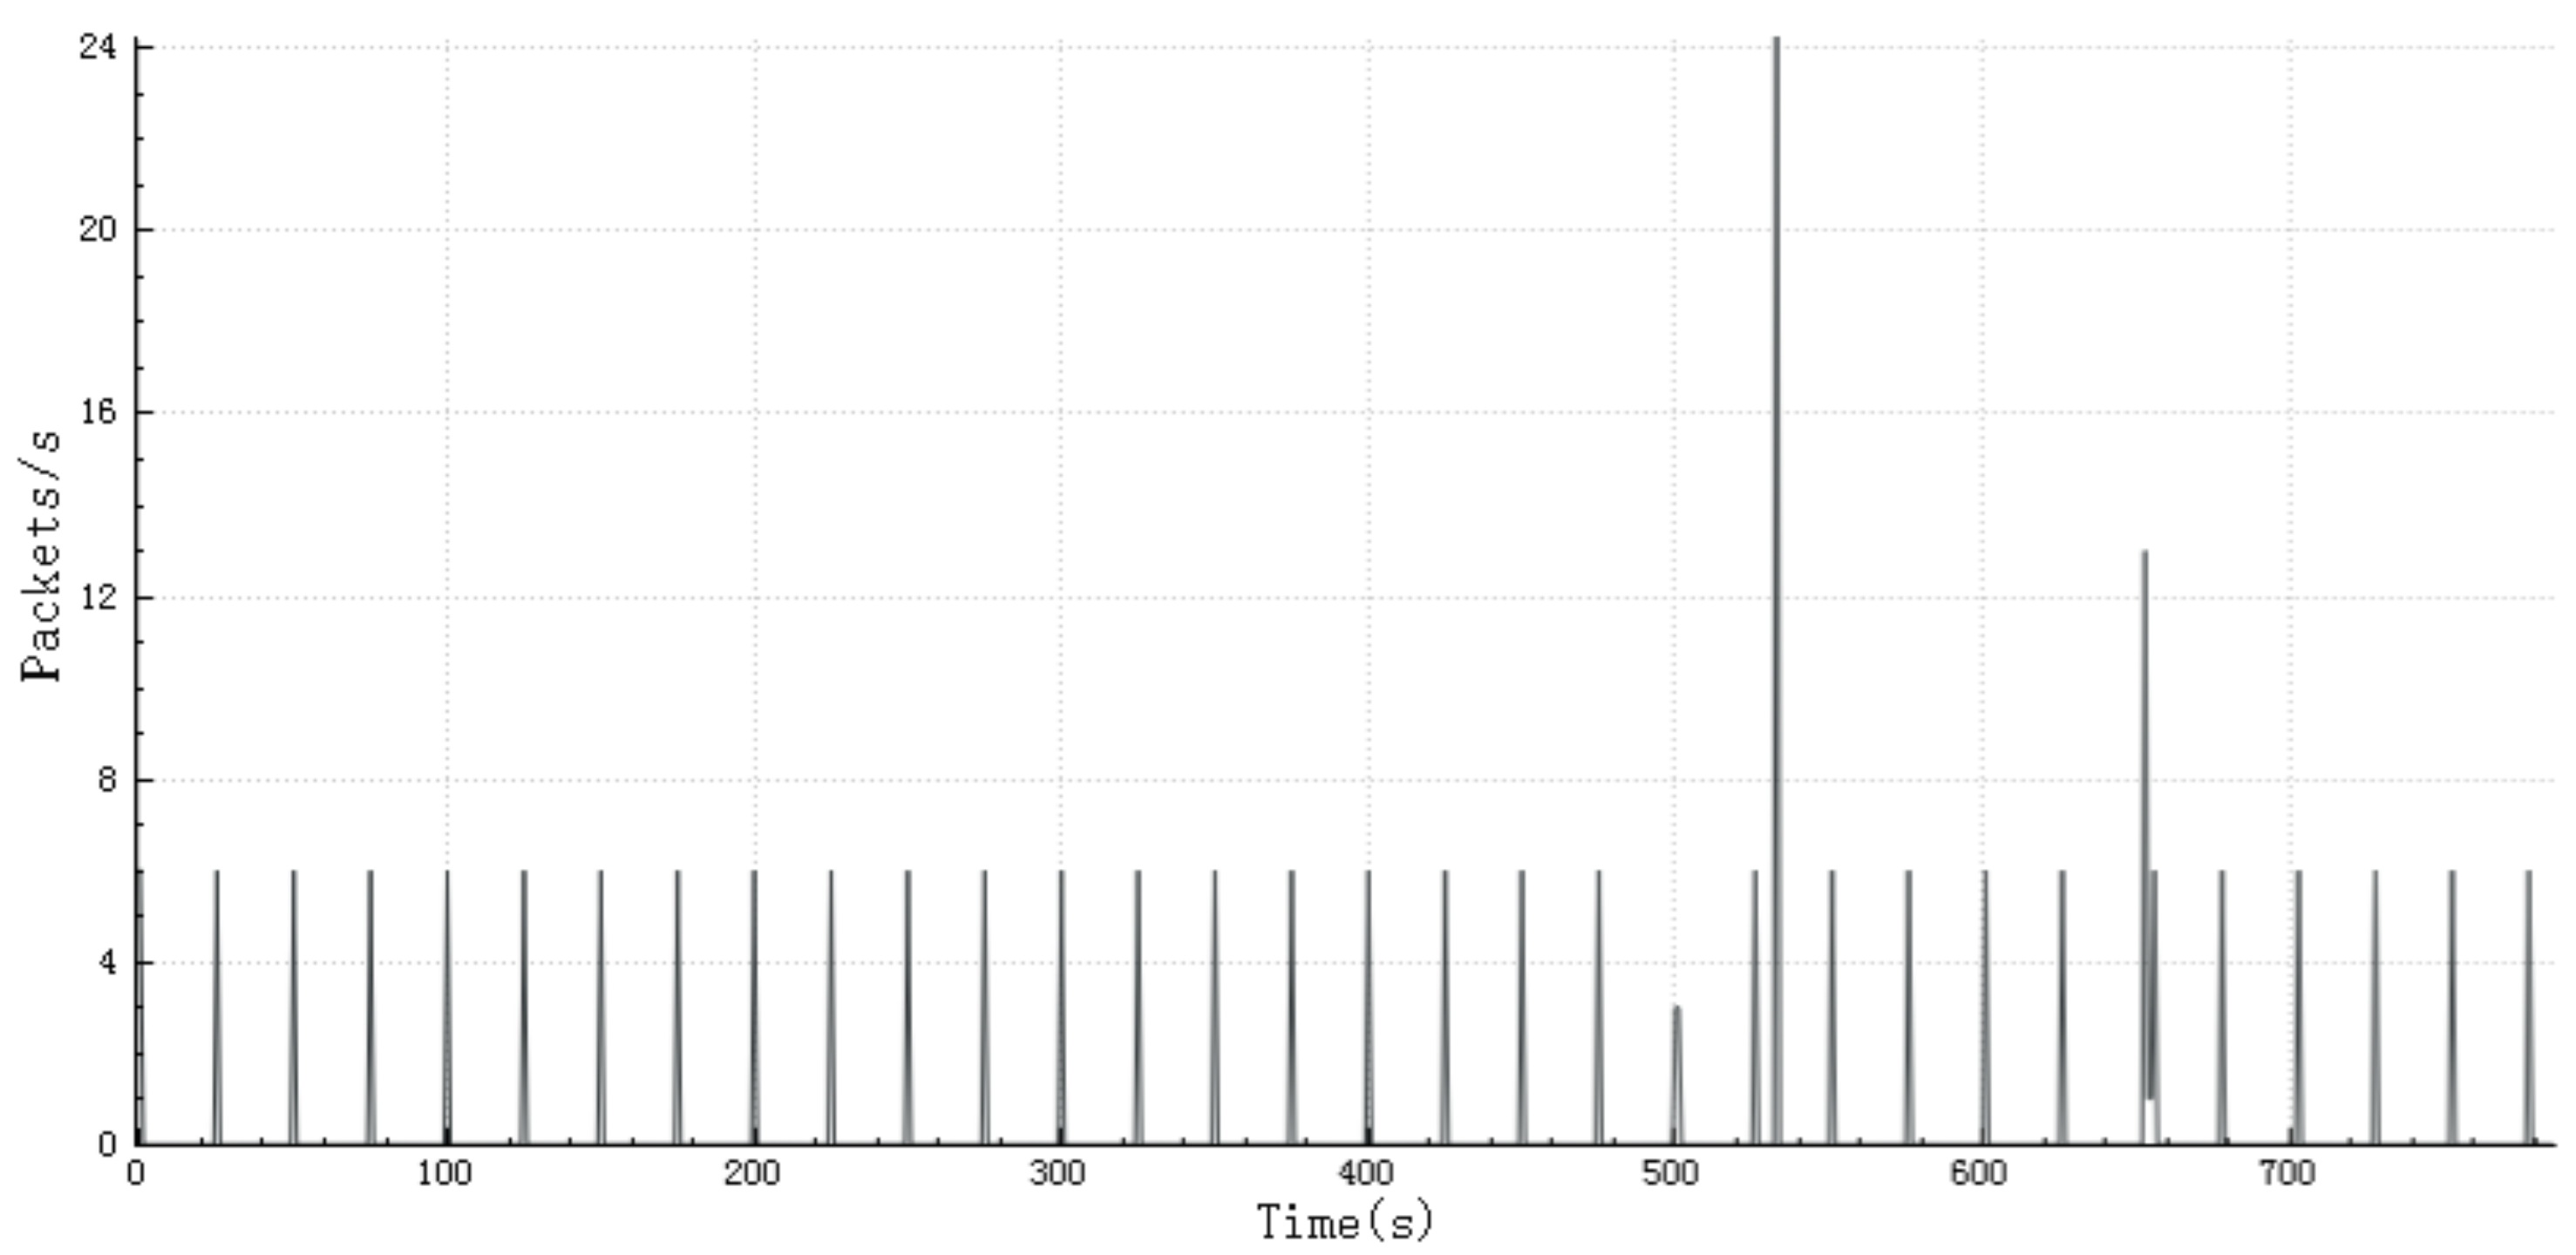
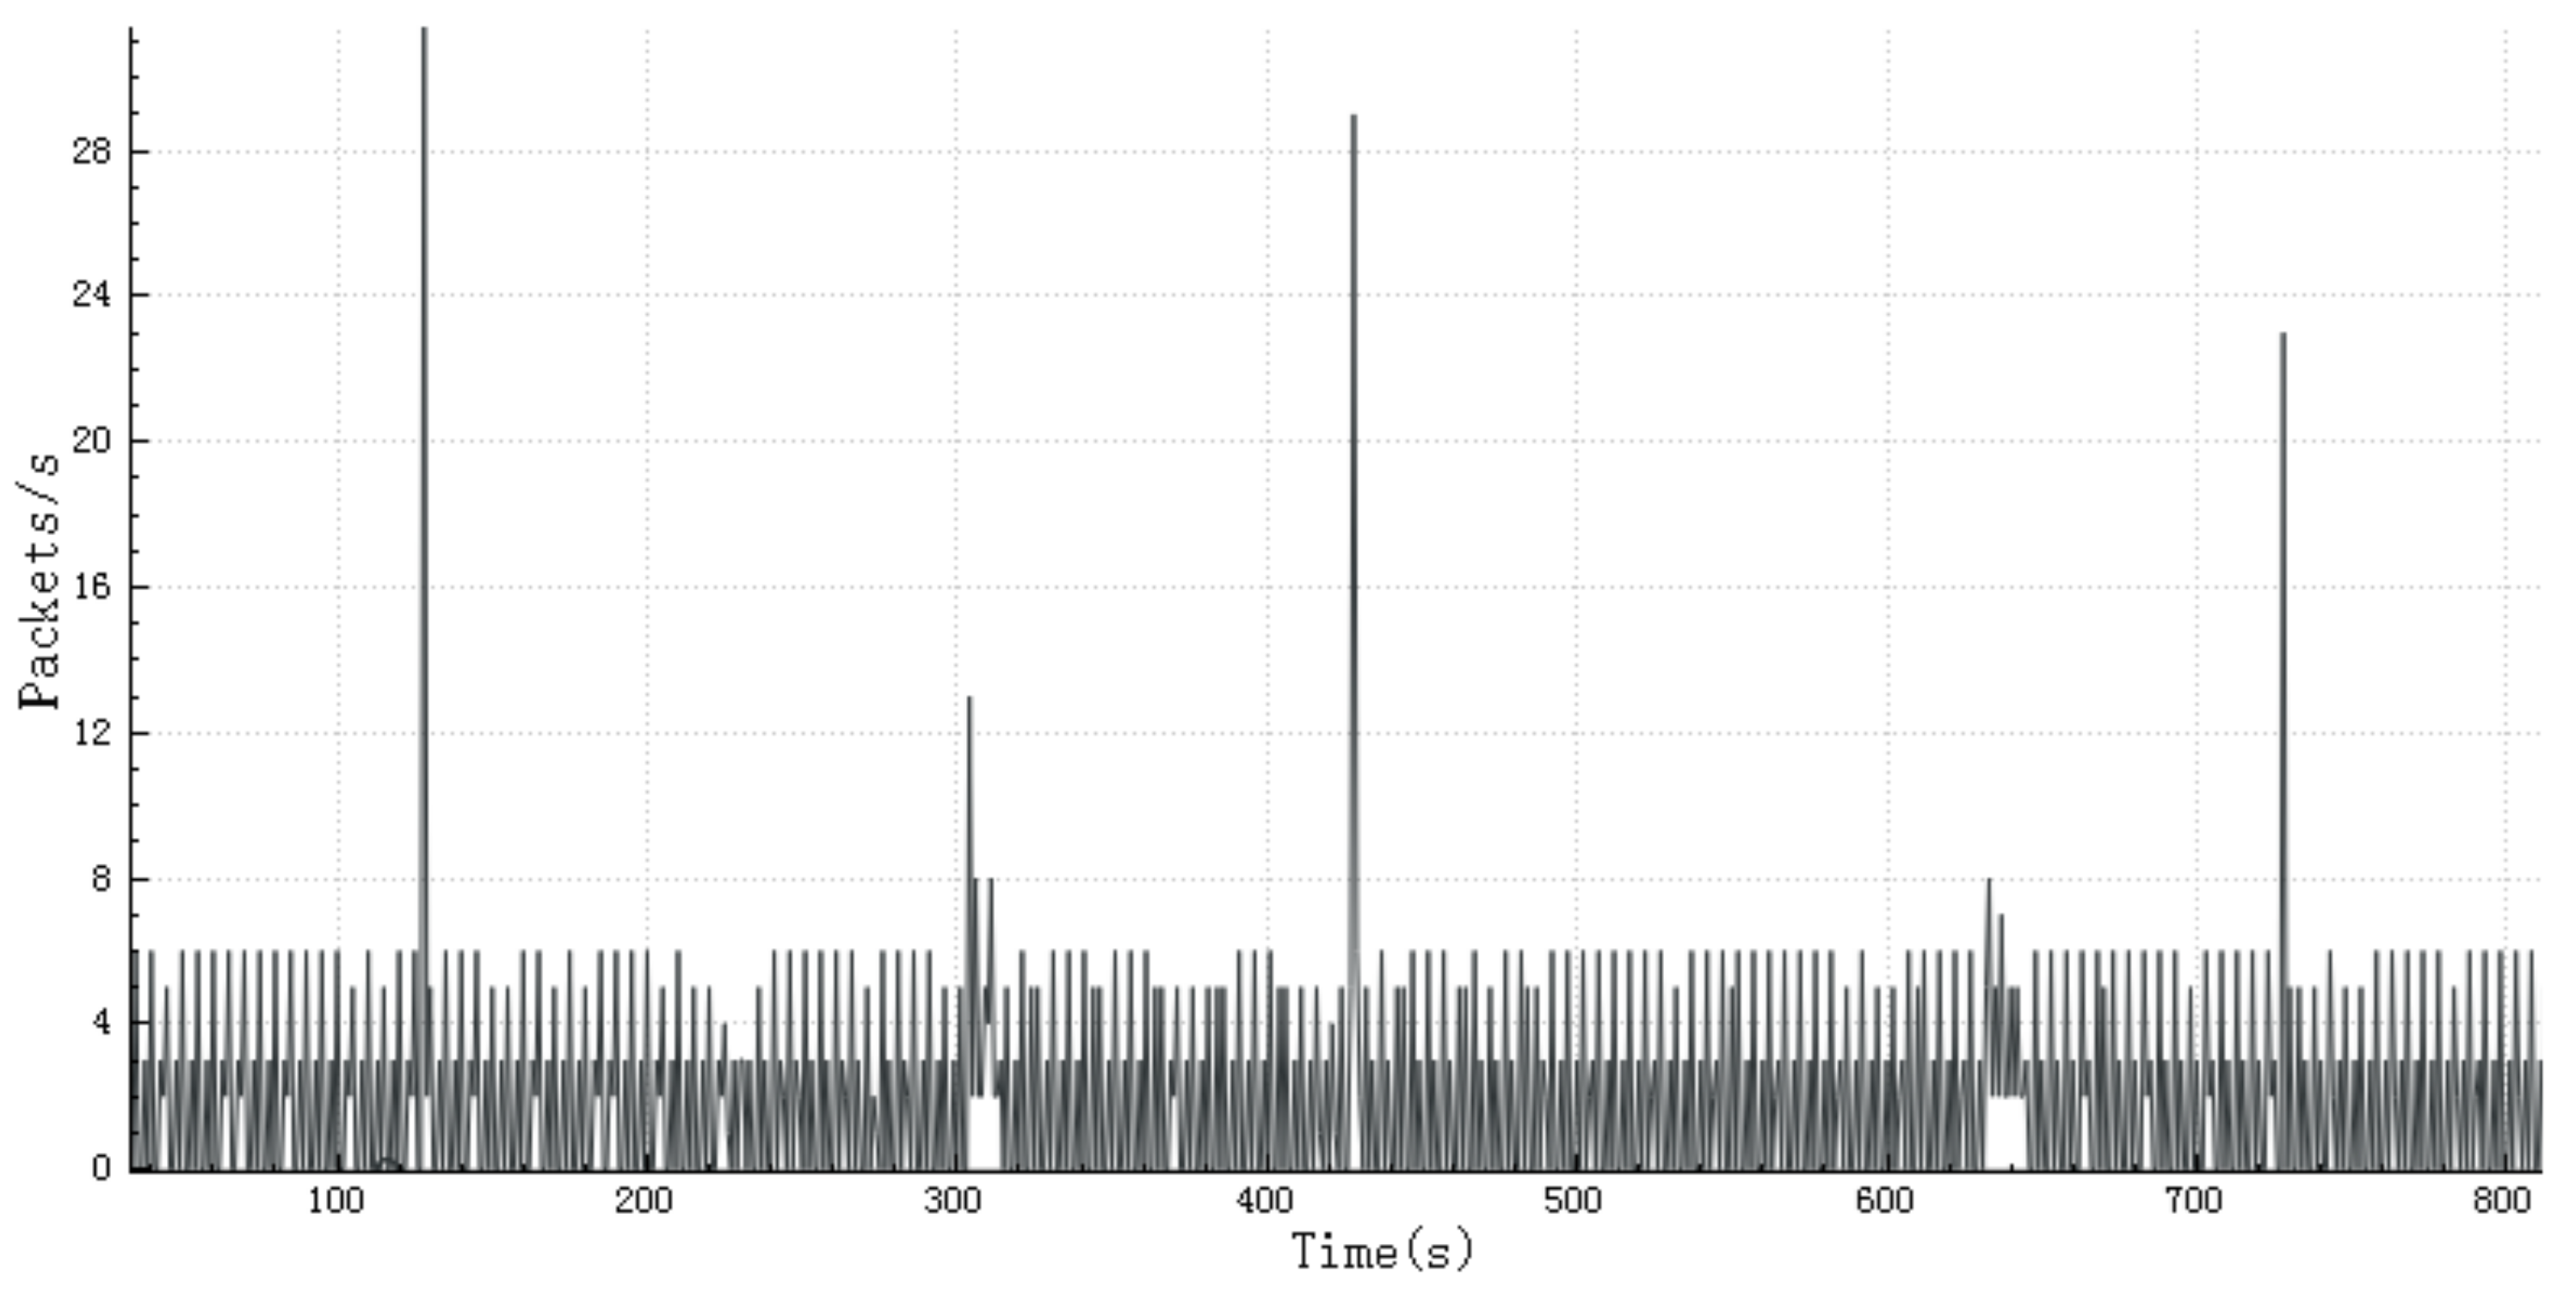
The packet rate can also represent the characteristics of an IoT device. Figure 1 and Figure 2 illustrate the packet rate of SmartThings Hub and NetGear Station. From Figure 1 and Figure 2, we can see that in a certain period, the packet rate fluctuates steadily most of the time, and the number of data packets increases several times in a few seconds.
In summary, the IP addresses and ports that the IoT devices communicate with show prominent statistical characteristics manifested by the limited number of communication endpoints and specific frequently used ports. Most of our sample devices demonstrate a periodical transmission of DNS and ICMP packets. When we analyze the data packets per unit of time, we can also observe the steady flow pattern of each device. Such features are usually caused by periodical upload operations or the use of regular operation settings by the users.
4. System Design
4.1. System Overview
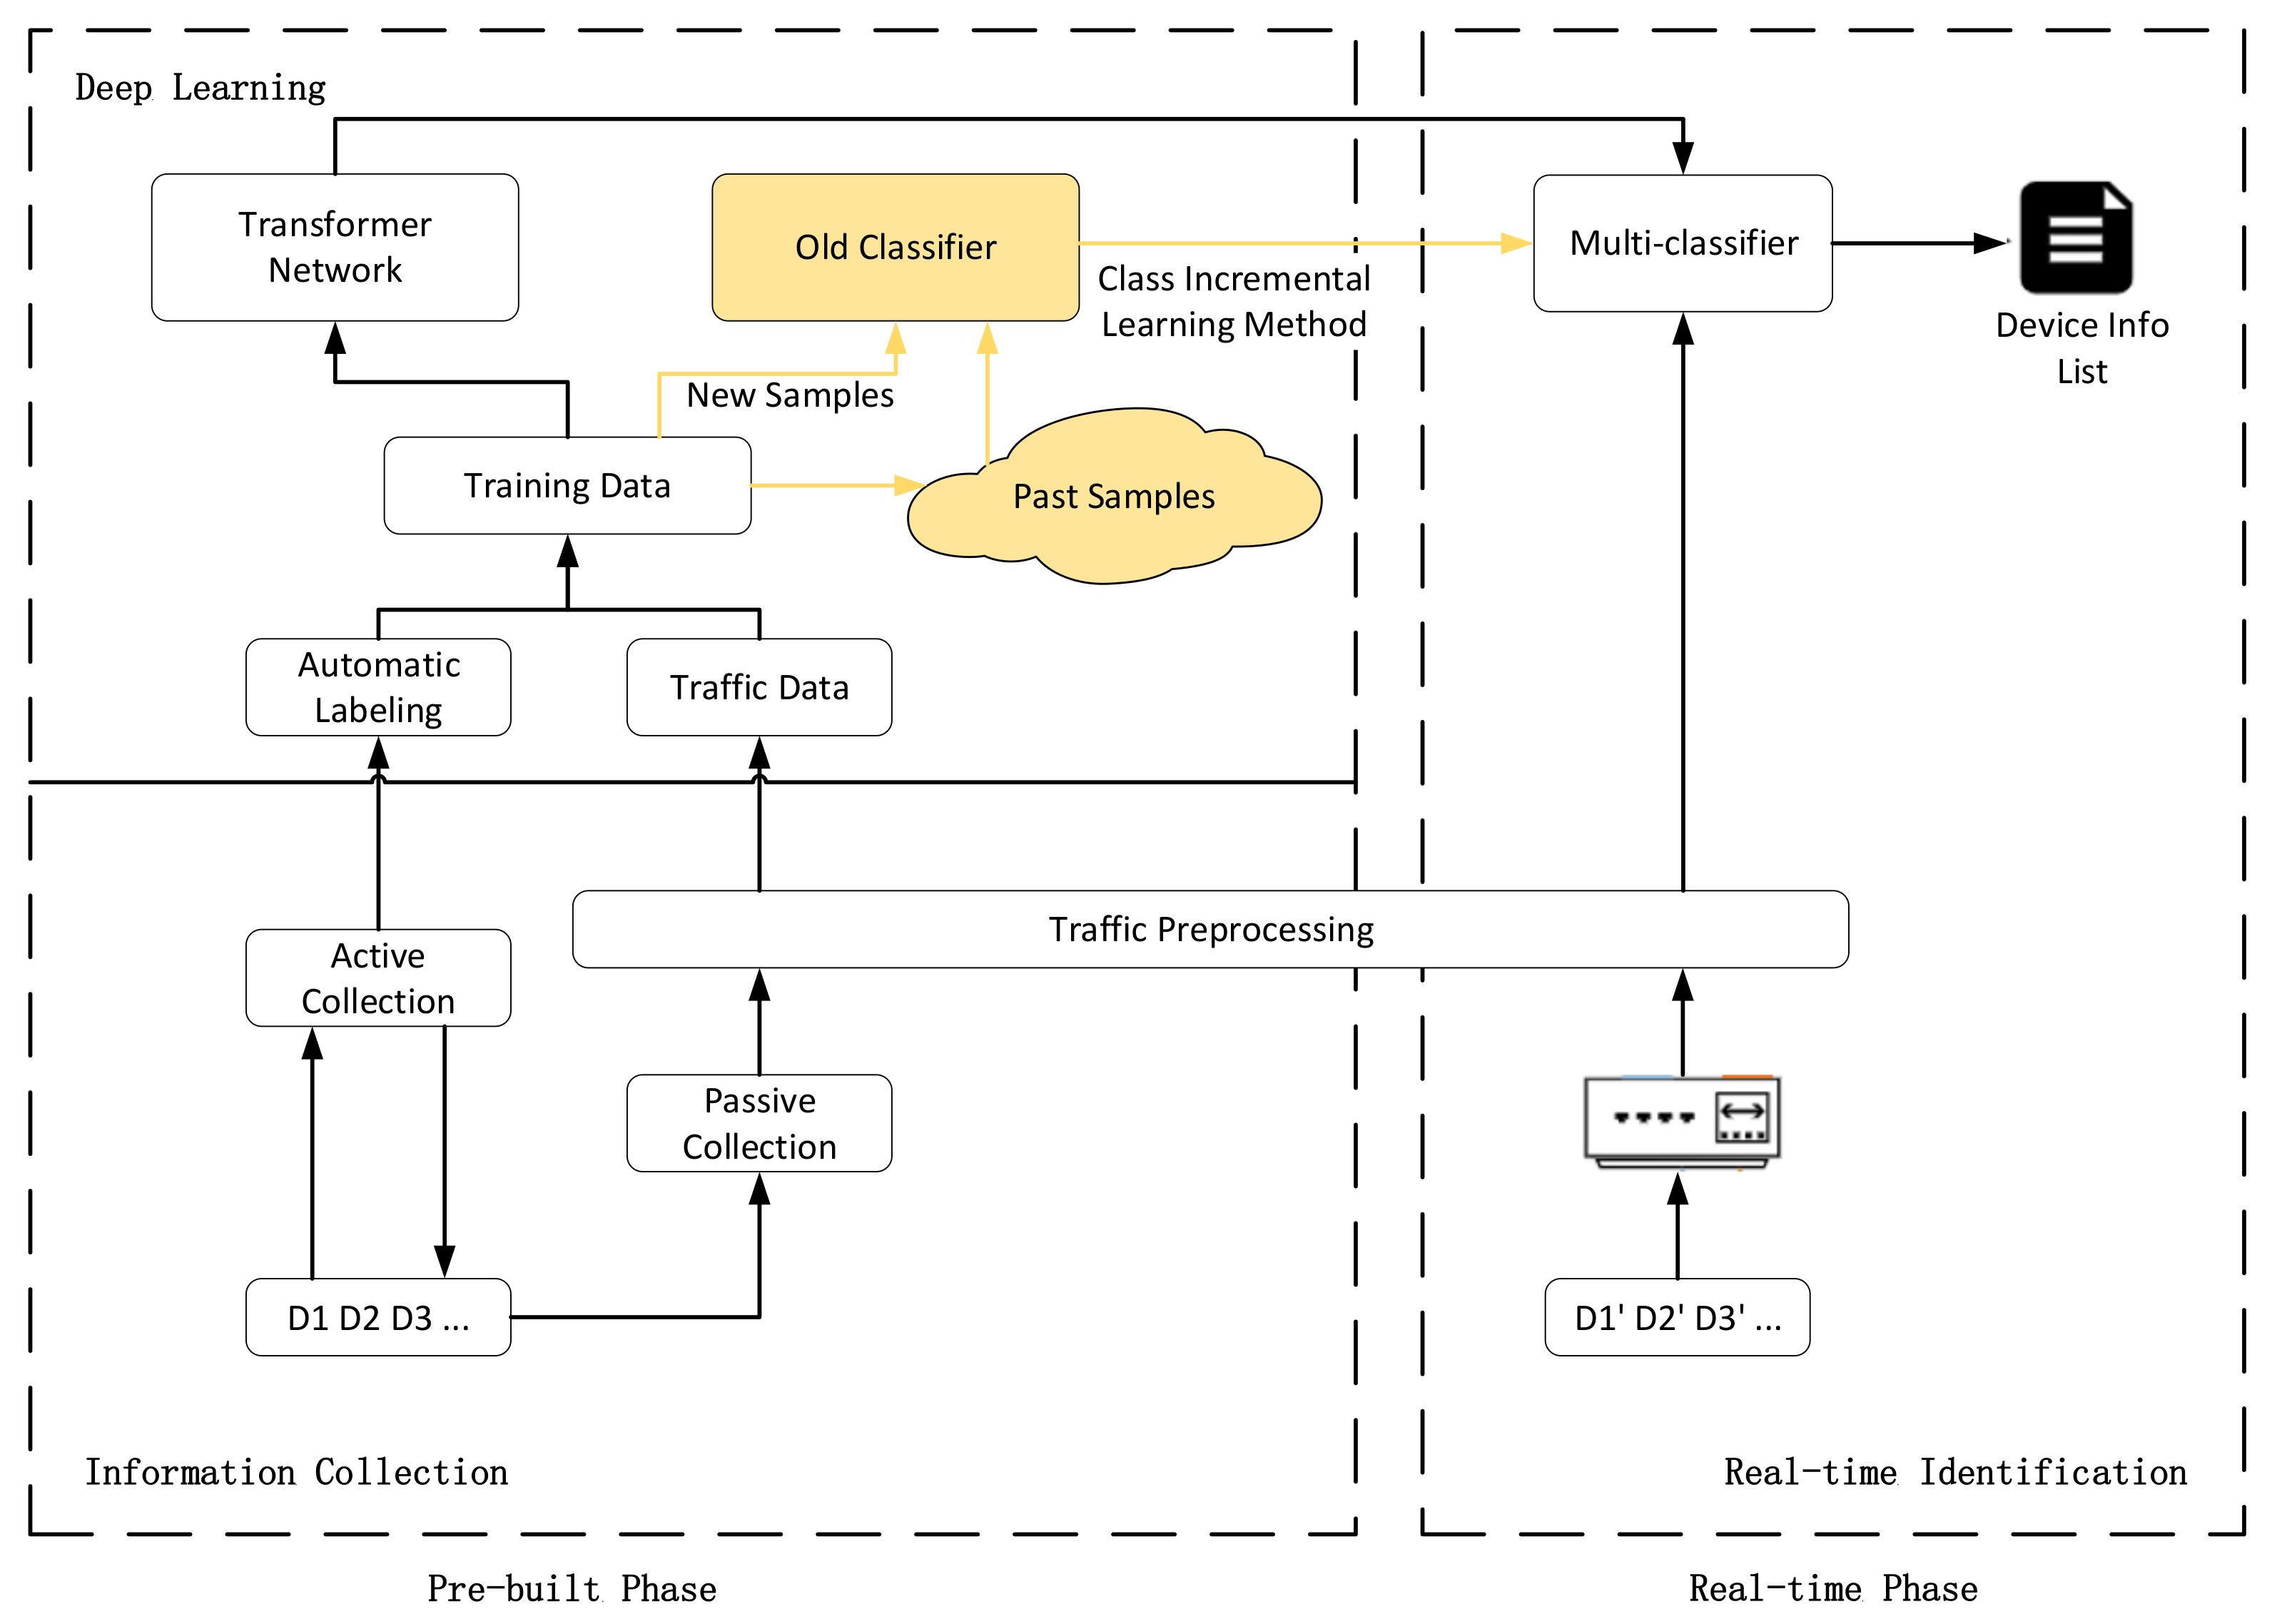
We propose IoT-Portrait, a system to automatically identify IoT devices using transformer network without manual labeling. In IoT-Portrait, we gather information on IoT devices using active scanning and passive traffic collection approaches and then automatically label training data with the collected device information. Furthermore, we leverage the transformer network to identify device characteristics from network traffic and generate a multi-classifier. Overall, we provide an end-to-end identification scheme based on the network traffic of devices. The system architecture is shown in Figure 3, with three modules, namely the device information collection module, deep learning module, and real-time identification module. The first two modules are used for collecting device data and training multi-classifier. The last module primarily works during the device identification phase.
The device information collection module runs in the early stage of the process. This module is responsible for passively collecting network traffic from various devices. For the IP information in traffic collected, we designed a comprehensive active scanning scheme to scan it. In this scheme, this module automatically obtains basic device information, such as the type of operating system and underlying hardware platform. Meanwhile, it can gather service data by scanning and then extract more detailed device information. The obtained information is used as the traffic’s label.
The deep learning module first performs traffic preprocessing, including traffic splitting, data cutting, and flow cleaning. Then, the preprocessed data are automatically matched with different labels using the information that was previously collected. Furthermore, this module leverages the transformer network to learn device features in network traffic and generates a multi-classifier. After training, the exemplars of training data will be saved in memory, and the generated classifier will be used to identify IoT devices. When new devices join the network, the old classifier will be retrained with the class incremental method using past samples and new devices’ data.
The real-time identification module collects the traffic data of devices from a central router in real time, performs preprocessing on the traffic data, and then sends the data to a classification model for device identification. The identification result is mapped to different devices, and then the system can obtain a detailed list of devices and their information in the domain. The list will be updated according to the identification result.
4.2. Active and Passive Information Collection
We analyze real-world IoT devices and traffic in Section 3. Unlike computers and servers, IoT devices are more diverse in vendor, type, OS, etc., so the volume of information that can be collected is quite huge. Since existing active scanning tools cannot obtain much information, we design a comprehensive active scanning scheme. Moreover, we leverage active intrusive scanning and passive collection to gather IoT device information as accurately as possible.
For passive collection, we collect device traffic through a central router. Then, the traffic is forwarded to the deep learning module to train the classifier. We use dumpcap [24], a tool for network traffic dumping, to collect packets of IoT devices from the router and store them together. In the system pre-build phase, we need to collect as much device traffic as possible.
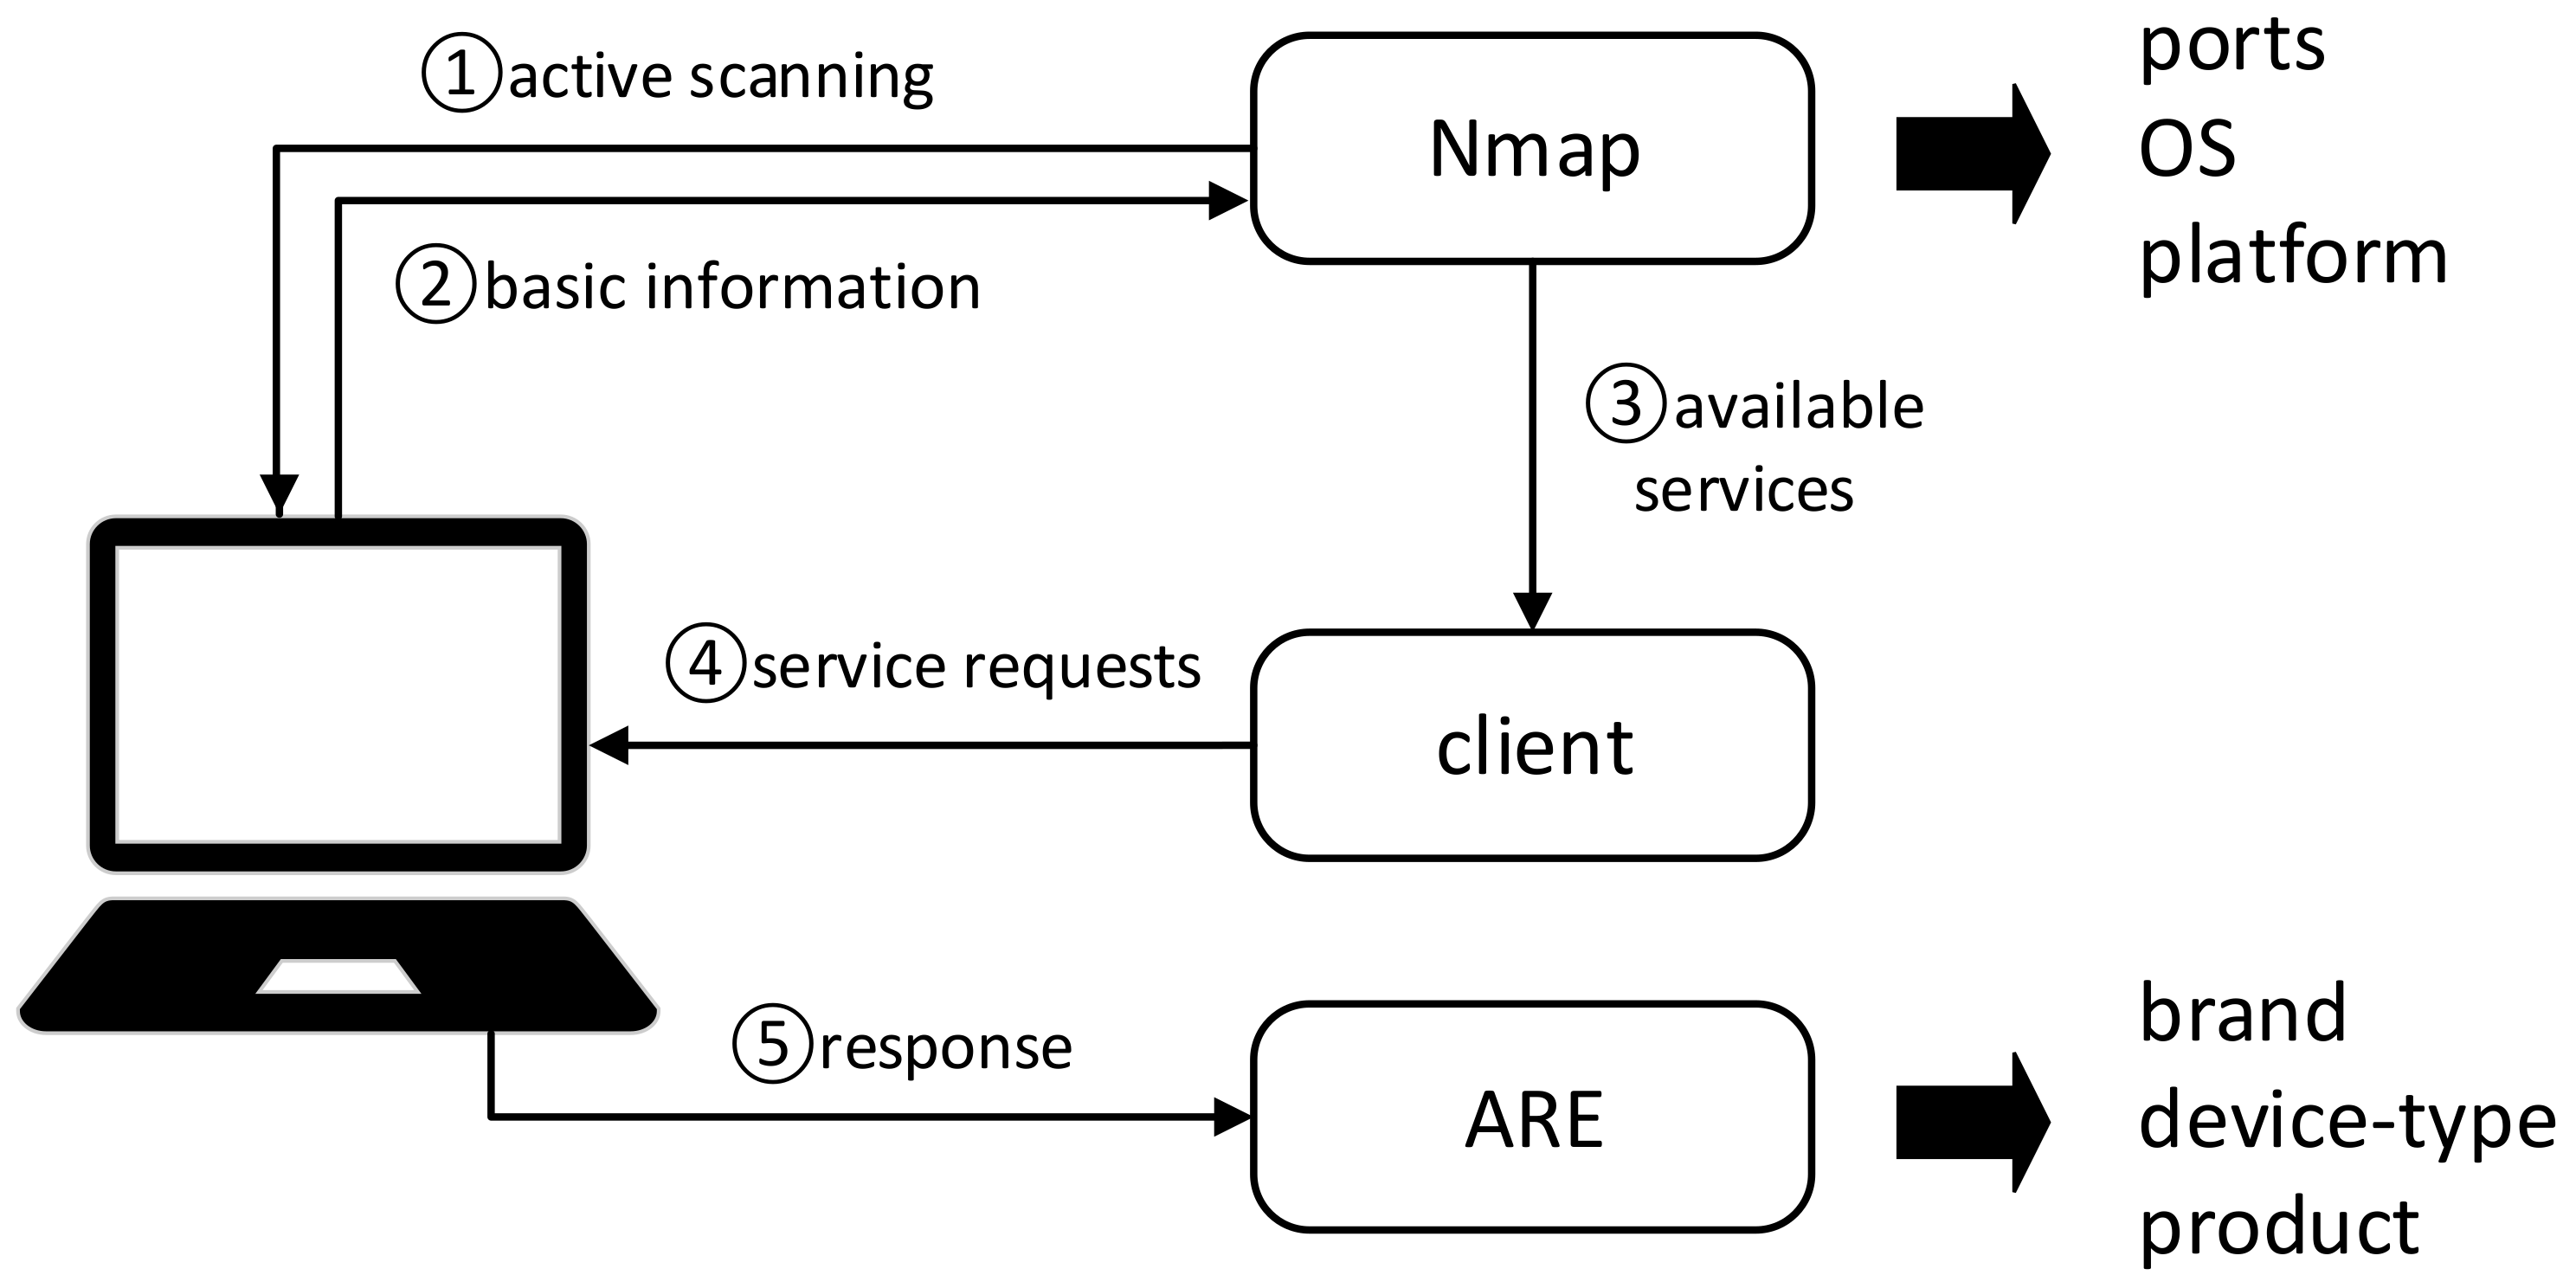
For active collection, the device information is jointly obtained by Nmap [18], ARE [21], and cURL [25]. As shown in Figure 4, we use Nmap to perform routine scanning of the IP obtained from the collected traffic. This will collect basic information about the corresponding device. Then, we extract service-related information from the basic information obtained. After this, we simulate a client using cURL to send requests to obtain the responses of those services and forward the response to ARE for further analysis to generate richer device information like its manufacturer. The relevant information obtained from the devices will be saved, used as the traffic’s label, and then displayed to users in the real-time identification phase.
However, the information collected by the active scanning may not be sufficient since closing or blocking most ports is quite common in IoT devices. For those devices that active collection only collects fuzzy operating system information, we should label them manually.
4.3. Multi-Classifier Training
The analysis of device traffic behaviors in Section 3 demonstrates the possibility of utilizing traffic to achieve device recognition. Most of the existing works manually select the most critical centralized features [14] to classify network traffic. In this work, we leverage the transformer network to identify IoT devices, which can significantly reduce the complexity of manual feature selection. The information to distinguish IoT devices mainly includes protocols, communication targets, and timing statistics (usually the periodicity of messages). Compared with existing solutions that manually extract and convert the above information into structured feature vectors, our deep learning solution will perform the above steps with reduced manual intervention on the original information.
4.3.1. Data Preprocessing
Before the training, we need to preprocess the traffic in three steps: traffic splitting, data cutting, and flow cleaning. First, we use the IP address as the unique identifier to split network traffic. Second, according to the fixed structure of the traffic file, we can tailor the collected traffic data from Pcap files. We need to separate data packets, remove the extra packet headers, and convert them into the training format. Therefore, in the data-cutting phase, we use editcap [26] to cut the packet data and use tshark [27] to transform the data format. In order to prevent irrelevant information from causing interference with the classification results and ensure the accuracy of deep learning, the traffic needs to be cleaned. The source IP address is the basis for traffic file division, but on its own, it does not indicate the type of an IoT device, as does MAC address. In addition, the application payload is sometimes protected by encryption. Therefore, the source IP address, source MAC address, and application layer data are cleaned in this phase.
4.3.2. Data Sampling
In the actual training process, we need to specify the number of packets in each sample, so we divide each traffic file into samples, including the same number of packets. The sampling process can be modeled as a sliding window-based extraction from a large file consisting of continuous flow packets. Suppose the number of selected packets for each sample is n, and the total number of packets in the entire file is m (m is much larger than n). If the first packet in the file has an index of 1, then the first sample contains the 1st to the nth packets, sample 2 contains the 2nd to the th packets, and the last sample contains the th to the mth packets.
4.3.3. Training Data Generation
After the data preprocessing phase and data sampling phase, we obtained many samples, each sample contains a fixed number of consecutive packets, and each packet has a fixed length. Assume the number of consecutive packets is , and the length of each packet is . We generate the training data by converting the sample into a matrix, where 1 contains information on the packet number within 100ms, representing the packet rate, and other contains the data of the packet. The types of features involved are as follows:
- Some obviously important features obtained from the data packet. As analyzed in Section 3, there are distinguishable patterns between the traffic information of IoT devices and non-IoT devices, IoT devices and IoT devices (the IP and MAC addresses of the device’s communication endpoints, communication ports, and the use of protocols). In addition, the data packet length is also an important feature that data packets of different IoT devices may have different lengths.
- Other features obtained from the data packet. The data packet information (the version of IP, etc.) designed and used by each device may be different, and it is not easy for us to find the rules of this information. Therefore, we convert the information in the data packet within length into numbers and store them in the matrix.
- Calculated statistical characteristics of multiple packets. As analyzed in Section 3, IoT devices have regular communication patterns, so the traffic rate characteristic is also important. We count the number of packets within 100ms to represent the traffic rate of the device.
For the sample labeling, we use information such as product type and device category, collected through the device information collection module, as labels. Specifically, we extract the IP address from the data packet, and actively collect information based on this IP address. Afterward, the packet undergoes data preprocessing and data sampling, and the information obtained before is used as the label of this sample. If the collected information is sufficient, the samples will be automatically labeled. Otherwise, they need to be manually labeled. After labeling, the samples will be used as the training input of the transformer model.
4.3.4. Model Training
We use a hybrid architecture of the encoders of the transformer and a simple classifier based on softmax to train the model. There are two main reasons to use the transformer architecture. First, the traffic of the device is regular in time series, and both the transformer network and Recurrent Neural Network (RNN) can well mine the regularity of the features presented in the time series. Second, compared with RNN, which must be calculated in chronological order, the parallel processing mechanism of the transformer can bring higher computational efficiency and significantly speed up the training. In addition, RNN is prone to gradient explosion and gradient disappearance during training, which will affect the model training, while the transformer does not have such problems. The encoders of transformer contain six encoder layers, each of which consists of a self-attention layer and a fully connected layer. Through the transformer, we hope to find the characteristics of the adjacent packet groups. Furthermore, the output of the transformer layer is passed to the fully connected layer, and the softmax function is used to generate the corresponding probability that the sample corresponds to this label.
The purpose of each layer and the specific parameter settings are depicted as follows:
(1) Input layer: The size of the input layer is . For image data processing, the input usually has three dimensions. The first two dimensions contain image information, and the last one contains the number of channels, usually 3, indicating R, G, and B. However, our processed data are a two-dimensional matrix in which data packets are spliced into time series. Hence, the channel is 1, and we omit it.
(2) Transformer layer: In the input, we use a -dimensional vector to represent a packet. For the input sequence, the transformer uses positional encoding to record the packet order and self-attention mechanism to mine the relationship between different packet vectors. Since the attention computation involves a parameter calculated by , and is 8, is the vector dimension of embedding, which is . So we set the dimension of the packet vector as 32.
(3) Flattening: The flattening operation reduces the data dimension. The flattened one-dimensional data are then passed to the next layer.
(4) Dense layer: After the transformer layer, the next result is obtained through a fully connected layer. The size of units corresponds to the total class number.
(5) Softmax layer: The ultimate goal of the neural network is to classify. Hence, the classification result of the upper layer is optimized by softmax regression. The final result is a probability distribution for the classification.
After training the classifier, a few exemplars of samples per device will be stored in memory. When new devices join the network, data packet collection and traffic preprocessing should be performed again. Then, the multi-classifier will be retrained with stored samples and new device samples using the class incremental method. The detailed retraining process and class incremental method we use will be introduced in Section 4.5.
4.4. Runtime Device Identification
After training the model, a multi-classifier is generated. We need to perform device identification according to the IP range specified by the user. First, we collect real-time traffic data from the central router according to the specified IP range. These traffic packets will be arranged in chronological order and divided into individual Pcap files based on IP address. Then, the data will be preprocessed, including cleaning IP addresses, MAC addresses, and the application layer payload, and then fed to the multi-classifier for labeling. Suppose that Pcap file contains data packets of device . Since the data packets in will be cut into multiple samples and may be predicted as different labels , we take the most predicted label as the final device label as Equations (1) and (2). According to the relationship between labels and device information established in the first module, detailed information about the device is found and integrated to form a final device information result.
4.5. Class Incremental Learning Method
When a new device joins the network, we need to use all device samples to retrain the classification model. This will consume much time to retrain and requires much space to store all samples. At the same time, in real task scenarios, the past samples cannot be fully preserved due to issues such as privacy, data storage, and computing power limitations. To ensure the accuracy of device identification and less training time, we use a little storage space to save exemplars of old classes and use the Fine Tuning with Distillation Loss (FTDL) method to retrain the old classifier.
The FTDL method adds the distillation loss into the original cross-entropy loss function. When training the new model, the distillation loss will calculate the discrepancy in the output logits between the old model and the new model, which will make the predictions of the new model as close as possible to that of the old model. Compared with the Fine Tuning (FT) method which preserves the knowledge learned from the old data by fixing the parameters of the old model and learns new knowledge by retraining the dense layer, the FTDL method uses distillation loss [28,29] to retrain the classifier and can restore the prediction results of the old model to the greatest extent while learning new data. Compared with the Multiple Binary Classifiers (MBCs) [30], which train multiple binary classifiers that each class i has a corresponding binary classifier , the FTDL method only trains one multi-classifier and retrains it when necessary. Although the MBC method does not need to retrain existing classifiers and just train a new binary classifier for the new device, the cost of the memory and prediction time of the FTDL method is much less than the MBC method.
Suppose that we store a total of samples, the classifier can currently classify categories, and new devices join the network. We use distillation loss to retain old knowledge, and the loss function is shown in Equation (3). Suppose that the output of the old model can be computed by and that of the new model corresponds to , and represents the value corresponding to class y in the output logits of the old model of . The value of is 1 when the true label of sample i is y and 0 when not. For a new class sample, the corresponding label is a vector like , in which the class number of this sample corresponds to 1 and others correspond to 0. For exemplars of old classes, we predict these data through the old model, expand the dimension of output logits to , and regard the result as labels instead of the class number. In this way, we can restore the prediction results of the old model to the greatest extent while learning new data.
After training the new model, we will randomly select exemplars for each class and store them in memory.
5. Experimental Results and Analysis
In this section, we present our experimental results on the performance of IoT-Portrait.
5.1. Device Identification of Lab Environment
We built a small-scale smart home scene of six IoT devices: three smart cameras, two central controller devices, and a smart light. These devices are all connected to a central router via WiFi. We used the information collection module to label these six devices automatically. After collecting, the Os information and available services of 5 devices are obtained. Furthermore, in a further step, the type and vendor information of 2 devices are obtained after using ARE.
We manually labeled the missing device information and collected traffic data for each device. All the devices operate normally during the traffic collection phase, and none perform frequent shutdown or startup operations. To complete the collection, all devices run for three consecutive days. In the model training phase, we selected 31 bytes for each packet of 20 packets as the initial setup. The training and verification data are selected from the previous two days, with a ratio of 6:4. The test data are selected from traffic on the third day, and the prediction accuracy is 99.5%. Compared with the recognition rate of information search, when the network behavior among devices is sufficiently distinguishable, the passive solution using traffic behavior-based identification can address the limitation of less openness of IoT devices compared with the active scanning method.
5.2. Device Identification of Large Scale
To further prove the effectiveness of the transformer model, we made another performance evaluation on the IoT Trace dataset [22] with more types of devices and a more comprehensive data volume. In the IoT Trace device network dataset provided by UNSW, there are 21 IoT devices belonging to different major categories. This dataset’s amount of single-day data varies from 61 MB to 2 GB and is 365 MB on average.
We observed that six of the IoT devices have too little daily traffic. Hence, we abandoned those six devices for their uniform amount of packets and finally selected the remaining 15 devices for the following experiment. The list of IoT devices we used is shown in Table 2. In our experiment, the size of the training is set to 128, and the epoch is set to 20. After each epoch, the training accuracy and loss of both the test and validation sets can be obtained. This experiment’s training, verification, and test sets are divided based on a ratio of 6:2:2. For input data specification, we set the packet length to 31 bytes and the number of packets to 20. After training, we used the epoch number as the variable and plotted the training process of our model with accuracy and loss.
As shown in Figure 5 and Figure 6, as the epoch increases, the model’s overall accuracy continues to improve, and the loss rate decreases. Finally, both of them converge and become stable. In addition, since the target is to evaluate the multi-classifier, we separately test the data of all 15 devices and generate a confusion matrix, shown in Figure 7. The confusion matrix indicates a good recognition result since most of the elements are gathered on the diagonal of the matrix, and all devices have an accuracy of over 96%. Even though there are devices of the same type in the dataset that may have similar network behaviors, IoT-Portrait can still identify them well.
5.3. Impact of the Number of Packets
For data sampling, we can choose a different number of packets. Below, we evaluate its impact on device identification. We use two indicators in the following experiment: accuracy (acc) and . The accuracy acc is computed as:
In addition, the recall is calculated as follows:
The precision is computed as follows:
The value is the harmonic mean of precision and recall, which is a comprehensive indicator of the two:
Since the model is a multi-classifier, to obtain , we take each of the 15 categories as positive samples in turn and the other 14 categories as negative samples. The value is then calculated as an average.
The experimental results with the number of packets as the variable are shown in Figure 8. When the number of packets reaches 20, the prediction accuracy can reach 99%. The results show that the prediction accuracy will first increase and then decrease as the number of packets increases. We believe this is because the features in a single sample become complete as the number of packets increases, and when a sample contains a packet sequence that is too long, the model cannot obtain features in it well. Overall, the evaluation shows that the transformer model achieves a high prediction accuracy for device identification.
5.4. Impact of Class Incremental Learning Methods
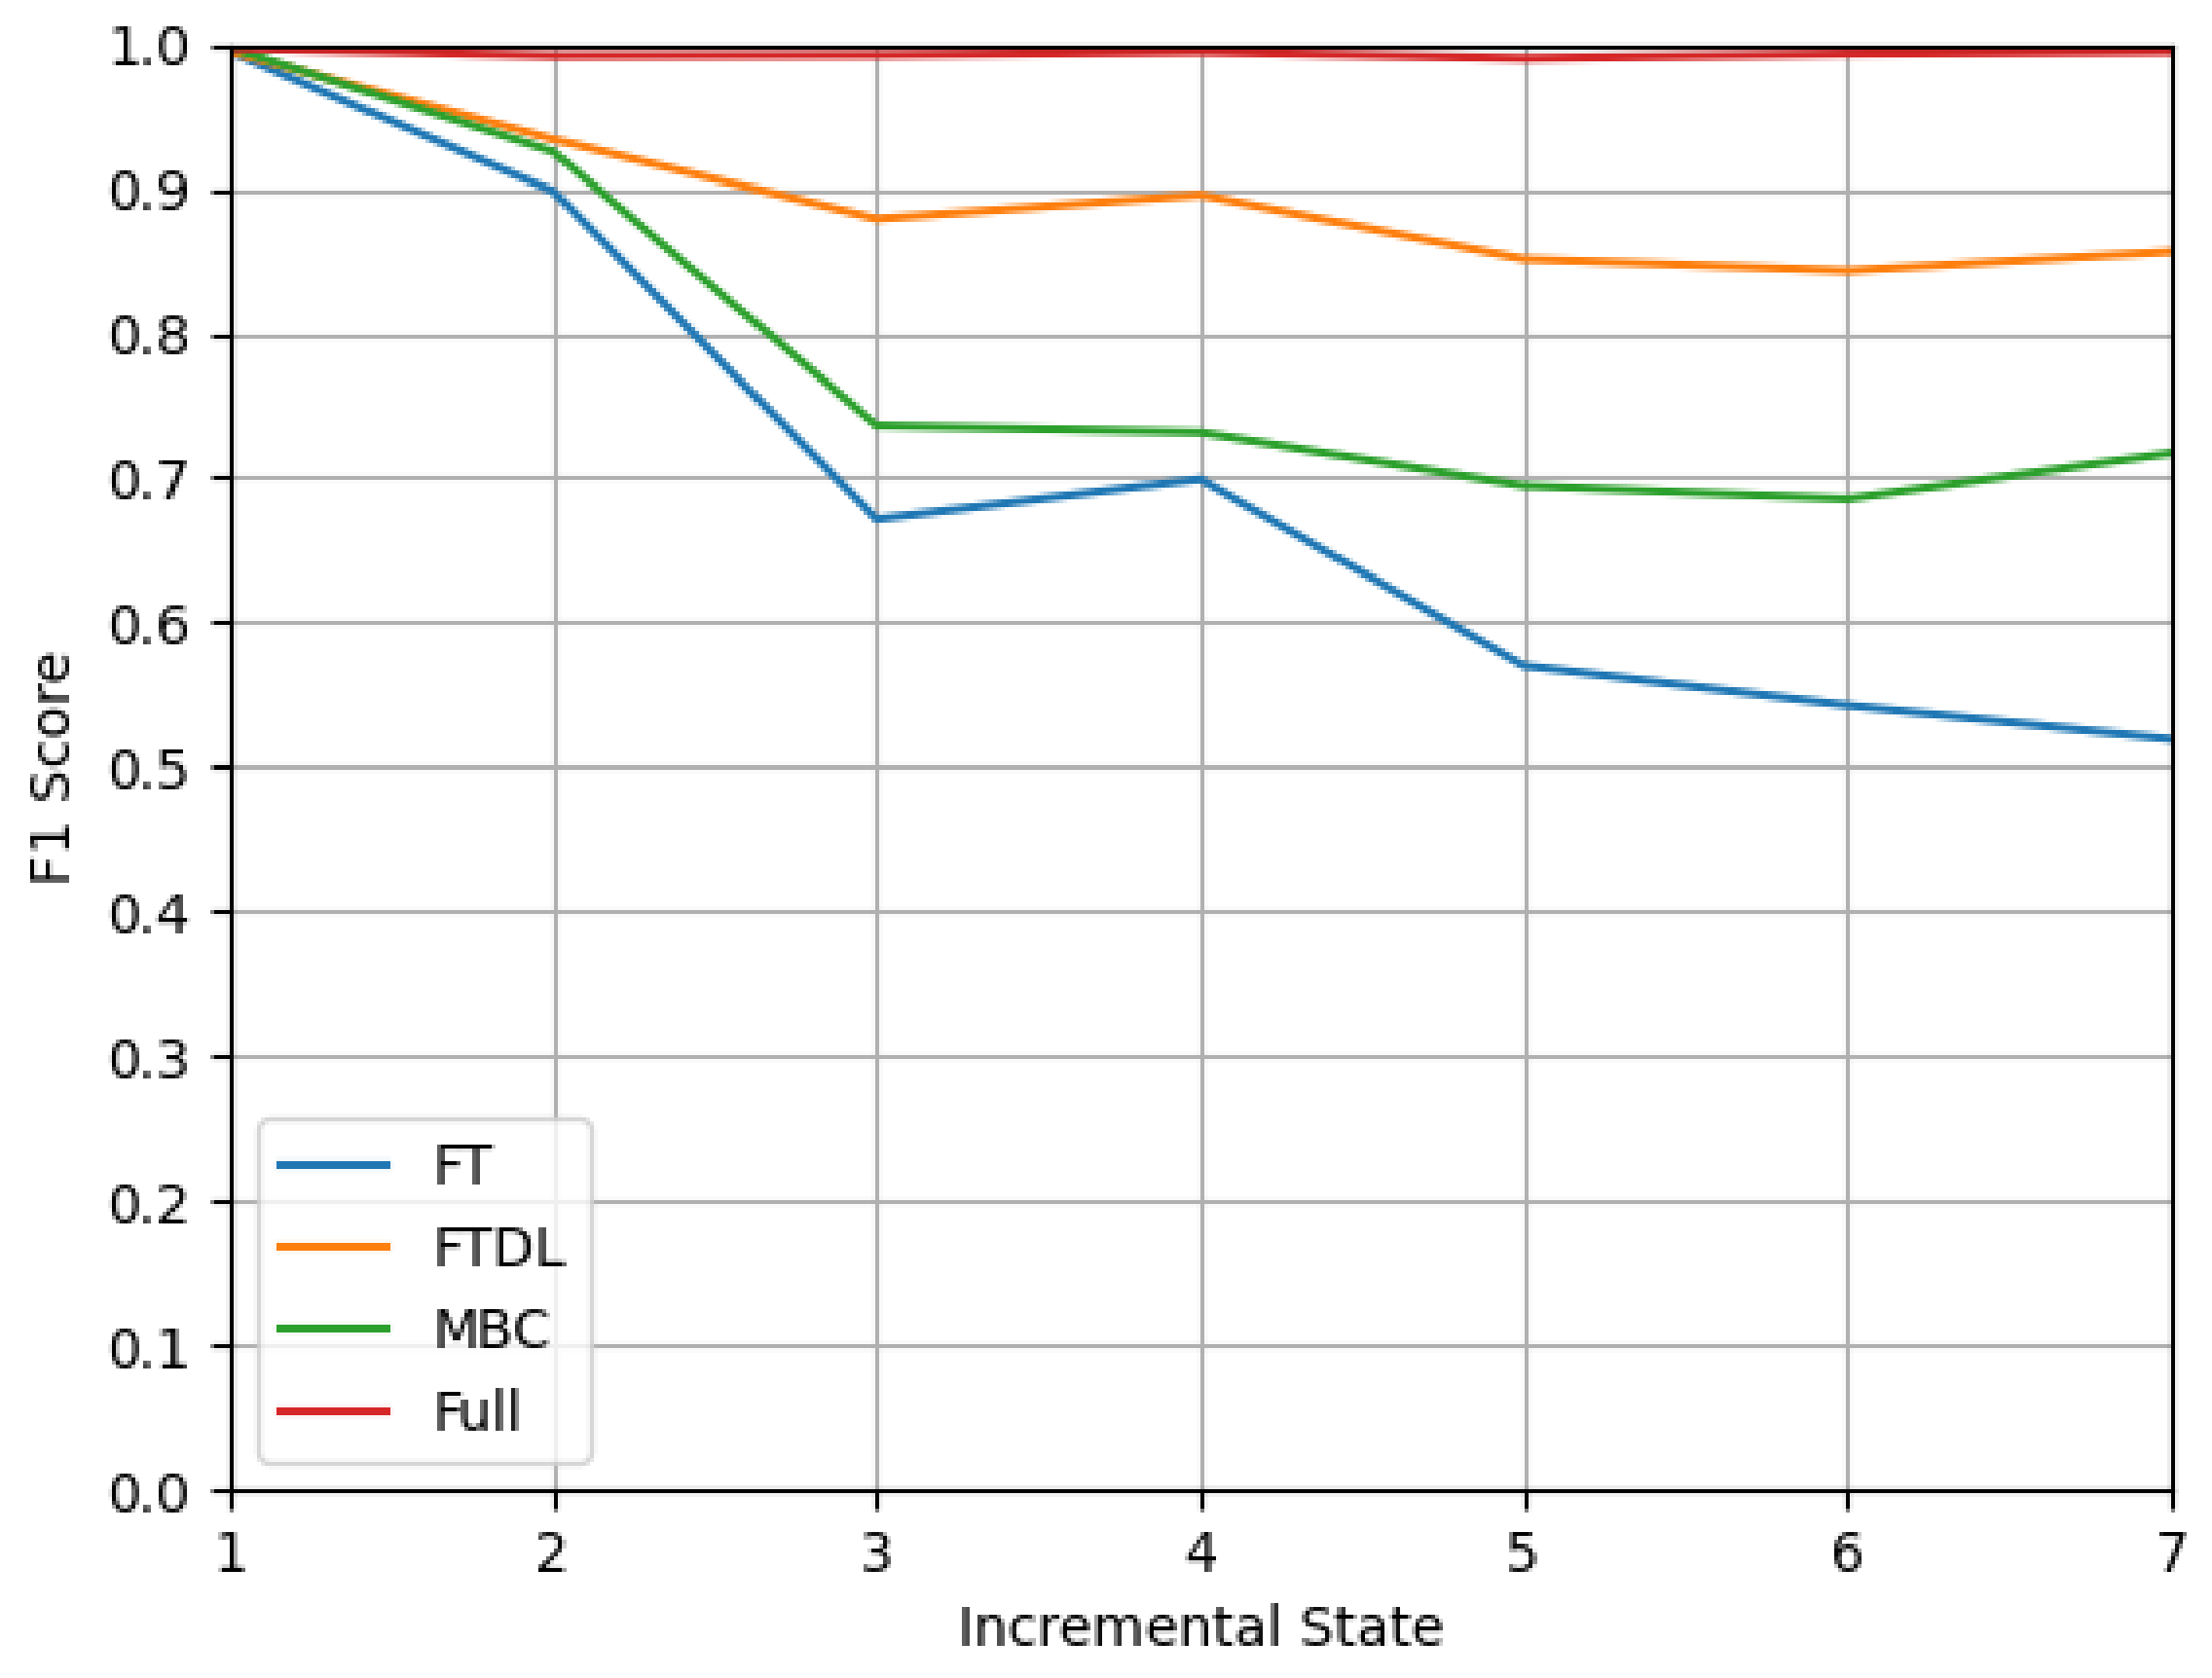
We divided the 15 categories of devices into eight states by setting the class number of the initial state to 3 and the class number of each incremental state to 2. For old exemplars selection, we selected 10,000 old class samples and stored them with no more than 2 MB of memory. We evaluate the effect of different class incremental methods applied to our transformer model based on the above settings. In addition, we provide Full, which is training a new model with all data available. After each state, we test the newly generated model with the total dataset. The experimental result of accuracy is shown in Figure 9. Since the sample number of each device in the dataset we use is not the same, we provide the result of the F1 score in Figure 10 to see the model effect more intuitively.
As shown in Figure 9 and Figure 10, with all data available, the accuracy of Full remains at over 99% as an upper-bound performance. Among the three incremental learning methods, FTDL is the best at learning new knowledge while retaining knowledge of old classes, which still have an accuracy of over 85% after seven incremental states. This also demonstrates the effectiveness of knowledge distillation, that it can avoid old knowledge being forgotten by learning the prediction of the old model even with little old data available. Besides FTDL, MBC can maintain an accuracy of 70% after seven incremental states, but since MBC generates multiple binary classifiers, it requires a longer prediction time. The top-1 accuracy and F1 Score appear to fluctuate up and down because the sample size of the new class is large in the fourth incremental state, and this makes the values higher. It is worth noting that although the accuracy of the FT method eventually drops to 50%, by choosing the most predicted label of all samples of each device as the final predicted label, we can still successfully predict 86.7% of the device types.
The memory overhead in storing past samples and the prediction time of IoT-Portrait are shown in Table 3. If class incremental learning methods are not used, IoT-Portrait needs to spend 96.1 MB of memory space to store all training samples of 15 devices. Instead, 1.8 MB of memory space is needed to store 10,000 exemplars if class incremental methods are used. It is worth mentioning that the MBC method needs to spend more memory space to save all binary classifiers’ weights. When the number of identifiable devices increases, the models that need to be saved also increase, which will be a considerable overhead. The prediction time indicts the time predicting 10,000 samples. As we can see, the prediction time of , , and are about the same, while that of is very long because it needs to obtain the prediction results from 15 binary classifiers and then obtain the final result.
5.5. Compare to Other Works
In this section, we compare IoT-Portrait with other IoT device fingerprinting works in Table 4. As can be seen from Table 4, IoT-Portrait has a high device identification accuracy. These works usually do not discuss the process of labeling samples and default to manual labeling. However, manual labeling will be time-consuming as the types of devices increase. In addition, our active scanning and automatic labeling scheme can obtain more information than the device name to present to the network administrator. Moreover, these works do not consider the increase in devices, so when new devices join the network, they have to retrain the classification model using all old training data.
6. Limitations and Future Works
Our identification model relies on a stable network. If a system error occurs or the network status fluctuates, the traffic behavior of the device will change, which will affect the effect of device identification. Considering that network traffic may show diversity in natural conditions, such as network jitter in a short time, strategies that adapt to the natural diversity of network traffic need to be investigated to ensure the effectiveness of the identification model. For example, we can average the traffic data over a certain time interval. In the future, we can make more attempts at feature engineering to solve this problem.
There are many studies on class incremental learning. In this paper, we only compare the effects of three main methods applied to our model. In addition, there are some methods to learn new knowledge by expanding the model structure or adjusting model parameters. There is not much research on class incremental learning for IoT device identification, and we can continue to experiment in this area in the future.
7. Conclusions
In this paper, we design IoT-Portrait, an automatic IoT device identification framework based on a transformer. Compared with previous works, IoT-Portrait leverages an information acquisition scheme, combining both active and passive approaches to reduce the manual effort of labeling. In addition, IoT-Portrait uses a transformer neural network to mine potential features in the IoT device’s traffic. For the problem of catastrophic forgetting, IoT-Portrait applies the class incremental learning method to retrain the model when new devices join the network. To the best of our knowledge, IoT-Portrait is the first work that applies the class incremental learning method to IoT device identification. The experimental results show that IoT-Portrait achieves high accuracy for IoT device identification and is well resistant to catastrophic forgetting.
Our results show that IoT devices can be well identified through traffic information, and also verify the feasibility of class incremental learning in IoT device identification. We will perform more research to overcome the interference of network fluctuations on IoT device identification and attempt more class incremental learning methods in the future.
Author Contributions
Conceptualization, J.Z. and J.L.; methodology, J.Z. and J.L.; software, J.Z. and J.L.; validation, J.Z.; formal analysis, J.L.; investigation, J.Z. and J.L.; resources, J.L.; data curation, J.L.; writing—original draft preparation, J.L.; writing—review and editing, J.Z.; visualization, J.Z.; supervision, J.W.; project administration, J.W.; funding acquisition, J.W. All authors have read and agreed to the published version of the manuscript.
Funding
This work is sponsored by the National Natural Science Foundation of China granted No. 61872430, 61402342, 61772384, the National Basic Research Program of China 973 Program granted No. 2014CB340601, the Foundation of Science and Technology on Information Assurance Laboratory (No. KJ-17-103), and the Hubei Province Key Research and Development Program under Grants 2020BAA003, 2021BAA027.
Data Availability Statement
Not applicable.
Acknowledgments
The authors express great appreciation to Yong Zhuang, Yiming Qin, and Deng Zhang.
Conflicts of Interest
The authors declare no conflict of interest.
Abbreviations
The following abbreviations are used in this manuscript:
| IoT | Internet of Things |
| OS | Operating System |
| HTTP | Hypertext Transfer Protocol |
| SSH | Secure Shell Protocol |
| FTP | File Transfer Protocol |
| HTML | HyperText Markup Language |
| LSTM | Long short-term memory |
| TCP | Transmission Control Protocol |
| SDN | Software-Defined Networking |
| IP | Internet Protocol |
| MAC | Media Access Control |
| PC | Personal Computer |
| HTTPS | Hypertext Transfer Protocol Secure |
| UDP | User Datagram Protocol |
| DNS | Domain Name System |
| NTP | Network Time Protocol |
| MDNS | Multicast DNS |
| LAN | Local Area Network |
| ICMP | Internet Control Message Protocol |
| RNN | Recurrent Neural Network |
| UNSW | University of New South Wales |
| FT | Fine Tune |
| FTDL | Fine Tune with Distillation Loss |
| MBC | Multiple Binary Classifiers |
References
- Statista Research Department. Number of IoT Devices 2015–2025. 2016. Available online: https://www.statista.com/statistics/471264/iot-number-of-connected-devices-worldwide/things-security-report-q3-2015/ (accessed on 1 February 2023).
- Apthorpe, N.; Reisman, D.; Feamster, N. A smart home is no castle: Privacy vulnerabilities of encrypted iot traffic. arXiv 2017, arXiv:1705.06805. [Google Scholar]
- Meidan, Y.; Bohadana, M.; Shabtai, A.; Guarnizo, J.D.; Ochoa, M.; Tippenhauer, N.O.; Elovici, Y. ProfilIoT: A machine learning approach for IoT device identification based on network traffic analysis. In Proceedings of the Symposium on Applied Computing, Marrakech, Morocco, 3–7 April 2017; pp. 506–509. [Google Scholar]
- Chen, Y.; Hu, W.; Alam, M.; Wu, T. Fiden: Intelligent fingerprint learning for attacker identification in the industrial Internet of Things. IEEE Trans. Ind. Inform. 2019, 17, 882–890. [Google Scholar] [CrossRef]
- Bezawada, B.; Bachani, M.; Peterson, J.; Shirazi, H.; Ray, I.; Ray, I. Iotsense: Behavioral fingerprinting of iot devices. arXiv 2018, arXiv:1804.03852. [Google Scholar]
- Miettinen, M.; Marchal, S.; Hafeez, I.; Asokan, N.; Sadeghi, A.R.; Tarkoma, S. Iot sentinel: Automated device-type identification for security enforcement in iot. In Proceedings of the 2017 IEEE 37th International Conference on Distributed Computing Systems (ICDCS), Atlanta, GA, USA, 5–8 June 2017; pp. 2177–2184. [Google Scholar]
- Radhakrishnan, S.V.; Uluagac, A.S.; Beyah, R. GTID: A technique for physical device and device type fingerprinting. IEEE Trans. Dependable Secur. Comput. 2014, 12, 519–532. [Google Scholar] [CrossRef]
- Acar, A.; Fereidooni, H.; Abera, T.; Sikder, A.K.; Miettinen, M.; Aksu, H.; Conti, M.; Sadeghi, A.R.; Uluagac, S.; Uluagac, S. Peek-a-boo: I see your smart home activities, even encrypted! In Proceedings of the 13th ACM Conference on Security and Privacy in Wireless and Mobile Networks, Linz, Austria, 8–10 July 2020; pp. 207–218. [Google Scholar]
- Duan, C.; Gao, H.; Song, G.; Yang, J.; Wang, Z. ByteIoT: A practical IoT device identification system based on packet length distribution. IEEE Trans. Netw. Serv. Manag. 2021, 19, 1717–1728. [Google Scholar] [CrossRef]
- Aksoy, A.; Gunes, M.H. Automated iot device identification using network traffic. In Proceedings of the ICC 2019–2019 IEEE International Conference on Communications, Shanghai, China, 20–24 May 2019; pp. 1–7. [Google Scholar]
- Salman, O.; Elhajj, I.H.; Chehab, A.; Kayssi, A. A machine learning based framework for IoT device identification and abnormal traffic detection. Trans. Emerg. Telecommun. Technol. 2022, 33, e3743. [Google Scholar] [CrossRef]
- Bai, L.; Yao, L.; Kanhere, S.S.; Wang, X.; Yang, Z. Automatic device classification from network traffic streams of internet of things. In Proceedings of the 2018 IEEE 43rd Conference on Local Computer Networks, Chicago, IL, USA, 1–4 October 2018; pp. 1–9. [Google Scholar]
- Kotak, J.; Elovici, Y. Iot device identification using deep learning. In Proceedings of the 13th International Conference on Computational Intelligence in Security for Information Systems, Burgos, Spain, 16–18 September 2020; Springer International Publishing: Berlin/Heidelberg, Germany, 2021; Volume 12, pp. 76–86. [Google Scholar]
- Lopez-Martin, M.; Carro, B.; Sanchez-Esguevillas, A.; Lloret, J. Network traffic classifier with convolutional and recurrent neural networks for Internet of Things. IEEE Access 2017, 5, 18042–18050. [Google Scholar] [CrossRef]
- Dong, S.; Li, Z.; Tang, D.; Chen, J.; Sun, M.; Zhang, K. Your smart home cannot keep a secret: Towards automated fingerprinting of iot traffic. In Proceedings of the 15th ACM Asia Conference on Computer and Communications Security, Taipei, Taiwan, 5–9 October 2020; pp. 47–59. [Google Scholar]
- Vaswani, A.; Shazeer, N.; Parmar, N.; Uszkoreit, J.; Jones, L.; Gomez, A.N.; Kaiser, L.; Polosukhin, I. Attention is all you need. In Proceedings of the Advances in Neural Information Processing Systems 30: Annual Conference on Neural Information Processing Systems 2017, Long Beach, CA, USA, 4–9 December 2017. [Google Scholar]
- De Lange, M.; Aljundi, R.; Masana, M.; Parisot, S.; Jia, X.; Leonardis, A.; Slabaugh, G.; Tuytelaars, T. A continual learning survey: Defying forgetting in classification tasks. IEEE Trans. Pattern Anal. Mach. Intell. 2021, 44, 3366–3385. [Google Scholar]
- Lyon, G.F. Nmap Network Scanning: The Official Nmap Project Guide to Network Discovery and Security Scanning; Insecure.com LLC: Seattle, WA, USA, 2008; 468p. [Google Scholar]
- Bodenheim, R.C. Impact of the Shodan Computer Search Engine on Internet-Facing Industrial Control System Devices. Master’s Thesis, Air Force Institute of Technology Wright-Patterson AFB OH Graduate School of Engineering and Management, Dayton, OH, USA, 2014. [Google Scholar]
- Ribeiro, T.; Vala, M.; Paiva, A. Censys: A model for distributed embodied cognition. In Proceedings of the International Workshop on Intelligent Virtual Agents, Edinburgh, UK, 29–31 August 2013; Springer: Berlin/Heidelberg, Germany, 2013; pp. 58–67. [Google Scholar]
- Feng, X.; Li, Q.; Wang, H.; Sun, L. Acquisitional rule-based engine for discovering Internet-of-Things devices. In Proceedings of the 27th USENIX Security Symposium (USENIX Security 18), Baltimore, MD, USA, 15–17 August 2018; pp. 327–341. [Google Scholar]
- Sivanathan, A.; Gharakheili, H.H.; Loi, F.; Radford, A.; Wijenayake, C.; Vishwanath, A.; Sivaraman, V. Classifying IoT devices in smart environments using network traffic characteristics. IEEE Trans. Mob. Comput. 2018, 18, 1745–1759. [Google Scholar] [CrossRef]
- Sivanathan, A.; Sherratt, D.; Gharakheili, H.H.; Radford, A.; Wijenayake, C.; Vishwanath, A.; Sivaraman, V. Characterizing and classifying IoT traffic in smart cities and campuses. In Proceedings of the 2017 IEEE Conference on Computer Communications Workshops (INFOCOM WKSHPS), Atlanta, GA, USA, 1–4 May 2017; pp. 559–564. [Google Scholar]
- Dumpcap-The Wireshark Network Analyzer 3.0.0. Available online: https://www.wireshark.org/docs/man-pages/dumpcap.html (accessed on 1 February 2023).
- Curl. Available online: https://curl.se/ (accessed on 1 March 2023).
- Editcap-The Wireshark Network Analyzer 3.0.0. Available online: https://www.wireshark.org/docs/man-pages/editcap.html (accessed on 1 March 2023).
- Tshark-The Wireshark Network Analyzer 3.0.0. Available online: https://www.wireshark.org/docs/man-pages/tshark.html (accessed on 1 March 2023).
- Li, Z.; Hoiem, D. Learning without forgetting. IEEE Trans. Pattern Anal. Mach. Intell. 2017, 40, 2935–2947. [Google Scholar] [CrossRef] [PubMed] [Green Version]
- Rebuffi, S.A.; Kolesnikov, A.; Sperl, G.; Lampert, C.H. icarl: Incremental classifier and representation learning. In Proceedings of the IEEE Conference on Computer Vision and Pattern Recognition, Honolulu, HI, USA, 21–26 July 2017; pp. 2001–2010. [Google Scholar]
- Belouadah, E.; Popescu, A. DeeSIL: Deep-shallow incremental learning. In Proceedings of the European Conference on Computer Vision (ECCV) Workshops, Munich, Germany, 8–14 September 2018. [Google Scholar]
Figure 1.
The packet rate statistics of SmartThings Hub.

Figure 2.
The packet rate statistics of NetGear Station.

Figure 3.
The system overview of IoT-Portrait. The orange part represents the process of retraining the classifier when a new device joins the network.
Figure 3.
The system overview of IoT-Portrait. The orange part represents the process of retraining the classifier when a new device joins the network.

Figure 4.
The process of active and passive devices information collection.

Figure 5.
The accuracy of training and verification sets.

Figure 6.
The loss of training and verification sets.

Figure 7.
The confusion matrix of 15 devices.

Figure 8.
The impact of the number of packets. When a sample contains a packet sequence with a length between 20 and 110, the classifier will achieve a high identification accuracy.
Figure 8.
The impact of the number of packets. When a sample contains a packet sequence with a length between 20 and 110, the classifier will achieve a high identification accuracy.

Figure 9.
The top-1 accuracy for different methods tested. Full means training a new model with all data available, and others represent different class incremental learning methods.
Figure 9.
The top-1 accuracy for different methods tested. Full means training a new model with all data available, and others represent different class incremental learning methods.

Figure 10.
F1 score for different methods tested. Full means training a new model with all data available, and others represent different class incremental learning methods.
Figure 10.
F1 score for different methods tested. Full means training a new model with all data available, and others represent different class incremental learning methods.


Table 1.
The network behavior analysis results.
| ID | Device Name | # of IPs | Server Ports |
|---|---|---|---|
| 1 | SmartThings Hub | 12 | TCP 433 |
| 2 | NetGear Station | 21 | UDP 10001, TCP 80 |
| 3 | WoShida Cam | 4 | TCP 44730 |
| 4 | Xiaobai Cam | 6 | UDP 32100, UDP 13978 |
| 5 | Philips Hue | 4 | TCP 80, TCP 443 |
Table 2.
The list of IoT devices used in the experiment includes not only different types of devices but also devices of the same type from different manufacturers.
Table 2.
The list of IoT devices used in the experiment includes not only different types of devices but also devices of the same type from different manufacturers.
| IoT Device | MAC Address |
|---|---|
| Amazon Echo | 44:65:0d:56:cc:d3 |
| Belkin Wemo Motion Sensor | ec:1a:59:83:28:11 |
| Belkin Wemo Switch | ec:1a:59:79:f4:89 |
| Dropcam | 30:8c:fb:2f:e4:b2 |
| HP Printer | 70:5a:0f:e4:9b:c0 |
| Netatmo Weather Station | 70:ee:50:03:b8:ac |
| Netatmo Welcome | 70:ee:50:18:34:43 |
| PIX-STAR Photo-frame | e0:76:d0:33:bb:85 |
| Samsung SmartCam | 00:16:6c:ab:6b:88 |
| Smart Things | d0:52:a8:00:67:5e |
| TP-Link Day Night Cloud Camera | f4:f2:6d:93:51:f1 |
| TP-Link Smart Plug | 50:c7:bf:00:56:39 |
| Triby Speaker | 18:b7:9e:02:20:44 |
| Withings Smart Baby Monitor | 00:24:e4:11:18:a8 |
| Withings Smart Scale | 00:24:e4:1b:6f:96 |
Table 3.
The memory cost and prediction time of different methods.
| Method | Number of Samples | Storage Memory (MB) | Prediction Time (s) |
|---|---|---|---|
| Full | 395,037 | 96.1 | 15 |
| FT | 10,000 | 1.8 | 16 |
| FTDL | 10,000 | 1.8 | 15 |
| MBC | 10,000 | 1.8 | 251 |
Disclaimer/Publisher’s Note: The statements, opinions and data contained in all publications are solely those of the individual author(s) and contributor(s) and not of MDPI and/or the editor(s). MDPI and/or the editor(s) disclaim responsibility for any injury to people or property resulting from any ideas, methods, instructions or products referred to in the content. |
© 2023 by the authors. Licensee MDPI, Basel, Switzerland. This article is an open access article distributed under the terms and conditions of the Creative Commons Attribution (CC BY) license (https://creativecommons.org/licenses/by/4.0/).
Share and Cite
MDPI and ACS Style
Wang, J.; Zhong, J.; Li, J. IoT-Portrait: Automatically Identifying IoT Devices via Transformer with Incremental Learning. Future Internet 2023, 15, 102. https://doi.org/10.3390/fi15030102
AMA Style
Wang J, Zhong J, Li J. IoT-Portrait: Automatically Identifying IoT Devices via Transformer with Incremental Learning. Future Internet. 2023; 15(3):102. https://doi.org/10.3390/fi15030102
Chicago/Turabian StyleWang, Juan, Jing Zhong, and Jiangqi Li. 2023. "IoT-Portrait: Automatically Identifying IoT Devices via Transformer with Incremental Learning" Future Internet 15, no. 3: 102. https://doi.org/10.3390/fi15030102
Note that from the first issue of 2016, this journal uses article numbers instead of page numbers. See further details here.