Quality Attributes and In Vitro Bioequivalence of Different Brands of Amoxicillin Trihydrate Tablets


Abstract
:
1. Introduction
2. Materials and Methods
2.1. Materials
2.2. Methods
2.2.1. Weight Variation
2.2.2. Tablet Friability
2.2.3. Resistance to Crushing of Tablets
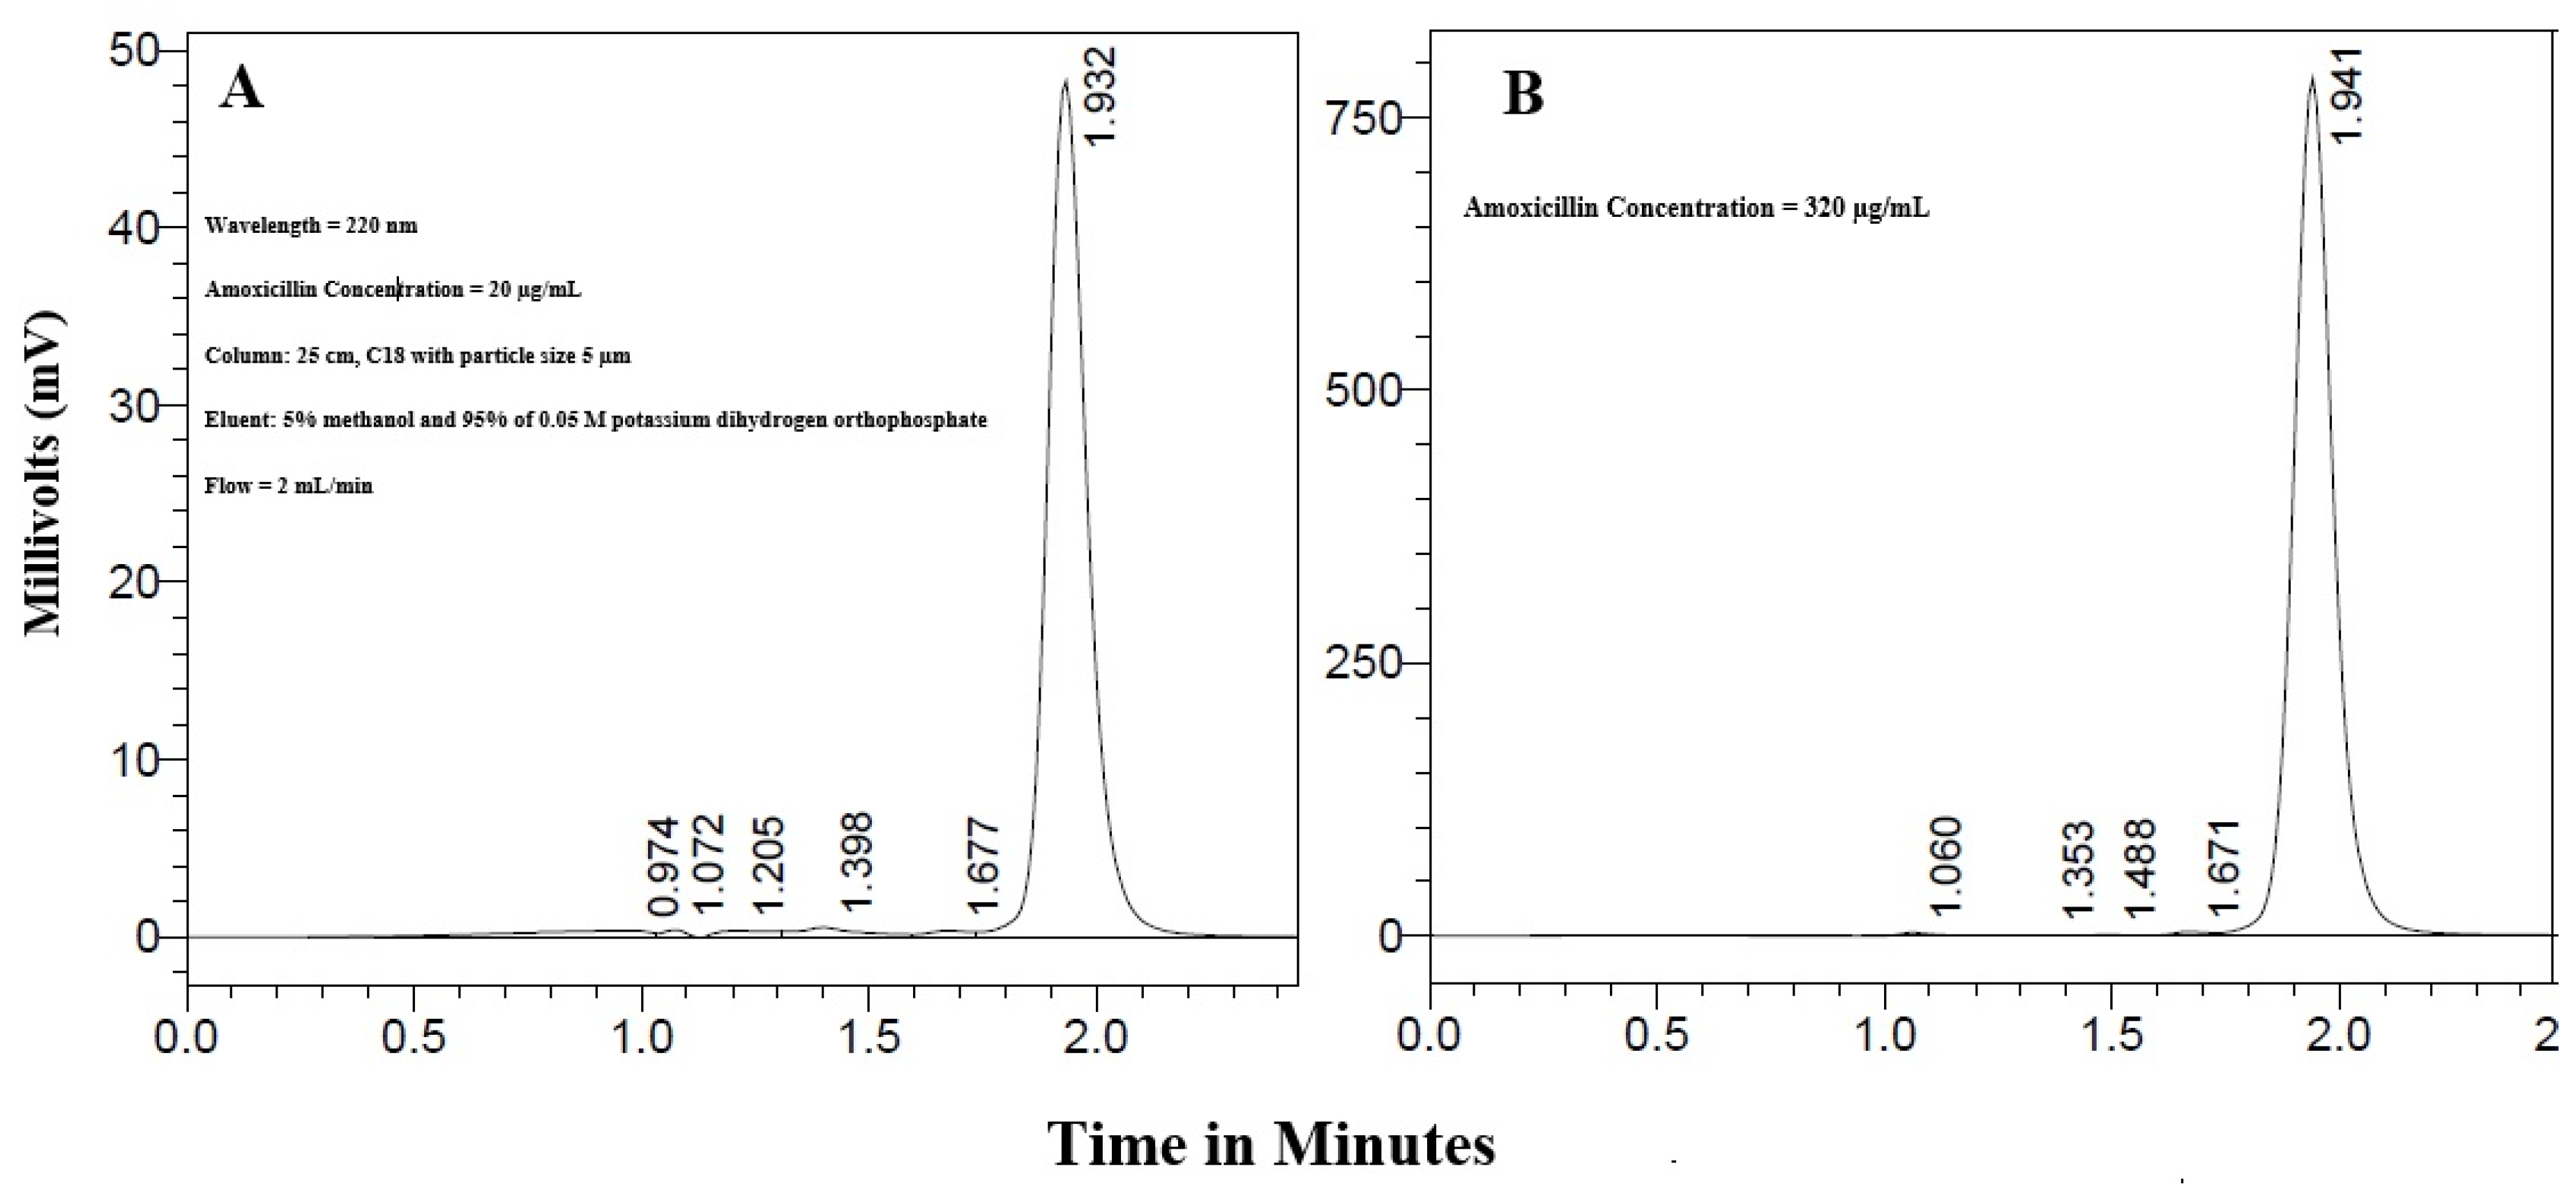
2.2.4. Calibration Curve and HPLC Analysis of Amoxicillin
2.2.5. Chemical Content of Amoxicillin
2.2.6. Dissolution of Amoxicillin Tablets
2.2.7. Statistical Analysis
3. Results
3.1. Physical Quality of Amoxicillin Tablets
3.2. Calibration Curve of Amoxicillin
3.3. Chemical Content of Amoxicillin Tablets
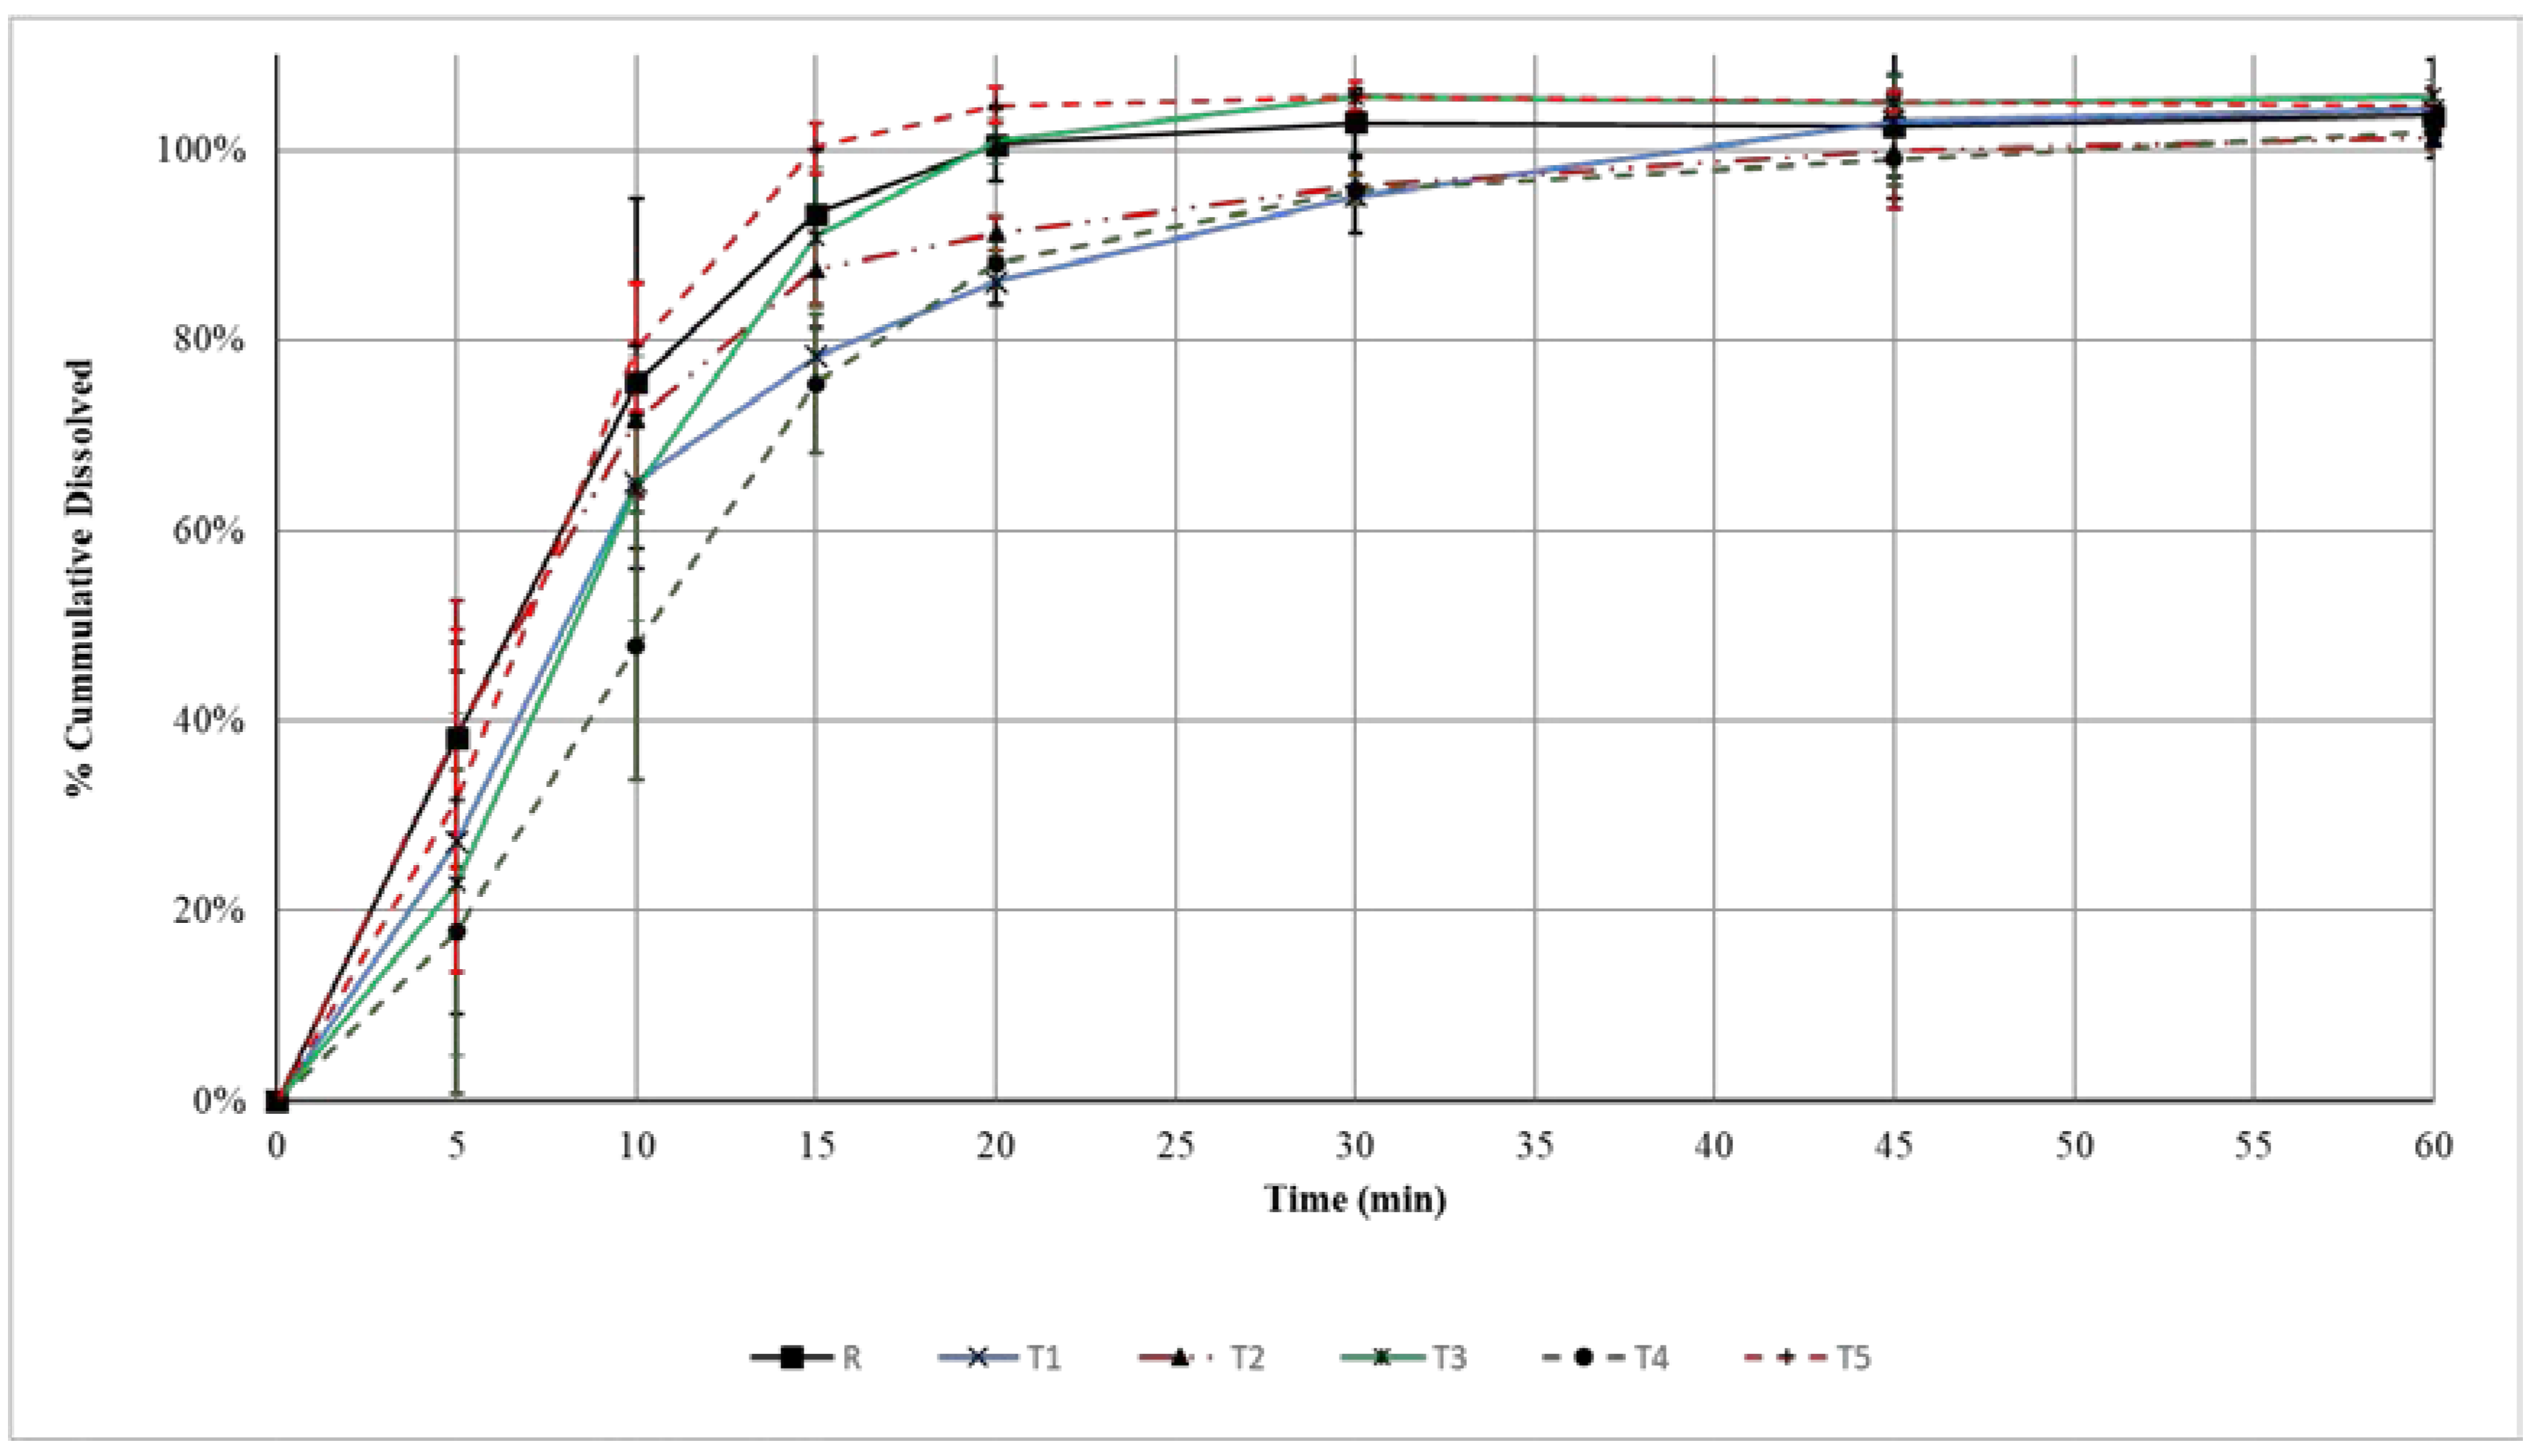
3.4. Dissolution of Amoxicillin Tablets
4. Discussion
5. Conclusions
Acknowledgments
Author Contributions
Conflicts of Interest
References
- Andrajati, R.; Tilaqza, A.; Supardi, S. Factors related to rational antibiotic prescriptions in community health centers in Depok City, Indonesia. J. Infect. Public Health 2017, 10, 41–48, Epub 10 March 2016. [Google Scholar] [CrossRef] [PubMed]
- Fallon, J. Could one of the most widely prescribed antibiotics amoxicillin/clavulanate “augmentin” be a risk factor for autism? Med. Hypotheses 2005, 64, 312–315, Epub 21 December 2004. [Google Scholar] [CrossRef] [PubMed]
- Patait, M.; Urvashi, N.; Rajderkar, M.; Kedar, S.; Shah, K.; Patait, R. Antibiotic prescription: An oral physician’s point of view. J. Pharm. Bioallied Sci. 2015, 7, 116–120, Epub 18 April 2015. [Google Scholar] [CrossRef] [PubMed]
- Medicines World Health Organization. 19th WHO Model List of Essential Medicines: World Health Organization. April 2015 [updated August 2015; cited 3 April 2017]. Available online: http://www.who.int/selection_medicines/committees/expert/20/EML_2015_FINAL_amended_AUG2015.pdf?ua=1 (accessed on 29 March 2017).
- Joint Formulary Committee. British National Formulary, 70th ed.; BMJ Group and Pharmaceutical Press: London, UK, 2015; pp. 482–483. ISBN 9780857112620 (ePDF). [Google Scholar]
- Rolinson, G.N. The history and background of Augmentin. South Afr. Med. J. 1982, 62, 3a–4a, Epub 28 July 1982. [Google Scholar]
- Riaz, H.; Krasuski, R.A. Should Physicians be Encouraged to use Generic Names and to Prescribe Generic Drugs? Am. J. Cardiol. 2016, 117, 1851–1852, Epub 18 May 2016. [Google Scholar] [CrossRef] [PubMed]
- Walensky, R.P.; Sax, P.E.; Nakamura, Y.M.; Weinstein, M.C.; Pei, P.P.; Freedberg, K.A.; Paltiel, A.D.; Schackman, B.R. Economic savings versus health losses: The cost-effectiveness of generic antiretroviral therapy in the United States. Ann. Intern. Med. 2013, 158, 84–92, Epub 16 January 2013. [Google Scholar] [CrossRef] [PubMed]
- Bartlett, J.A.; Muro, E.P. Generic and branded drugs for the treatment of people living with HIV/AIDS. J. Int. Assoc. Physicians AIDS Care (Chic. Ill: 2002) 2007, 6, 15–23, Epub 3 March 2007. [Google Scholar] [CrossRef] [PubMed]
- Dash, S.; Murthy, P.N.; Nath, L.; Chowdhury, P. Kinetic modeling on drug release from controlled drug delivery systems. Acta Pol. Pharm. 2010, 67, 217–223. [Google Scholar] [PubMed]
- Moore, J.W.; Flanner, H.H. Mathematical comparison of dissolution profiles. Pharm. Technol. 1996, 20, 64–74. [Google Scholar]
- Contin, M.; Alberghini, L.; Candela, C.; Benini, G.; Riva, R. Intrapatient variation in antiepileptic drug plasma concentration after generic substitution vs. stable brand-name drug regimens. Epilepsy Res. 2016, 122, 79–83, Epub 18 March 2016. [Google Scholar] [CrossRef] [PubMed]
- Byakika-Kibwika, P.; Lamorde, M.; Kalemeera, F.; D’Avolio, A.; Mauro, S.; Di Perri, G.; Ryan, M.; Mayanja-Kizza, H.; Khoo, S.; Back, D.; et al. Steady-state pharmacokinetic comparison of generic and branded formulations of stavudine, lamivudine and nevirapine in HIV-infected Ugandan adults. J. Antimicrob. Chemother. 2008, 62, 1113–1117, Epub 22 July 2008. [Google Scholar] [CrossRef] [PubMed]
- Al Ameri, M.N.; Nayuni, N.; Anil Kumar, K.G.; Perrett, D.; Tucker, A.; Johnston, A. The differences between the branded and generic medicines using solid dosage forms: In Vitro dissolution testing. Results Pharma Sci. 2012, 2, 1–8, Epub 1 January 2012. [Google Scholar] [CrossRef] [PubMed]
- Sandoval-Motta, S.; Aldana, M. Adaptive resistance to antibiotics in bacteria: a systems biology perspective. Wiley Interdiscip. Rev. Syst. Biol. Med. 2016, 8, 253–267, Epub 23 April 2016. [Google Scholar] [CrossRef] [PubMed]
- Cope, A.L.; Chestnutt, I.G. Inappropriate prescribing of antibiotics in primary dental care: Reasons and resolutions. Prim. Dent. J. 2014, 3, 33–37, Epub 11 February 2015. [Google Scholar] [CrossRef] [PubMed]
- Hassali, M.A.; Kamil, T.K.; Md Yusof, F.A.; Alrasheedy, A.A.; Yusoff, Z.M.; Saleem, F.; Al-Tamimi, S.K.; Wong, Z.Y.; Aljadhey, H.; Godman, B. General practitioners’ knowledge, attitude and prescribing of antibiotics for upper respiratory tract infections in Selangor, Malaysia: Findings and implications. Expert Rev. Anti-Infect. Ther. 2015, 13, 511–520, Epub 24 Fabruary 2015. [Google Scholar] [CrossRef] [PubMed]
- Brink, A.J.; Van Wyk, J.; Moodley, V.M.; Corcoran, C.; Ekermans, P.; Nutt, L.; Boyles, T.; Perovic, O.; Feldman, C.; Richards, G.; et al. The role of appropriate diagnostic testing in acute respiratory tract infections: An antibiotic stewardship strategy to minimise diagnostic uncertainty in primary care. South Afr. Med. J. 2016, 106, 554–561, Epub 2 June 2016. [Google Scholar] [CrossRef] [PubMed]
- Goneau, L.W.; Hannan, T.J.; MacPhee, R.A.; Schwartz, D.J.; Macklaim, J.M.; Gloor, G.B.; Razvi, H.; Reid, G.; Hultgren, S.J.; Burton, J.P. Subinhibitory antibiotic therapy alters recurrent urinary tract infection pathogenesis through modulation of bacterial virulence and host immunity. Mbio 2015, 6, e00356-15, Epub 2 April 2015. [Google Scholar] [CrossRef] [PubMed]
- Wassermann, T.; Meinike Jorgensen, K.; Ivanyshyn, K.; Bjarnsholt, T.; Khademi, S.M.; Jelsbak, L.; Hoiby, N.; Ciofu, O. The phenotypic evolution of Pseudomonas aeruginosa populations changes in the presence of subinhibitory concentrations of ciprofloxacin. Microbiology 2016, 162, 865–875. [Google Scholar] [CrossRef] [PubMed]
- Italiano, D.; Bruno, A.; Santoro, V.; Lanza, G.; Muscatello, M.R.; Zoccali, R.; Spina, E. Generic Olanzapine Substitution in Patients With Schizophrenia: Assessment of Serum Concentrations and Therapeutic Response After Switching. Ther. Drug Monit. 2015, 37, 827–830, Epub 2 April 2015. [Google Scholar] [CrossRef] [PubMed]
- van den Bergh, J.P.; Bouts, M.E.; van der Veer, E.; van der Velde, R.Y.; Janssen, M.J.; Geusens, P.P.; Winkens, B.; Oldenhof, N.J.; van Geel, T.A. Comparing tolerability and efficacy of generic versus brand alendronate: a randomized clinical study in postmenopausal women with a recent fracture. PLoS ONE 2013, 8, e78153, Epub 10 November 2013. [Google Scholar] [CrossRef] [PubMed]
- Gasser, U.E.; Fischer, A.; Timmermans, J.P.; Arnet, I. Pharmaceutical quality of seven generic Levodopa/Benserazide products compared with original Madopar(R)/Prolopa(R). BMC Pharmacol. Toxicol. 2013, 14, 24, Epub 27 April 2013. [Google Scholar] [CrossRef] [PubMed]
- United States Pharmacopeial Convention. General Chapter <905> Uniformity of Dosage Unit. In USP 39-NF 34; United States Pharmacopeial Convention: Rockville, MD USA, 2016; Volume 1, p. 736. ISBN ISBN-13: 978-3769265606. [Google Scholar]
- European Directorate for the Quality of Medicines & HealthCare. 2.9.40. Uniformity of dosage units. In European Pharmacopoeia, 9th ed.; Council of Europe: Strasbourg, France, 2017; p. 372. ISBN ISBN-13: 978-9287181336. [Google Scholar]
- United States Pharmacopeial Convention. General Chapter <1216> Tablet Friability. In USP 39-NF 34; United States Pharmacopeial Convention: Rockville, MD, USA, 2016; Volume 1, p. 1609. ISBN ISBN-13: 978-3769265606. [Google Scholar]
- Shah, V.P.; Tsong, Y.; Sathe, P.; Williams, R.L. Dissolution profile comparison using similarity factor, f2. Dissolution Technol. 1999, 6, 15. [Google Scholar] [CrossRef]
- United States Pharmacopeial Convention. Monograph for Amoxicillin and Clavulanate Potassium Tablets. In USP39-NF34; United States Pharmacopeial Convention: Rockville, MD USA, 2016; Volume 2, p. 2526. ISBN -13: 978-3769265606. [Google Scholar]
- Stuart, A.V.; Zuo, J.; Löbenberg, R. Investigating the Dissolution Profiles of Amoxicillin, Metronidazole, and Zidovudine Formulations used in Trinidad and Tobago, West Indies. AAPS PharmSciTech 2014, 15, 1060–1069. [Google Scholar] [CrossRef] [PubMed]
- Du, J.; Hoag, S.W. Characterization of excipient and tableting factors that influence folic acid dissolution, friability, and breaking strength of oil- and water-soluble multivitamin with minerals tablets. Drug Dev. Ind. Pharm. 2003, 29, 1137–1147, Epub 18 December 2003. [Google Scholar] [CrossRef] [PubMed]
- Hamad, I.M.; Arida, A.I.; Al-Tabakha, M.M. Effect of the Lubricant Magnesium Stearate on Changes of Specific Surface Area of Directly Compressible Powders Under Compression. Jordan J. Pharm. Sci. 2015, 8, 21–33. [Google Scholar] [CrossRef]
- Center for Drug Evaluation and Research. Guidance for Industry: Dissolution Testing of Immediate Release Solid Oral Dosage Forms; US Food and Drug Administration: Silver Spring, MD, USA, 1997. Available online: https://www.fda.gov/downloads/drugs/guidances/ucm070237.pdf (accessed on 29 April 2017).
- Costa, P.; Lobo, J.M.S. Modeling and comparison of dissolution profiles. Eur. J. Pharm. Sci. 2001, 13, 123–133. [Google Scholar] [CrossRef]
- Tsume, Y.; Amidon, G.L. The biowaiver extension for BCS class III drugs: The effect of dissolution rate on the bioequivalence of BCS class III immediate-release drugs predicted by computer simulation. Mol. Pharm. 2010, 7, 1235–1243, Epub 19 June 2010. [Google Scholar] [CrossRef] [PubMed]
- Lozoya-Agullo, I.; Zur, M.; Wolk, O.; Beig, A.; Gonzalez-Alvarez, I.; Gonzalez-Alvarez, M.; Merino-Sanjuan, M.; Bermejo, M.; Dahan, A. In-situ intestinal rat perfusions for human Fabs prediction and BCS permeability class determination: Investigation of the single-pass vs. the Doluisio experimental approaches. Int. J. Pharm. 2015, 480, 1–7, Epub 18 January 2015. [Google Scholar] [CrossRef] [PubMed]
- Office of Generic Drugs. Orange Book: Approved Drug Products with Therapeutic Equivalence Evaluations Current through December 2016, 37th ed.; US Food and Drug Administration: Silver Spring, MD, USA, 2017. Available online: https://www.fda.gov/downloads/Drugs/DevelopmentApprovalProcess/UCM071436.pdf (accessed on 29 March 2017).
- Löbenberg, R.; Chacra, N.B.; Stippler, E.S.; Shah, V.P.; DeStefano, A.J.; Hauck, W.W.; Williams, R.L. Toward Global Standards for Comparator Pharmaceutical Products: Case Studies of Amoxicillin, Metronidazole, and Zidovudine in the Americas. AAPS J. 2012, 14, 462–472. [Google Scholar] [CrossRef] [PubMed]
- Kassaye, L.; Genete, G. Evaluation and comparison of in vitro dissolution profiles for different brands of amoxicillin capsules. Afr. Health Sci. 2013, 13, 369–375. [Google Scholar] [CrossRef] [PubMed]
- Division of Bioequivalence. Dissolution Methods; US Food and Drug Administration: Silver Spring, MD, USA. Available online: https://www.accessdata.fda.gov/scripts/cder/dissolution/dsp_getallData.cfm (accessed on 29 March 2017).


| No. | Product | Manufacturing Country | Batch No. | Manufacturing Date (Month/Year) | Expiry Date (Month/Year) |
|---|---|---|---|---|---|
| 1 | R | U.K. | 755708 | 11/2015 | 11/2017 |
| 2 | T1 | Jordan | 6221 | 06/2015 | 06/2017 |
| 3 | T2 | UAE | XAG5001 | 11/2015 | 11/2017 |
| 4 | T3 | UAE | 8948 | 12/2015 | 12/2017 |
| 5 | T4 | UAE | 0245 | 05/2015 | 05/2018 |
| 6 | T5 | Saudi Arabia | 155042 | 02/2015 | 02/2017 |
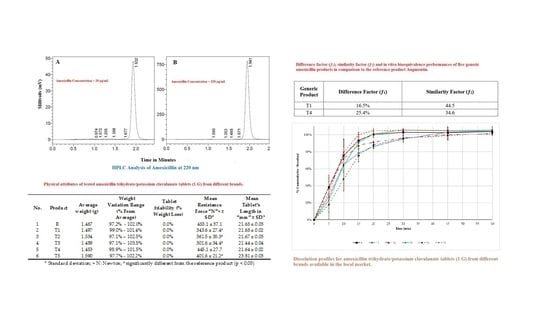
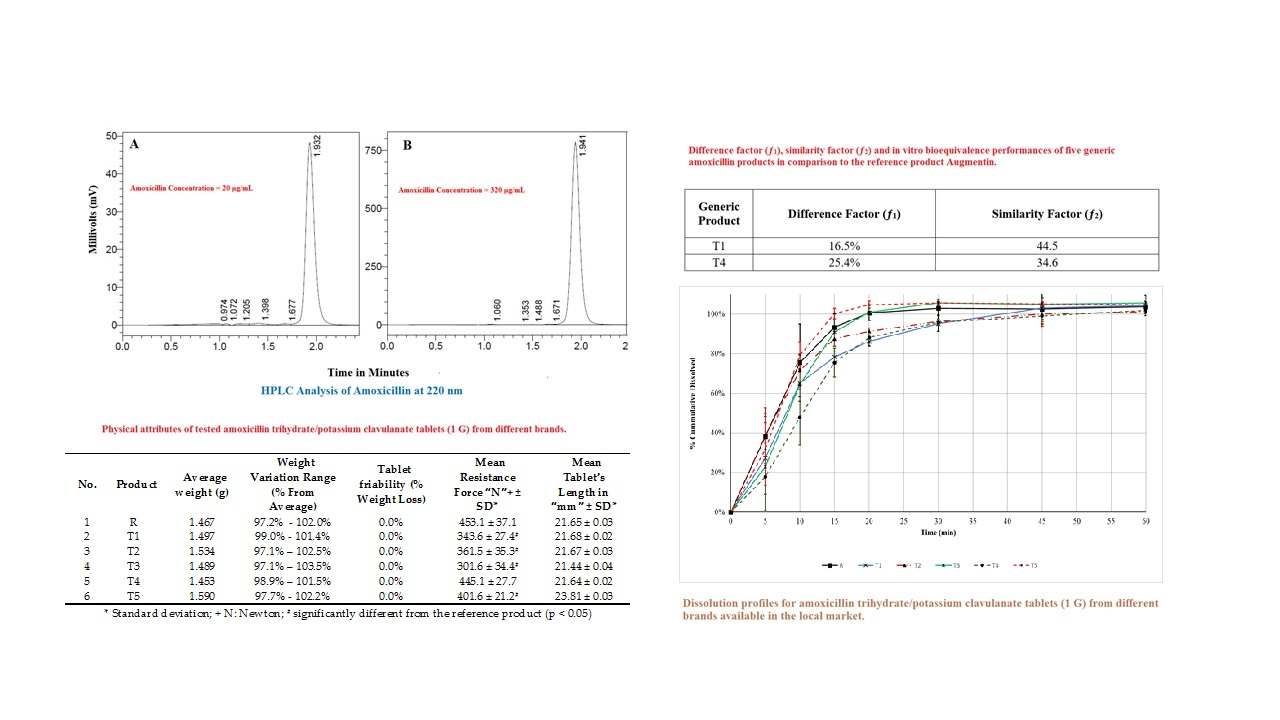
| No. | Product | Average Weight (g) | Weight Variation Range (% from Average) | Tablet Friability (% Weight Loss) | Mean Resistance Force “N” $ ± SD * | Mean Tablet’s Length in “mm” ± SD * |
|---|---|---|---|---|---|---|
| 1 | R | 1.467 | 97.2%–102.0% | 0.0% | 453.1 ± 37.1 | 21.65 ± 0.03 |
| 2 | T1 | 1.497 | 99.0%–101.4% | 0.0% | 343.6 ± 27.4 # | 21.68 ± 0.02 |
| 3 | T2 | 1.534 | 97.1%–102.5% | 0.0% | 361.5 ± 35.3 # | 21.67 ± 0.03 |
| 4 | T3 | 1.489 | 97.1%–103.5% | 0.0% | 301.6 ± 34.4 # | 21.44 ± 0.04 |
| 5 | T4 | 1.453 | 98.9%–101.5% | 0.0% | 445.1 ± 27.7 | 21.64 ± 0.02 |
| 6 | T5 | 1.590 | 97.7%–102.2% | 0.0% | 401.6 ± 21.2 # | 23.81 ± 0.03 |
| Product | % Mean Chemical Content ± SD |
|---|---|
| R | 99.42 ± 1.84 |
| T1 | 100.58 ± 1.31 |
| T2 | 104.31 ± 0.74 |
| T3 | 102.88 ± 0.56 |
| T4 | 102.42 ± 1.34 |
| T5 | 103.88 ± 1.50 |
| Generic Product | Difference Factor (f1) | Similarity Factor (f2) |
|---|---|---|
| T1 | 16.5% | 44.5 |
| T4 | 25.4% | 34.6 |
© 2017 by the authors. Licensee MDPI, Basel, Switzerland. This article is an open access article distributed under the terms and conditions of the Creative Commons Attribution (CC BY) license (http://creativecommons.org/licenses/by/4.0/).
Share and Cite
Al-Tabakha, M.M.; Fahelelbom, K.M.S.; Obaid, D.E.E.; Sayed, S. Quality Attributes and In Vitro Bioequivalence of Different Brands of Amoxicillin Trihydrate Tablets. Pharmaceutics 2017, 9, 18. https://doi.org/10.3390/pharmaceutics9020018
Al-Tabakha MM, Fahelelbom KMS, Obaid DEE, Sayed S. Quality Attributes and In Vitro Bioequivalence of Different Brands of Amoxicillin Trihydrate Tablets. Pharmaceutics. 2017; 9(2):18. https://doi.org/10.3390/pharmaceutics9020018
Chicago/Turabian StyleAl-Tabakha, Moawia M., Khairi M. S. Fahelelbom, Dana Emad Eddin Obaid, and Sadik Sayed. 2017. "Quality Attributes and In Vitro Bioequivalence of Different Brands of Amoxicillin Trihydrate Tablets" Pharmaceutics 9, no. 2: 18. https://doi.org/10.3390/pharmaceutics9020018