
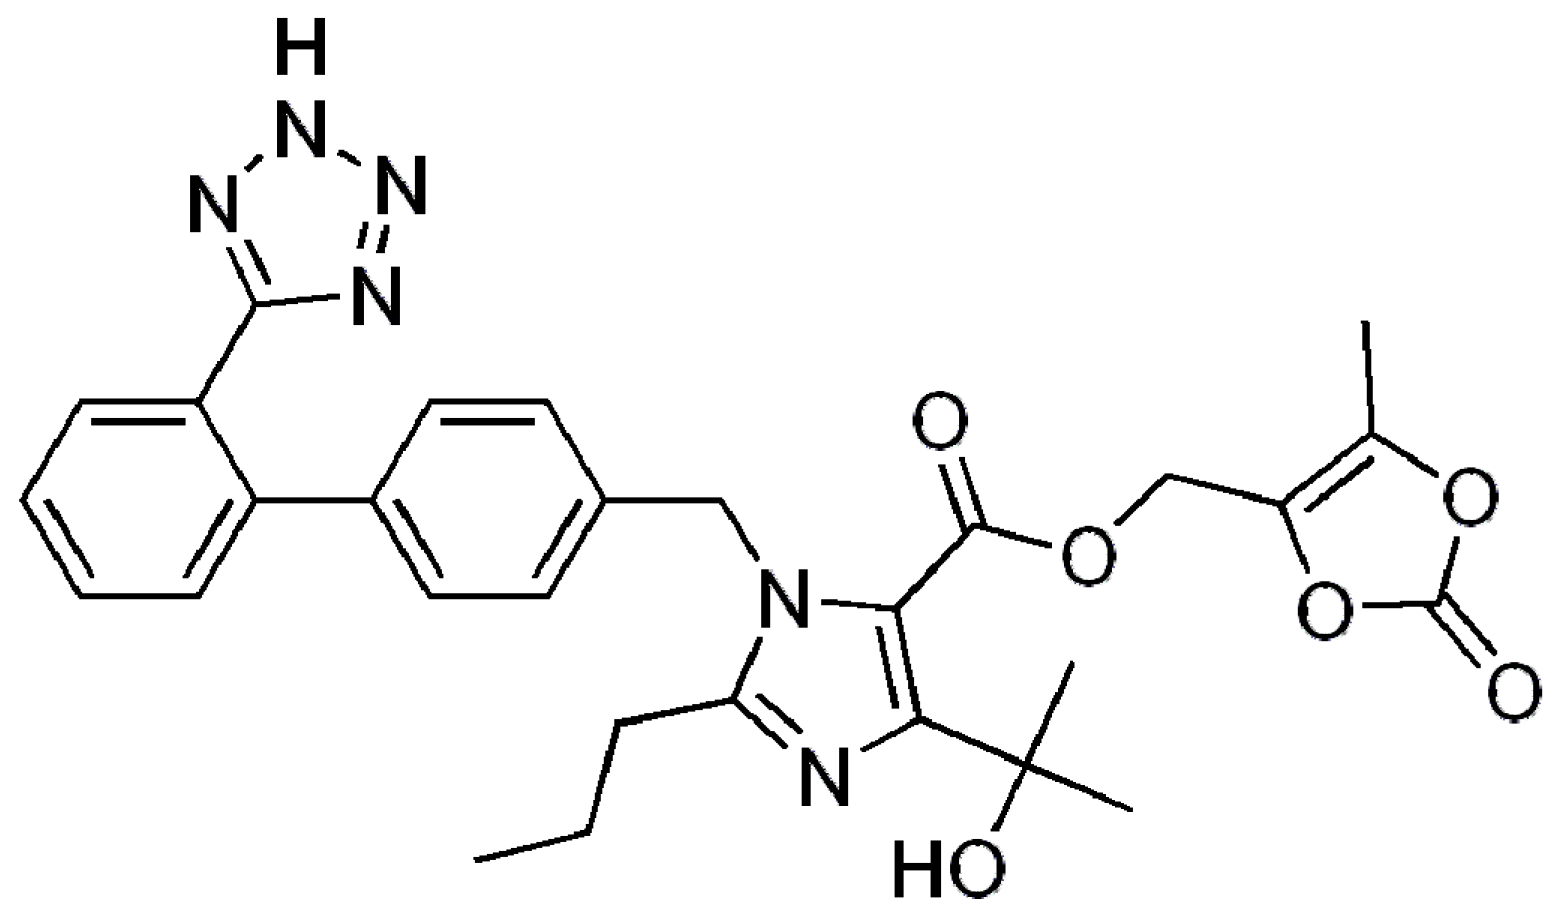
Novel Solid Self-Nanoemulsifying Drug Delivery System (S-SNEDDS) for Oral Delivery of Olmesartan Medoxomil: Design, Formulation, Pharmacokinetic and Bioavailability Evaluation


Abstract
:1. Introduction
2. Experimental Section
2.1. Materials
2.2. Methods
2.2.1. Preformulation Study (Selection of SNEDDS Components)
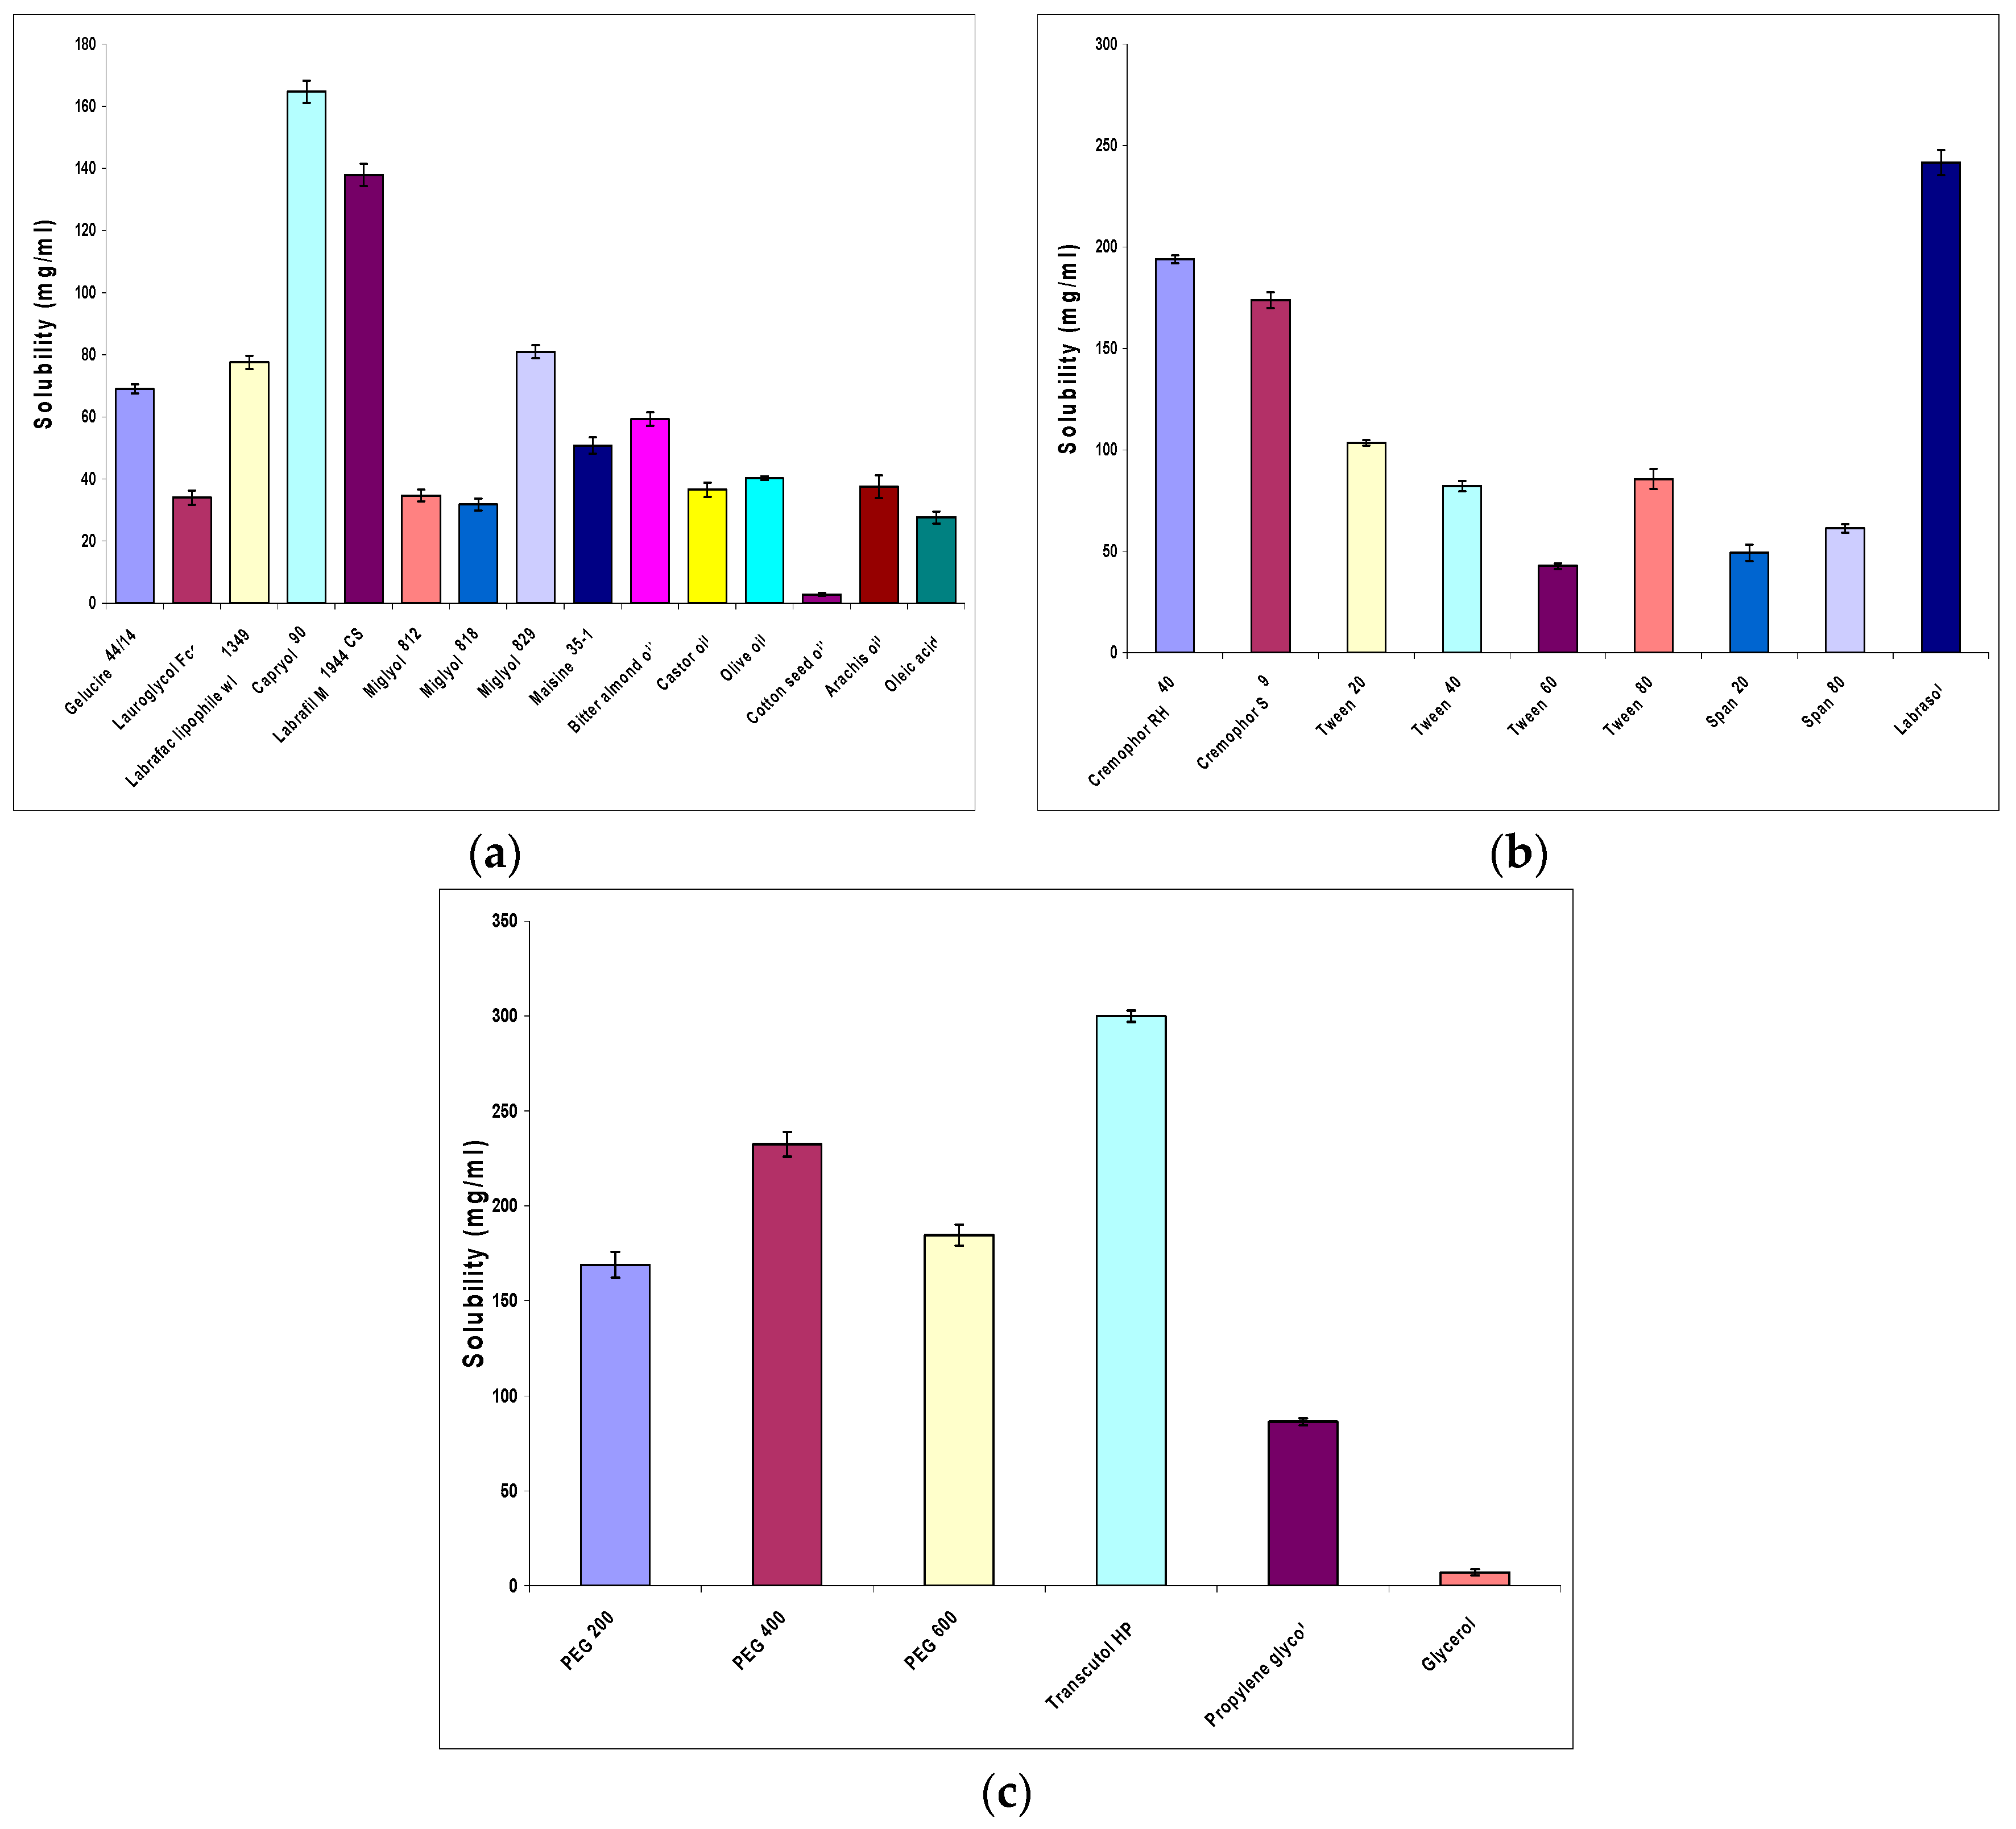
Study of OLM Solubility in Various Oils, Surfactants and Cosurfactants
Preliminary Screening of Surfactants for Emulsification Efficiency
Preliminary Screening of Cosurfactants for Emulsification Efficiency
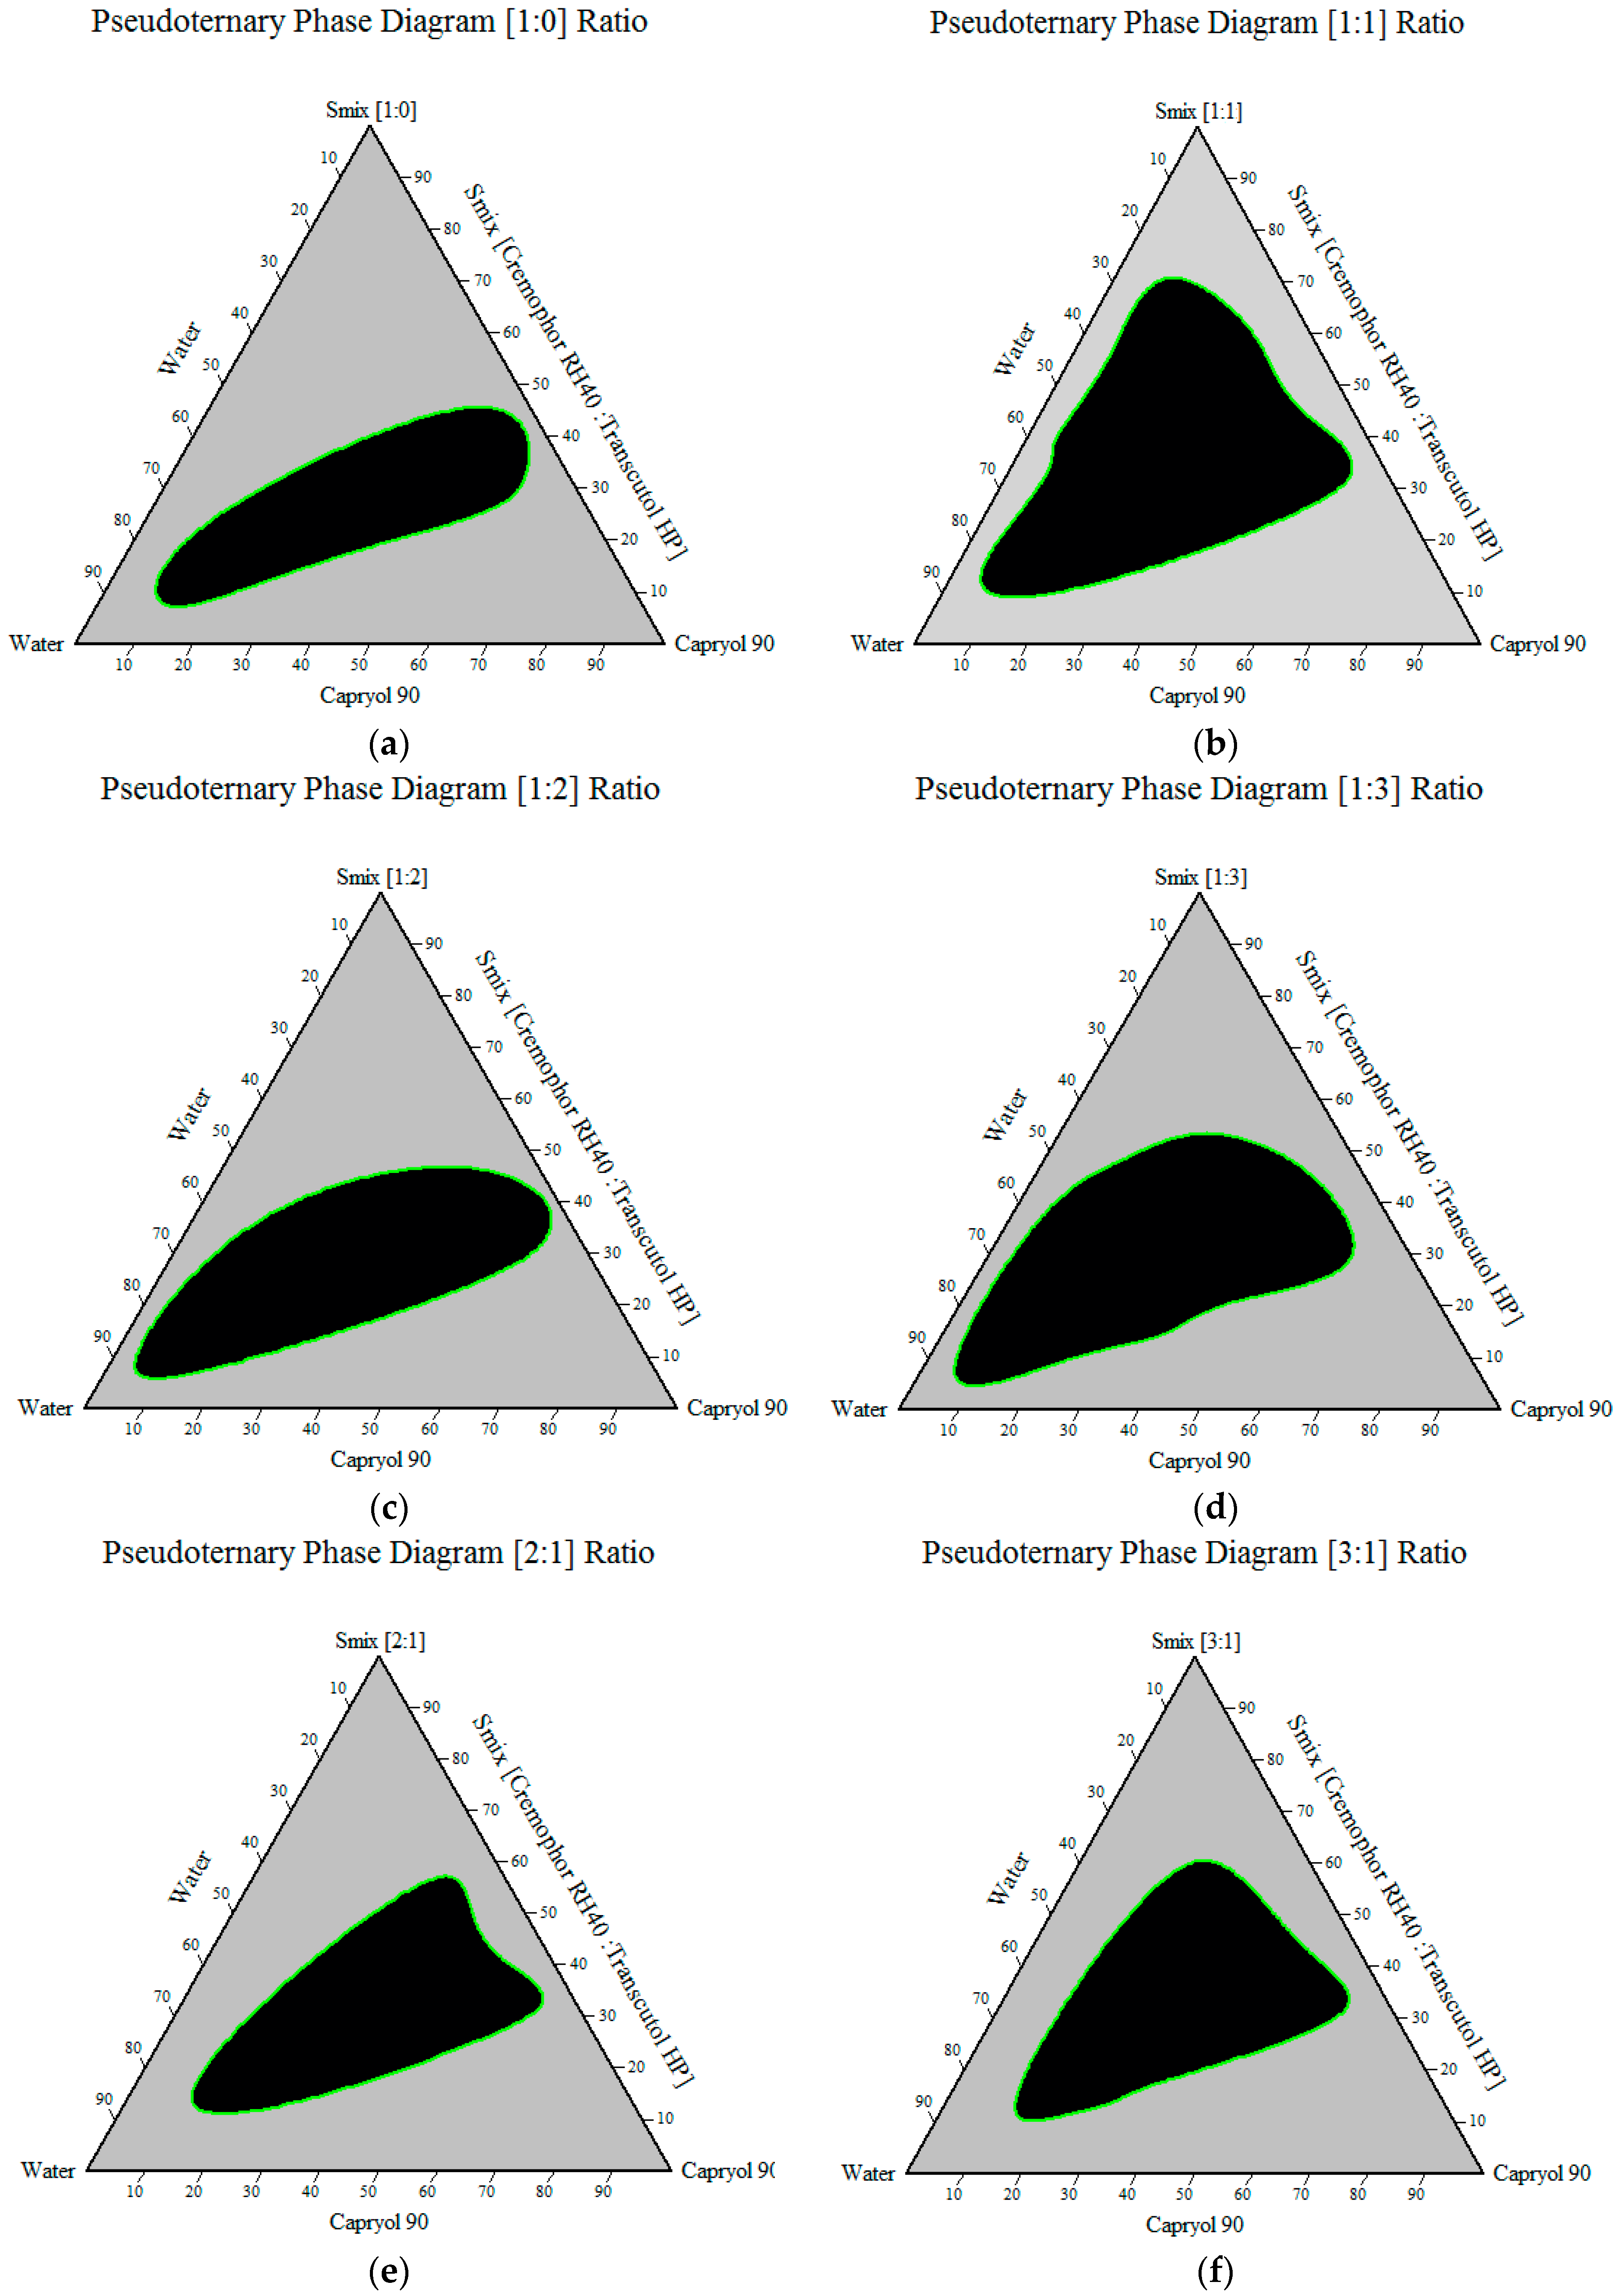
Construction of Pseudoternary Phase Diagram
2.2.2. Preparation of OLM Loaded SNEDDS
2.2.3. Characterization and Evaluation of OLM Loaded SNEDDS
Thermodynamic Stability Studies
Robustness to Dilution
Assessment of Efficiency of Self-Emulsification
Self-Emulsification Time
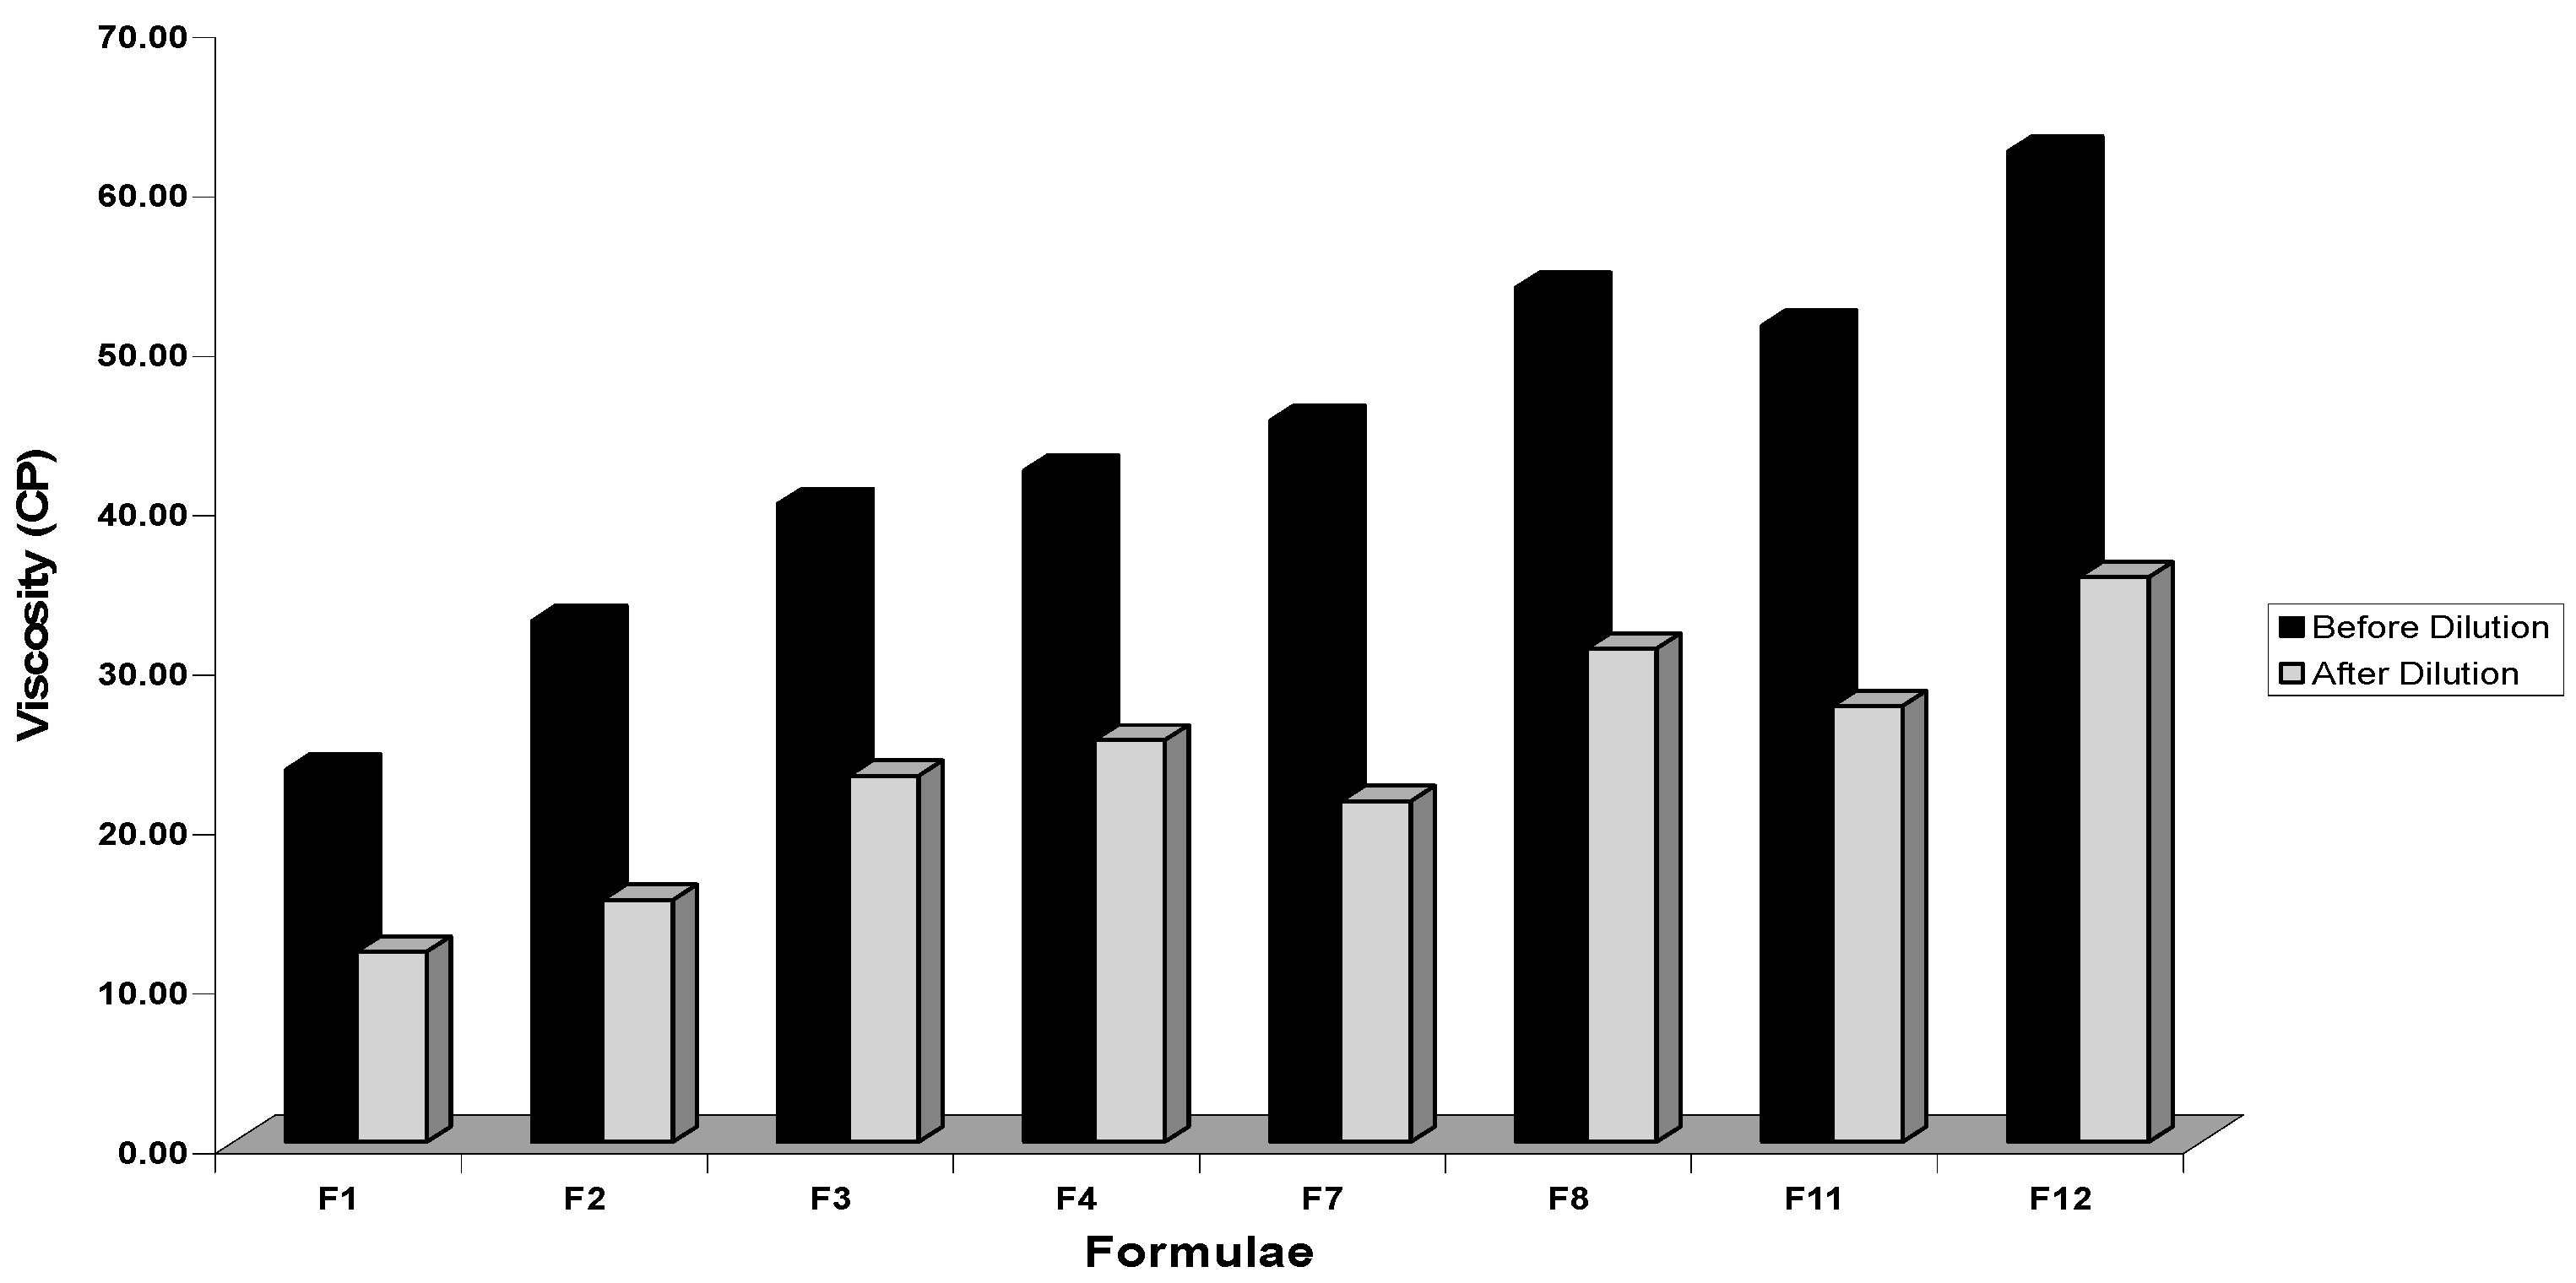
Viscosity Determination
Spectroscopic Characterization of Optical Clarity
Transmission Electron Microscopy (TEM)
Droplet Size Analysis and Polydispersibility Index (PDI) Determination
Zeta Potential Determination
Drug Loading Efficiency
In Vitro Drug Release Studies
Kinetic Treatment for the in Vitro Release of OLM SNEDDS (Release Kinetic Modeling)
2.2.4. Preparation of OLM Loaded S-SNEDDS
2.2.5. Characterization of OLM Loaded S-SNEDDS
Micromeritic Properties of S-SNEDDS
3. Results and Discussion
3.1. Preformulation Study (Selection of SNEDDS Components)
3.1.1. Study of OLM Solubility in Various Oils, Surfactants and Cosurfactants
3.1.2. Preliminary Screening of Surfactants for Emulsification Efficiency
3.1.3. Preliminary Screening of Cosurfactants for Emulsification Efficiency
3.1.4. Construction of Pseudoternary Phase Diagram
3.2. Characterization and Evaluation of OLM Loaded SNEDDS
3.2.1. Thermodynamic Stability Studies
3.2.2. Robustness to Dilution
3.2.3. Assessment of Efficiency of Self-Emulsification (Dispersibility Test)
3.2.4. Self-Emulsification Time
3.2.5. Viscosity Determination
3.2.6. Spectroscopic Characterization of Optical Clarity
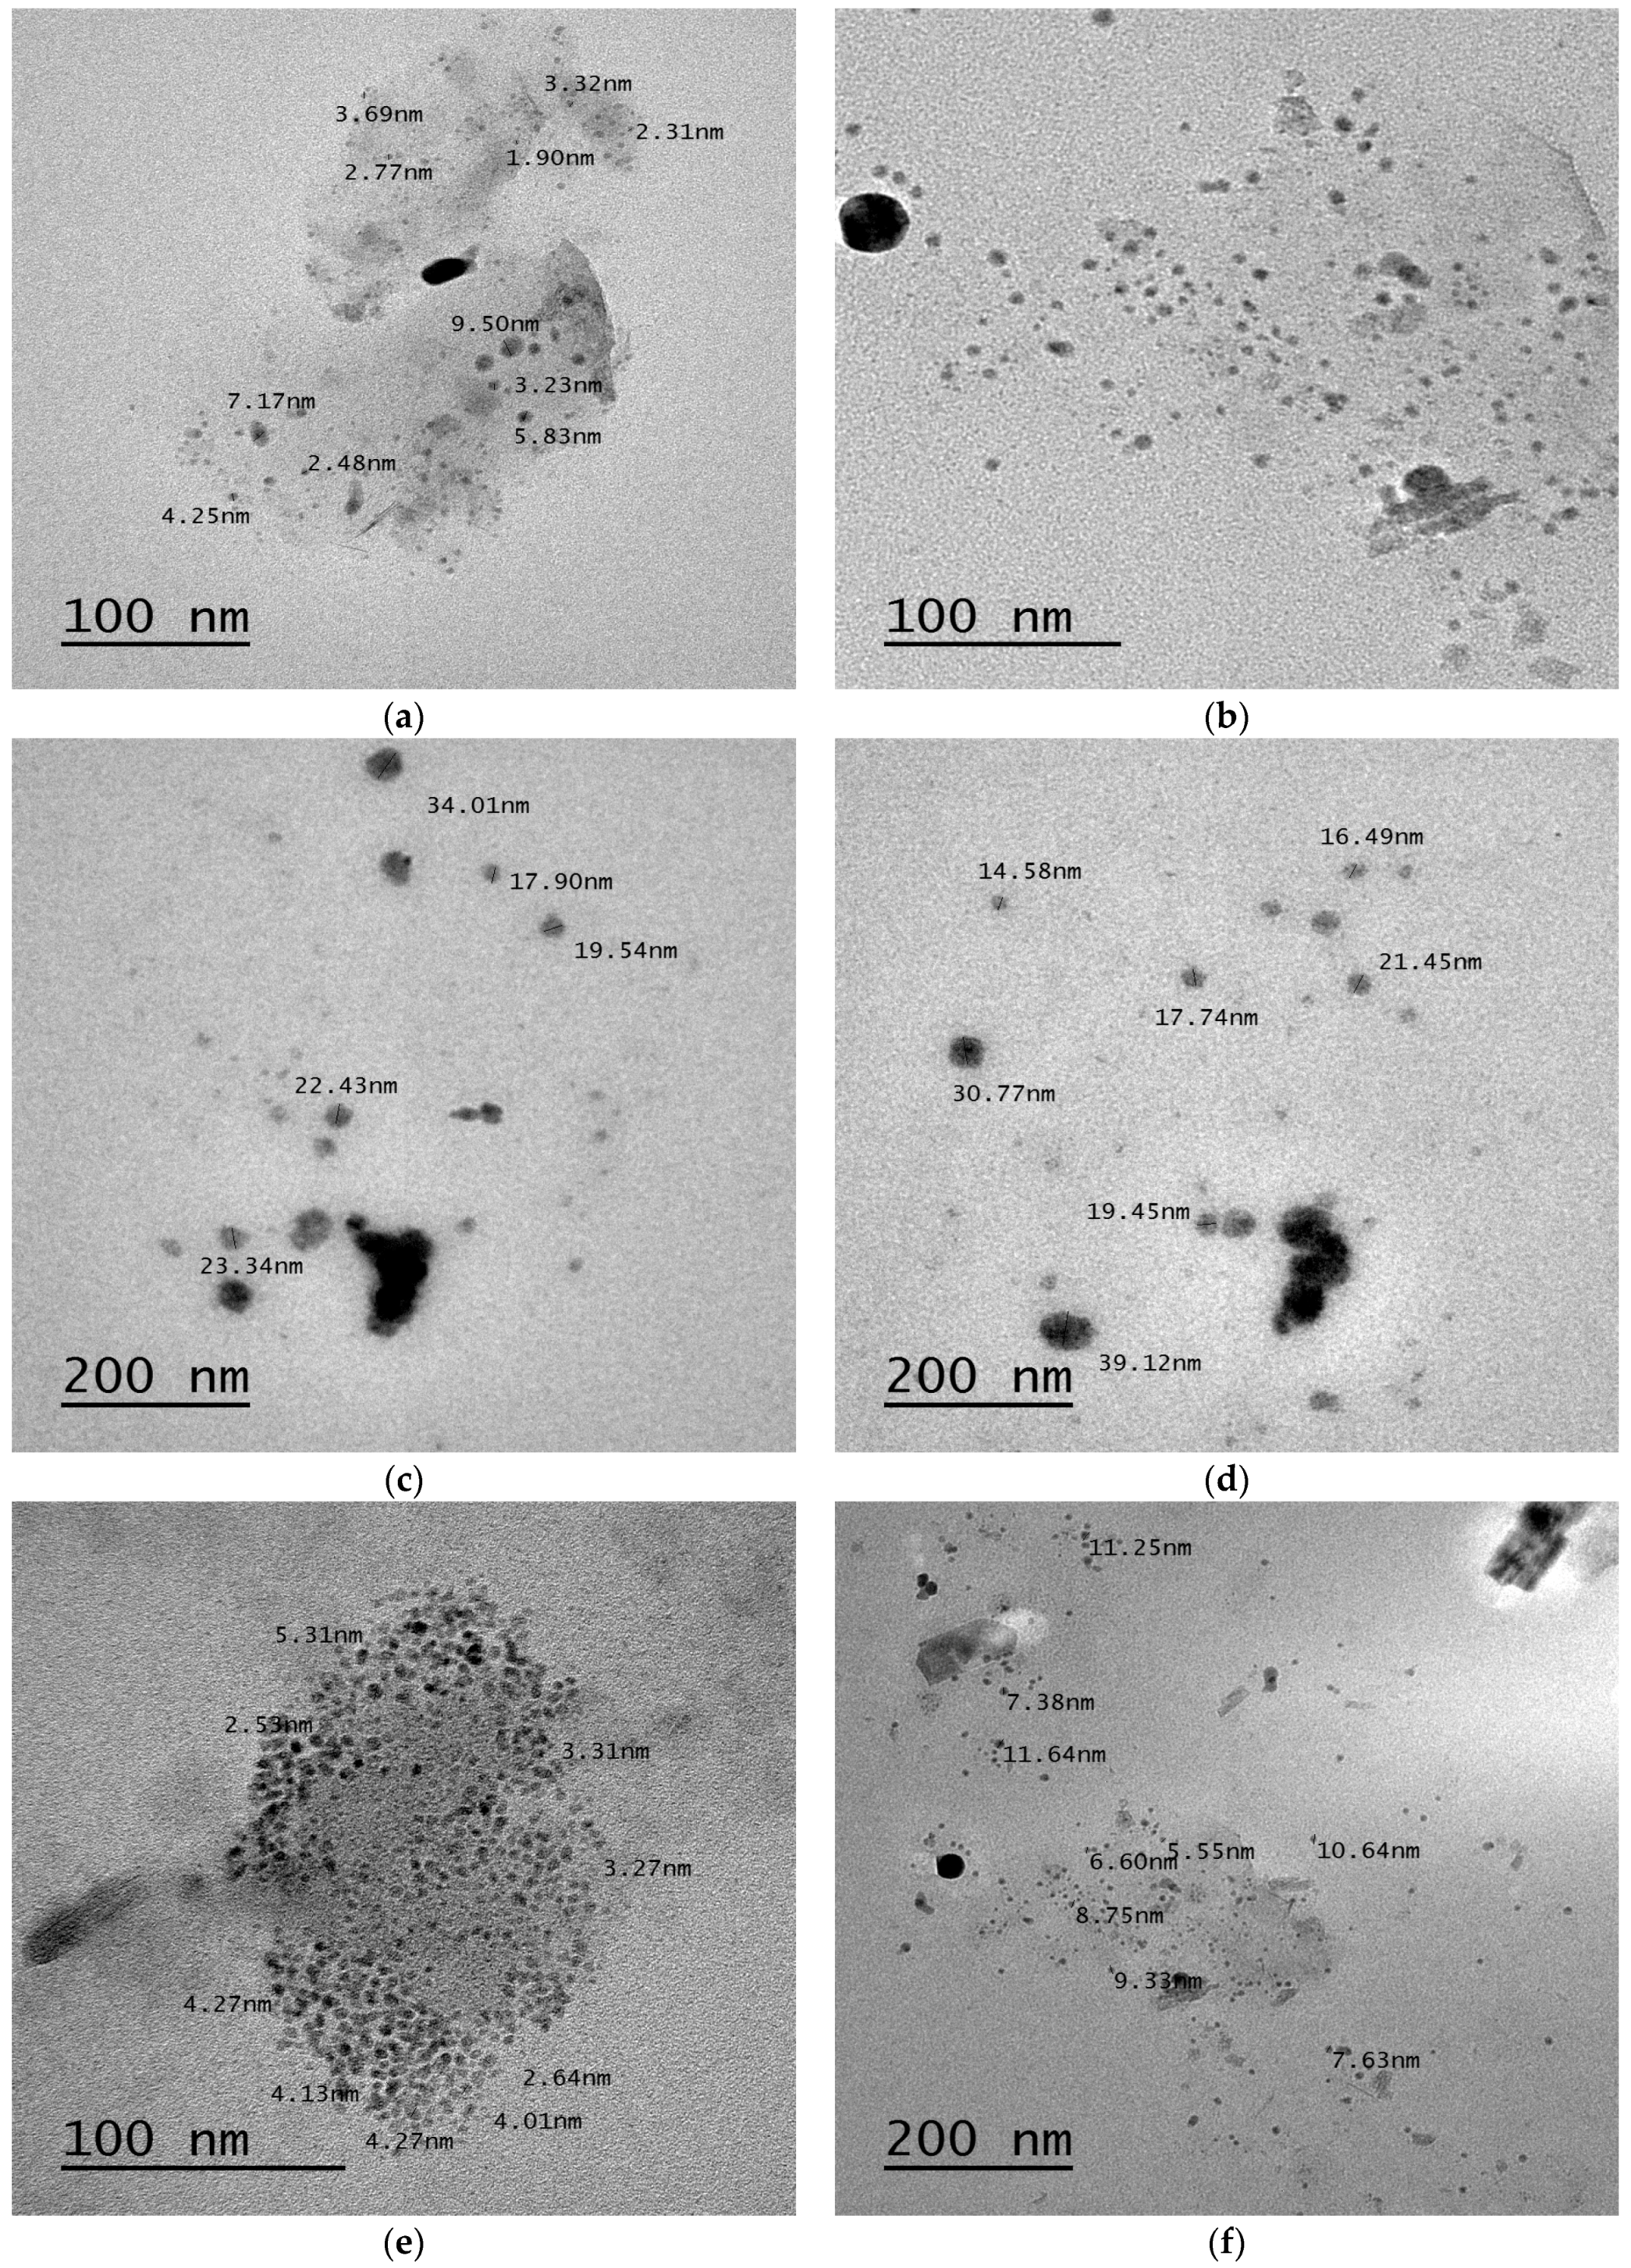
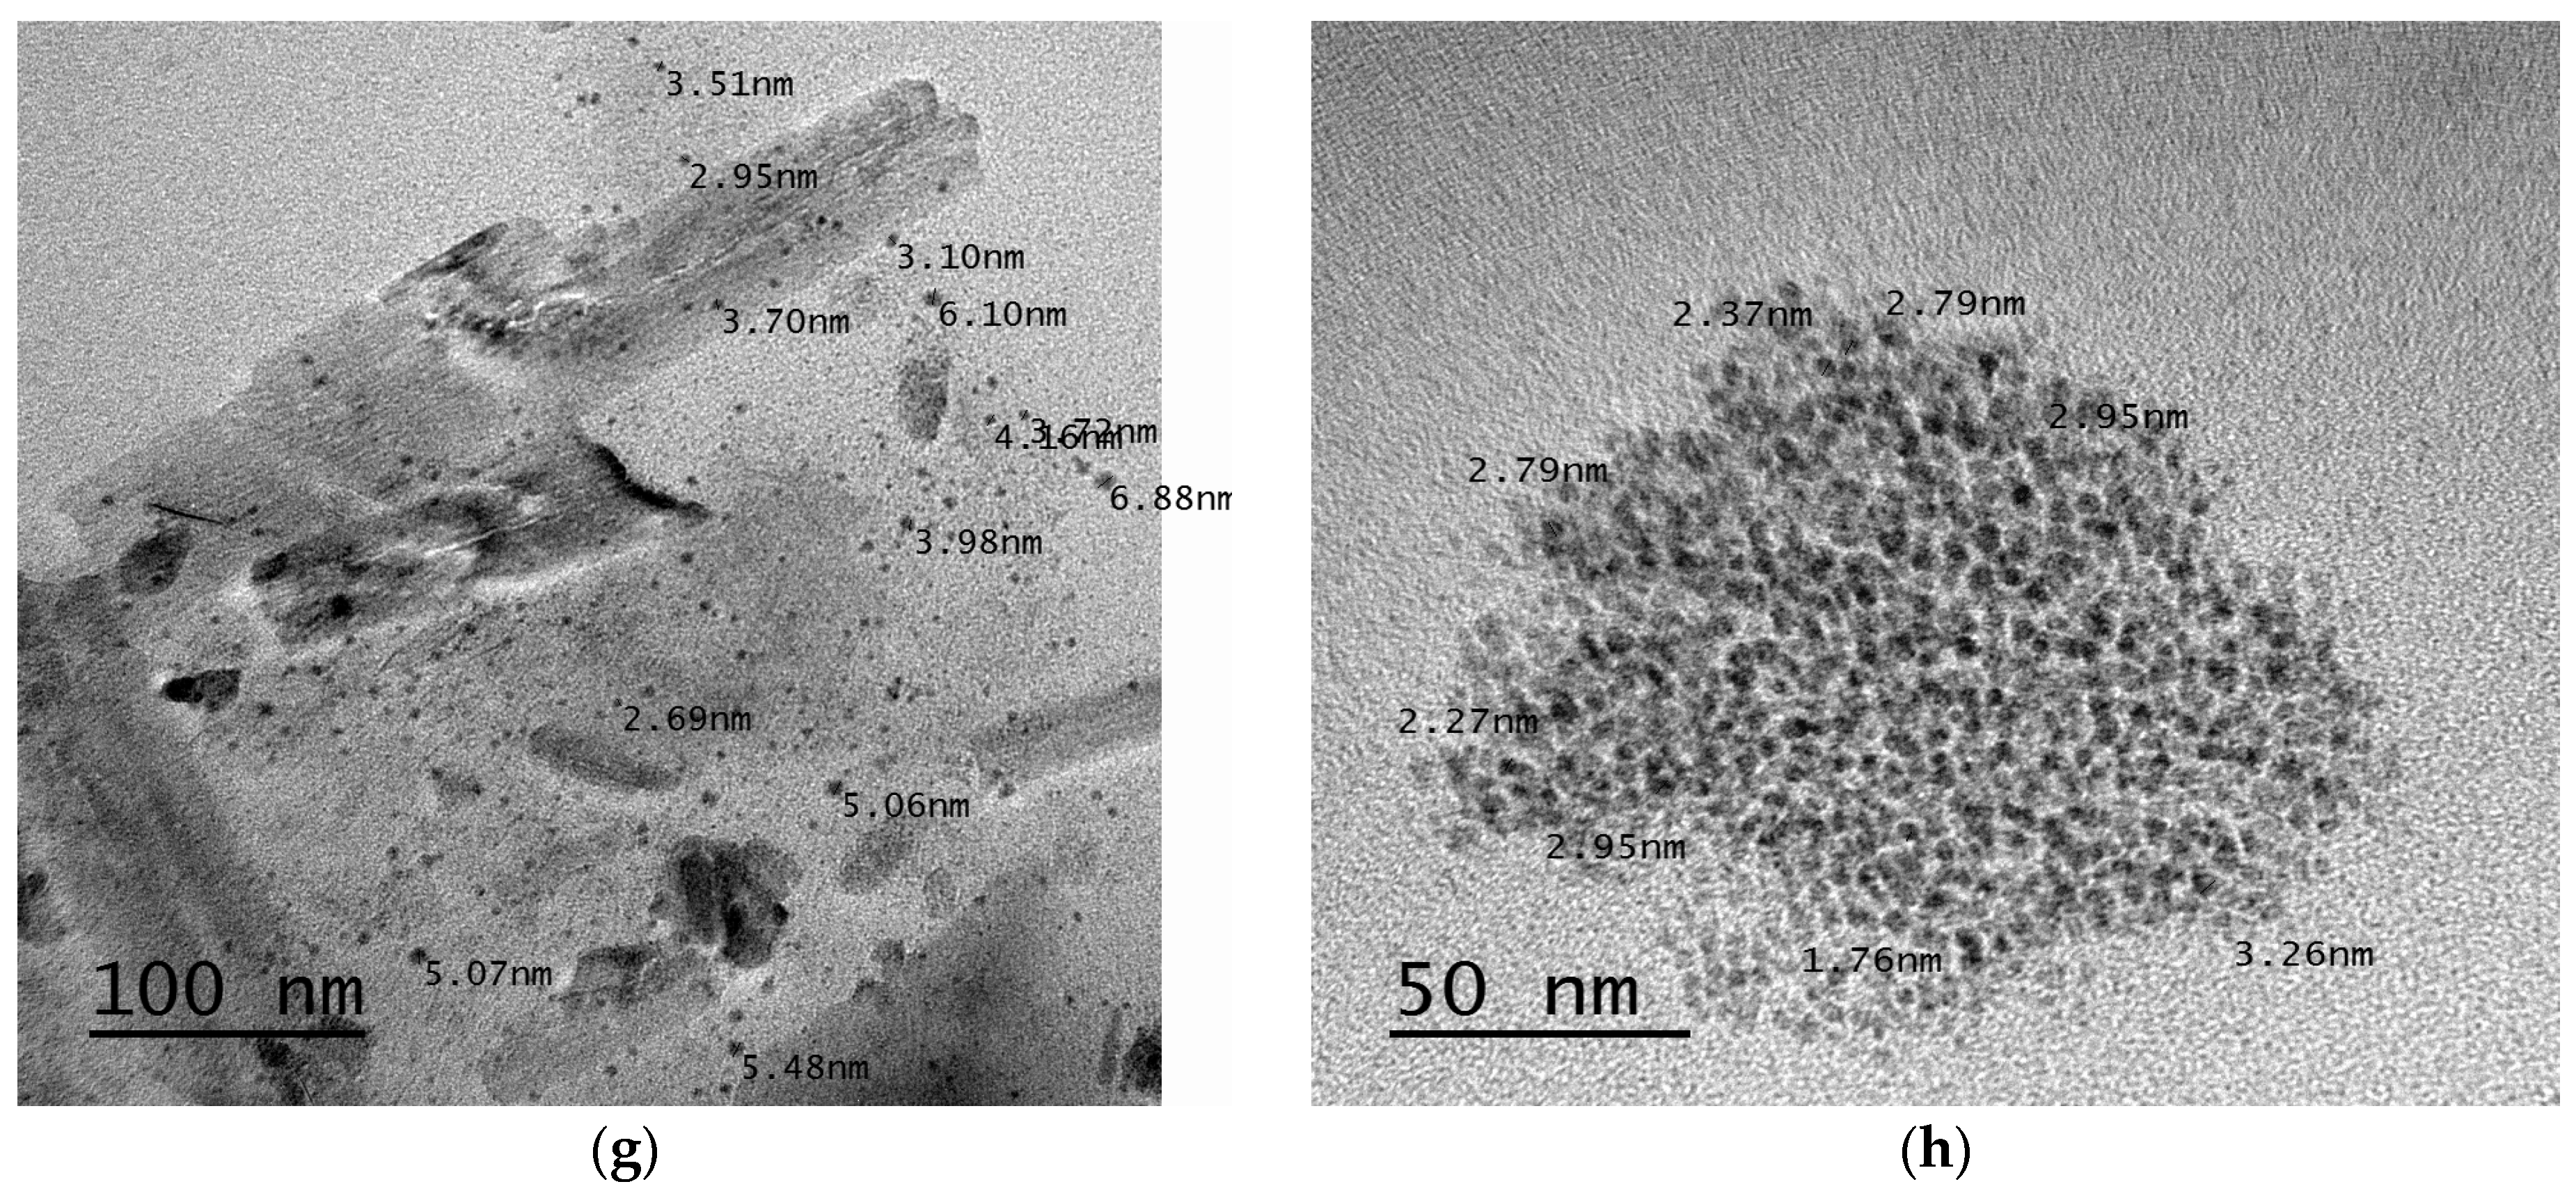
3.2.7. Transmission Electron Microscopy (TEM)
3.2.8. Droplet Size Analysis and Polydispersibility Index (PDI) Determination
3.2.9. Zeta Potential Determination
3.2.10. Drug Loading Efficiency
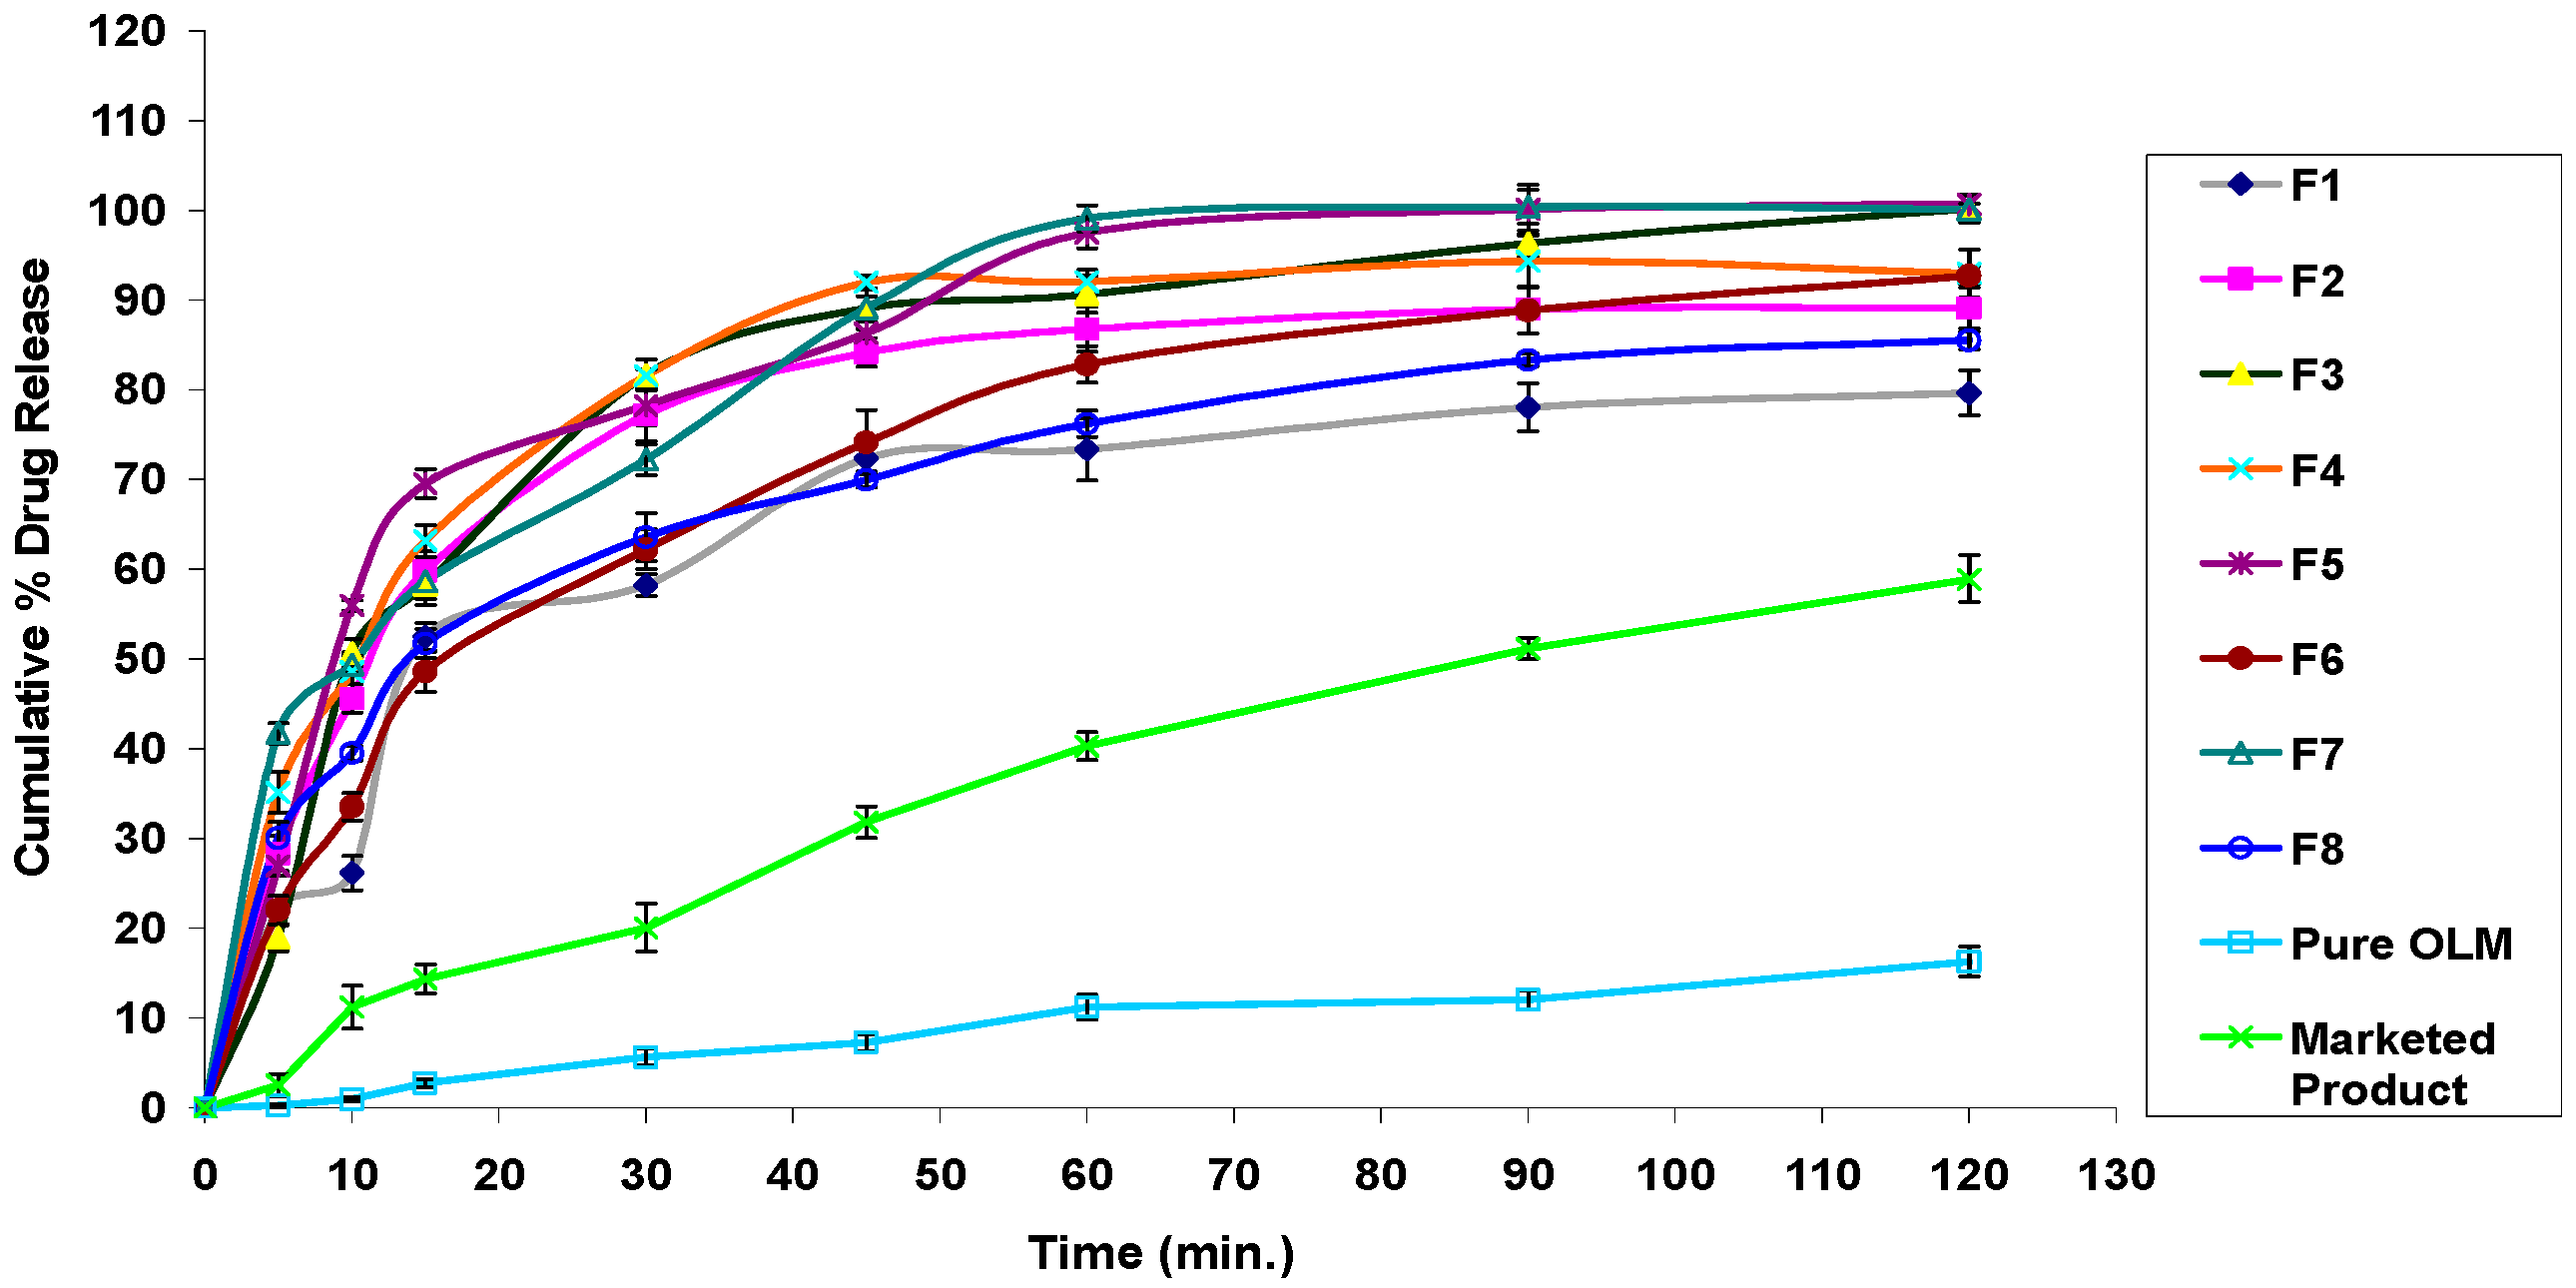
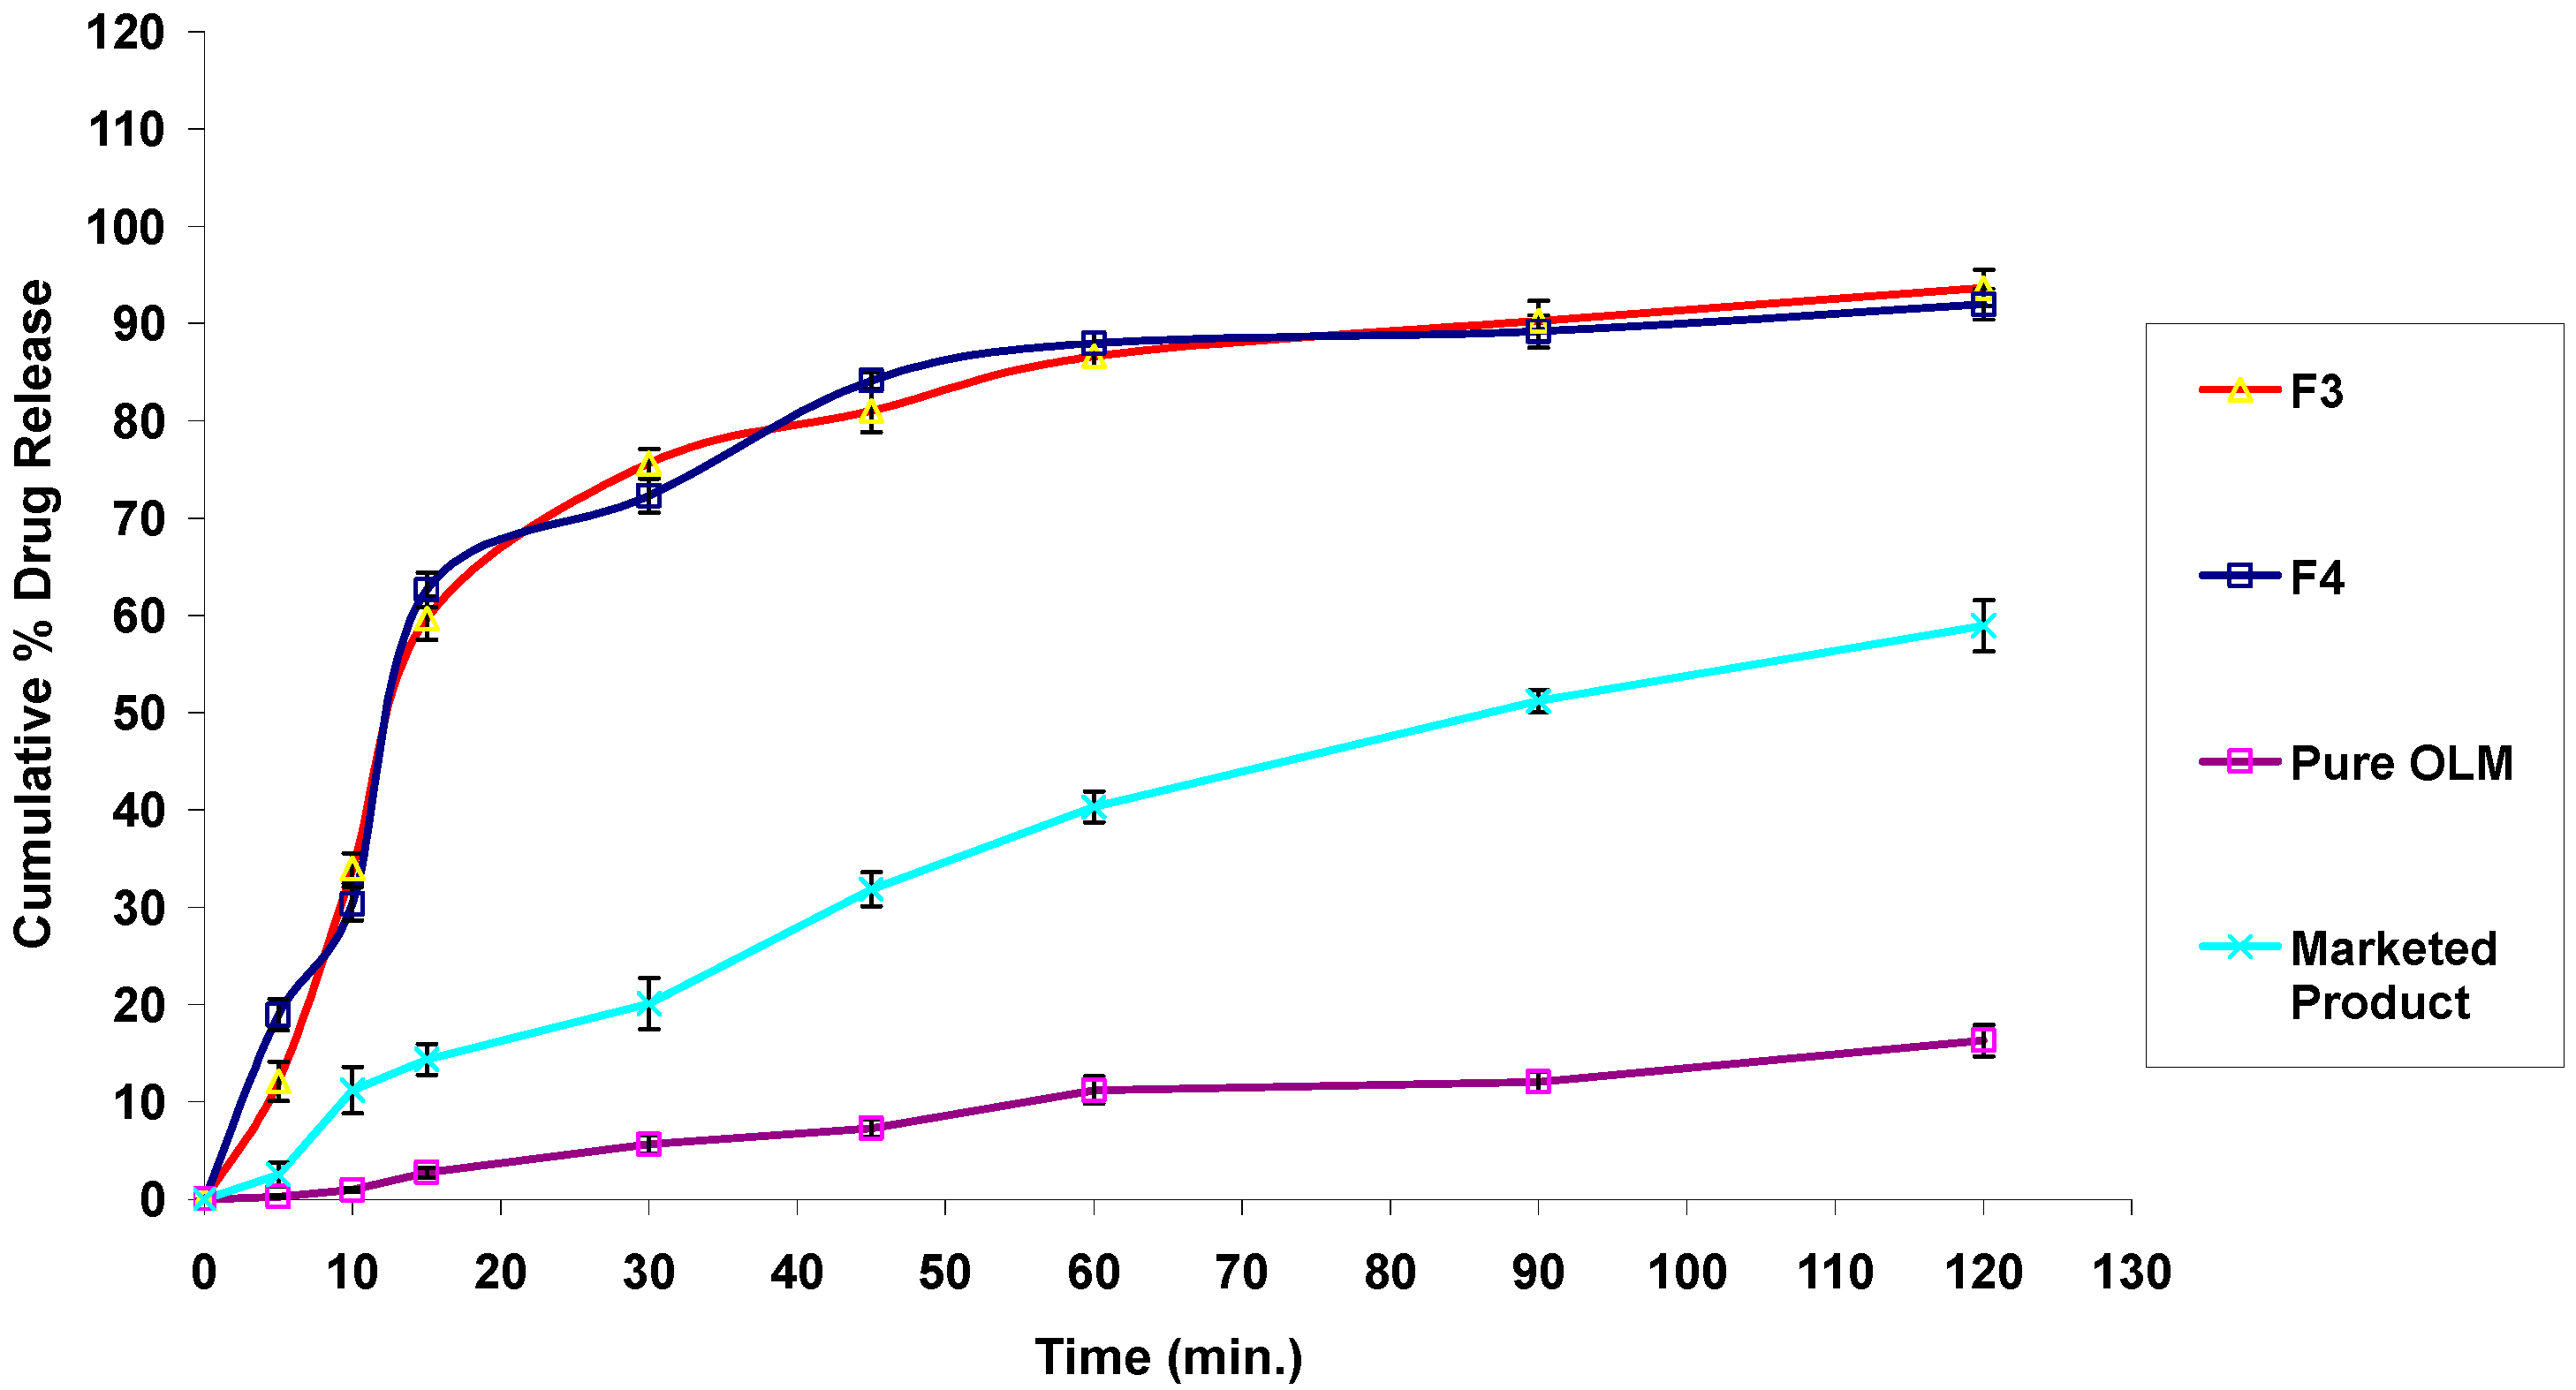
3.2.11. In Vitro Drug Release Studies
3.2.12. Kinetic Treatment for the in Vitro Release of OLM SNEDDS (Release Kinetic Modeling)
3.3. Preparation of OLM Loaded S-SNEDDS
3.4. Characterization of OLM Loaded S-SNEDDS
3.4.1. Micromeritic Properties of S-SNEDDS
3.4.2. Reconstitution Properties of S-SNEDDS
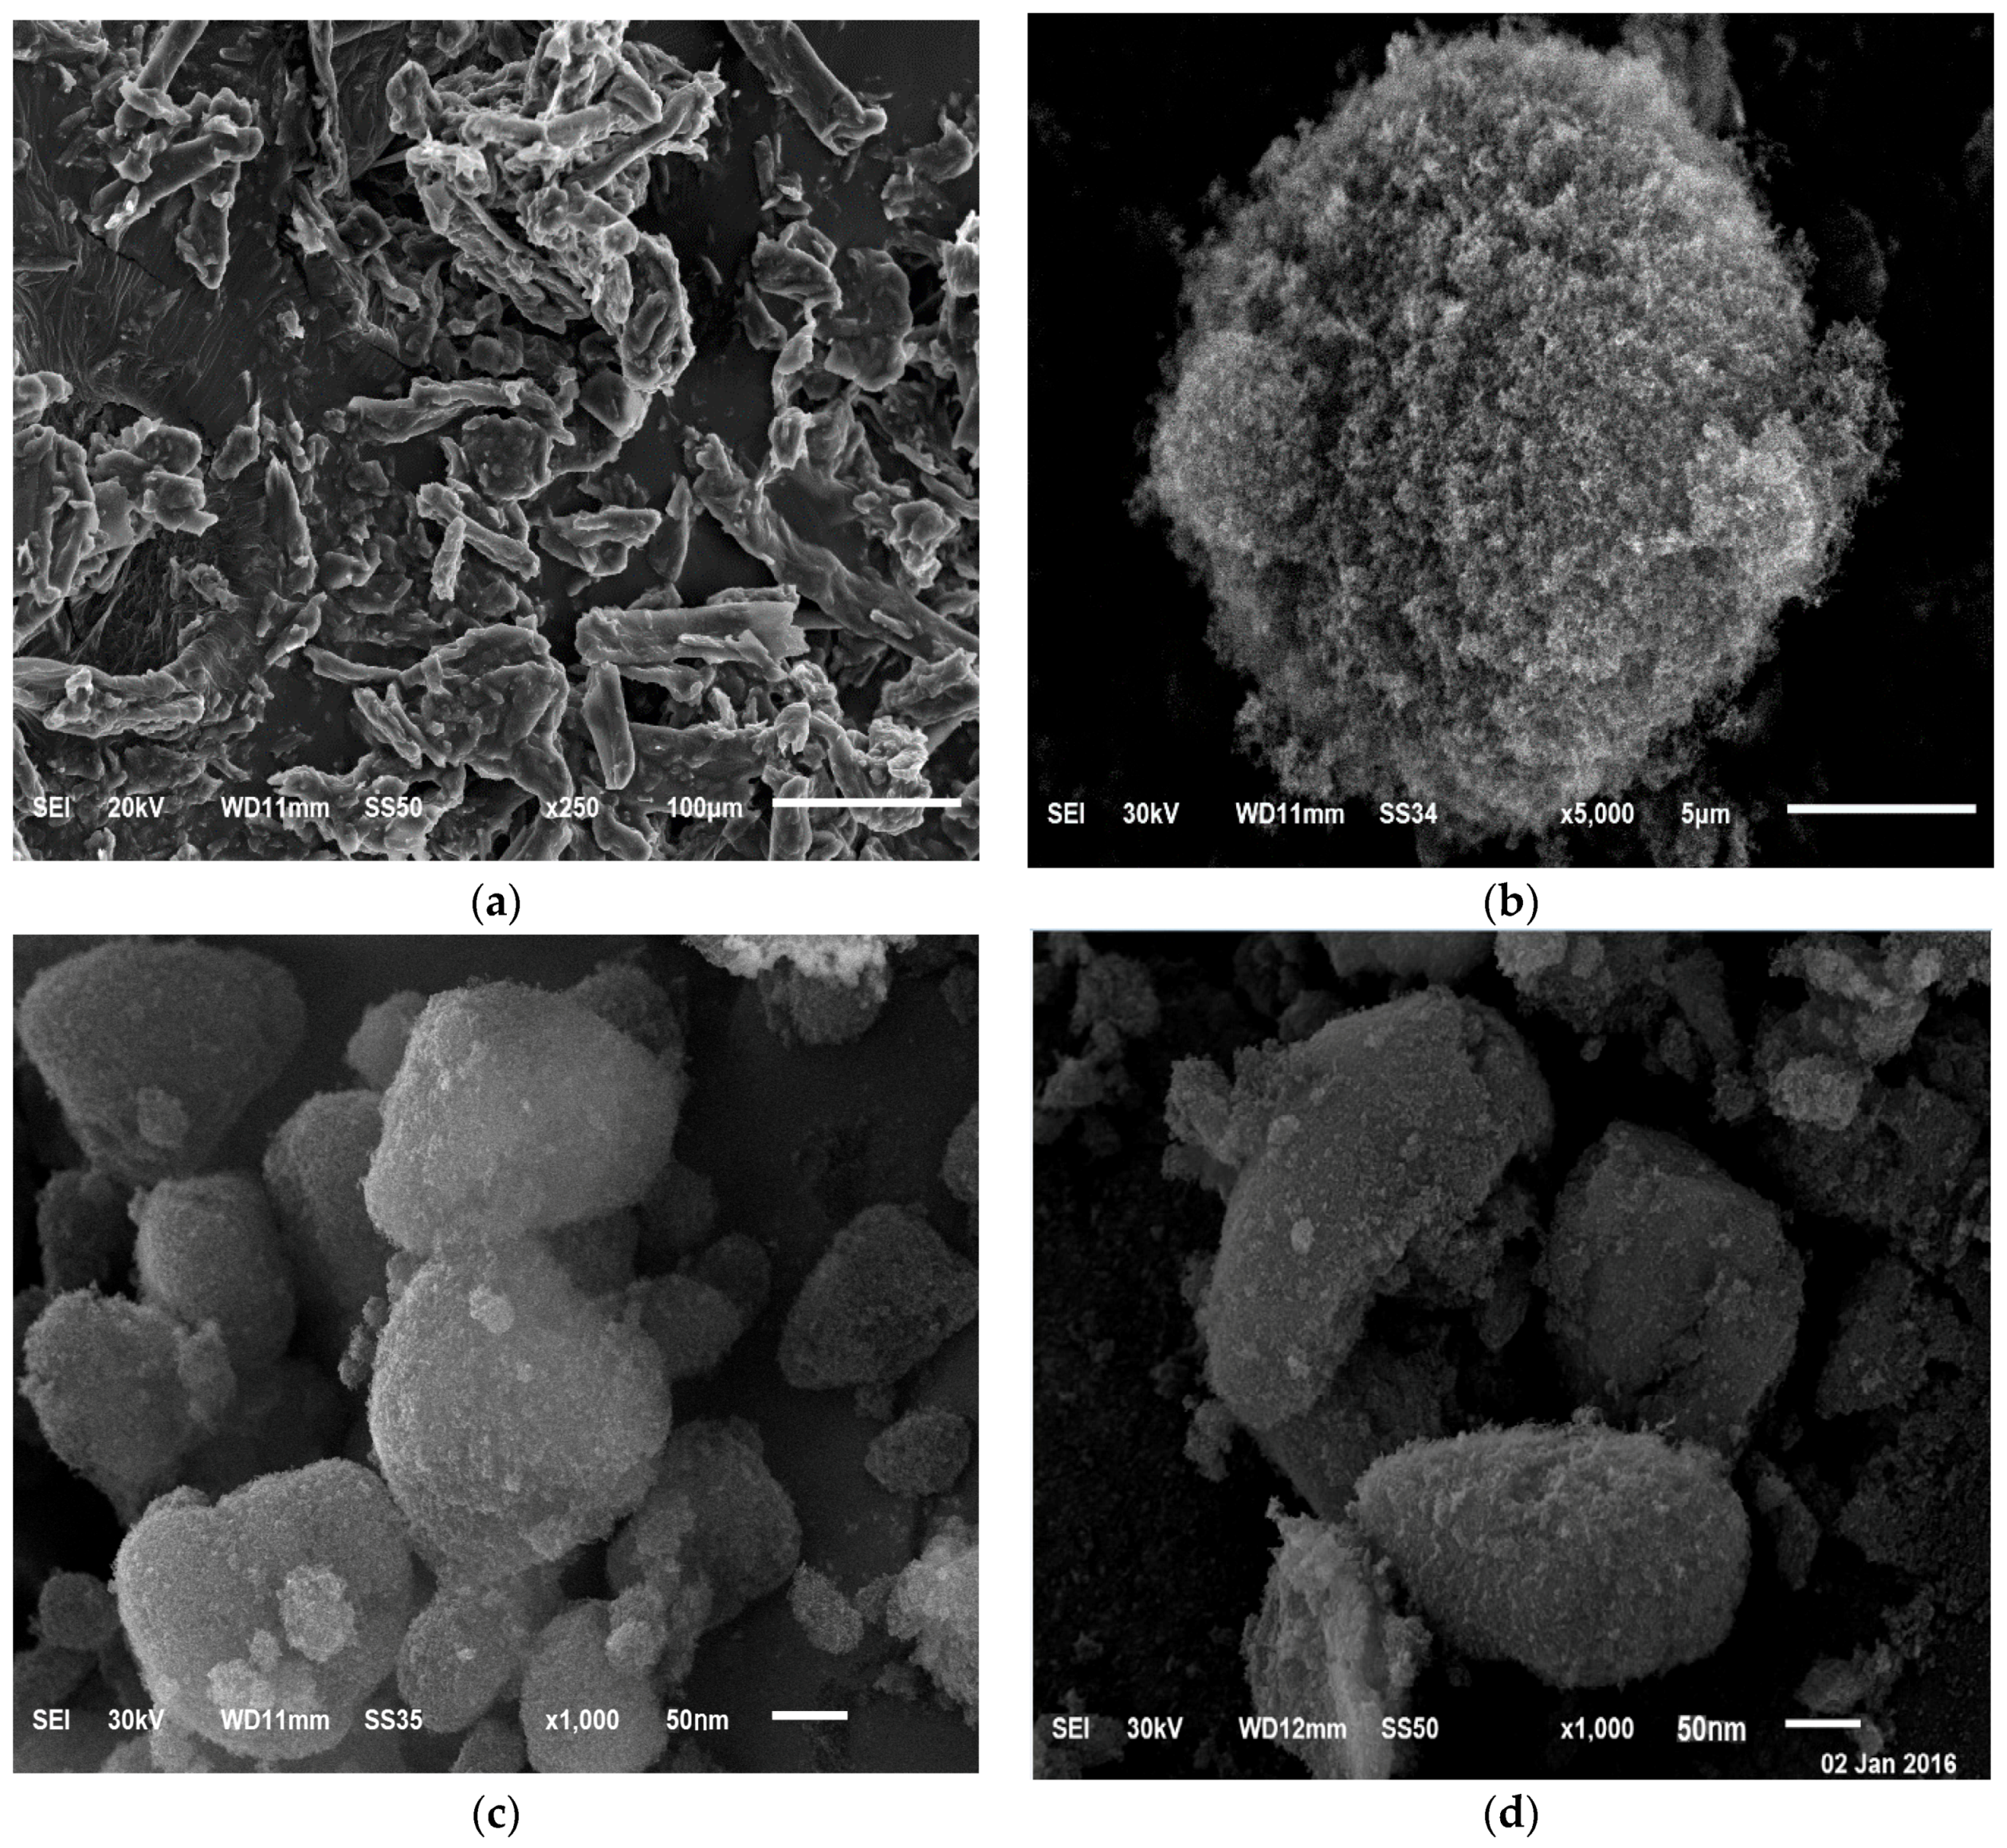
3.4.3. Scanning Electron Microscopy (SEM)
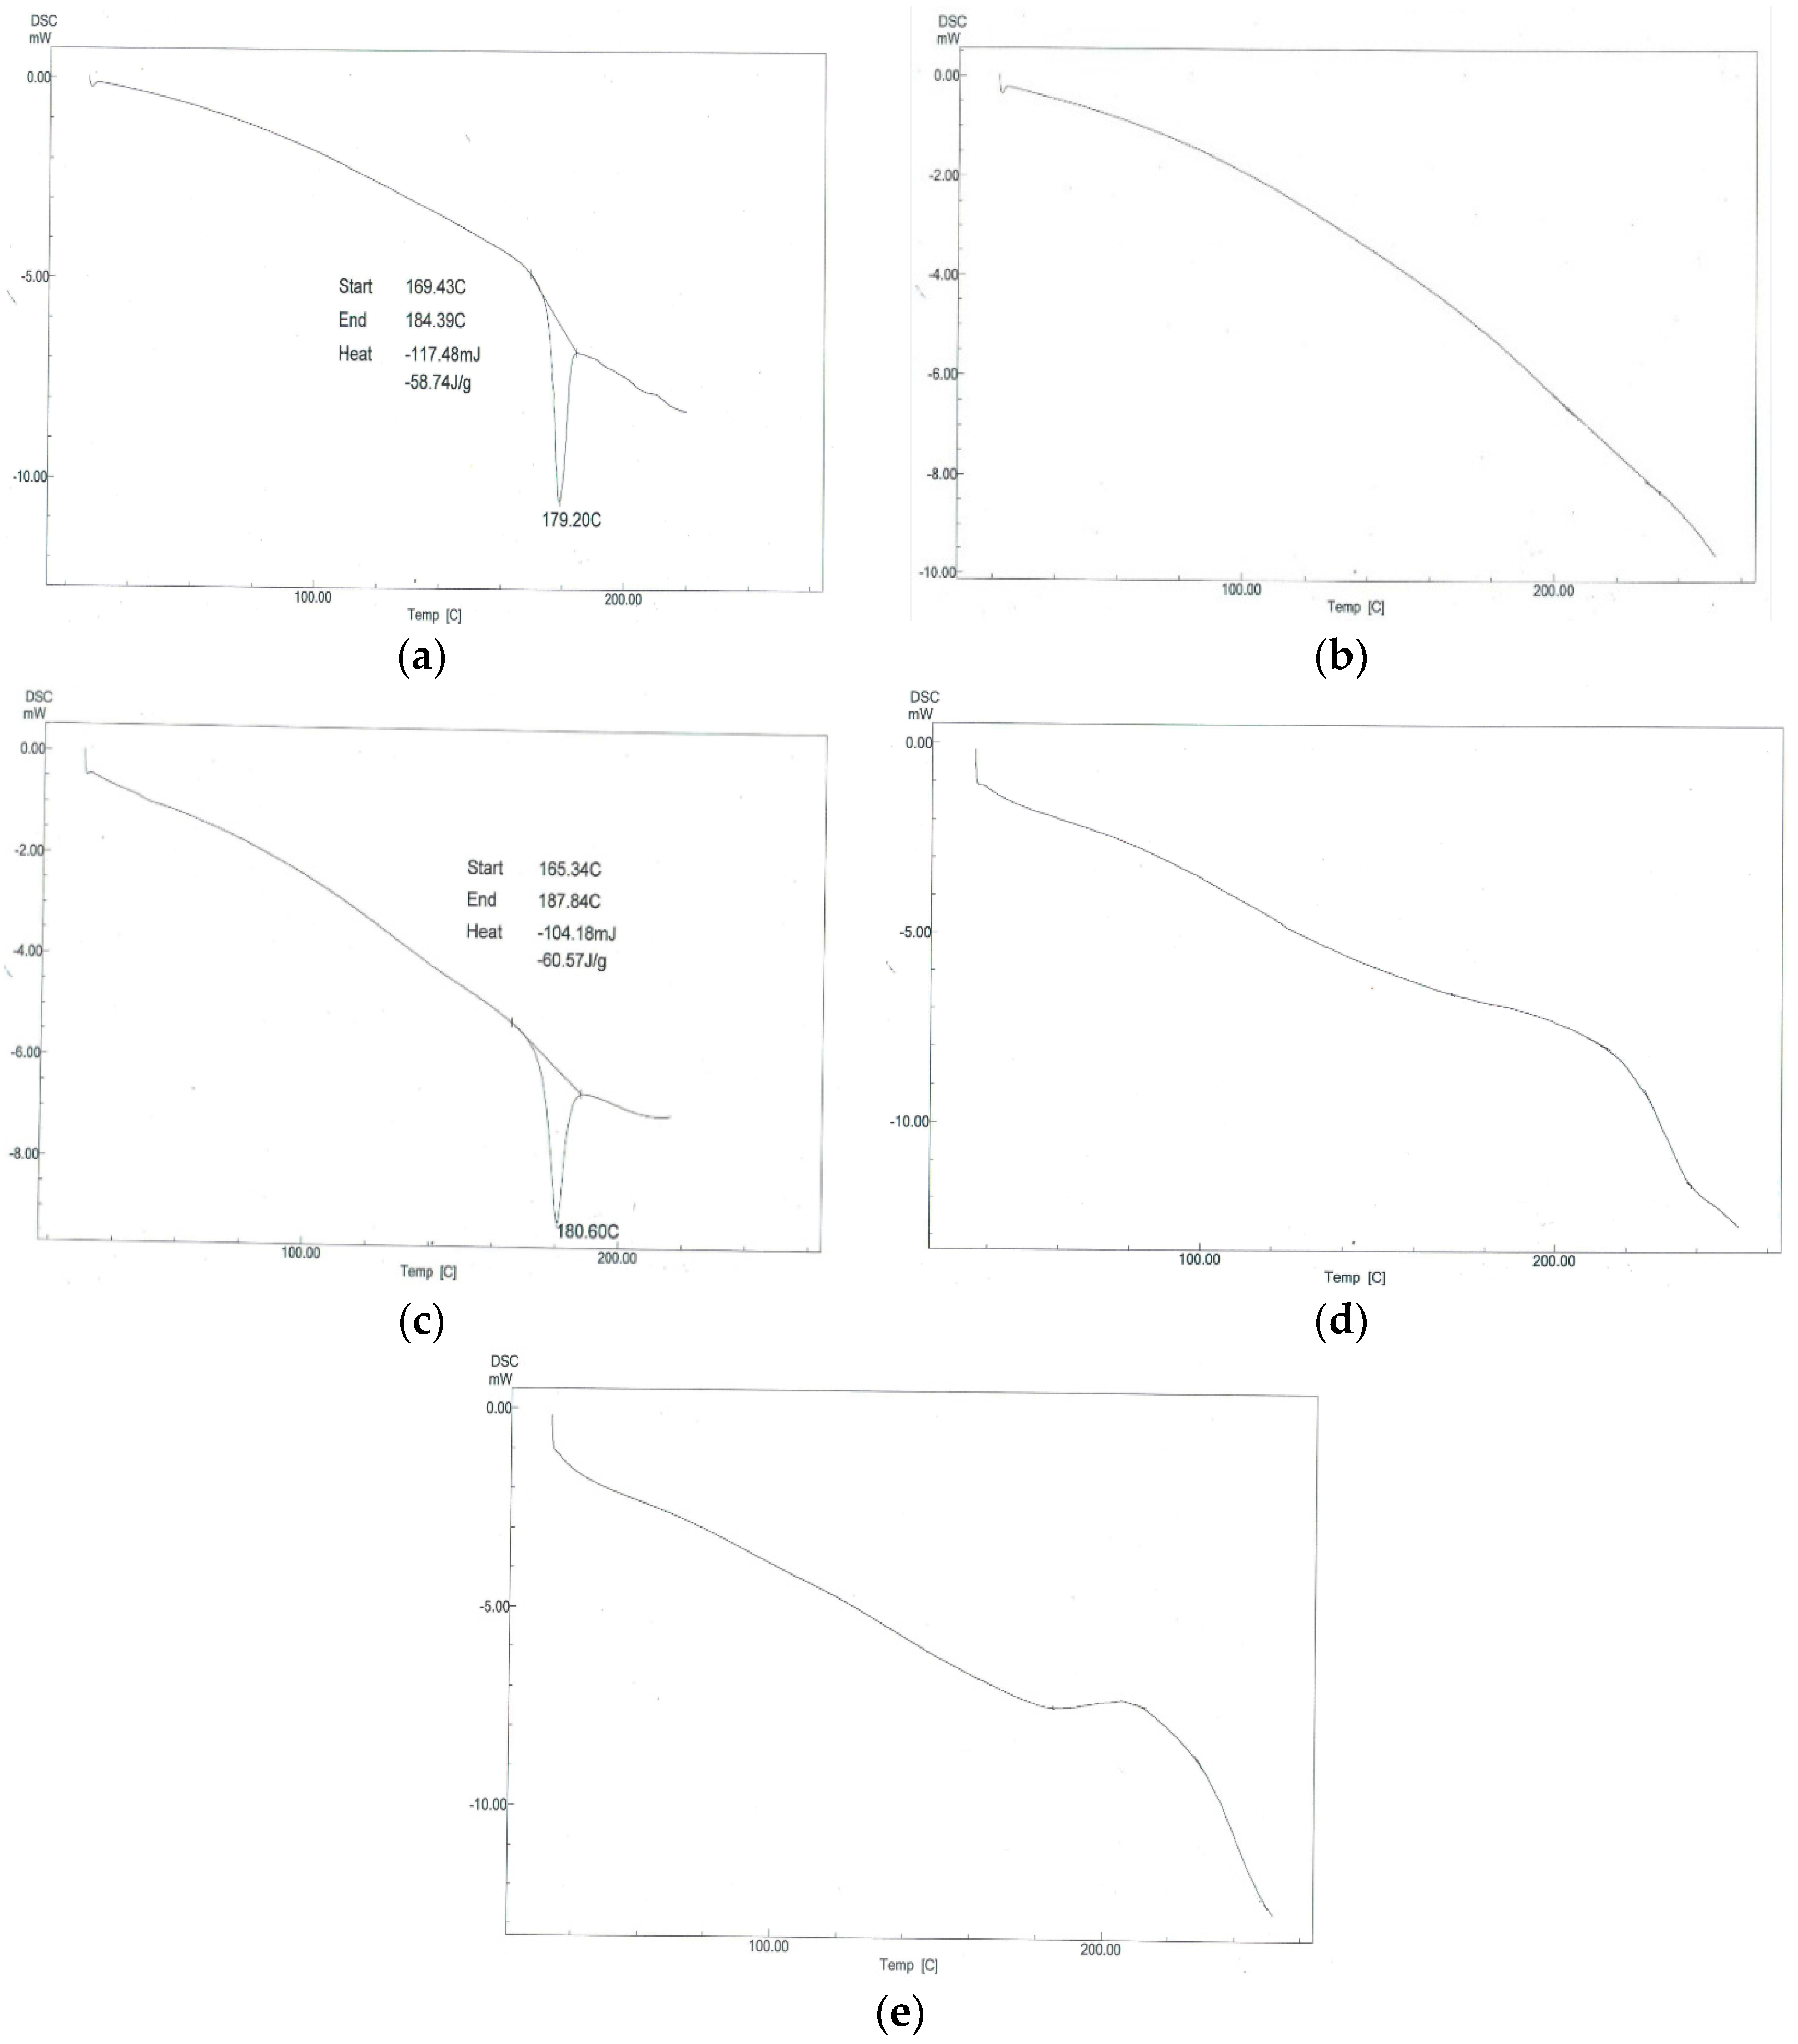
3.4.4. Differential Scanning Calorimetry (DSC)
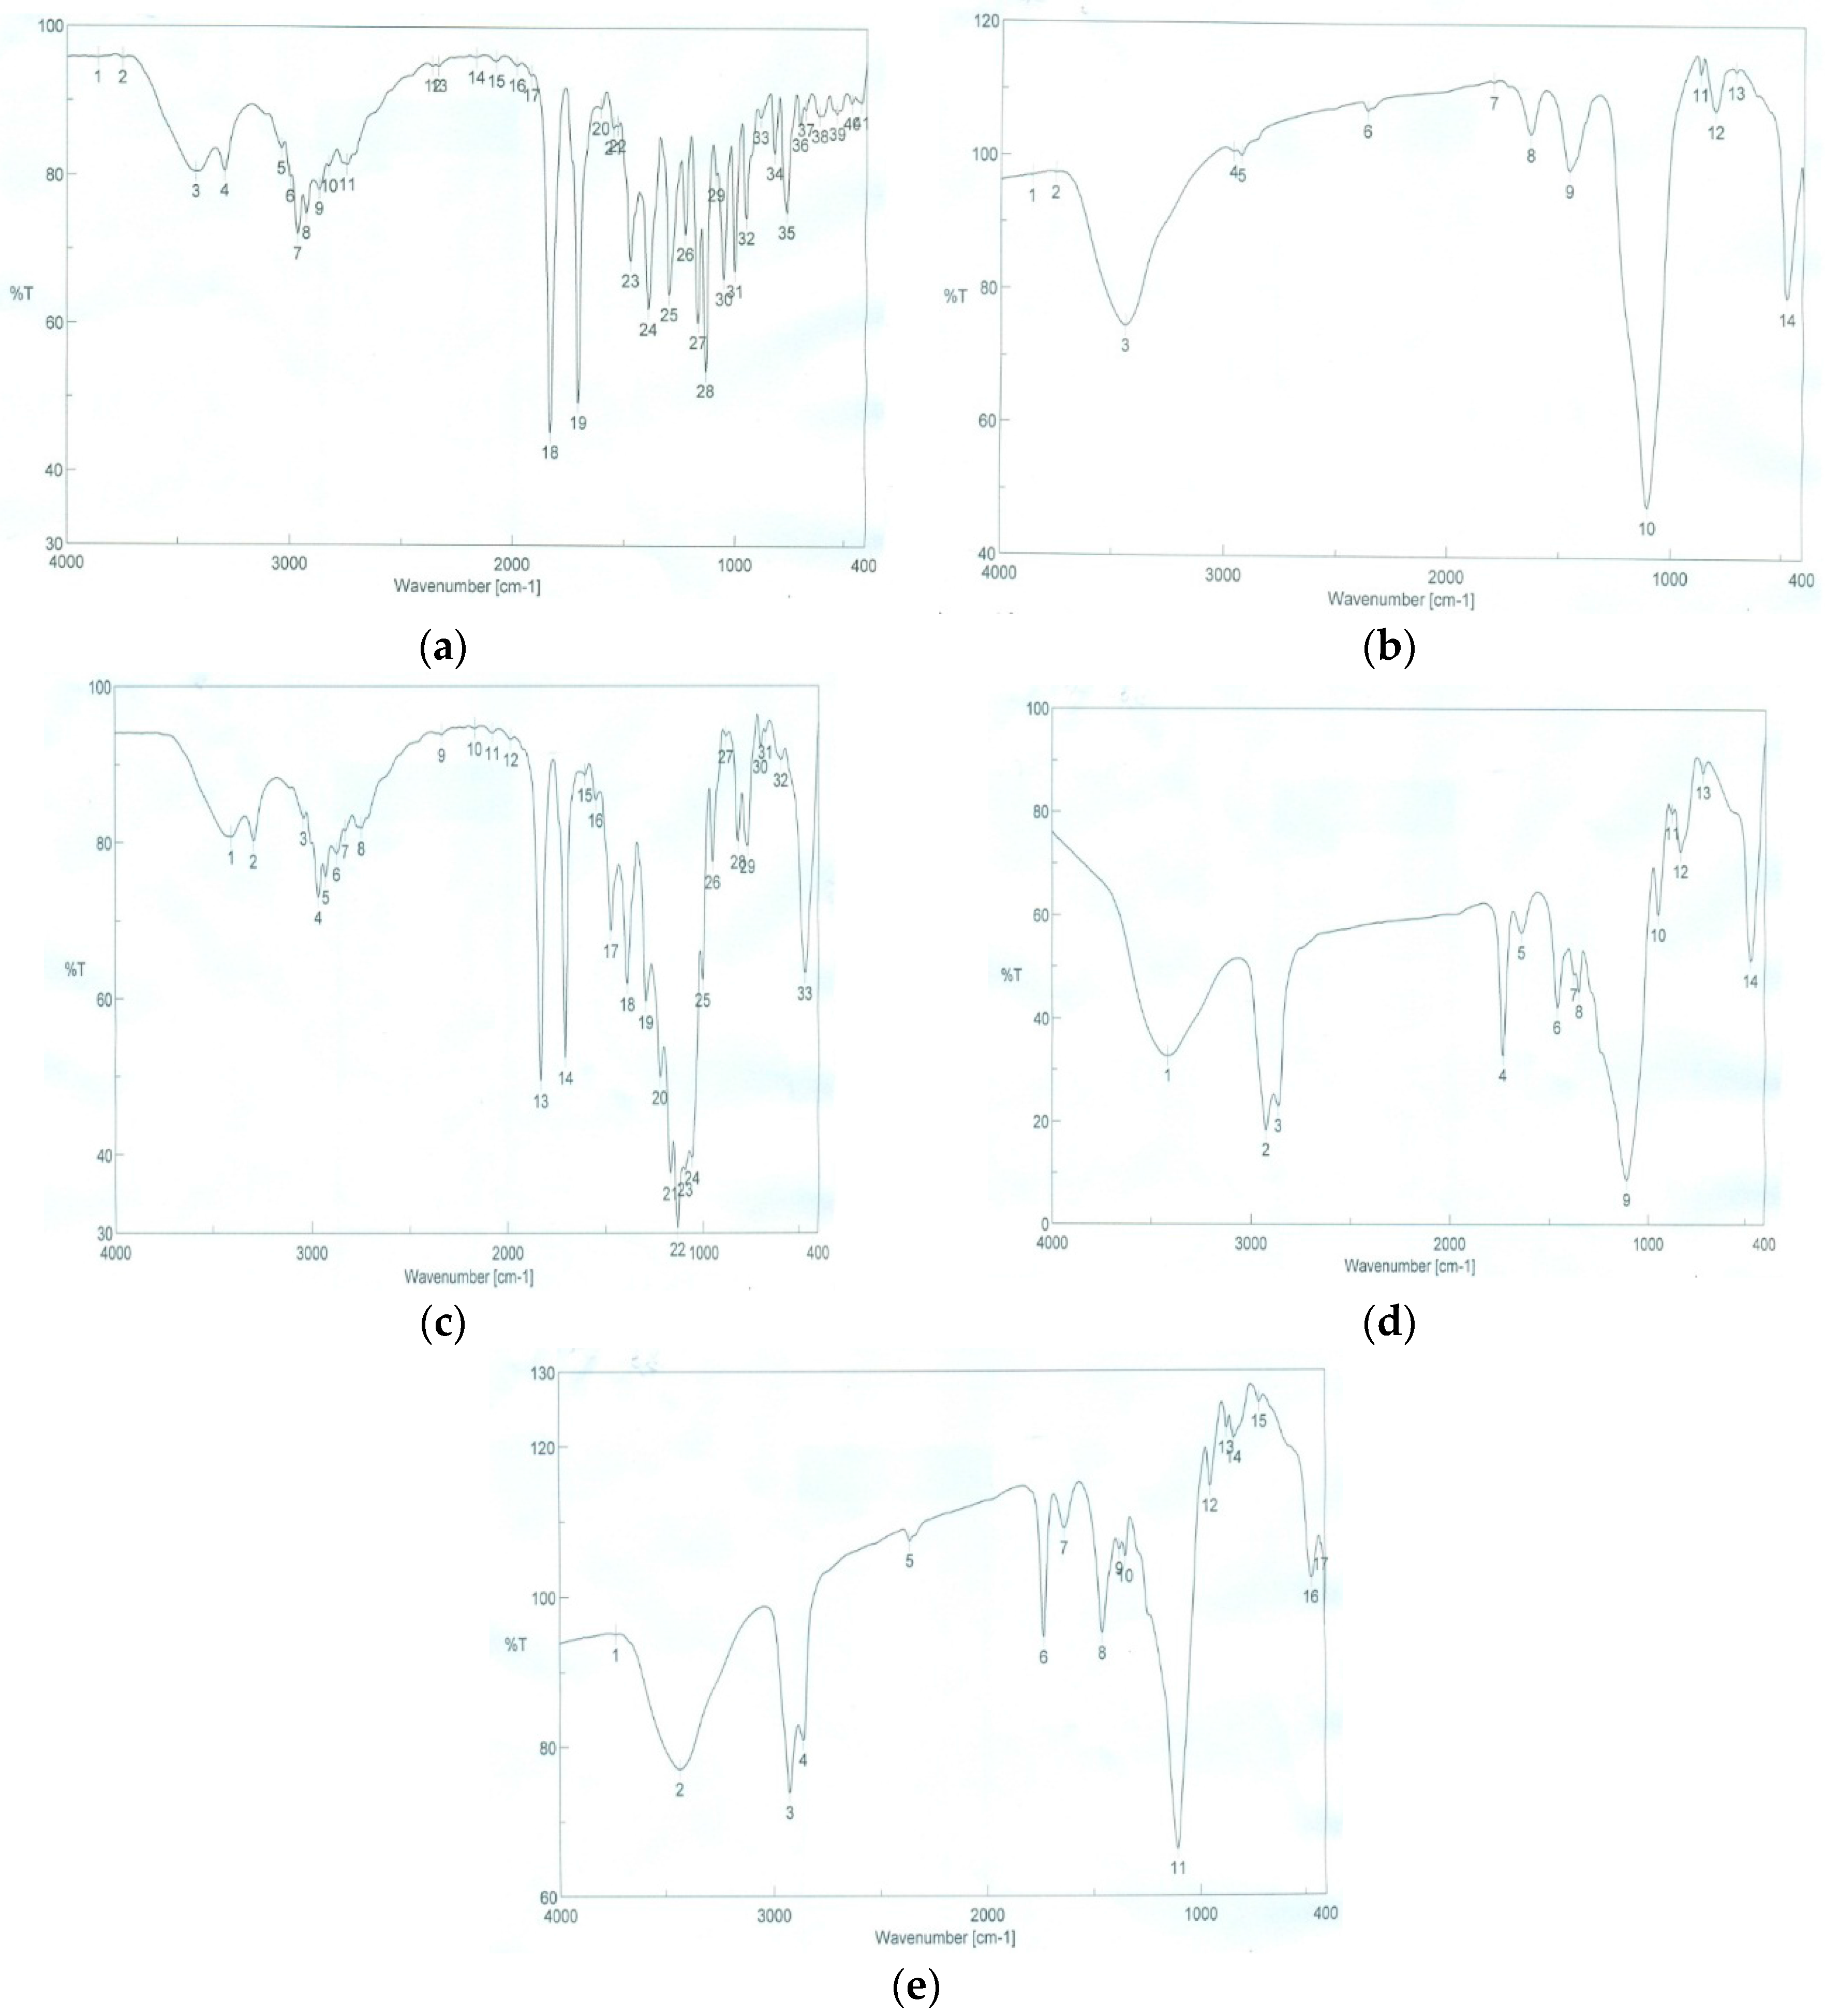
3.4.5. Fourier Transformed Infrared Spectroscopy (FTIR)
3.4.6. Drug Loading Efficiency
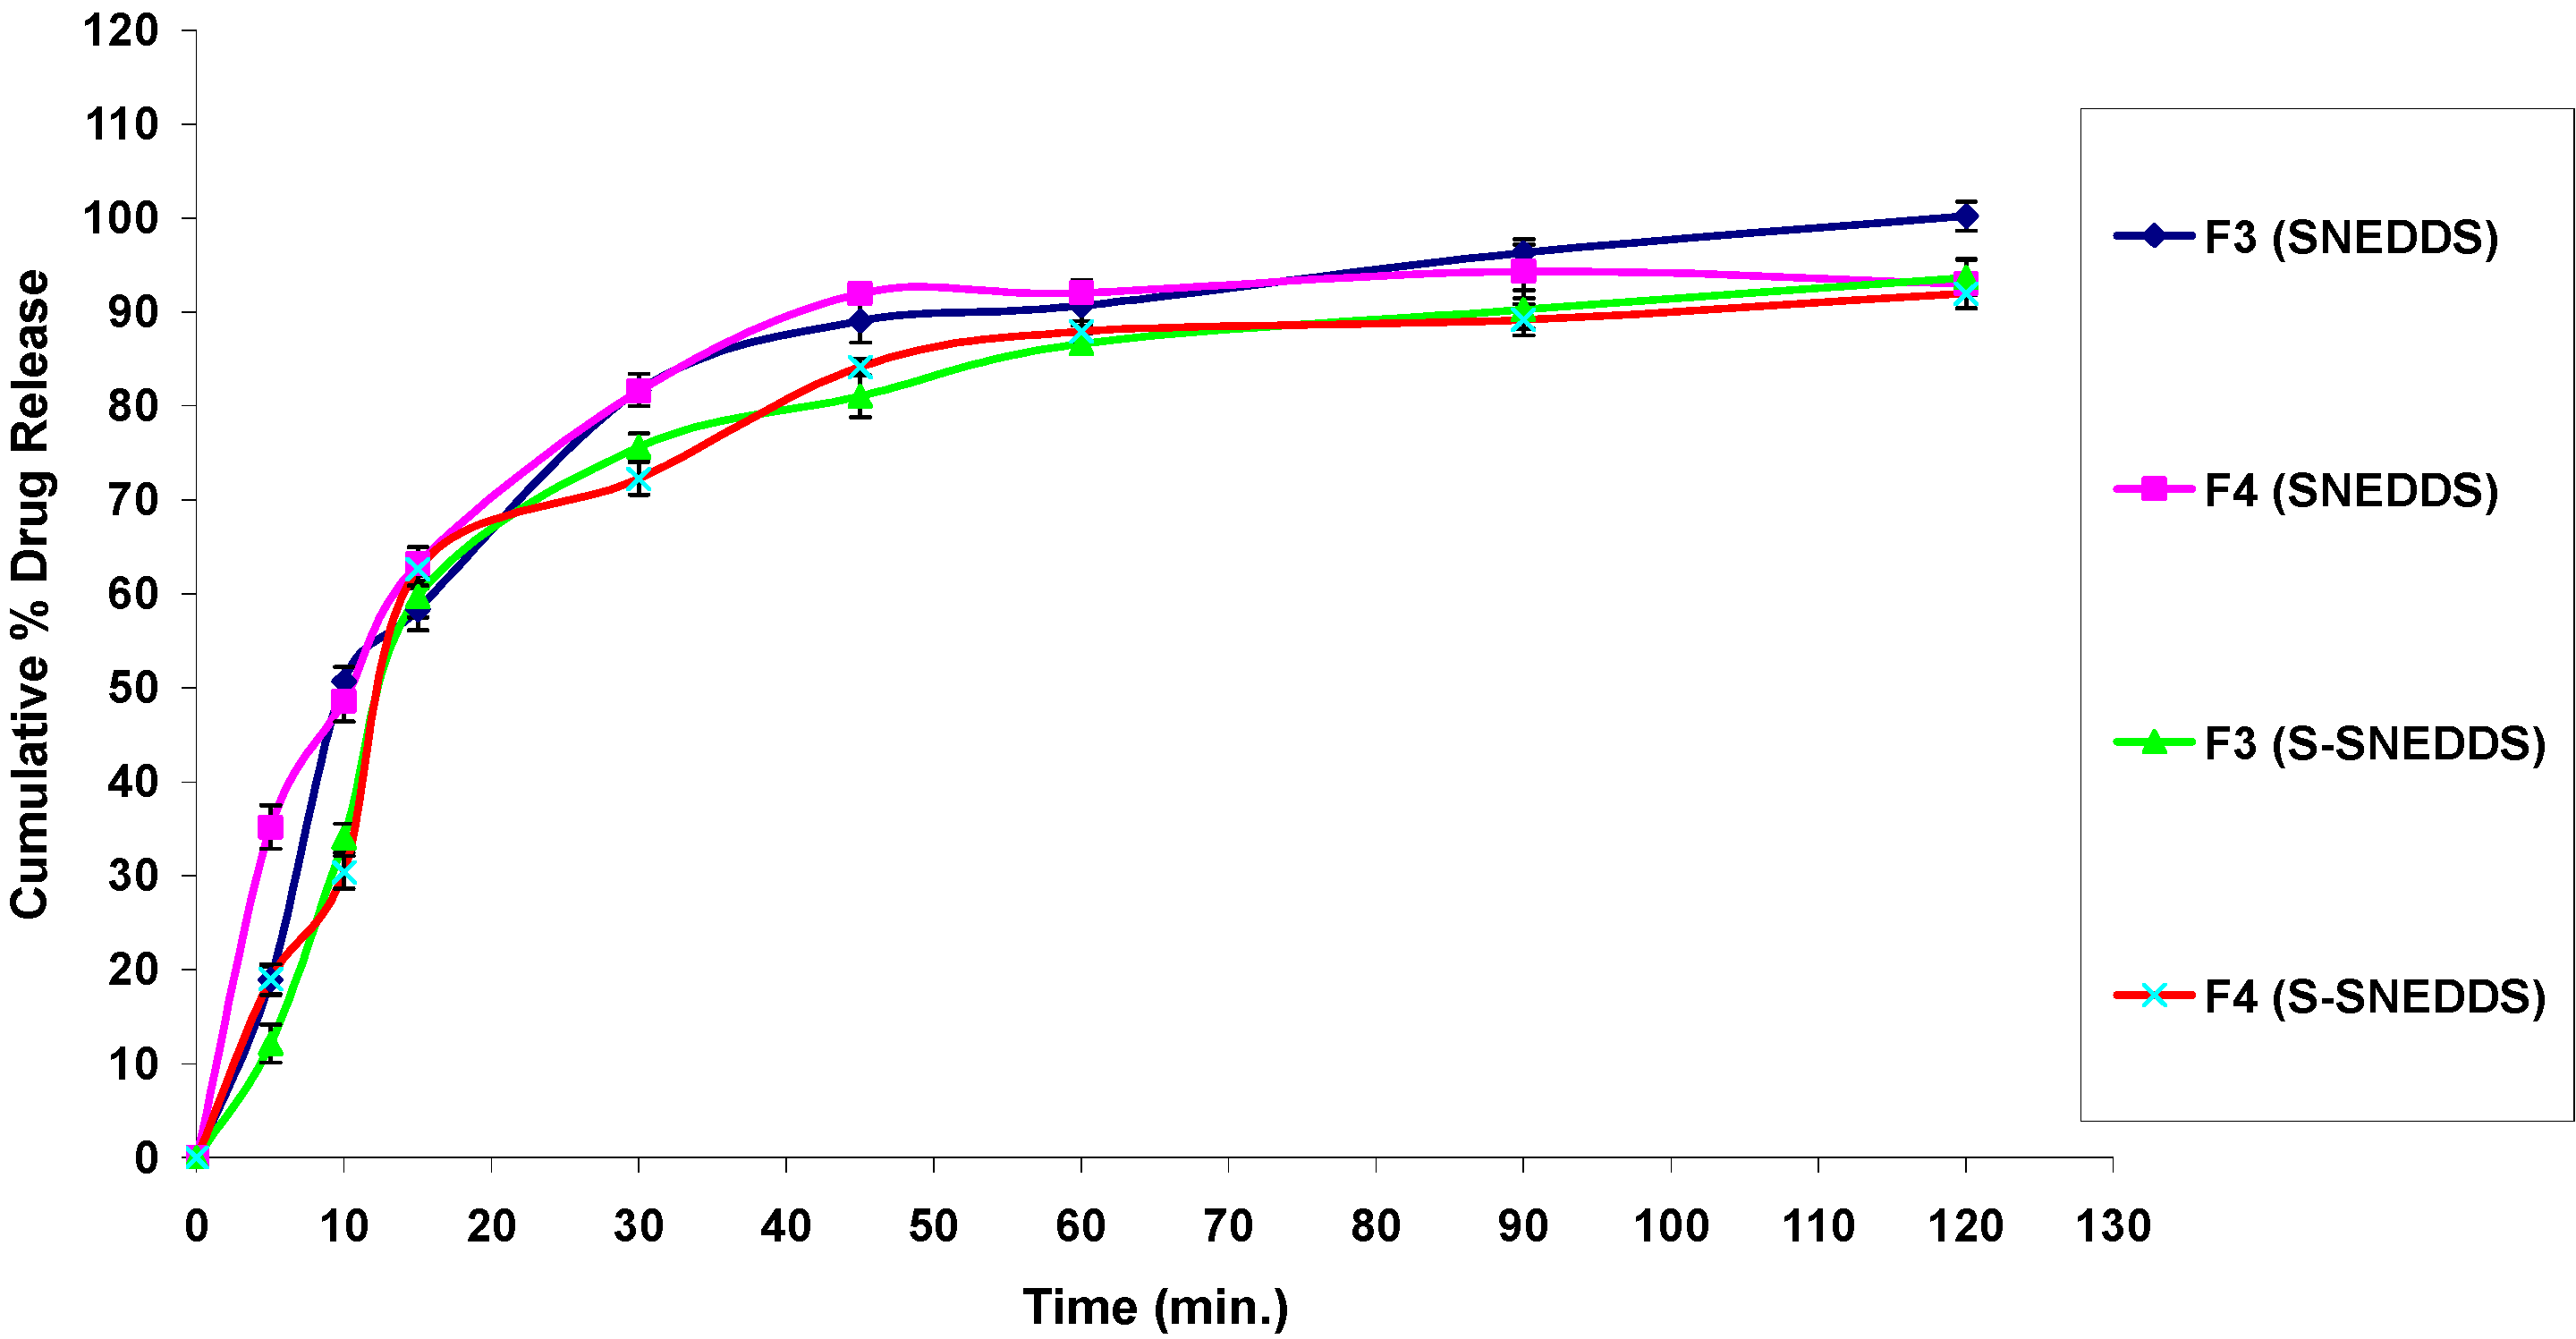
3.4.7. In Vitro Drug Release Studies
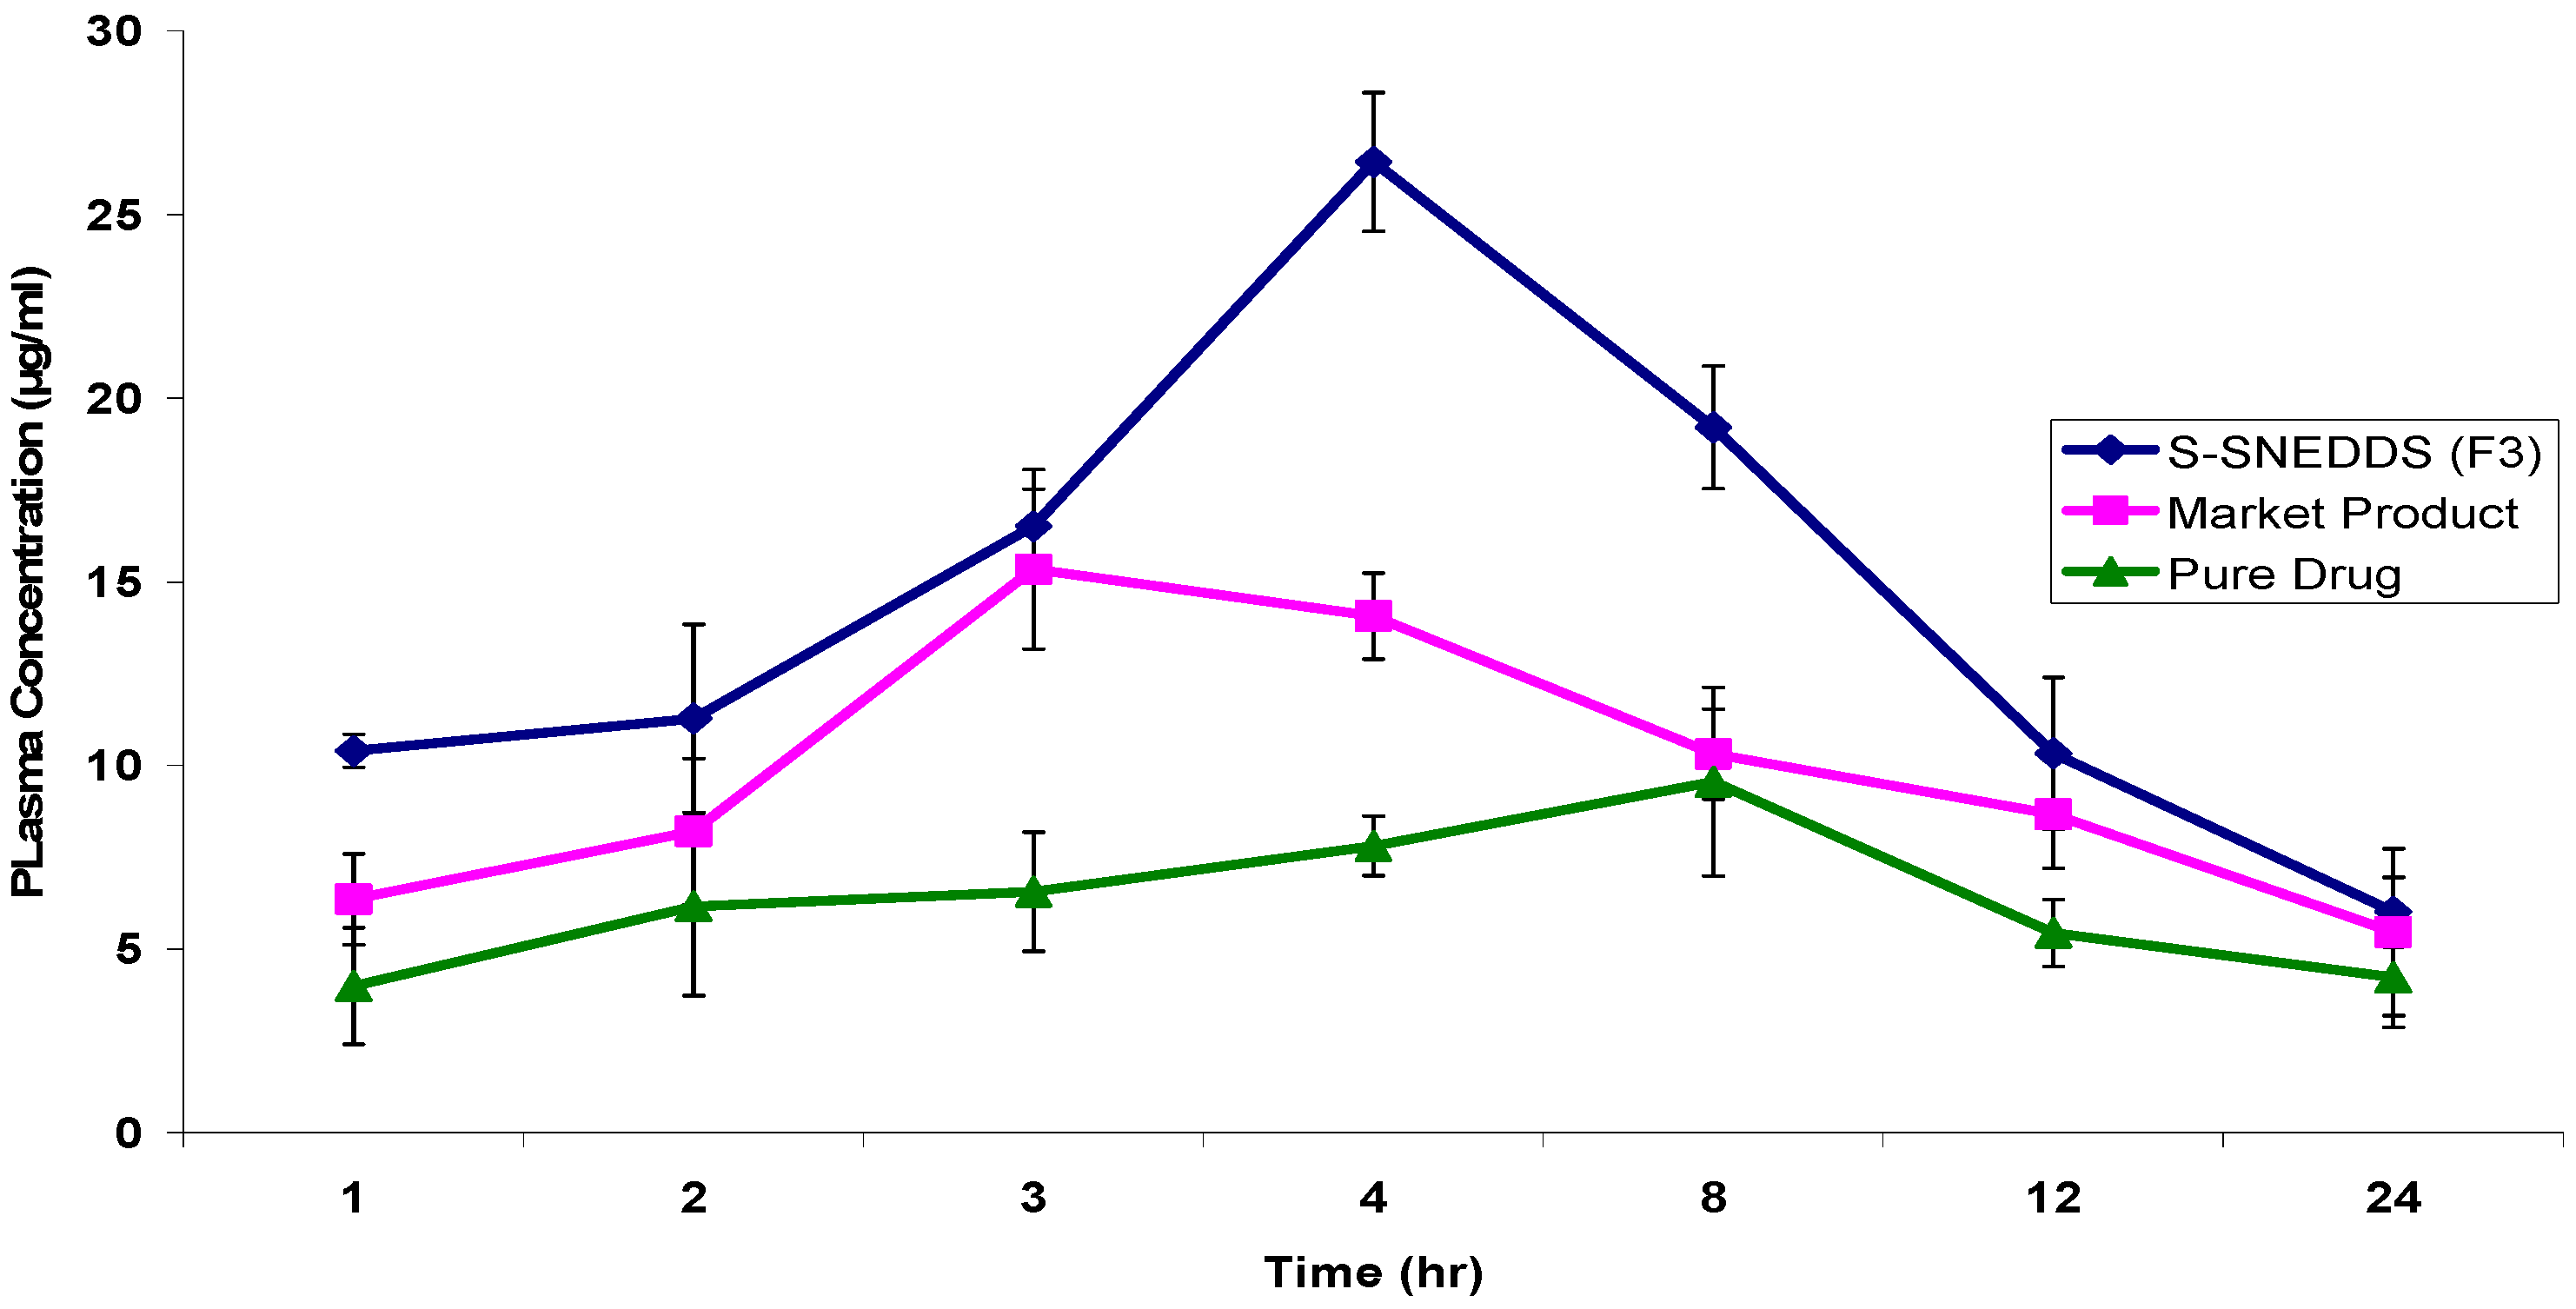
3.4.8. Pharmacokinetic Study
4. Conclusions
Author Contributions
Conflicts of Interest
References
- Desai, P.; Date, A.; Patravale, B. Overcoming poor oral bioavailability using nanoparticle formulations—Opportunities and limitations. Drug Discov. Today 2012, 9, 87–95. [Google Scholar] [CrossRef] [PubMed]
- Wang, Z.; Sun, J.; Wang, Y.; Liu, X.; Liu, Y.; Fu, Q. Preparation and in-vitro/in-vivo evaluation of solid self-emulsifying nitrendipine pellets. Int. J. Pharm. 2010, 383, 1–6. [Google Scholar] [CrossRef] [PubMed]
- Pathak, K.; Raghuvanshi, S. Oral bioavailability: Issues and solutions via nanoformulations. Clin. Pharmacokinet. 2015, 54, 325–357. [Google Scholar] [CrossRef] [PubMed]
- Robertis, S.; Bonferoni, M.; Elviri, L.; Sandri, G.; Caramella, C.; Bettini, R. Advances in oral controlled drug delivery: The role of drug-polymer and interpolymer non-covalent interactions. Expert Opin. Drug Deliv. 2015, 12, 441–453. [Google Scholar] [CrossRef] [PubMed]
- Shafiq, S.; Shakeel, F.; Talegaonkar, S.; Ahmad, F.; Khar, R.; Ali, M. Development and bioavailability assessment of ramipril nanoemulsion formulation. Eur. J. Pharm. Biopharm. 2007, 66, 227–243. [Google Scholar] [CrossRef] [PubMed]
- Shen, H.; Zhong, M. Preparation and evaluation of self-microemulsifying drug delivery systems (SMEDDS) containing atorvastatin. J. Pharm. Pharmacol. 2006, 58, 1183–1191. [Google Scholar] [CrossRef] [PubMed]
- Hiral, A.; Ami, Y.; Ramesh, B.; Jalpa, S.; Tank, H. Self-nano emulsifying drug delivery system (SNEDDS): Future aspects. Asian J. Pharm. Res. 2013, 3, 21–27. [Google Scholar]
- Iosio, T.; Voinovich, D.; Grassi, M.; Pinto, J.; Perissutti, B.; Zacchigna, M. Bi-layered self-emulsifying pellets prepared by co-extrusion and spheronization: Influence of formulation variables and preliminary study on the in vivo absorption. Eur. J. Pharm. Biopharm. 2008, 69, 686–697. [Google Scholar] [CrossRef] [PubMed]
- Yi, T.; Wan, J.; Xu, H.; Yang, X. A new solid self-microemulsifying formulation prepared by spray-drying to improve the oral bioavailability of poorly water soluble drugs. Eur. J. Pharm. Biopharm. 2008, 70, 439–444. [Google Scholar] [CrossRef] [PubMed]
- Tang, B.; Cheng, G.; Jian, G.; Cai, X. Development of solid self-emulsifying drug delivery systems: Preparation techniques and dosage forms. Drug Discov. Today. 2008, 13, 606–612. [Google Scholar] [CrossRef] [PubMed]
- Chen, Y.; Li, G.; Wu, X.; Chen, Z.; Hang, J.; Qin, B. Self-microemulsifying drug delivery system (SMEDDS) of Vinpocetine: Formulation, development and in vivo assessment. Biol. Pharm. Bull. 2008, 31, 118–125. [Google Scholar] [CrossRef] [PubMed]
- Kang, B.; Lee, J.; Chon, S. Development of selfmicroemulsifying drug delivery systems (SMEDDS) for oral bioavailability enhancement of simvastatin in beagle dogs. Int. J. Pharm. 2004, 274, 65–73. [Google Scholar] [CrossRef] [PubMed]
- Wang, L.; Dong, J.; Chen, J.; Eastoe, J.; Li, X. Design and optimization of a new self-nanoemulsifying drug delivery system. J. Colloid Interface Sci. 2009, 330, 443–448. [Google Scholar] [CrossRef] [PubMed]
- Ishida, M.; Tawa, R.; Shibata, N.; Takada, K. Oral solid gentamicin preparation using emulsifier and adsorbent. J. Control. Release 2005, 105, 23–31. [Google Scholar]
- Nakagomi, R.; Nakai, D.; Kawai, K.; Yoshigae, Y.; Tokui, T.; Abe, T.; Ikeda, T. Hepatobiliary transport of olmesartan, A novel angiotensin II blocker. Drug Metab. Dispos. 2006, 34, 862–869. [Google Scholar] [CrossRef] [PubMed]
- Dixit, R.; Nagarsenker, M. Design, optimization and evaluation of self-nanoemulsifying granules of ezetimibe. Eur. J. Pharm. Sci. 2008, 35, 92–183. [Google Scholar] [CrossRef] [PubMed]
- Srinivas, C.; Sagar, S. Enhancing the bioavailability of simvastatin using micro emulsion drug delivery system. Asian J. Pharm. Clin. Res. 2012, 5, 134–139. [Google Scholar]
- Date, A.; Nagarsenker, M. Design and evaluationof self-nanoemulsifying drug delivery systems (SNEDDS) for cefpodoxime proxetil. Int. J. Pharm. 2007, 329, 166–172. [Google Scholar] [CrossRef] [PubMed]
- Patel, A.; Vavia, P. Preparation and in vivo evaluation of SMEDDS (self-microemulsifying drug delivery system) containing fenofibrate. AAPS J. 2007, 9, 344–352. [Google Scholar] [CrossRef] [PubMed]
- Divyakumar, B.; Priyanka, B.; Kiran, B. Formulation and evaluation of self microemulsifying drug delivery system of low solubility drug for enhanced solubility and dissolution. Asian J. Biomed. Pharm. Sci. 2012, 2, 7–14. [Google Scholar]
- Atef, E.; Belmonte, A. Formulation, in-vitro and in-vivo characterization of Phenytoin self-emulsifying drug delivery system. Eur. J. Pharm. Sci. 2008, 35, 257–263. [Google Scholar] [CrossRef] [PubMed]
- Ehab, I.; Saleh, A.; Ahmed, M.; Mansoor, A. Preparation and in-vitro characterization of self-nanoemulsified drug delivery system (SNEDDS) of all-trans-retinol acetate. Int. J. Pharm. 2004, 285, 109–119. [Google Scholar]
- Chopade, V.; Chaudhari, P. Development and evaluation of self emulsifying drug delivery system for lornoxicam. Int. J. Res. Dev. Pharm. Life Sci. 2013, 2, 531–537. [Google Scholar]
- Nekkanti, V.; Karatgi, P.; Prabhu, R.; Pillai, R. Solid self-microemulsifying formulation for candesartan cilexetil. AAPS PharmSciTech 2010, 11, 9–17. [Google Scholar] [CrossRef] [PubMed]
- Khoo, S.; Humberstone, A.; Porter, C.; Edwards, G.; Charman, W. Formulation, design and bioavailability assessment of lipidic self-emulsifying formulations of halofantrine. Int. J. Pharm. 1998, 167, 155–164. [Google Scholar] [CrossRef]
- Balakrishnan, P.; Lee, B.; Oh, D.; Kim, J.; Hong, M.; Jee, J.P.; Kim, J.A.; Yoo, B.; Woo, J.; Yong, C.; et al. Enhanced oral bioavailability of coenzyme Q10 by a novel solid self-emulsifying drug delivery system. Int. J. Pharm. 2009, 374, 66–72. [Google Scholar] [CrossRef] [PubMed]
- Ghosh, P.; Majithiya, R.; Umrethia, M.; Murthy, S. Design and development of microemulsion drug delivery system of acyclovir for improvement of oral bioavailability. AAPS PharmSciTech 2006, 7, 172–177. [Google Scholar] [CrossRef] [PubMed]
- Balakrishnan, P.; Lee, J.; Oh, D. Enhanced oral bioavailability of dexibuprofen by a novel solid self-emulsifying drug delivery system (SEDDS). Eur. J. Pharm. Biopharm. 2009, 72, 539–545. [Google Scholar] [CrossRef] [PubMed]
- Zakia, B.; Suyang, Z.; Wenli, Z.; Junlin, W. Formulation, development and bioavailability evaluation of a self-nanoemulsifying drug delivery system (SNEDDS) of Atorvastatin calcium. Int. J. Pharm. 2013, 29, 1103–1113. [Google Scholar]
- Arpan, C.; Vineetkumar, P.; Manish, N.; Kamala, V.; Chamanlal, S. A novel lipid-based oral drug delivery system of Nevirapine. Int. J. PharmTech Res. 2011, 3, 1159–1168. [Google Scholar]
- Odeberg, J.; Kaufmann, P.; Kroon, K.; Hoglund, P. Lipid drug delivery and rational formulation design for lipophilic drugs with low oral bioavailability, applied to Cyclosporine. Eur. J. Pharm. Sci. 2003, 20, 375–382. [Google Scholar] [CrossRef] [PubMed]
- Alaa, A.; Maha, A.; Amal, A.; Ghada, H. Preparation and in vitro evaluation of self-nanoemulsifying drug delivery systems (SNEDDS) containing Clotrimazole. Drug Discov. Ther. 2010, 4, 373–379. [Google Scholar]
- Hussein, A. Preparation and evaluation of liquid and solid self-microemulsifying drug delivery system of mebendazole. Iraqi J. Pharm. Sci. 2014, 23, 89–100. [Google Scholar]
- Dong, Y.; Jung, A.; Kyung, K.; Bong, K.; Chul, S.; Han, G. Enhanced oral bioavailability of Curcumin via a solid lipid-based self-emulsifying drug delivery system using a spray-drying technique. Biol. Pharm. Bull. 2011, 34, 1179–1186. [Google Scholar]
- Sarwar, B.; Katare, O.; Sumant, S.; Singh, B. Solid self-nanoemulsifying systems of olmesartan medoxomil: Formulation development, micromeritic characterization, in vitro and in vivo evaluation. Powder Technol. 2016, 294, 93–104. [Google Scholar]
- Bhagwat, A.; D’Souza, I. Formulation and evaluation of solid SMEDDS using Aerosil 200 as solid carrier. Int. Curr. Pharm. J. 2012, 12, 414–419. [Google Scholar]
- Surender, R.; Mahalaxmi, R.; Srinivas, P.; Deepak, K.; Kumar, A.; Sneh, P. Self-emulsifying systems of Aceclofenac by extrusion/Spheronization: Formulation and evaluation. J. Chem. Pharm. Res. 2011, 3, 280–289. [Google Scholar]
- Reddy, M.; Rehana, T.; Ramakrishna, S.; Chowdary, K.; Prakash, V. β-Cyclodextrin complexes of celecoxib: Molecular-modeling, characterization, and dissolution studies. AAPS PharmSciTech 2004, 6, 68–76. [Google Scholar] [CrossRef] [PubMed]
- Tang, J. Self-Emulsifying drug delivery systems: Strategy for improving oral delivery of poorly soluble drugs. Curr. Drug Ther. 2007, 2, 85–93. [Google Scholar] [CrossRef]
- Shailesh, T.; Harsh, A.; Chhaganbhai, N. Preparation and characterization of self microemulsifying drug delivery system of olmesartan medoxomil for bioavailability improvement. J. Pharm. 2013, 2013, 1–9. [Google Scholar]
- Naseem, A.; Sushama, T.; Roop, K.; Manu, J. Self-nanoemulsifying lipid carrier system for enhancement of oral bioavailability of Etoposide by P-Glycoprotein modulation: In-vitro cell line and in-vivo pharmacokinetic investigation. J. Biomed. Nanotechnol. 2013, 9, 1216–1229. [Google Scholar]
- Humberstone, A.; Charman, W. Lipid based vehicles for oral delivery of poorly water soluble drugs. Adv. Drug Deliv. Rev. 2008, 25, 103–128. [Google Scholar] [CrossRef]
- Charman, S.; Charman, W.; Rogge, M.; Wilson, T.; Dutko, F.; Pouton, C. Self-emulsifying drug delivery systems: Formulation and biopharmaceutical evaluation of an investigational lipophilic compound. Pharm. Res. 1992, 9, 87–93. [Google Scholar] [CrossRef] [PubMed]
- Azeem, A.; Rizwan, M.; Ahmad, F.; Iqbal, Z.; Khar, R.; Aqil, M.; Talegaonkar, S. Nanoemulsion components screening and selection: A technical note. AAPS PharmSciTech. 2009, 10, 69–76. [Google Scholar] [CrossRef] [PubMed]
- Elnaggar, Y.; El-Massik, M.; Abdallah, Y. Self-nanoemulsifying drug delivery systems of Tamoxifen citrate: Design and Optimization. Int. J. Pharm. 2009, 380, 133–141. [Google Scholar] [CrossRef] [PubMed]
- Anuradha, S.; Pratikkumar, A.; Darshana, H. Peppermint oil based drug delivery system of aceclofenac with improved anti-inflammatory activity and reduced Ulcerogenecity. Int. J. Pharm. Biosci. Technol. 2013, 1, 89–101. [Google Scholar]
- Farinato, R.; Rowell, R. Optical properties of emulsions. In Encyclopedia of Emulsion Technology; Marcel Dekker: New York, NY, USA, 2000; Volume 1, pp. 439–479. [Google Scholar]
- Lawrence, M. Microemulsions as drug delivery vehicles. Curr. Opin. Colloid Interface Sci. 1996, 1, 826–832. [Google Scholar] [CrossRef]
- Chen, M. Lipid excipients and delivery systems for pharmaceutical development: A regulatory perspective. Adv. Drug Deliv. Rev. 2008, 60, 768–777. [Google Scholar] [CrossRef] [PubMed]
- Pouton, C. Lipid formulations for oral administration of drugs: Non-emulsifying, self-emulsifying and self-microemulsifying drug delivery systems. Eur. J. Pharm. Sci. 2000, 11, 93–98. [Google Scholar] [CrossRef]
- Spernath, A.; Yaghmur, A.; Aserin, A.; Hoffman, R.; Garti, N. Food-grade microemulsions based on nonionic emulsifiers: Media to enhance Lycopene solubilization. J. Agric. Food Chem. 2002, 50, 6917–6922. [Google Scholar] [CrossRef] [PubMed]
- Ashok, K.; Kuldeep, S.; Murugesh, K.; Sriram, R.; Ramesh, M. Formulation and development of an Albendazole self-emulsifying drug delivery system (SEDDS) with enhanced systemic exposure. Acta Pharm. 2012, 62, 563–580. [Google Scholar]
- Lia, P.; Ghosh, A.; Wagner, R.; Krill, S.; Joshi, Y. Effect of combined use of nonionic surfactant on formation of oil-in-water microemulsions. Int. J. Pharm. 2005, 288, 27–34. [Google Scholar] [CrossRef] [PubMed]
- Kallakunta, V.; Bandari, S.; Jukanti, R.; Veerareddy, P. Formulation and evaluation of oral self-emulsifying powder of lercanidipine hydrochloride. Powder Technol. 2012, 221, 375–382. [Google Scholar] [CrossRef]
- Sharma, B.; Sharma, A.; Arora, S.; Gupta, S.; Bishnoi, M. Formulation, optimization and evaluation of novel nanoemulsion formulations for transdermal potential of Celecoxib. Acta Pharm. 2007, 57, 315–323. [Google Scholar]
- Patel, P.; Patel, M.; Patel, k.; Patel, N. Design and development of self-microemulsifying drug delivery system of Clopidogrel bisulphate. Int. J. Pharm. Ind. 2013, 1, 539–553. [Google Scholar]
- Maulik, J.; Natvarlal, M.; Ritesh, B.; Rakesh, P. Self-microemulsion of Lovastatin. Asian J. Pharm. Sci. 2010, 5, 266–275. [Google Scholar]
- Wu, X.; Xu, J.; Huang, X.; Wen, C. Self-microemulsifying drug delivery system improves curcumin dissolution and bioavailability. Drug Dev. Ind. Pharm. 2011, 37, 15–23. [Google Scholar] [CrossRef] [PubMed]
- Nepal, P.; Han, H.; Choi, H. Preparation and in vitro-in vivo evaluation of Witepsol H35 based self-nanoemulsifying drug delivery systems (SNEDDS) of coenzyme Q10. Eur. J. Pharm. Sci. 2010, 39, 224–232. [Google Scholar] [CrossRef] [PubMed]
- Nazzal, S.; Nutan, M.; Palamakula, A.; Shah, R.; Zaghloul, A.; Khan, M. Optimization of a self-nanoemulsified tablet dosage form of Ubiquinone using response surface methodology: Effect of Formulation Ingredients. Int. J. Pharm. 2002, 240, 103–114. [Google Scholar] [CrossRef]
- Norazlinaliza, S.; Mahiran, B.; Basyaruddin, A.; Dzulkefly, K.; Hamidon, B.; Abu, B. Phase behavior, formation and characterization of palm-based esters nanoemulsion formulation containing Ibuprofen. J. Nanomed. Nanotechnol. 2011, 2. [Google Scholar] [CrossRef]
- Kulkarni, S.; Nisharani, S.; Govind, M. Development and evaluation of solid self nanoemulsifying formulation of Rosuvastatin Calcium for improved bioavailability. Trop. J. Pharm. Res. 2015, 14, 575–582. [Google Scholar] [CrossRef]
- Ashish, D.; Premchand, N.; Pramod, Y. Formulation and in-vitro evaluation of self microemulsifying drug delivery system (SMEDDS) of Furosemide. Pharm. Lett. 2010, 2, 94–106. [Google Scholar]
- Pouton, C.; Porter, S. Formulation of lipid-based delivery systems for oral administration: Materials, methods and strategies. Adv. Drug Deliv. Rev. 2008, 60, 625–637. [Google Scholar] [CrossRef] [PubMed]
- Ghai, D.; Sinha, V. Nanoemulsions as self-emulsified drug delivery carriers for enhanced permeability of the poorly water-soluble selective β1-adrenoreceptor blocker Talinolol. Nanomedicine 2011, 8, 618–626. [Google Scholar] [CrossRef] [PubMed]
- Chun, C.; Linna, H. Improving oral bioavailability of agaricoglycerides by solid lipid-based self-emulsifying drug delivery system. J. Appl. Pharm. Sci. 2011, 1, 195–199. [Google Scholar]


| Formula | OLM (mg) | Oil (% w/w) | Smix (% w/w) |
|---|---|---|---|
| F1 | 20 | 5 | 20 |
| F2 | 20 | 5 | 40 |
| F3 | 20 | 5 | 60 |
| F4 | 20 | 5 | 80 |
| F5 | 20 | 8.5 | 60 |
| F6 | 20 | 8.5 | 80 |
| F7 | 20 | 11.5 | 60 |
| F8 | 20 | 11.5 | 80 |
| Surfactants | % Transmittance * | No. of Inversions |
|---|---|---|
| Cremophor RH40 | 99.47 ± 0.12 | 4 |
| Cremophor S9 | 14.90 ± 0.66 | 17 |
| Tween 20 | 98.17 ± 0.40 | 5 |
| Tween 40 | 80.97 ± 1.01 | 11 |
| Tween 60 | 74.93 ± 0.35 | 9 |
| Tween 80 | 97.60 ± 0.26 | 15 |
| Span 20 | 52.67 ± 0.75 | 17 |
| Span 80 | 56.57 ± 0.50 | 13 |
| Labrasol | 44.87 ± 0.95 | 7 |
| Cosurfactants | % Transmittance * | No. of Inversions |
|---|---|---|
| PEG 200 | 99.33 ± 0.38 | 5 |
| PEG 400 | 99.53 ± 0.12 | 4 |
| PEG 600 | 94.43 ± 0.15 | 4 |
| Transcutol HP | 99.83 ± 0.06 | 3 |
| Propylene glycol | 98.80 ± 0.26 | 7 |
| Glycerol | 99.20 ± 0.10 | 15 |
| Formula | Heat-Cool Cycles | Centrifugation Test | Freeze Thaw Cycles |
|---|---|---|---|
| F1 | √ | √ | √ |
| F2 | √ | √ | √ |
| F3 | √ | √ | √ |
| F4 | √ | √ | √ |
| F5 | √ | √ | √ |
| F6 | √ | √ | √ |
| F7 | √ | √ | √ |
| F8 | √ | √ | √ |
| Formula | Distilled Water | 0.1 N HCL | Phosphate Buffer pH 6.8 | ||||||
|---|---|---|---|---|---|---|---|---|---|
| 10 | 100 | 1000 | 10 | 100 | 1000 | 10 | 100 | 1000 | |
| F1 | √ | √ | √ | √ | √ | √ | √ | √ | √ |
| F2 | √ | √ | √ | √ | √ | √ | √ | √ | √ |
| F3 | √ | √ | √ | √ | √ | √ | √ | √ | √ |
| F4 | √ | √ | √ | √ | √ | √ | √ | √ | √ |
| F5 | √ | √ | √ | √ | √ | √ | √ | √ | √ |
| F6 | √ | √ | √ | √ | √ | √ | √ | √ | √ |
| F7 | √ | √ | √ | √ | √ | √ | √ | √ | √ |
| F8 | √ | √ | √ | √ | √ | √ | √ | √ | √ |
| Formula | Observations | Grade |
|---|---|---|
| F1 | Rapidly forming clear emulsion | A |
| F2 | Rapidly forming clear emulsion | A |
| F3 | Rapidly forming clear emulsion | A |
| F4 | Rapidly forming clear emulsion | A |
| F5 | Rapidly forming clear emulsion | A |
| F6 | Rapidly forming clear emulsion | A |
| F7 | Rapidly forming clear emulsion | A |
| F8 | Rapidly forming clear emulsion | A |
| Formula | Self-Emulsification Time * (s) | % T * | Particle Size (nm) * | PDI * | Zeta Potential (mV) * | Drug Loading Efficiency * (%) |
|---|---|---|---|---|---|---|
| F1 | 22.38 ± 0.77 | 99.14 ± 0.11 | 17.57 ± 0.26 | 0.076 ± 0.01 | −4.23 ± 0.18 | 92.37 ± 0.75 |
| F2 | 20.86 ± 1.26 | 99.30 ± 0.05 | 15.90 ± 0.32 | 0.057 ± 0.04 | −3.62 ± 0.11 | 93.30 ± 0.86 |
| F3 | 14.10 ± 0.75 | 98.15 ± 0.12 | 15.33 ± 0.19 | 0.044 ± 0.06 | −2.63 ± 0.47 | 96.85 ± 1.23 |
| F4 | 15.55 ± 0.85 | 98.40 ± 0.27 | 14.91 ± 0.12 | 0.056 ± 0.02 | −4.10 ± 0.21 | 95.22 ± 2.22 |
| F5 | 18.50 ± 1.38 | 97.97 ± 0.32 | 19.73 ± 0.15 | 0.058 ± 0.02 | −2.88 ± 0.09 | 94.68 ± 1.91 |
| F6 | 17.29 ± 1.31 | 99.60 ± 0.14 | 16.49 ± 0.21 | 0.036 ± 0.05 | −3.34 ± 0.16 | 98.52 ± 1.45 |
| F7 | 20.20 ± 1.88 | 99.18 ± 0.10 | 22.97 ± 0.44 | 0.077 ± 0.12 | −5.13 ± 0.61 | 96.32 ± 1.88 |
| F8 | 19.28 ± 1.13 | 98.33 ± 0.15 | 20.50 ± 0.39 | 0.241 ± 0.09 | −4.47 ± 0.29 | 99.09 ± 0.56 |
| Formula | Correlation Coefficients (r) | ||||
|---|---|---|---|---|---|
| Zero Order | First Order | Second Order | Higuchi’s Diffusion Model | Hixson-Crowell Model | |
| F1 | 0.8341 | 0.9053 | 0.9139 | 0.9574 | 0.8829 |
| F2 | 0.7962 | 0.8869 | 0.8931 | 0.9486 | 0.8588 |
| F3 | 0.8140 | 0.9126 | 0.7213 | 0.9709 | 0.9027 |
| F4 | 0.7897 | 0.8632 | 0.8887 | 0.9823 | 0.8424 |
| F5 | 0.8181 | 0.9036 | 0.7309 | 0.9758 | 0.9743 |
| F6 | 0.9017 | 0.9655 | 0.9862 | 0.9874 | 0.9660 |
| F7 | 0.8819 | 0.9501 | 0.7367 | 0.9804 | 0.9640 |
| F8 | 0.9016 | 0.9701 | 0.9651 | 0.9963 | 0.9512 |
| Formula | In Vitro Drug Release (1 h) | Drug Loading Efficiency | Particle Size | Total Rank Order | Conclusive Rank Order |
|---|---|---|---|---|---|
| F1 | 8 | 8 | 5 | 21 | 8 |
| F2 | 5 | 7 | 3 | 15 | 6 |
| F3 | 4 | 3 | 2 | 9 | 1 |
| F4 | 3 | 5 | 1 | 9 | 1 |
| F5 | 2 | 6 | 6 | 14 | 5 |
| F6 | 6 | 2 | 4 | 12 | 3 |
| F7 | 1 | 4 | 8 | 13 | 4 |
| F8 | 7 | 1 | 7 | 15 | 6 |
| Formula | F3 | F4 |
|---|---|---|
| Angle of Repose | 27.64° ± 1.03° | 22.79° ± 2.22° |
| Bulk Density (g/mL) | 0.49 ± 0.02 | 0.51 ± 0.03 |
| Tapped Density (g/mL) | 0.59 ± 0.02 | 0.54 ± 0.01 |
| Carr’s index (%) | 14.32 ± 1.72 | 12.41 ± 0.95 |
| Hausner’s ratio | 1.22 ± 0.10 | 1.08 ± 0.08 |
| PK Parameters | S-SNEDDS (F3) | Marketed Product | Drug Suspension |
|---|---|---|---|
| Cmax (µg/mL) | 26.4320 ± 1.89 | 15.3365 ± 2.18 | 9.5562 ± 2.37 |
| tmax (h) | 4 | 3 | 8 |
| AUC0–24h (µg·h/mL) | 299.7304 ± 4.15 | 208.3887 ± 6.47 | 143.2684 ± 3.59 |
| t1/2 (h) | 7.2489 ± 1.87 | 6.2488 ± 0.94 | 6.0896 ± 1.02 |
| Ke (h−1) | 0.0956 ± 0.002 | 0.1109 ± 0.004 | 0.1138 ± 0.001 |
© 2016 by the authors; licensee MDPI, Basel, Switzerland. This article is an open access article distributed under the terms and conditions of the Creative Commons Attribution (CC-BY) license (http://creativecommons.org/licenses/by/4.0/).
Share and Cite
Nasr, A.; Gardouh, A.; Ghorab, M. Novel Solid Self-Nanoemulsifying Drug Delivery System (S-SNEDDS) for Oral Delivery of Olmesartan Medoxomil: Design, Formulation, Pharmacokinetic and Bioavailability Evaluation. Pharmaceutics 2016, 8, 20. https://doi.org/10.3390/pharmaceutics8030020
Nasr A, Gardouh A, Ghorab M. Novel Solid Self-Nanoemulsifying Drug Delivery System (S-SNEDDS) for Oral Delivery of Olmesartan Medoxomil: Design, Formulation, Pharmacokinetic and Bioavailability Evaluation. Pharmaceutics. 2016; 8(3):20. https://doi.org/10.3390/pharmaceutics8030020
Chicago/Turabian StyleNasr, Ali, Ahmed Gardouh, and Mamdouh Ghorab. 2016. "Novel Solid Self-Nanoemulsifying Drug Delivery System (S-SNEDDS) for Oral Delivery of Olmesartan Medoxomil: Design, Formulation, Pharmacokinetic and Bioavailability Evaluation" Pharmaceutics 8, no. 3: 20. https://doi.org/10.3390/pharmaceutics8030020