
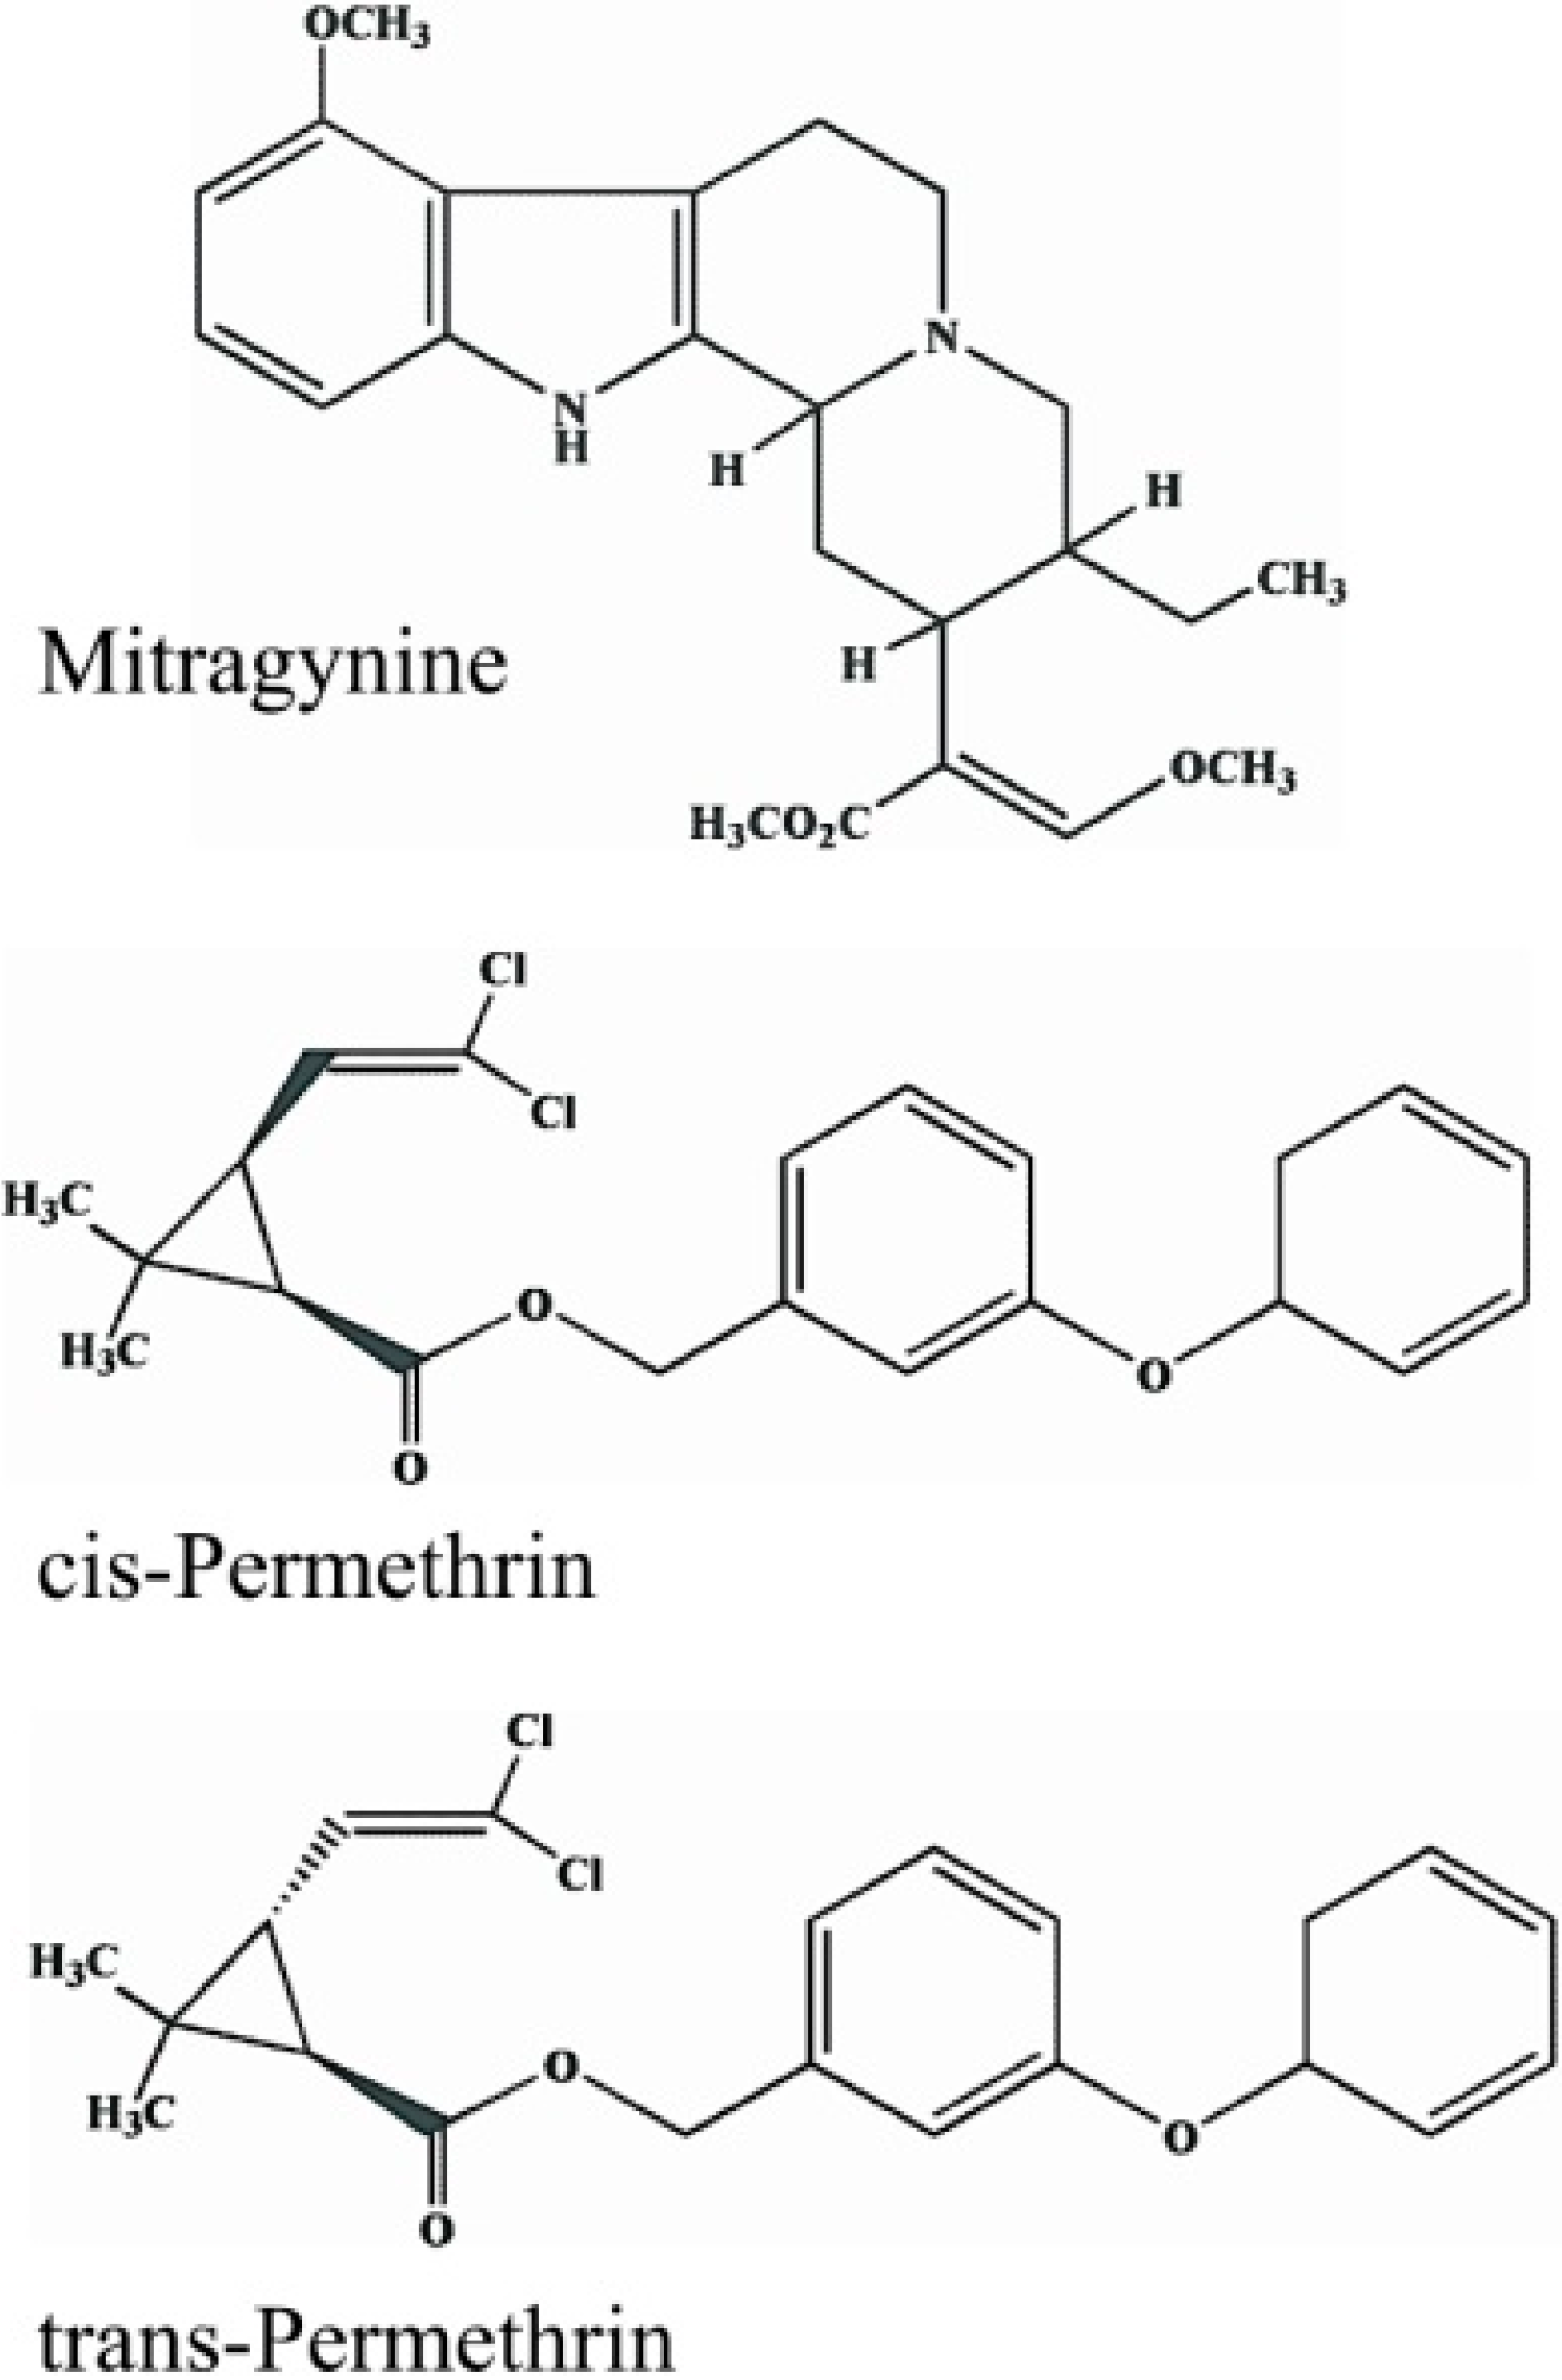
Effects of Mitragynine and a Crude Alkaloid Extract Derived from Mitragyna speciosa Korth. on Permethrin Elimination in Rats

Abstract
:1. Introduction


2. Experimental Section
2.1. Chemicals and Reagents
2.2. Plant Alkaloids
2.3. Animals
2.4. Experimental Design
2.5. Determination of Permethrin (PM) and Phenoxybenzylalcohol (PBAlc) in Plasma
2.5.1. Preparation of Standard Solutions
2.5.2. Sample Extraction
2.5.3. Chromatographic Instruments and Condition
2.6. Method Validation

| Validation parameter | Analyte | ||
|---|---|---|---|
| trans-PM | PBAlc | ||
| Range (µg/mL) | 0.1–3.2 | 0.1–208.4 | |
| Linearity | Slope | 22491 ± 374.08 | 34378 ± 400.79 |
| y-Intercept | (−)239.08 ± 107.93 | 806.31 ± 419.26 | |
| r | 0.9999 | 1.0000 | |
| Precision (%RSD) | Intra-day | 2.24–7.63 | 1.18–3.66 |
| Inter-day | 3.12–6.75 | 2.02–3.46 | |
| Accuracy (%DEV) | Intra-day | (−)2.37–(+)10.92 | (−)12.89–(+)1.79 |
| Inter-day | (−)7.85–(+)3.44 | (−)11.91–(−)0.21 | |
| Recovery (%) | 80.43–82.34 | 91.53–95.07 | |
| LLOQ (µg/mL) | 0.1 | 0.1 | |
2.7. Data Analysis
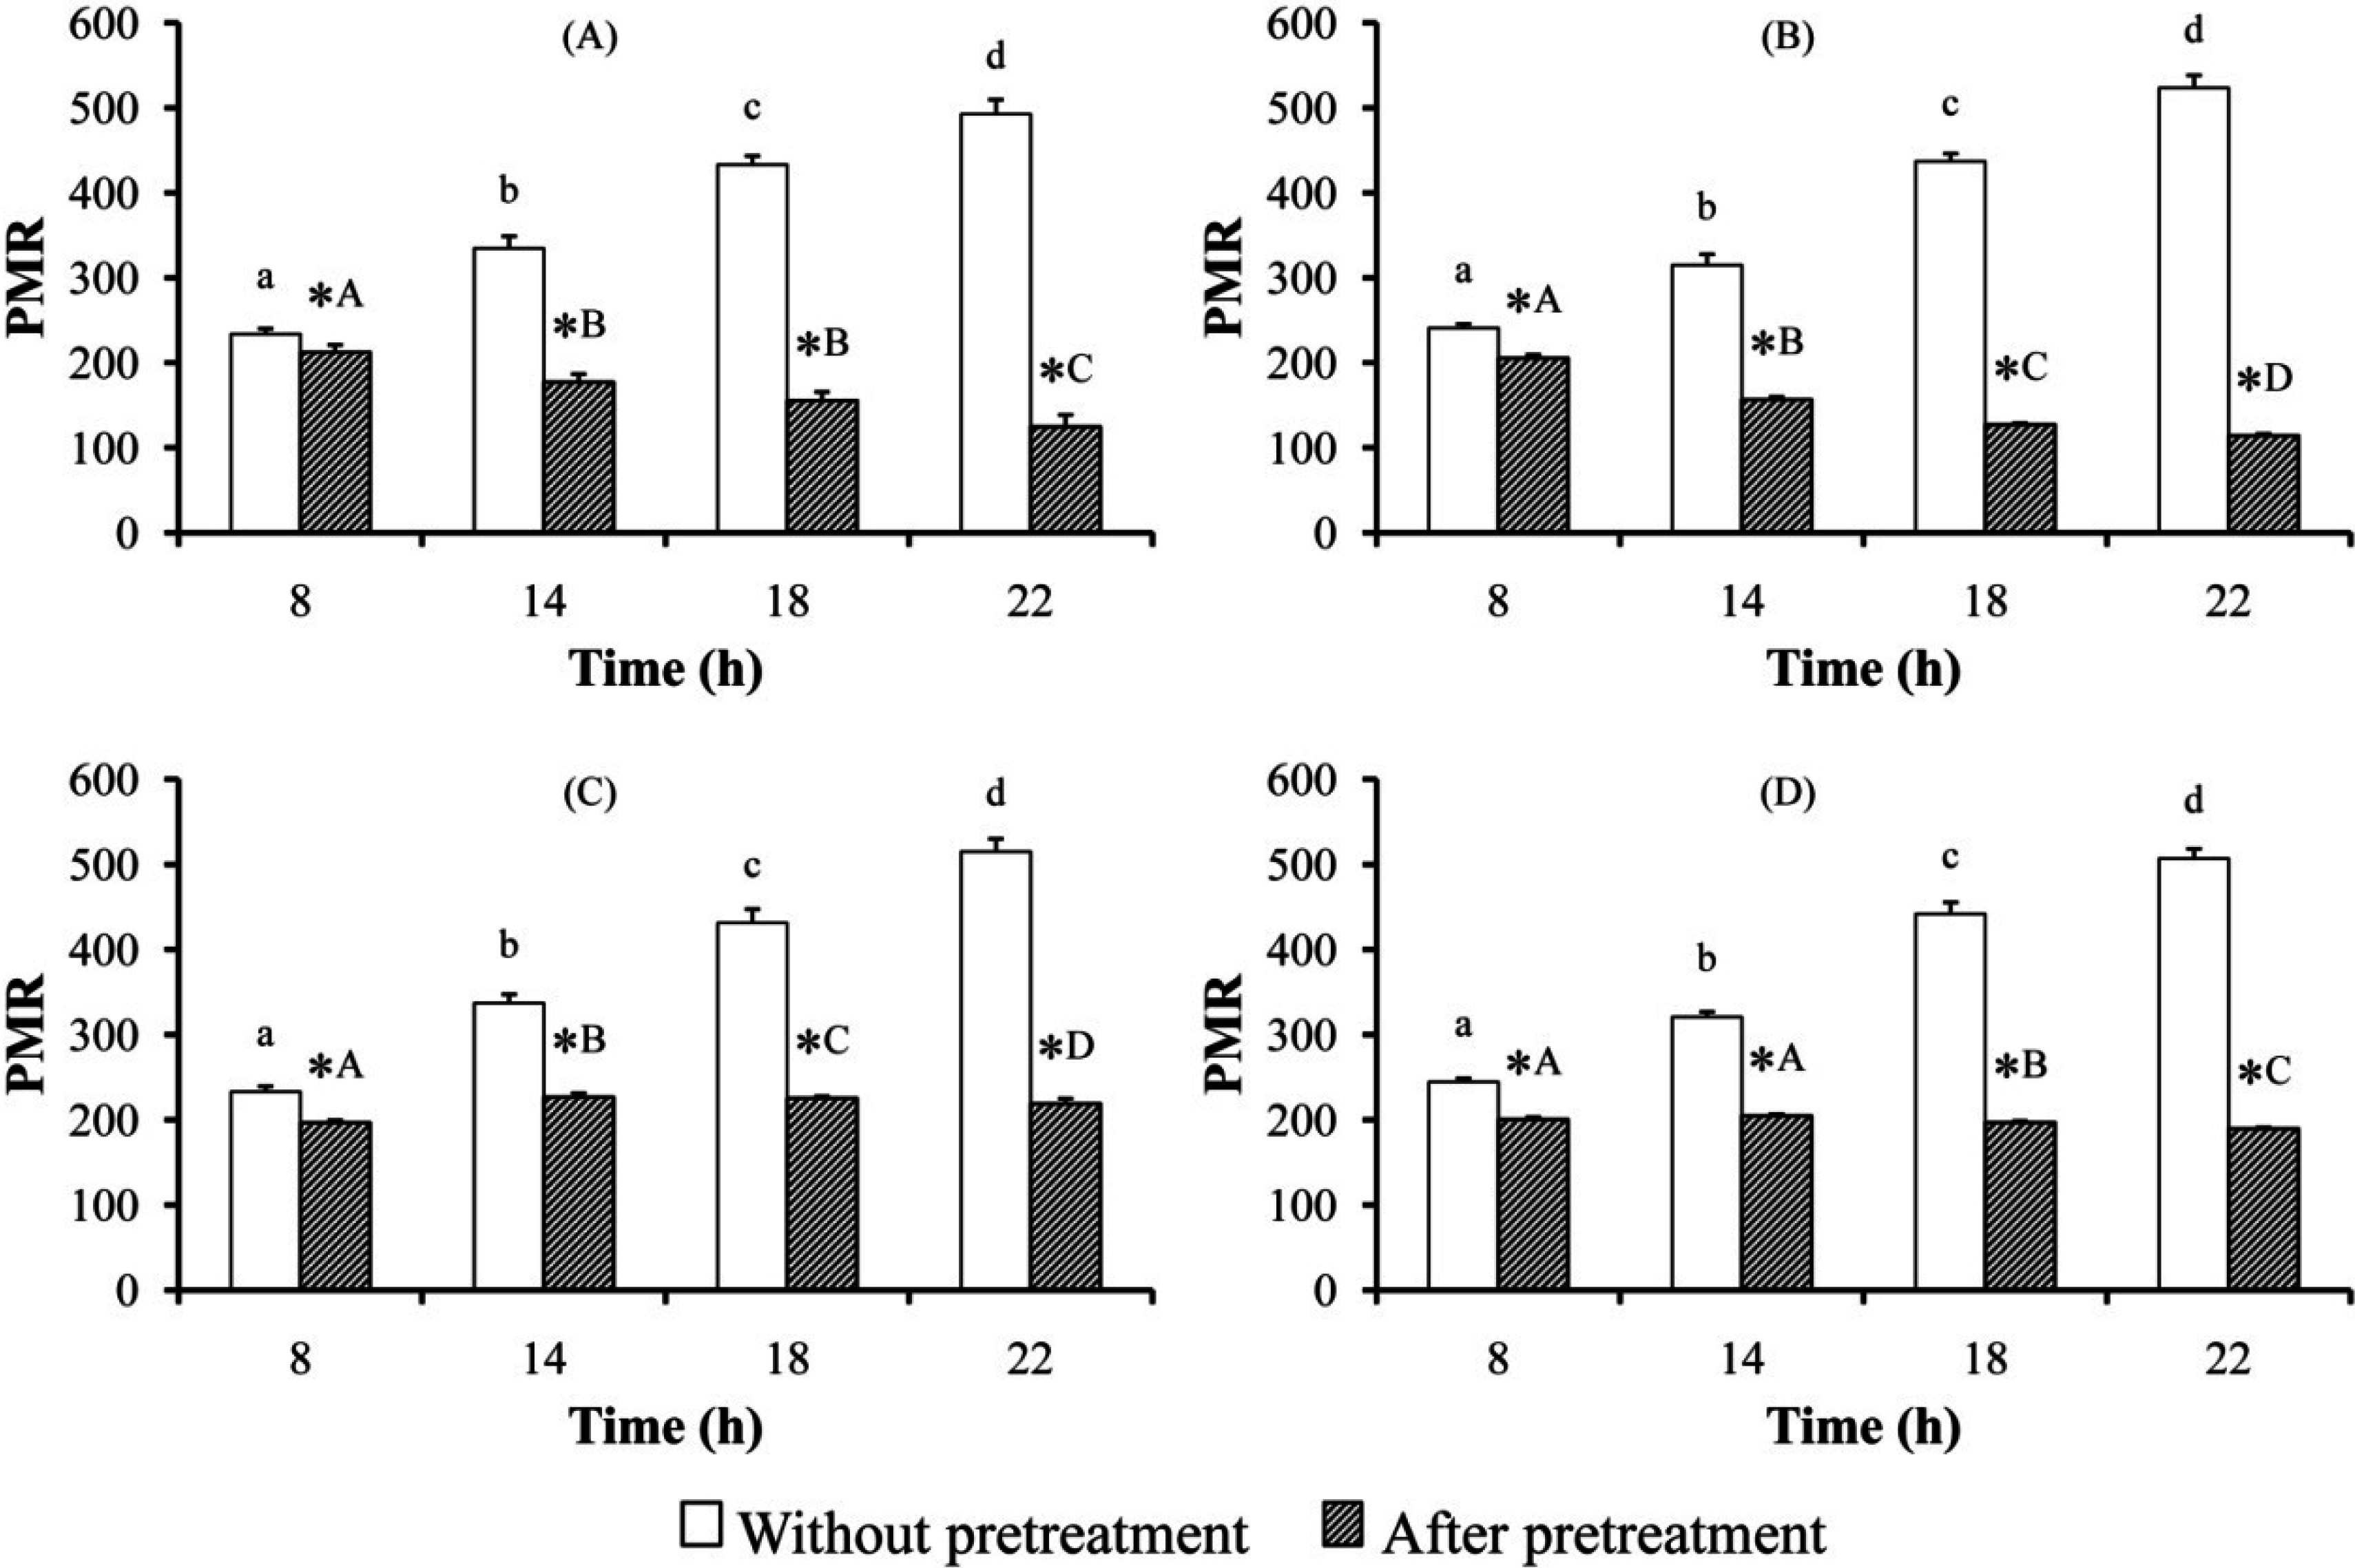
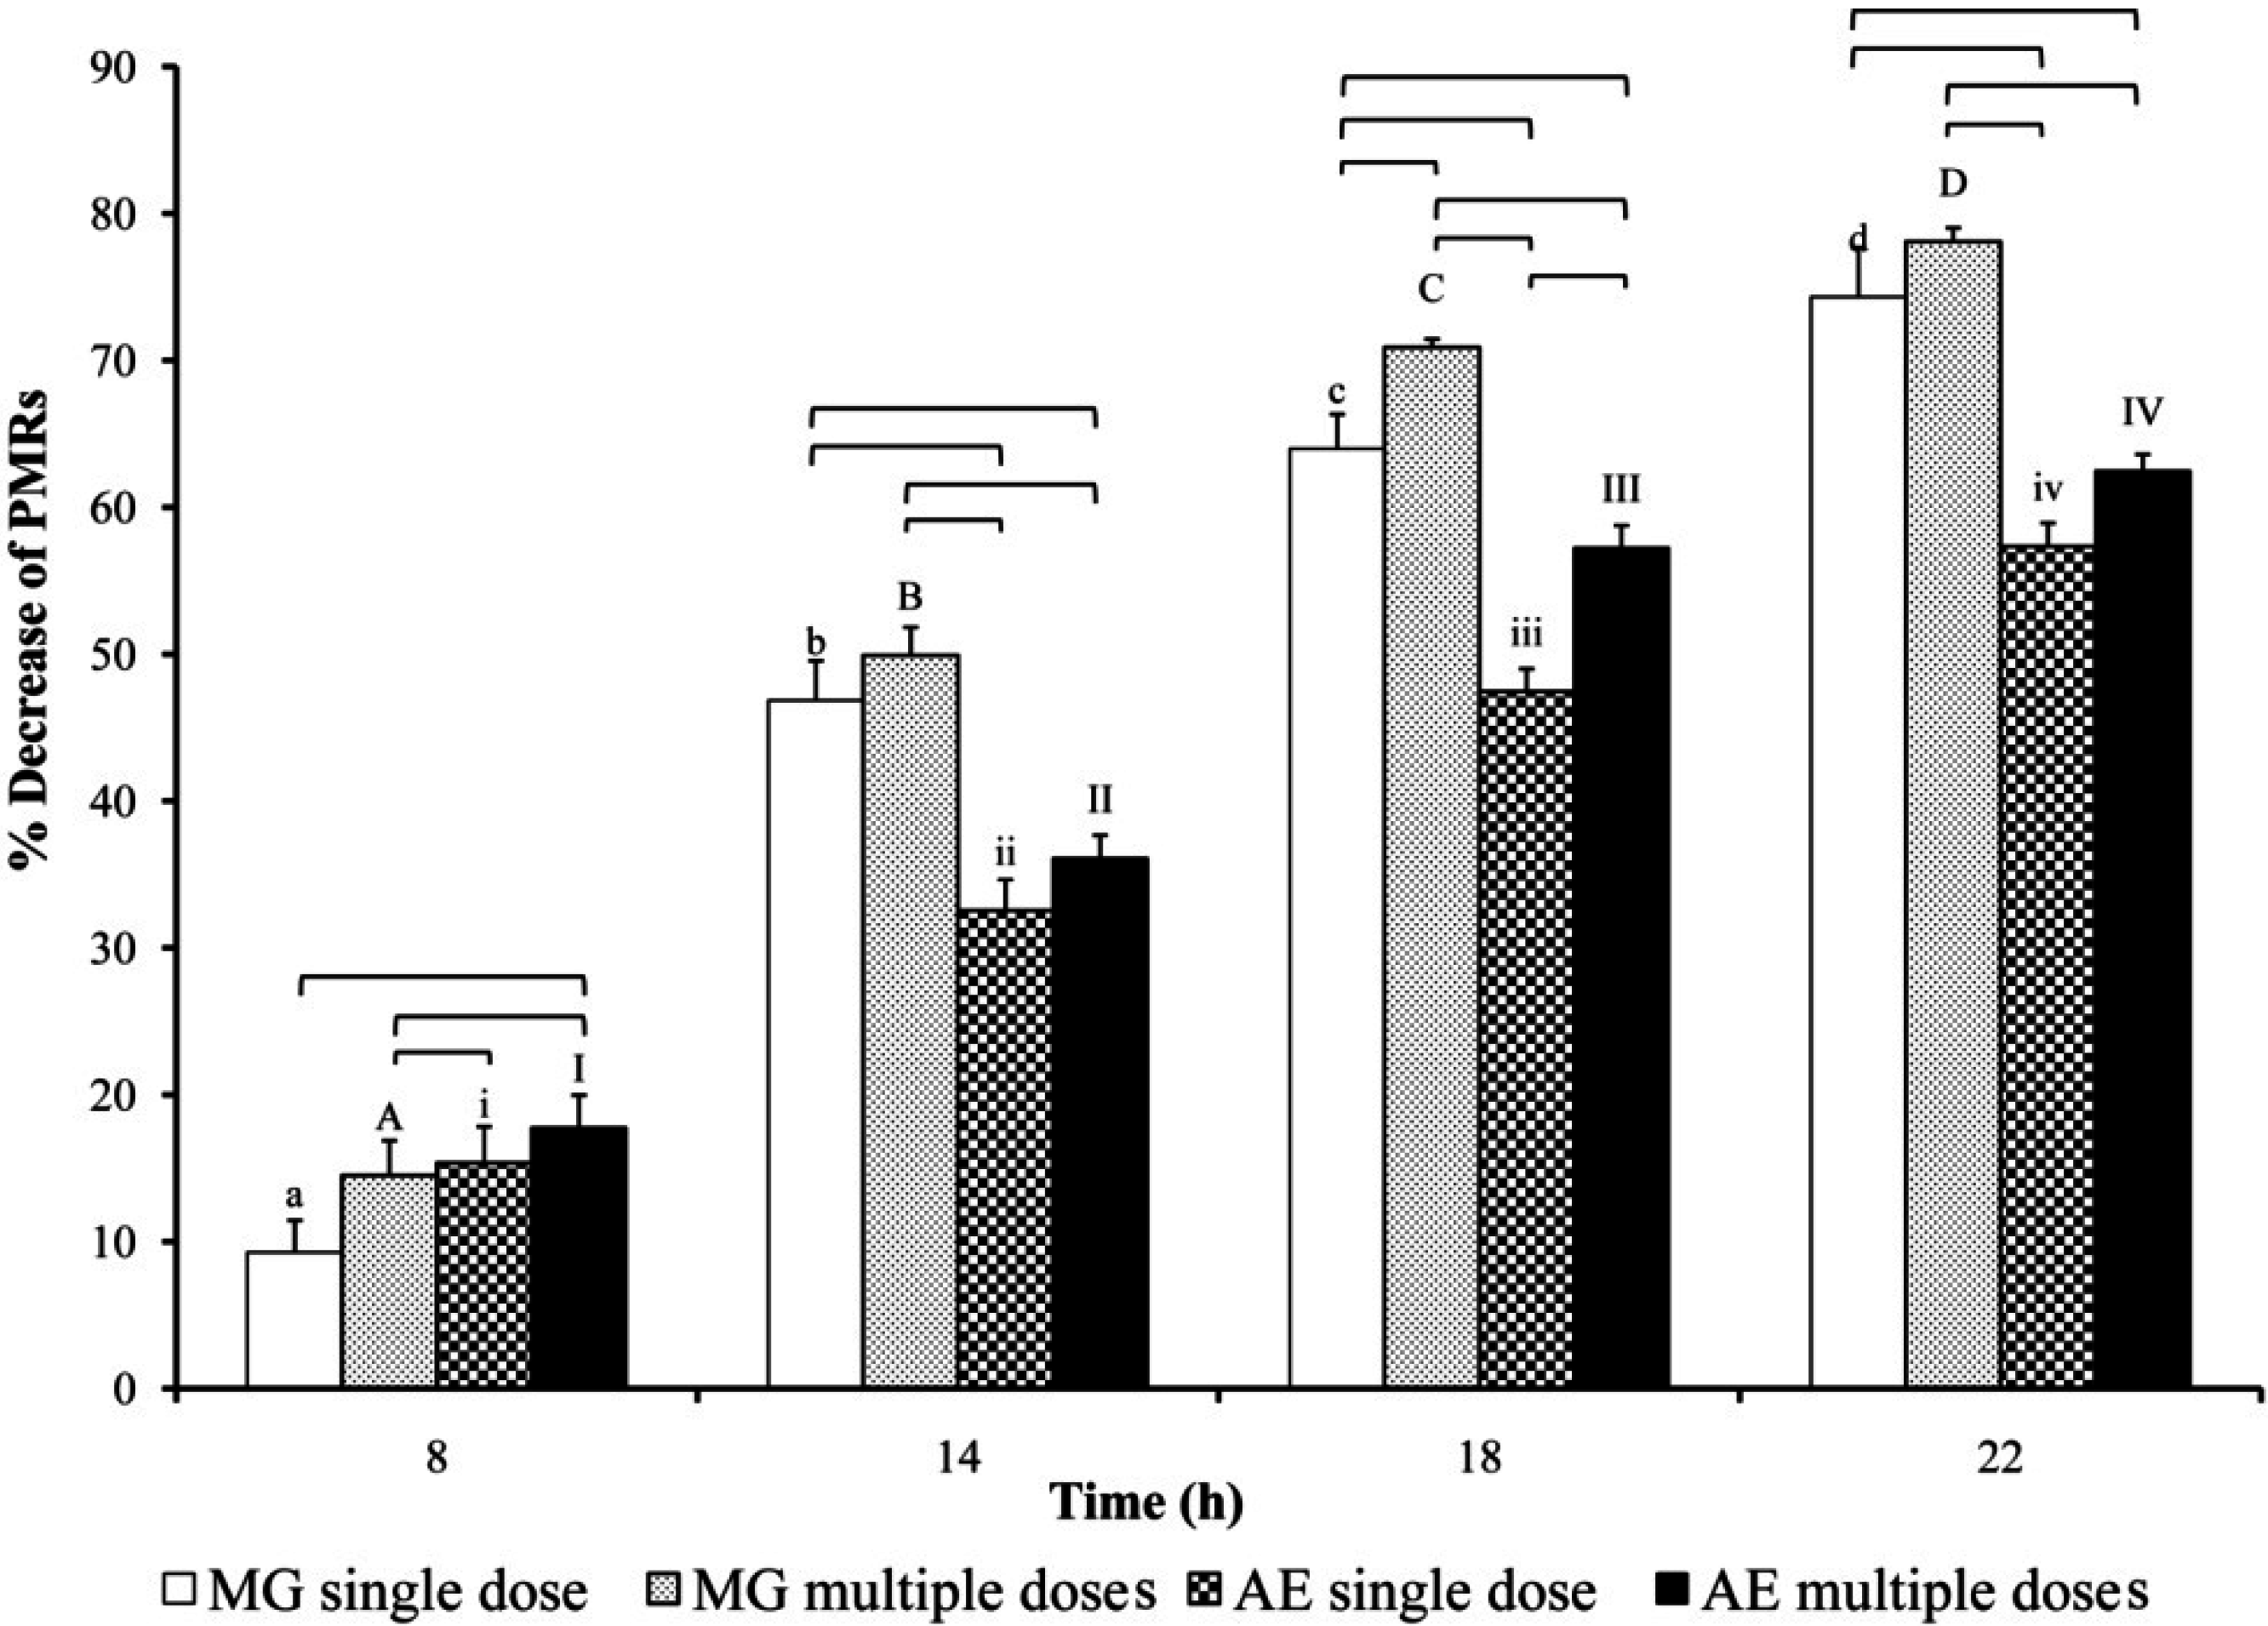
3. Results
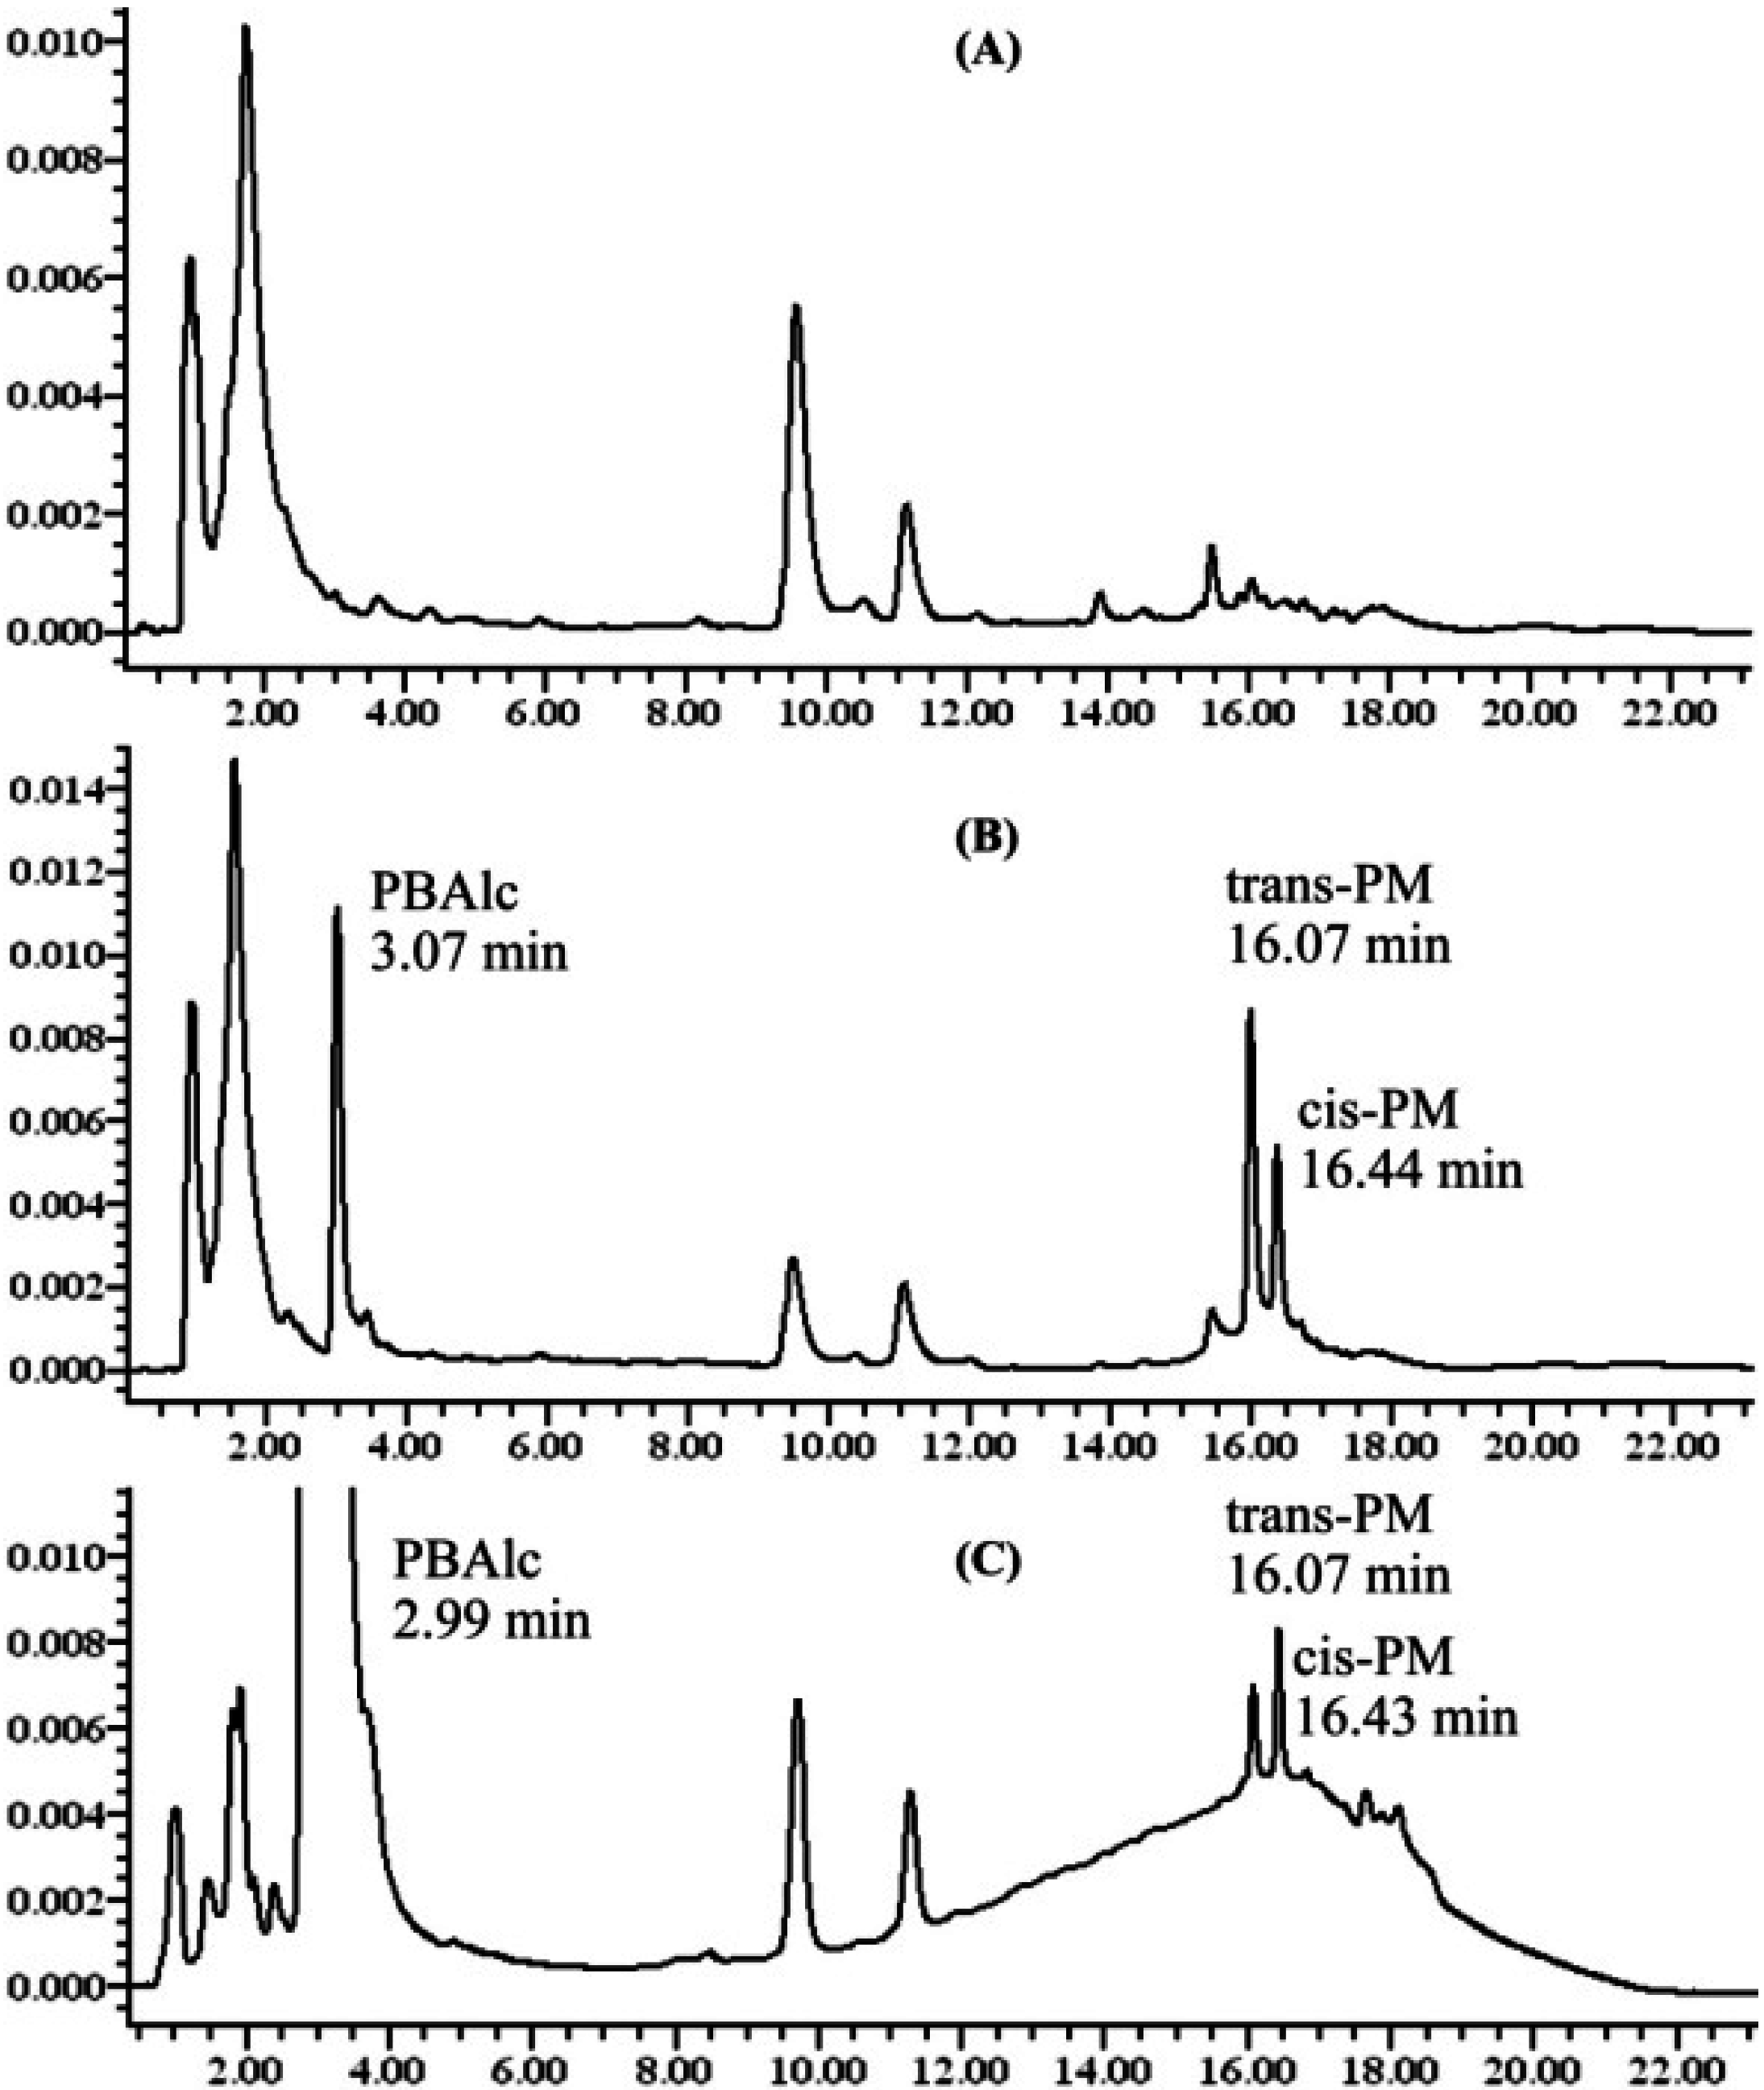
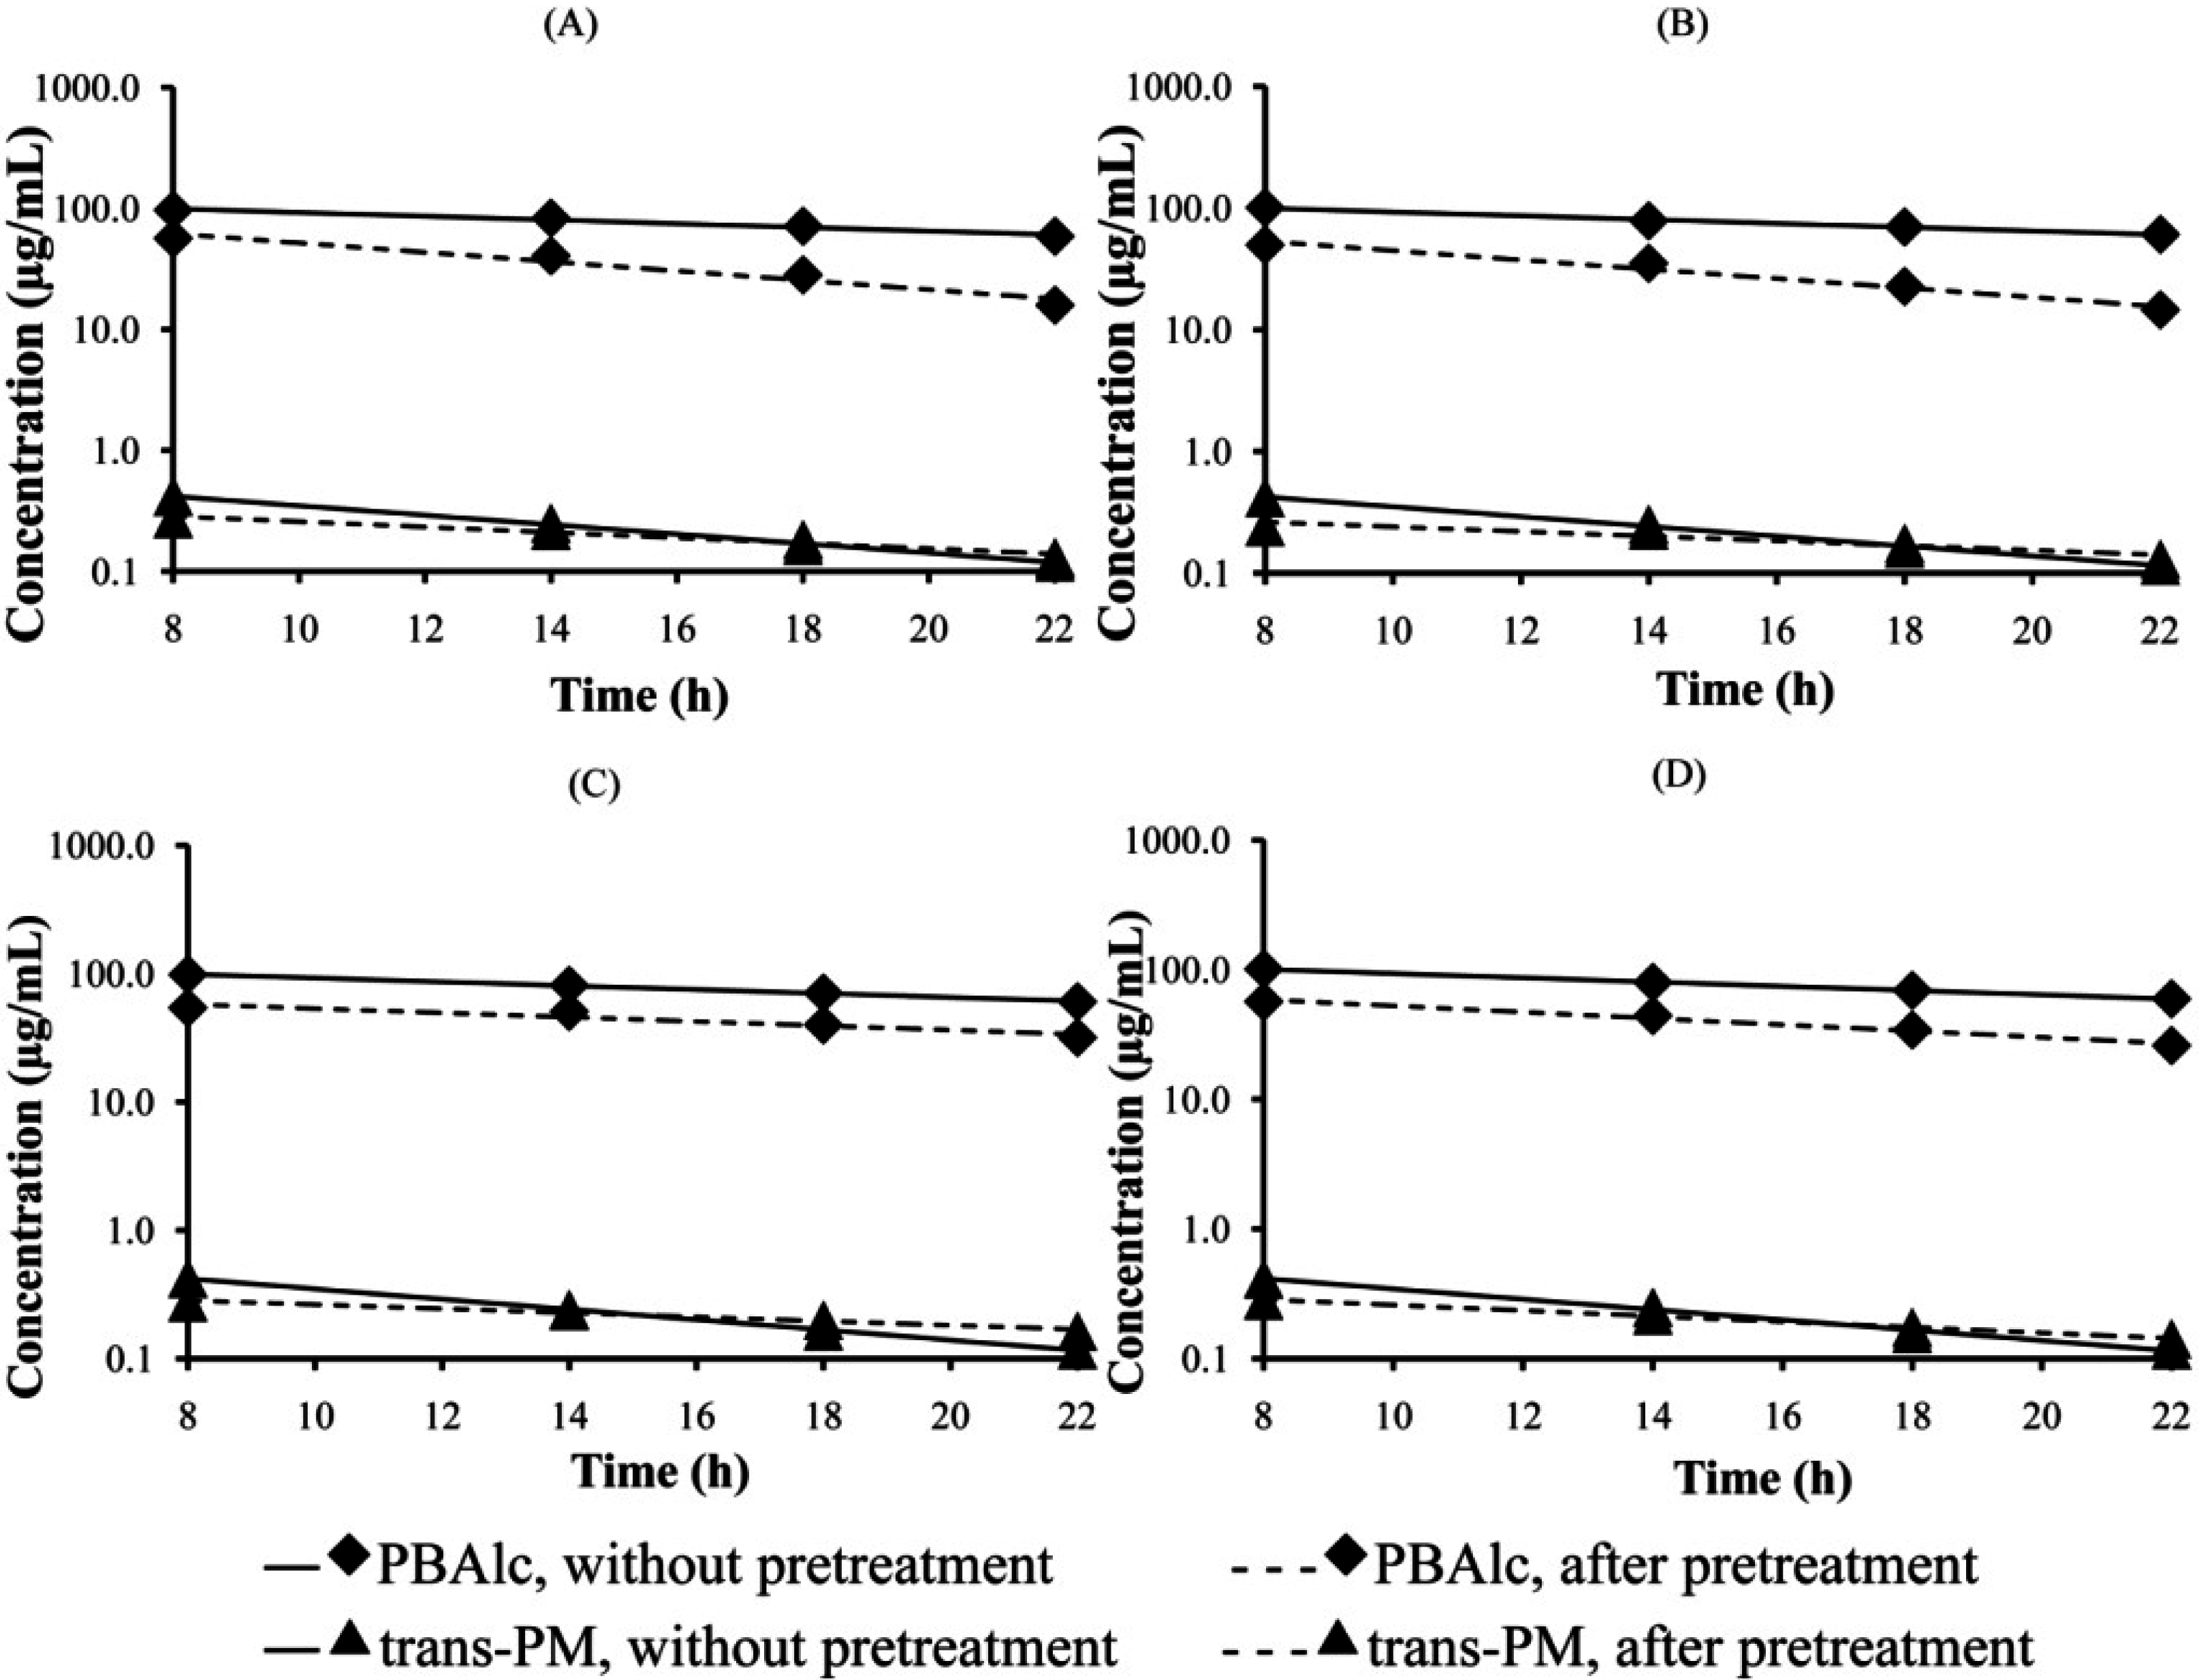
3.1. Determination of PM and PBAlc in Plasma


| Group | Substance | kel (h−1) | t1/2 el (h) | ||
|---|---|---|---|---|---|
| Without pretreatment | After pretreatment | Without pretreatment | After pretreatment | ||
| I (MG single dose) | PM | 0.061 ± 0.001 a | 0.035 ± 0.002 *a | 11.46 ± 0.13 | 19.98 ± 1.17 *a |
| PBAlc | 0.035 ± 0.004 | 0.075 ± 0.007 *A | 20.75 ± 2.13 | 9.49 ± 0.80 *A | |
| II (MG multiple dose) | PM | 0.062 ± 0.001 a | 0.033 ± 0.002 *a | 11.19 ± 0.12 | 22.65 ± 0.85 *a |
| PBAlc | 0.035 ± 0.002 | 0.107 ± 0.008 *B | 20.46 ± 0.82 | 6.65 ± 0.49 *A | |
| III (AE single dose) | PM | 0.060 ± 0.001 a | 0.031 ± 0.001 *a | 11.61 ± 0.22 | 22.69 ± 0.68 *a |
| PBAlc | 0.041 ± 0.003 | 0.042 ±0.005 C | 17.41 ± 1.34 | 17.80 ± 2.21 B | |
| IV(AE multiple dose) | PM | 0.059 ± 0.001 a | 0.024 ± 0.001 *b | 11.71 ± 0.26 | 29.08 ± 1.47 *b |
| PBAlc | 0.035 ± 0.001 | 0.059 ± 0.002 *AC | 20.06 ± 0.80 | 11.88 ± 0.48 *AC | |


4. Discussion
5. Conclusions
Acknowledgments
Author Contributions
Conflicts of Interest
References
- Shellard, E.J.; Houghton, P.J.; Reasha, M. The Mitragyna speciosa of Asia. Part XXXI. The alkaloids of Mitragyna speciosa Korth from Thailand. Planta Med. 1978, 27, 26–36. [Google Scholar] [CrossRef]
- Jansen, K.L.; Prast, C.J. Psychoactive properties of mitragynine (kratom). J. Psychoact. Drugs 1988, 20, 455–457. [Google Scholar] [CrossRef]
- Maurer, H.H. Chemistry, pharmacology, and metabolism of emerging drugs of abuse. Ther. Drug Monit. 2010, 32, 544–549. [Google Scholar] [CrossRef] [PubMed]
- Saingam, D.; Assanangkornchai, S.; Geater, A.F.; Balthip, Q. Pattern and consequences of krathom (Mitragyna speciosa Korth.) use among male villagers in southern Thailand: A qualitative study. Int. J. Drug Policy 2013, 24, 351–358. [Google Scholar] [CrossRef] [PubMed]
- Prozialeck, W.C.; Jivan, J.K.; Andurkar, S.V. Pharmacology of Kratom: An emerging botanical agent with stimulant, analgesic and opioid-like effects. J. Am. Osteopath Assoc. 2012, 112, 792–799. [Google Scholar] [PubMed]
- Takayama, H. Chemistry and pharmacology of analgesic indole alkaloids from the rubiaceous plant, Mitragyna speciosa. Chem. Pharm. Bull. 2004, 52, 916–928. [Google Scholar] [CrossRef] [PubMed]
- Chittrakarn, S.; Sawangjaroen, K.; Prasettho, S.; Janchawee, B.; Keawpradub, N. Inhibitory effects of kratom leaf extract (Mitragyna speciosa Korth.) on the rat gastrointestinal tract. J. Ethnopharmacol. 2008, 116, 173–178. [Google Scholar]
- Mossadeq, W.M.S.; Sulaiman, M.R.; Mohamad, T.A.T.; Chiong, H.S.; Zakaria, Z.A.; Jabit, M.L.; Baharuldin, M.T.H.; Israf, D.A. Anti-inflammatory and antinociceptive effects of Mitragyna speciosa Korth methanolic extract. Med. Princ. Pract. 2009, 18, 378–384. [Google Scholar] [CrossRef] [PubMed]
- Tsuchiya, S.; Miyashita, S.; Yamamoto, M.; Horie, S.; Sakai, S.I.; Aimi, N.; Takayama, H.; Watanabe, K. Effect of mitragynine, derived from Thai folk medicine, on gastric acid secretion through opioid receptor in anesthetized rats. Eur. J. Pharmacol. 2002, 443, 185–188. [Google Scholar] [CrossRef] [PubMed]
- Purintrapiban, J.; Keawpradub, N.; Kansenalak, S.; Chittrakarn, S.; Janchawee, B.; Sawangjaroen, K. Study on glucose transport in muscle cells by extracts from Mitragyna speciosa (Korth) and mitragynine. Nat. Prod. Res. 2011, 25, 1379–1387. [Google Scholar] [CrossRef] [PubMed]
- Boyer, E.W.; Babu, K.M.; Adkins, J.E.; McCurdy, C.R.; Halpern, J.H. Self-treatment of opioid withdrawal using kratom (Mitragynia speciosa korth). Addiction 2008, 103, 1048–1050. [Google Scholar] [CrossRef] [PubMed]
- Tungtananuwat, W.; Lawanprasert, S. Fatal 4x100; home-made kratom juice cocktail. J. Health Res. 2010, 24, 43–47. [Google Scholar]
- Shafer, T.J.; Meyer, D.A.; Crofton, K.M. Developmental neurotoxicity of pyrethroid insecticides: Critical review and future research needs. Environ. Health Perspect. 2005, 113, 123–136. [Google Scholar] [CrossRef] [PubMed]
- Soderlund, D.M.; Clark, J.M.; Sheets, L.P.; Mullin, L.S.; Piccirillo, V.J.; Sargent, D.; Stevens, J.T.; Weiner, M.L. Mechanisms of pyrethroid neurotoxicity: Implications for cumulative risk assessment. Toxicology 2002, 171, 3–59. [Google Scholar] [CrossRef] [PubMed]
- Sogorb, M.A.; Vilanova, E. Enzymes involved in the detoxification of organophosphorus, carbamate and pyrethroid insecticides through hydrolysis. Toxicol. Lett. 2002, 128, 215–228. [Google Scholar] [CrossRef] [PubMed]
- Nakamura, Y.; Sugihara, K.; Sone, T.; Isobe, M.; Ohta, S.; Kitamura, S. The in vitro metabolism of a pyrethroid insecticide, permethrin, and its hydrolysis products in rats. Toxicology 2007, 235, 176–184. [Google Scholar] [CrossRef] [PubMed]
- Philipp, A.A.; Wissenbach, D.K.; Zoerntlein, S.W.; Klein, O.N.; Kanogsunthornrat, J.; Maurer, H.H. Studies on the metabolism of mitragynine, the main alkaloid of the herbal drug Kratom, in rat and human urine using liquid chromatography-linear ion trap mass spectrometry. J. Mass Spectrom. 2009, 44, 1249–1261. [Google Scholar] [CrossRef] [PubMed]
- Janchawee, B.; Keawpradub, N.; Chittrakarn, S.; Prasettho, S.; Wararatananurak, P.; Sawangjareon, K. A high-performance liquid chromatographic method for determination of mitragynine in serum and its application to a pharmacokinetic study in rats. Biomed. Chromatogr. 2007, 21, 176–183. [Google Scholar] [CrossRef] [PubMed]
- Botpiboon, A. Effects of caffene and codeine on pharmacokinetics and antinociceptive activity of alkaloid extract from leaves of kratom (Mitragyna speciosa Korth.). M.Sc. Thesis, Prince of Songkla University, Songkhla, 2009. [Google Scholar]
- Houghton, P.J.; Latiff, A.; Said, I.M. Alkaloids from Mitragyna speciosa. Phytochemistry 1991, 30, 347–350. [Google Scholar] [CrossRef]
- Ponglux, D.; Wongseripipatana, S.; Takayama, H.; Kikuchi, M.; Kurihara, M.; Kitajima, M.; Aimi, N.; Sakai, S. A New Indole Alkaloid, 7 alpha-Hydroxy-7H-mitragynine, from Mitragyna speciosa in Thailand. Planta Med. 1994, 60, 580–581. [Google Scholar] [CrossRef] [PubMed]
- Council for International Organizations of Medical Sciences. Available online: http://www.cioms.ch/images/stories/CIOMS/IGP2012.pdf (accessed on 25 October 2014).
- National Centre for the Replacement Refinement & Reduction of Animals in Research. Available online: http://www.nc3rs.org.uk/sites/default/files/documents/Guidelines/NC3Rs%20ARRIVE%20Guidelines%202013.pdf (accessed on 25 October 2014).
- Junting, L.; Chuichang, F. Solid phase extraction method for rapid isolation and clean-up of some synthetic pyrethroid insecticides from human urine and plasma. Forensic Sci. Int. 1991, 51, 89–93. [Google Scholar] [CrossRef] [PubMed]
- Abu-Qare, A.W.; Abou-Donia, M.B. Simultaneous determination of malathion, permethrin, DEET (N,N-diethyl-m-toluamide), and their metabolites in rat plasma and urine using high performance liquid chromatography. J. Pharm. Biomed. Anal. 2001, 26, 291–299. [Google Scholar]
- U.S. Food and Drug Administration. Available online: http://www.fda.gov/downloads/Drugs/Guidances/ucm070107.pdf (accessed on 1 November 2014).
- Choi, J.; Rose, R.L.; Hodgson, E. In vitro human metabolism of permethrin: The role of human alcohol and aldehyde dehydrogenases. Pestic. Biochem. Phys. 2002, 74, 117–128. [Google Scholar] [CrossRef]
- Satoh, T.; Hosokawa, M. Structure, function and regulation of carboxylesterases. Chem.-Biol. Interact. 2006, 162, 195–211. [Google Scholar]
- Scollon, E.J.; Starr, J.M.; Godin, S.J.; DeVito, M.J.; Hughes, M.F. In vitro metabolism of pyrethroid pesticides by rat and human hepatic microsomes and cytochrome P450 isoforms. Drug Metab. Dispos. 2009, 37, 221–228. [Google Scholar] [CrossRef] [PubMed]
- Hanapi, N.A.; Azizi, J.; Ismail, S.; Mansor, S.M. Evaluation of selected Malaysian medicinal plants on phase I drug metabolizing enzymes, CYP2C9, CYP2D6 and CYP3A4 activities in vitro. Int. J. Pharmacol. 2010, 6, 494–499. [Google Scholar] [CrossRef]
- Hanapi, N.A.; Ismail, S.; Mansor, S.M. Inhibitory effect of mitragynine on human cytochrome P450 enzyme activities. Pharmacogn. Res. 2013, 5, 241–246. [Google Scholar] [CrossRef]
- Kong, W.M.; Chik, Z.; Ramachandra, M.; Subramaniam, U.; Raja Aziddin, R.E.; Mohamed, Z. Evaluation of the effects of mitragyna speciosa alkaloid extract on cytochrome P450 enzymes using a high throughput assay. Molecules 2011, 16, 7344–7356. [Google Scholar] [CrossRef] [PubMed]
- Lim, E.L.; Seah, T.C.; Koe, X.F.; Wahab, H.A.; Adenan, M.I.; Jamil, M.F.A.; Majid, M.I.A.; Tan, M.L. In vitro evaluation of cytochrome P450 induction and the inhibition potential of mitragynine, a stimulant alkaloid. Toxicol. in Vitro 2013, 27, 812–824. [Google Scholar] [CrossRef] [PubMed]
- Azizi, J.; Ismail, S.; Mordi, M.N.; Ramanathan, S.; Said, M.I.M.; Mansor, S.M. In vitro and in vivo effects of three different mitragyna speciosa korth leaf extracts on phase II drug metabolizing enzymes-glutathione transferases (GSTs). Molecules 2010, 15, 432–441. [Google Scholar] [CrossRef] [PubMed]
- Anwar, R.; Ismail, S.; Mansor, S.M. In vitro effect of mitragynine on activity of drug metabolizing enzymes, n-demethylase and glutathione s-transferase in streptozotocin-induced diabetic rats. Pharmacologyonline 2012, 1, 68–75. [Google Scholar]
- Azizi, J.; Ismail, S.; Mansor, S.M. Mitragyna speciosa Korth leaves extracts induced the CYP450 catalyzed aminopyrine-N-demethylase (APND) and UDP-glucuronosyltransferase (UGT) activities in male Sprague-Dawley rat livers. Drug Metabol. Drug Interact. 2013, 28, 95–105. [Google Scholar] [CrossRef] [PubMed]
- Zhu, W.; Song, L.; Zhang, H.; Matoney, L.; Lecluyse, E.; Yan, B. Dexamethasone differentially regulates expression of carboxylesterase genes in humans and rats. Drug Metab. Dispos. 2000, 28, 186–191. [Google Scholar] [PubMed]
- Hodgson, E.; Rose, R.L. Metabolic interactions of agrochemicals in humans. Pest. Manag. Sci. 2008, 64, 617–621. [Google Scholar] [CrossRef] [PubMed]
- Imai, T. Human carboxylesterase isozymes: Catalytic properties and rational drug design. Drug Metab. Pharmacokinet. 2006, 21, 173–185. [Google Scholar] [CrossRef] [PubMed]
- Arnaud, M.J. Pharmacokinetics and metabolism of natural methylxanthines in animal and man. In Methylxanthines; Springer Berlin Heidelberg: Berlin, Germany, 2011; pp. 33–91. [Google Scholar]
- Ali, Z.; Demiray, H.; Khan, I.A. Isolation, characterization, and NMR spectroscopic data of indole and oxindole alkaloids from Mitragyna speciosa. Tetrahedron Lett. 2014, 55, 369–372. [Google Scholar] [CrossRef]
- Anadon, A.; Martinez-Larranaga, M.R.; Diaz, M.J.; Bringas, P. Toxicokinetics of permethrin in the rat. Toxicol. Appl. Pharmacol. 1991, 110, 1–8. [Google Scholar] [CrossRef] [PubMed]
- Cantalamessa, F. Acute toxicity of two pyrethroids, permethrin, and cypermethrin in neonatal and adult rats. Arch. Toxicol. 1993, 67, 510–513. [Google Scholar] [CrossRef] [PubMed]
© 2015 by the authors; licensee MDPI, Basel, Switzerland. This article is an open access article distributed under the terms and conditions of the Creative Commons Attribution license (http://creativecommons.org/licenses/by/4.0/).
Share and Cite
Srichana, K.; Janchawee, B.; Prutipanlai, S.; Raungrut, P.; Keawpradub, N. Effects of Mitragynine and a Crude Alkaloid Extract Derived from Mitragyna speciosa Korth. on Permethrin Elimination in Rats. Pharmaceutics 2015, 7, 10-26. https://doi.org/10.3390/pharmaceutics7020010
Srichana K, Janchawee B, Prutipanlai S, Raungrut P, Keawpradub N. Effects of Mitragynine and a Crude Alkaloid Extract Derived from Mitragyna speciosa Korth. on Permethrin Elimination in Rats. Pharmaceutics. 2015; 7(2):10-26. https://doi.org/10.3390/pharmaceutics7020010
Chicago/Turabian StyleSrichana, Kachamas, Benjamas Janchawee, Sathaporn Prutipanlai, Pritsana Raungrut, and Niwat Keawpradub. 2015. "Effects of Mitragynine and a Crude Alkaloid Extract Derived from Mitragyna speciosa Korth. on Permethrin Elimination in Rats" Pharmaceutics 7, no. 2: 10-26. https://doi.org/10.3390/pharmaceutics7020010