
Generic Workflow to Predict Medicine Concentrations in Human Milk Using Physiologically-Based Pharmacokinetic (PBPK) Modelling—A Contribution from the ConcePTION Project

 ,
,  , , ,
, , ,  ,
,
Abstract
:1. Introduction
2. Materials and Methods
2.1. Model Medicines
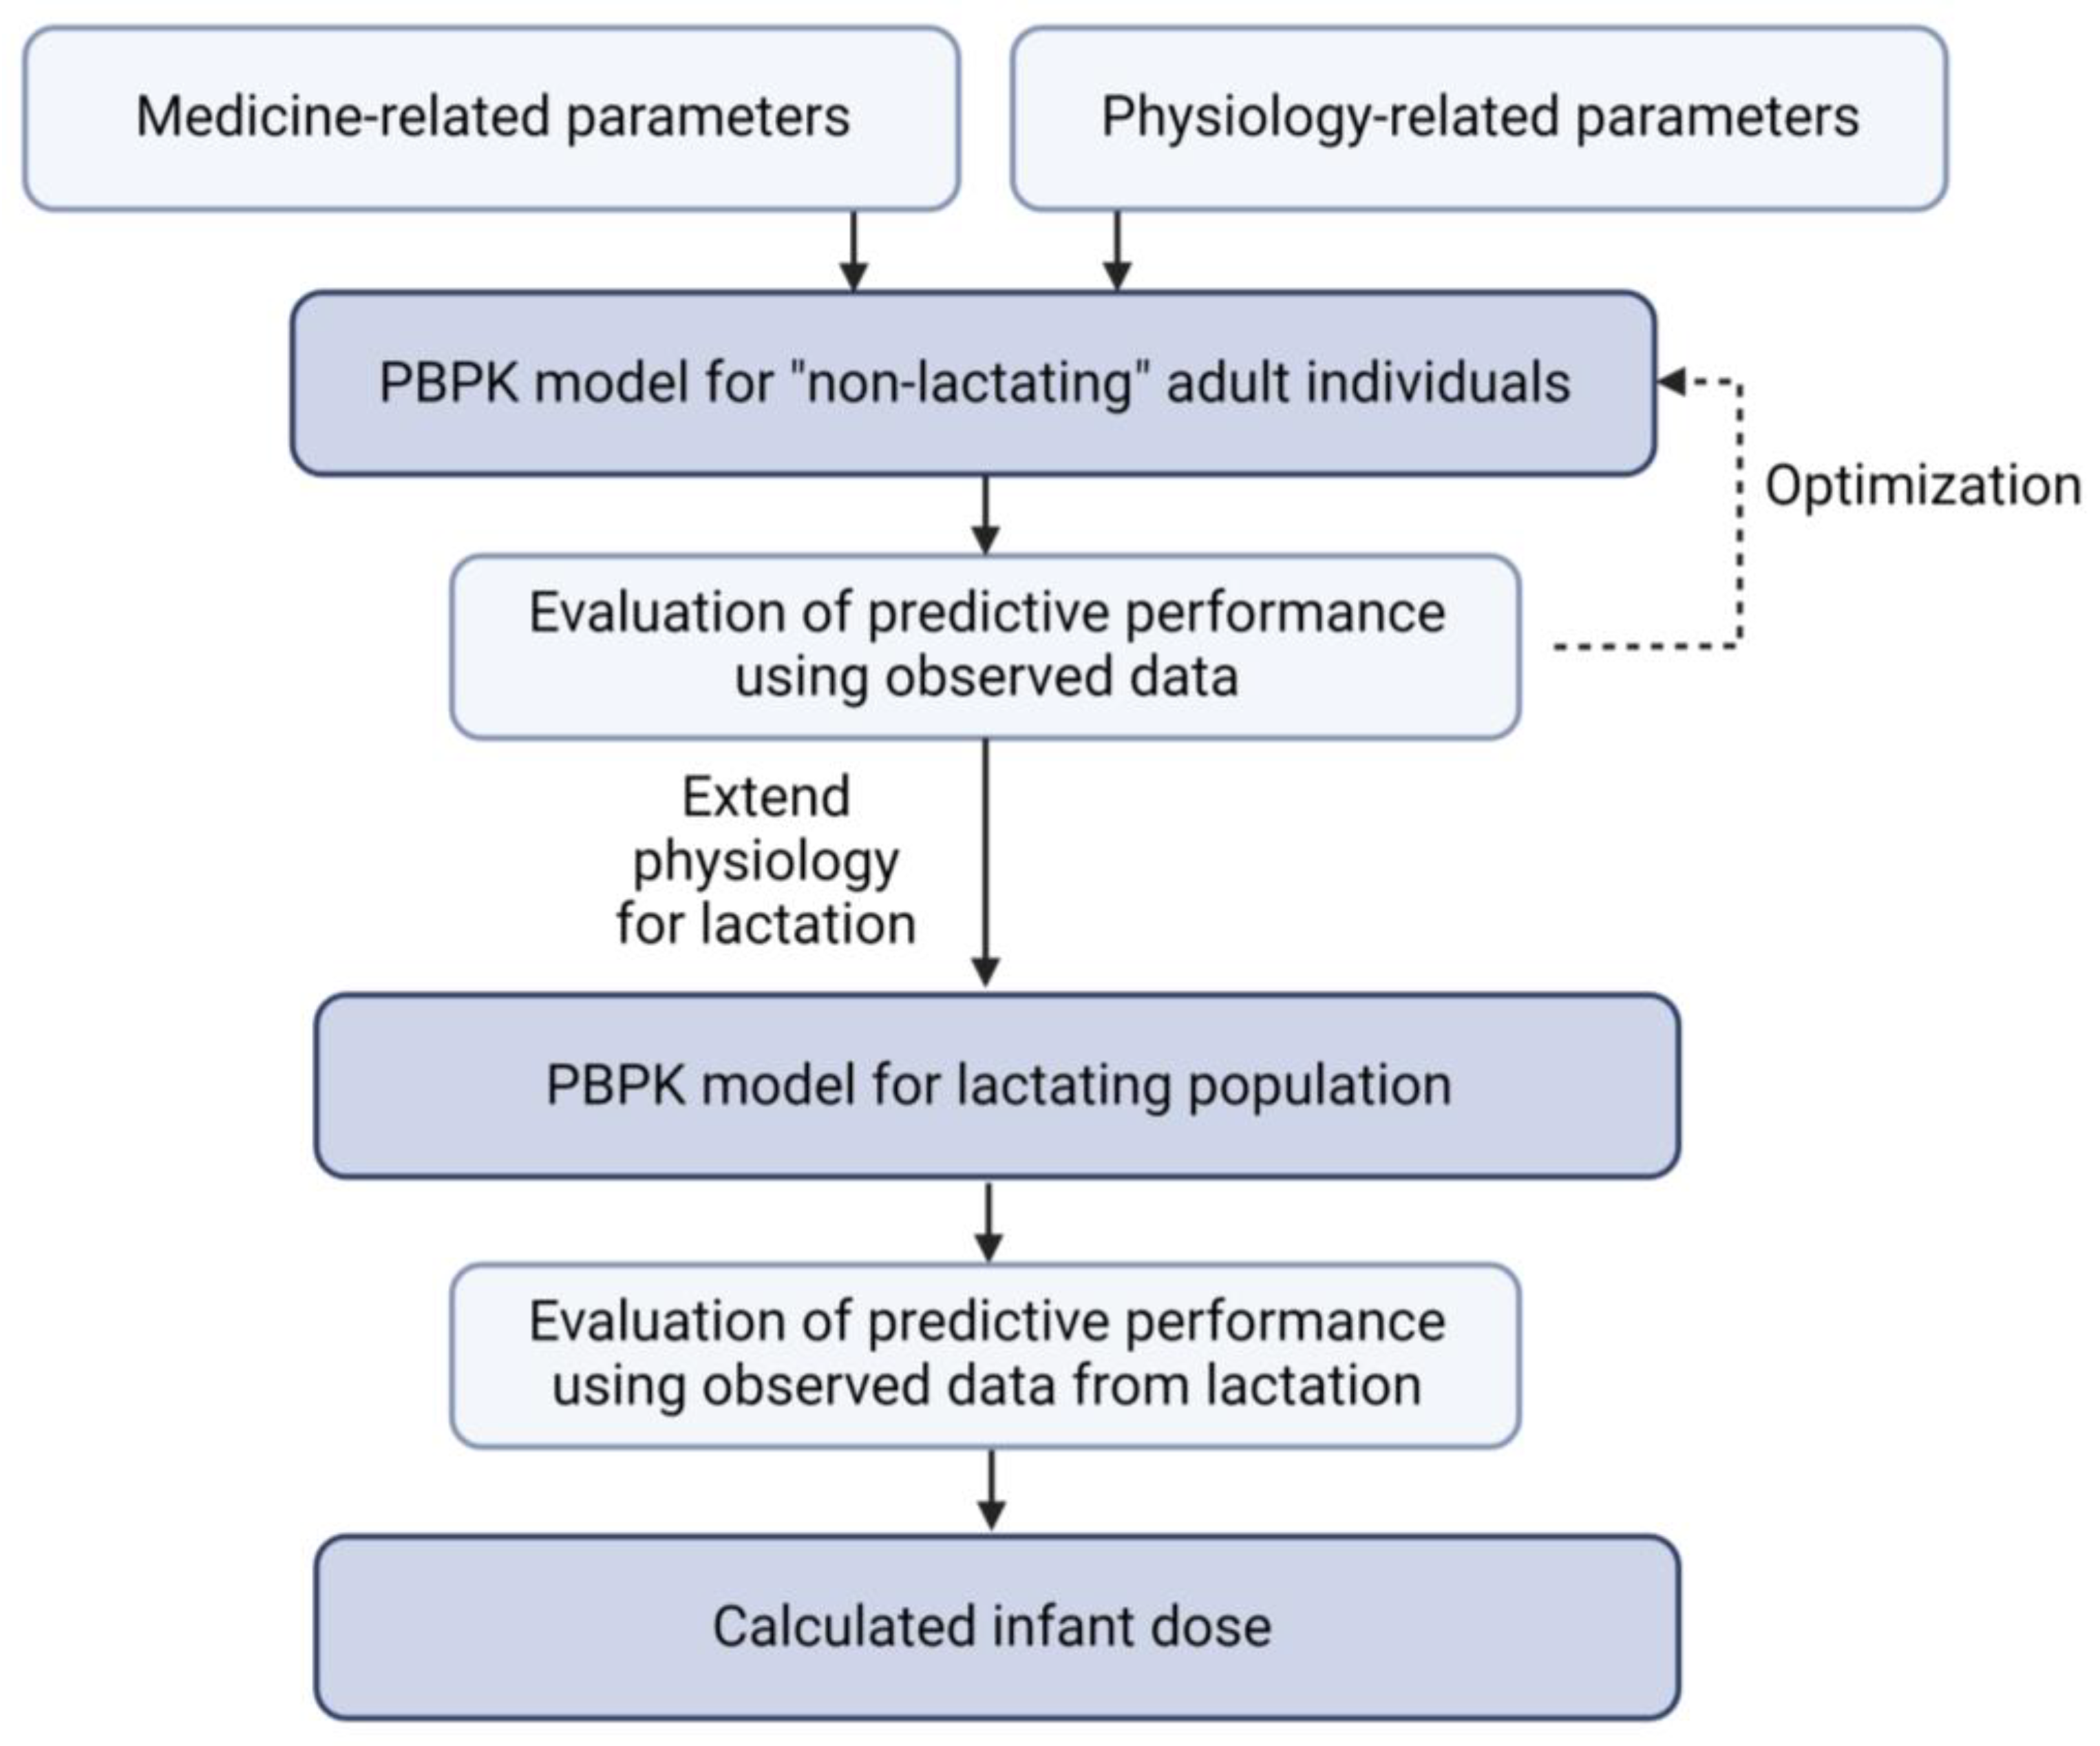
2.2. Generic Workflow
2.3. PBPK Models for “Non-Lactating” Adults
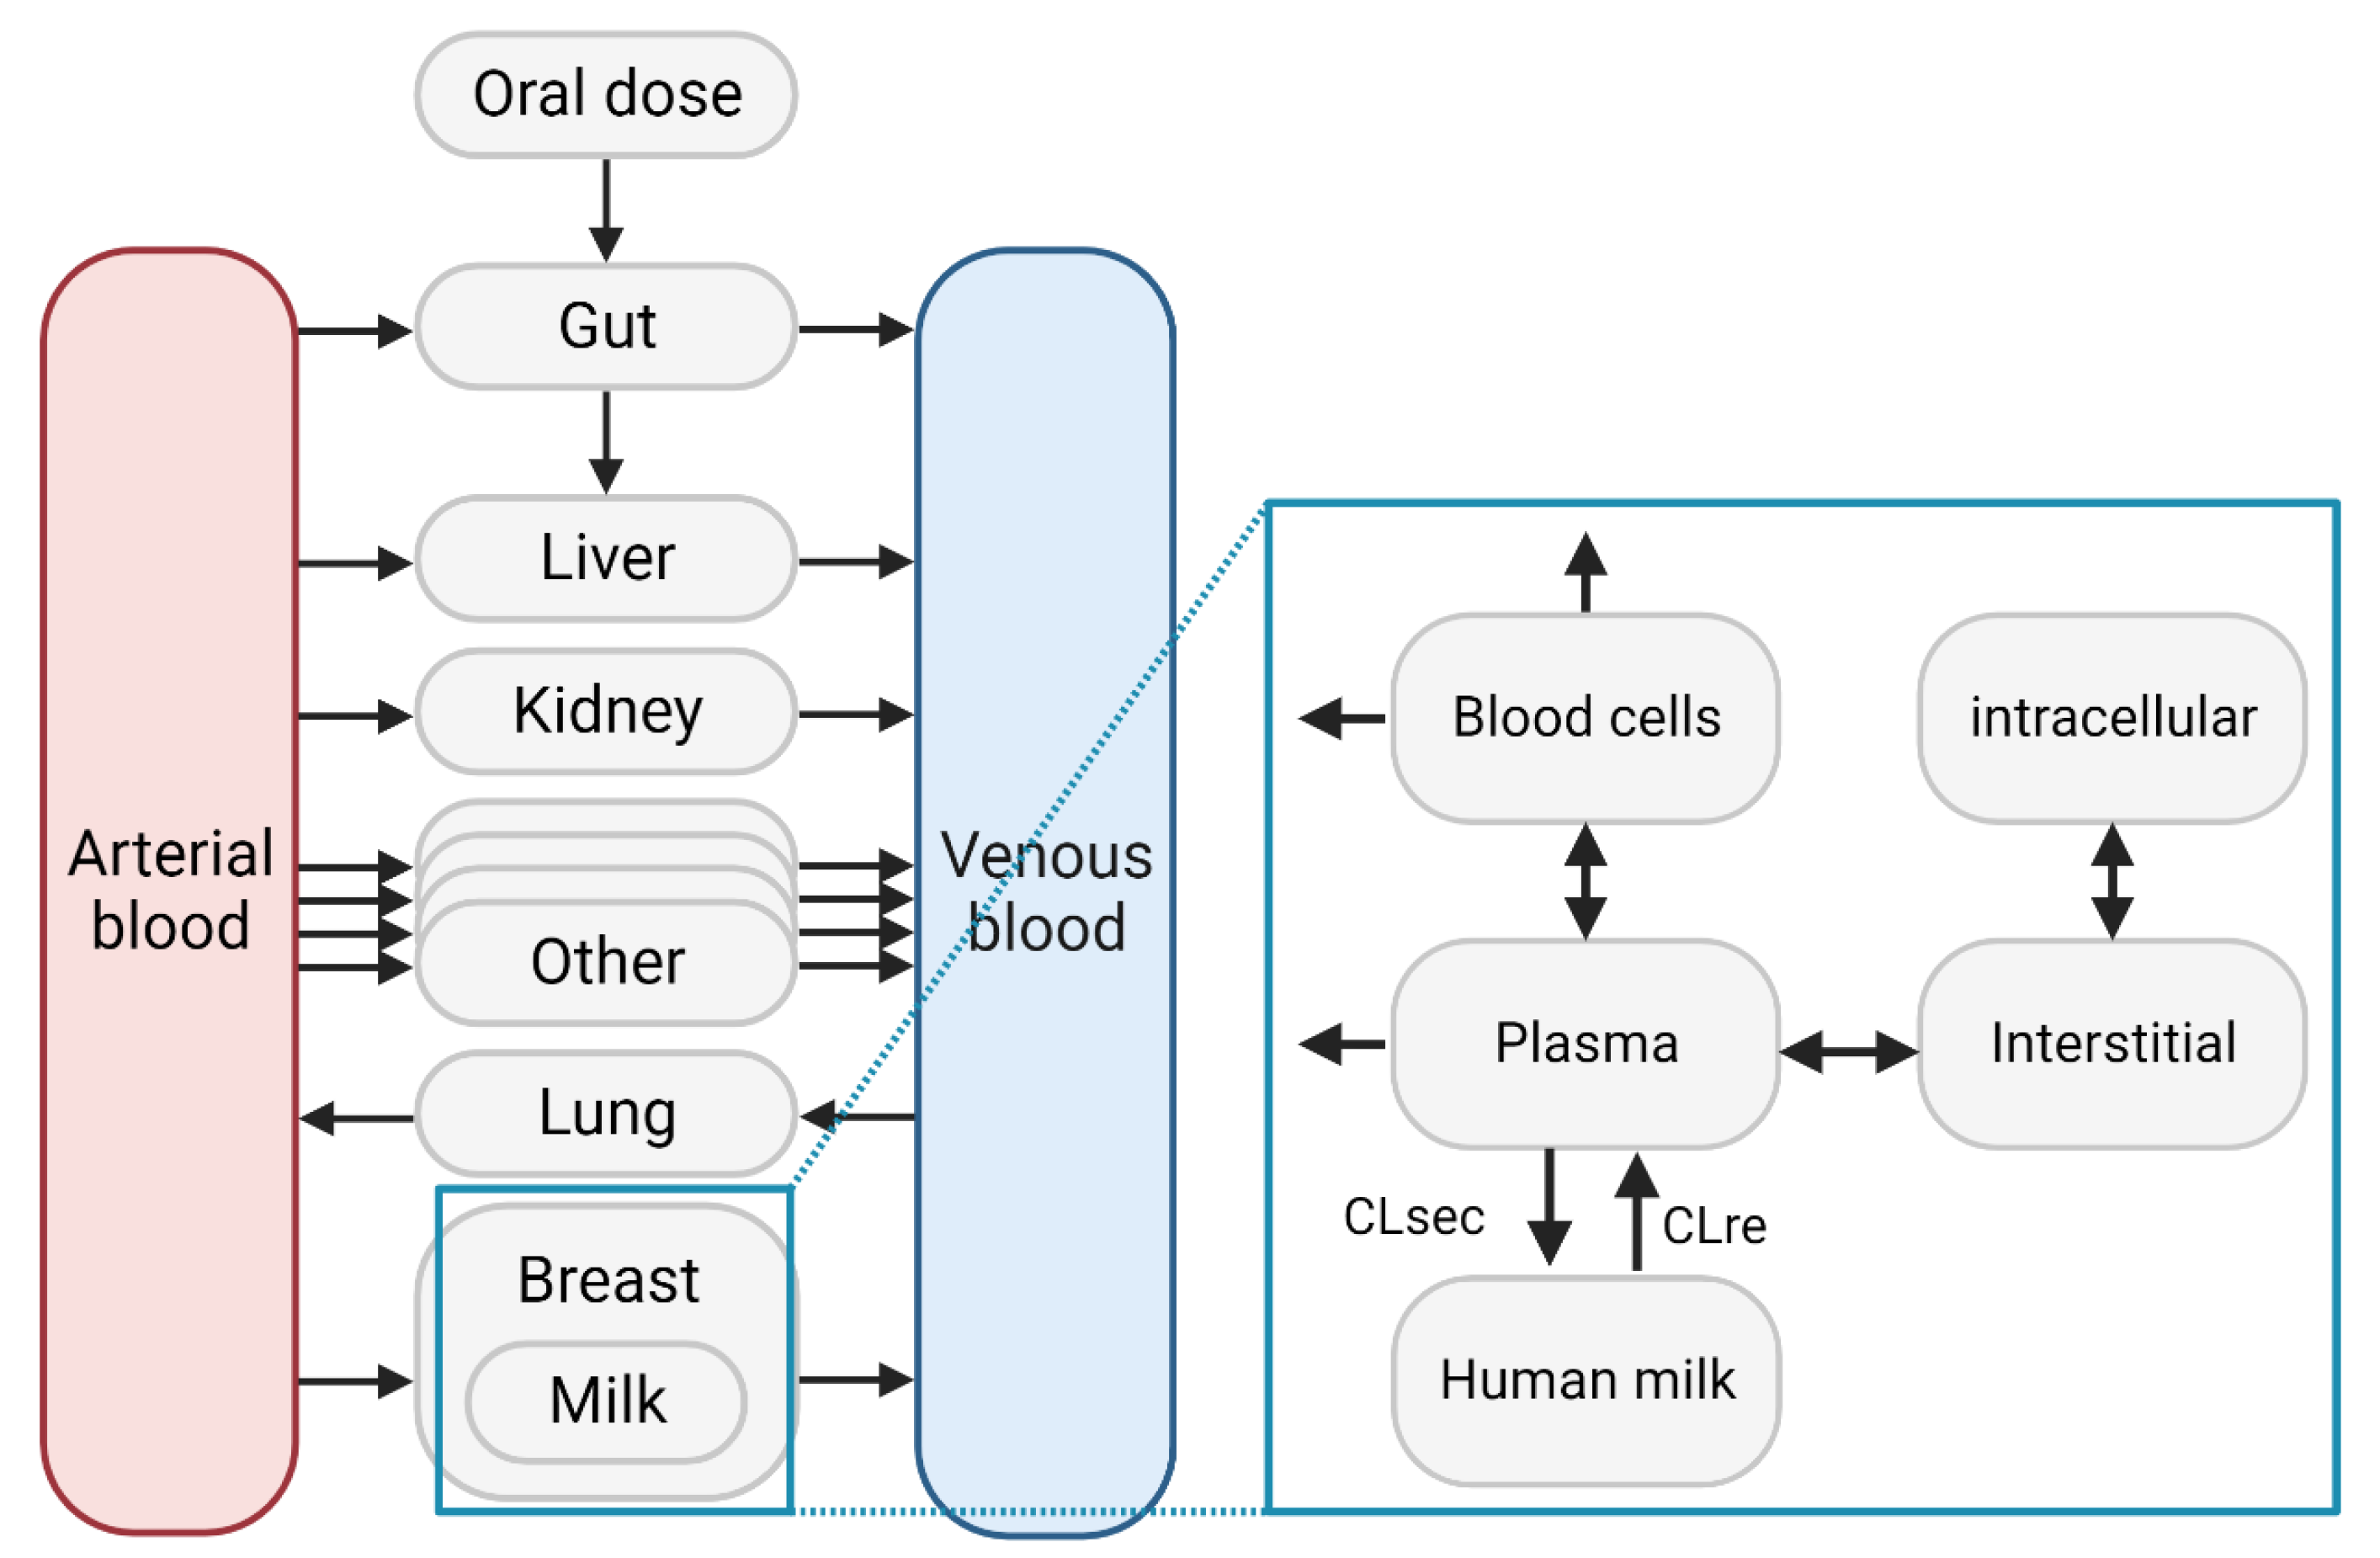
2.4. Lactation PBPK Models
2.5. Infant Dose Calculation
3. Results
3.1. Model Medicines
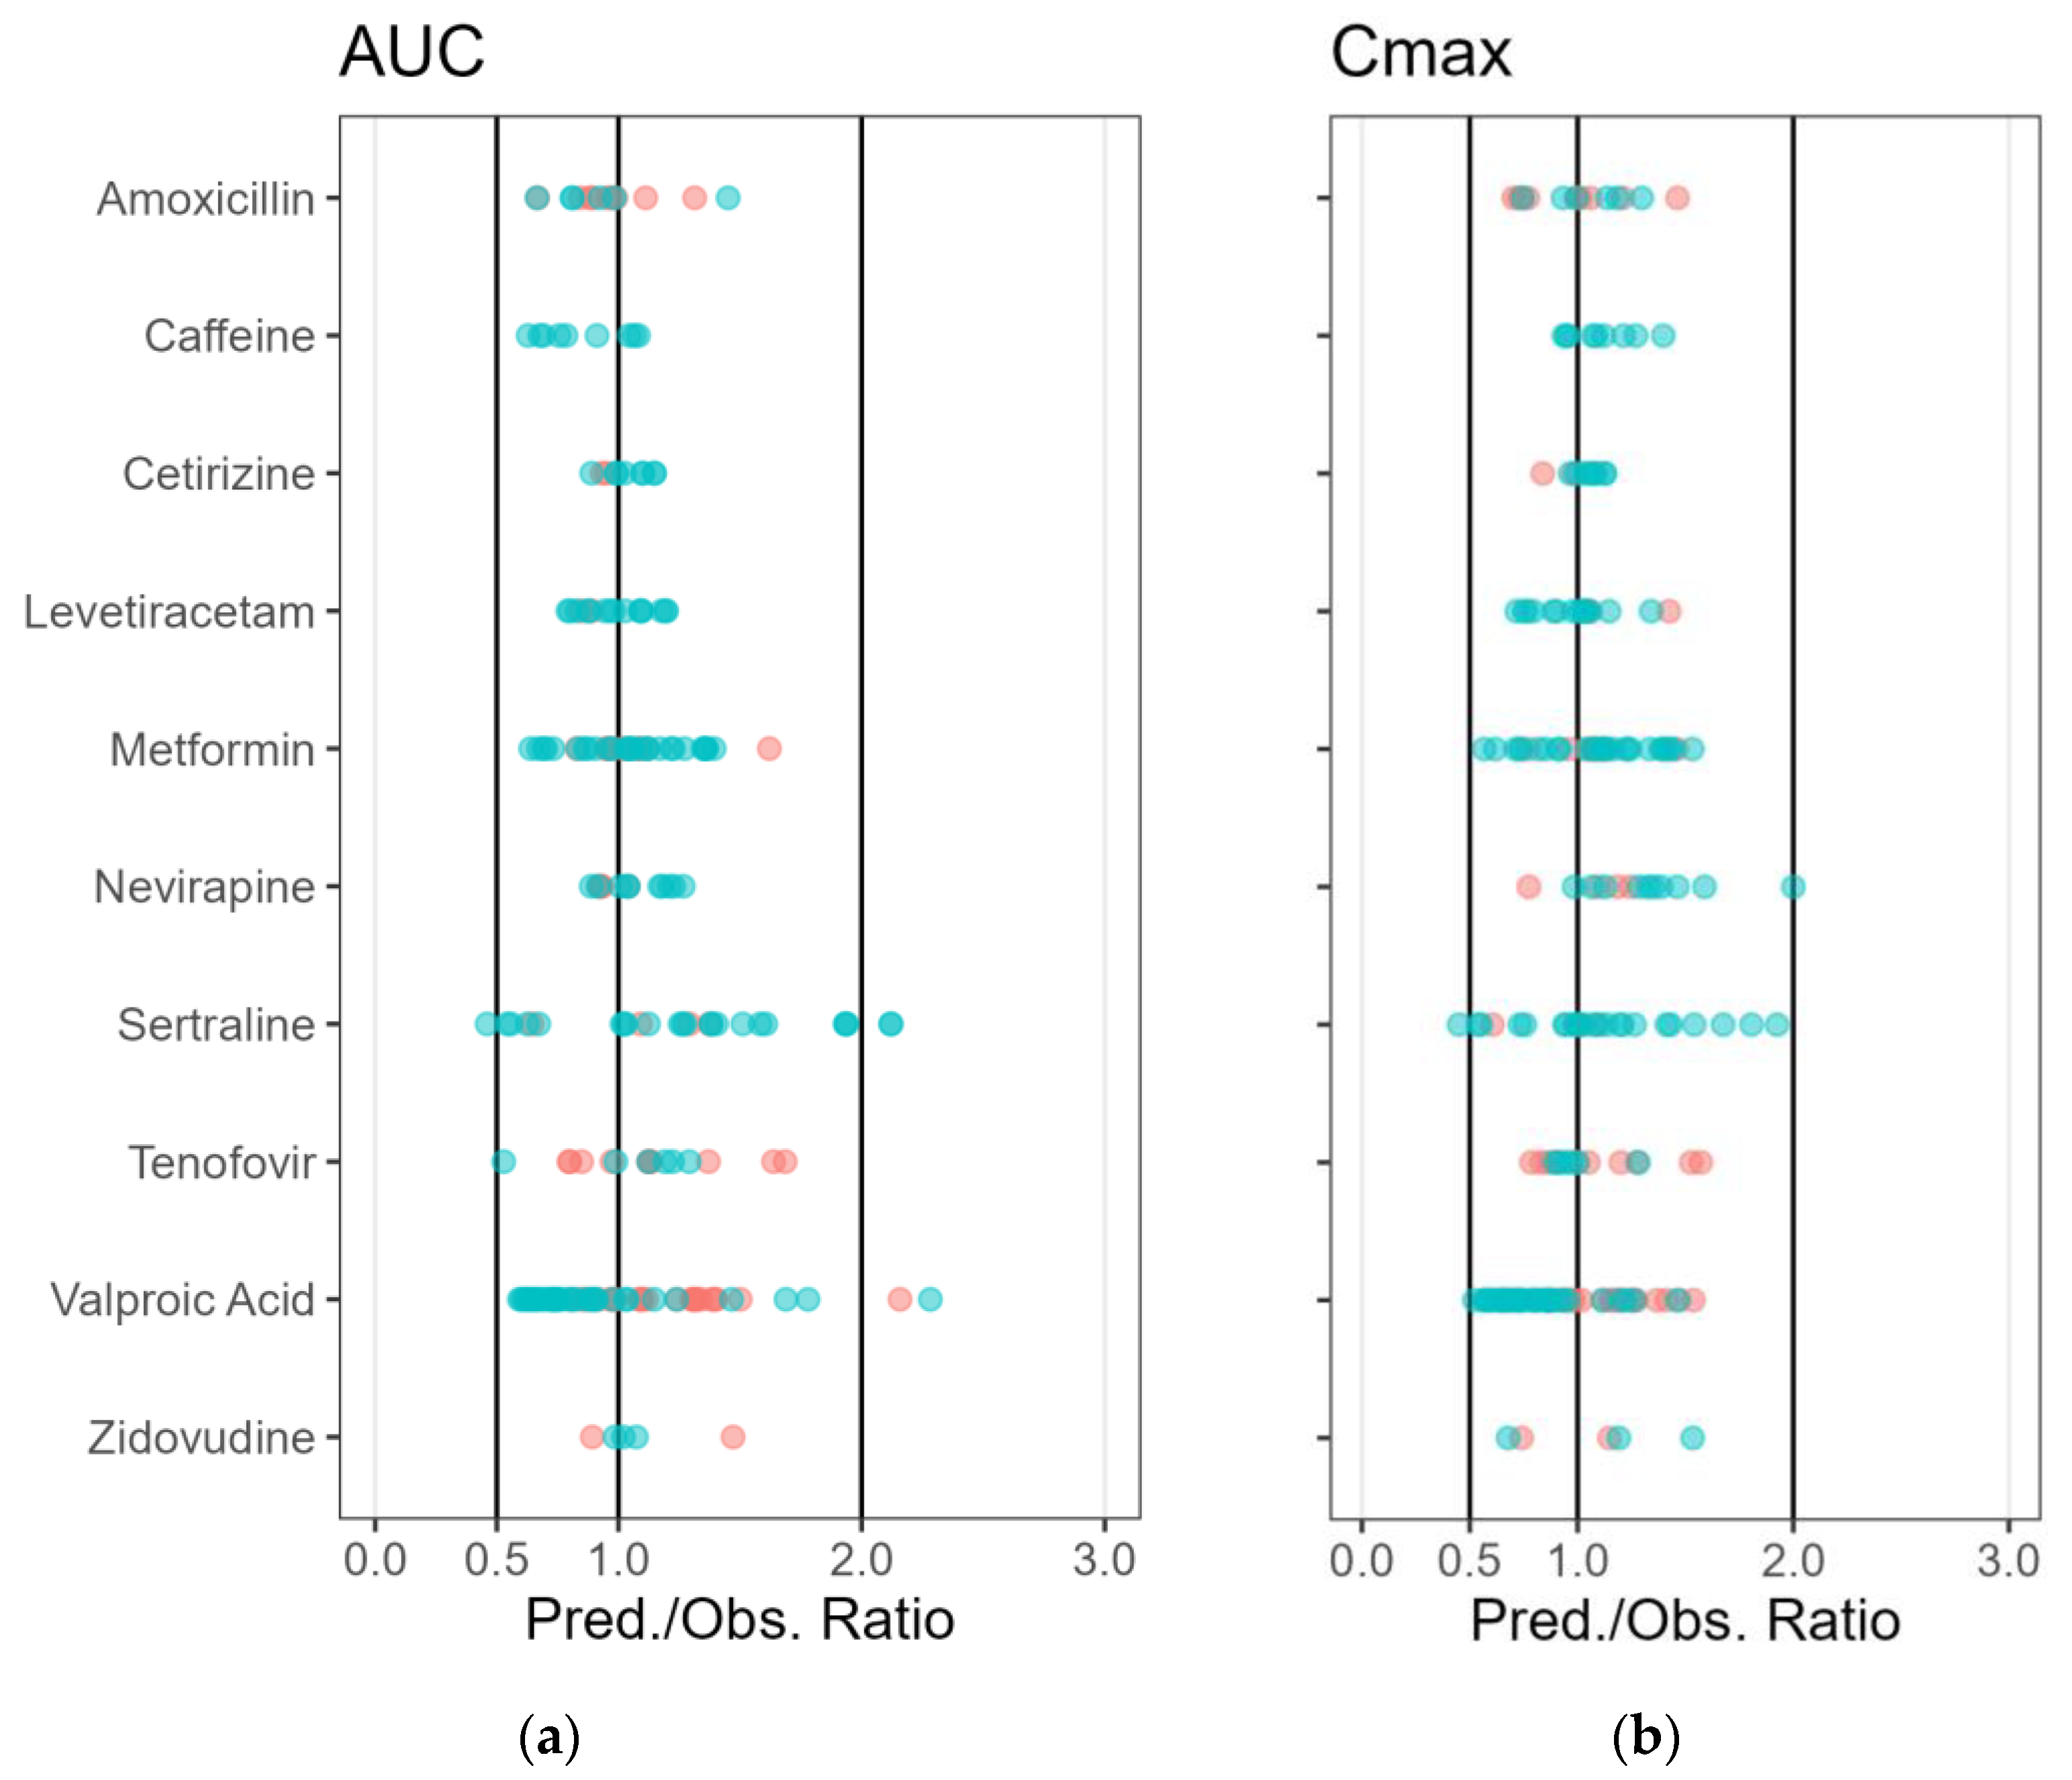
3.2. PBPK Model for “Non-Lactating” Adults
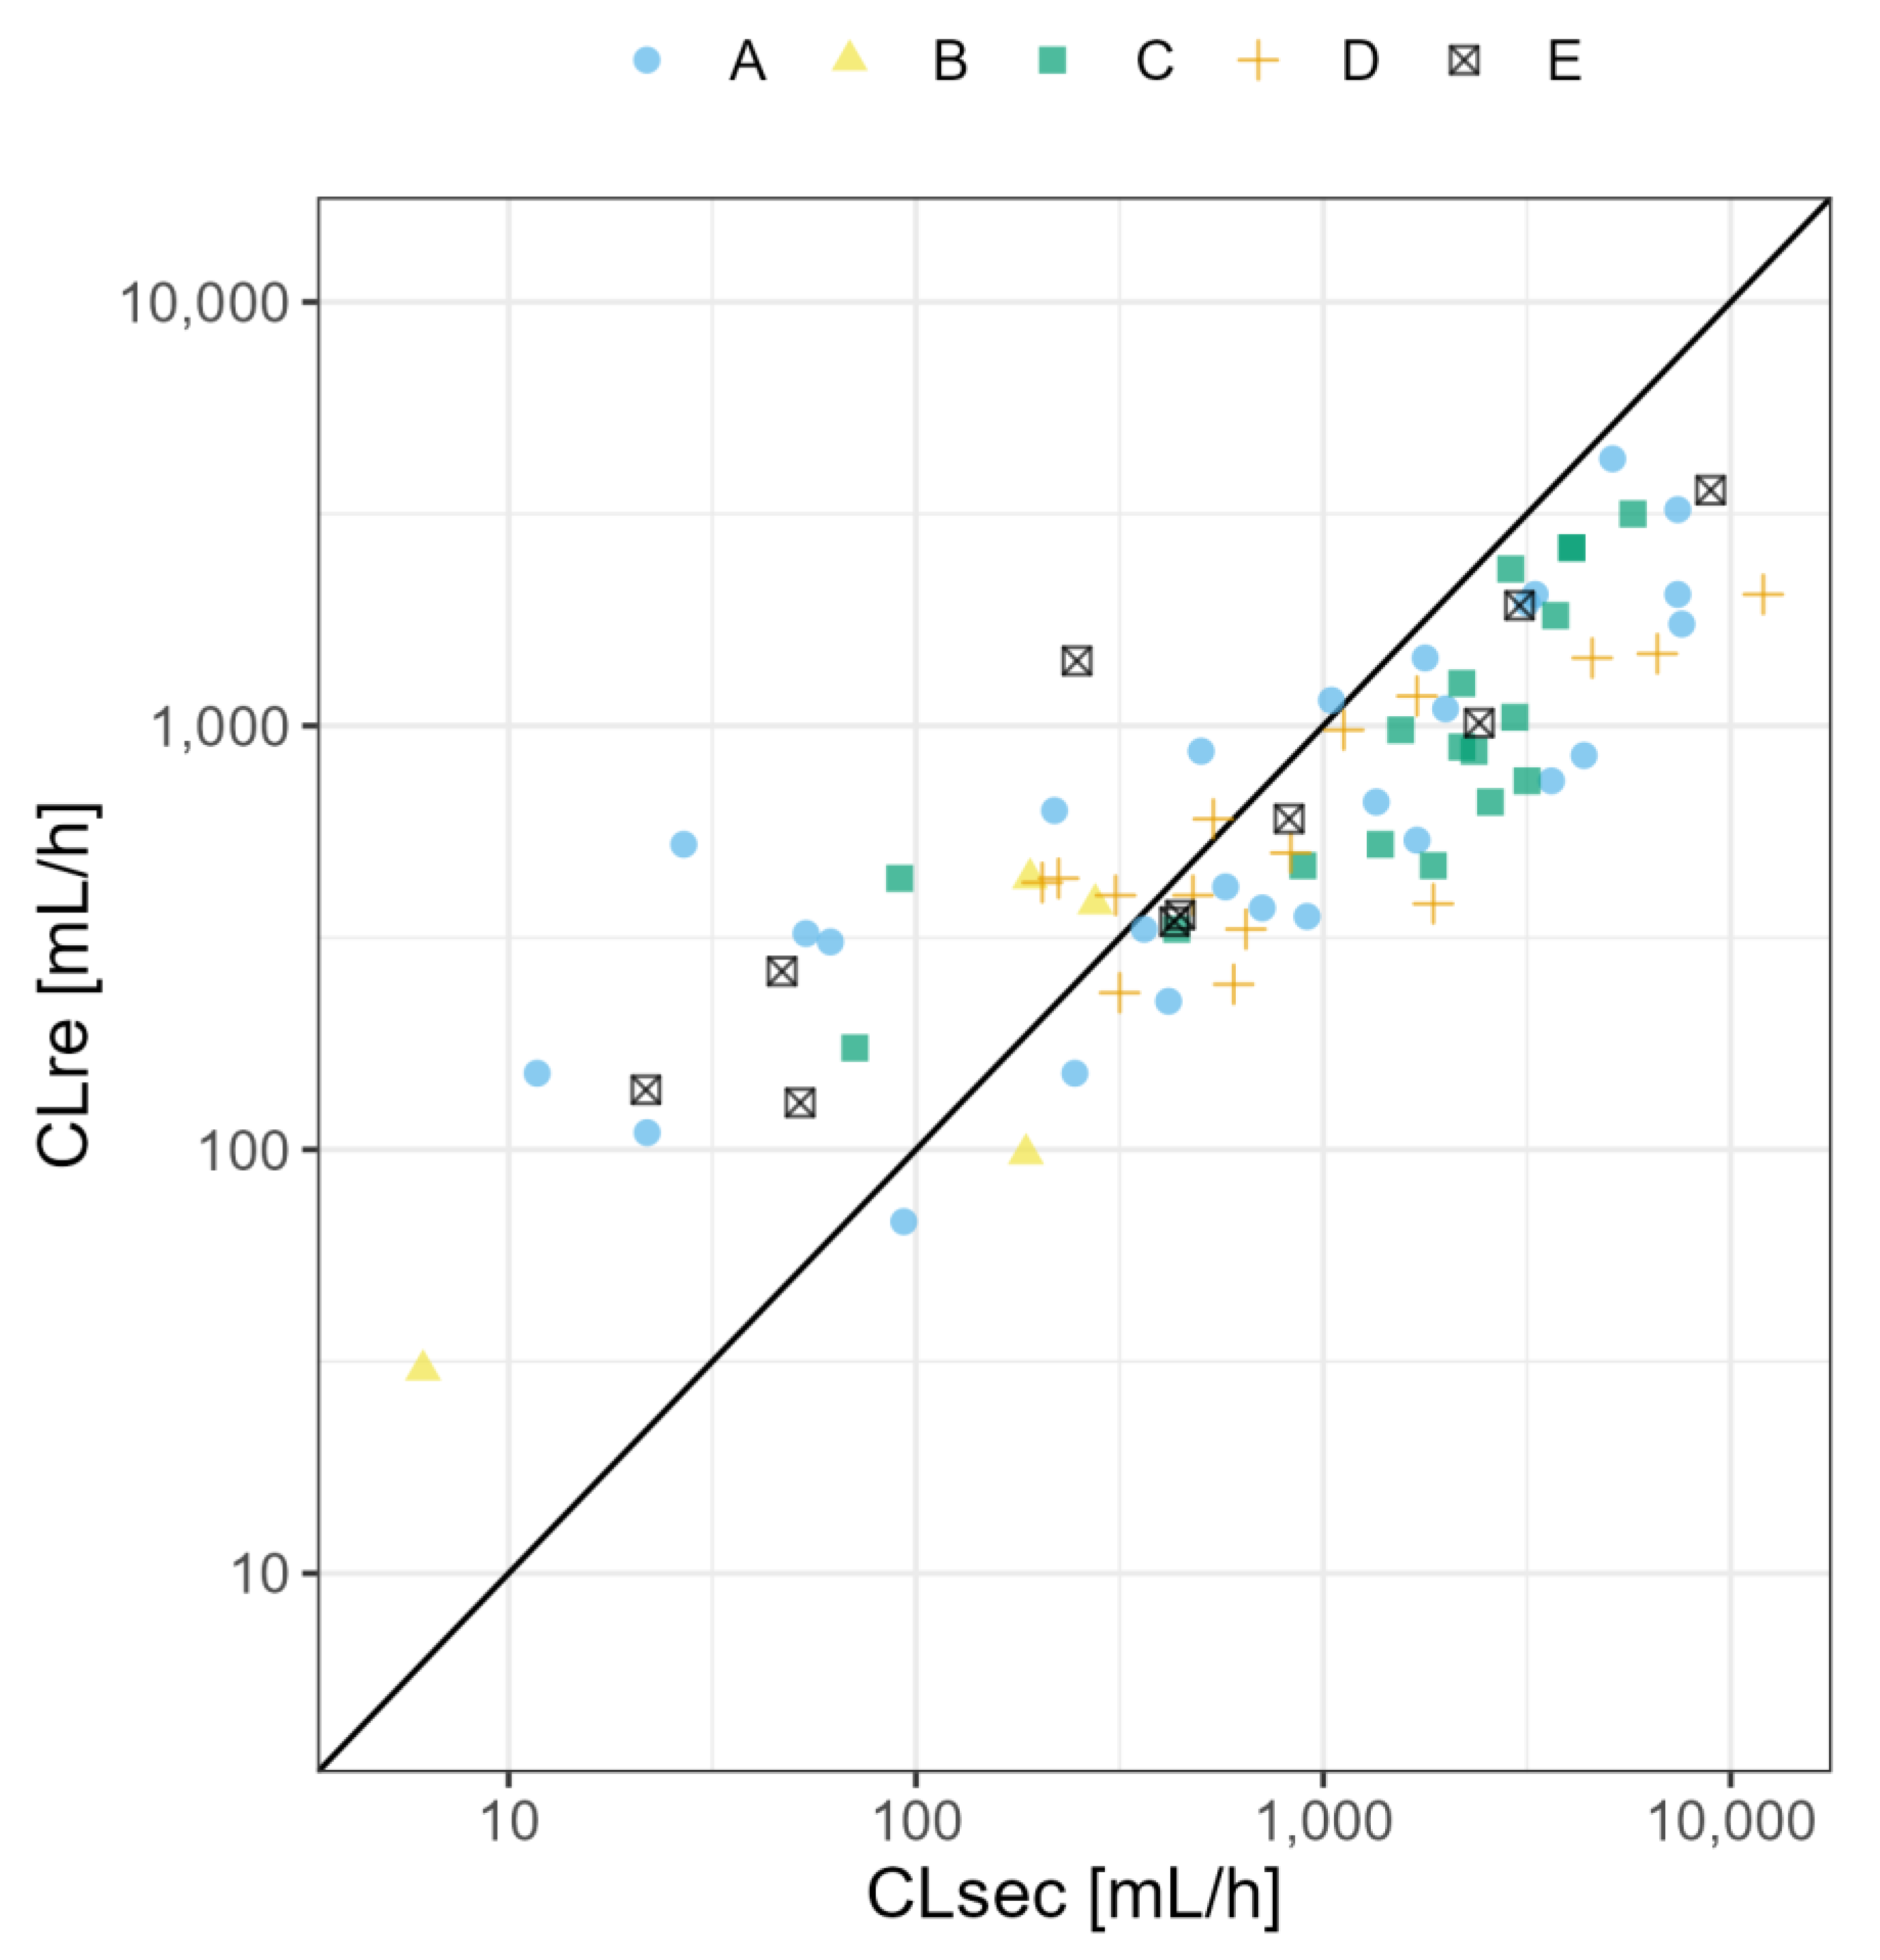
3.3. Lactation PBPK Models
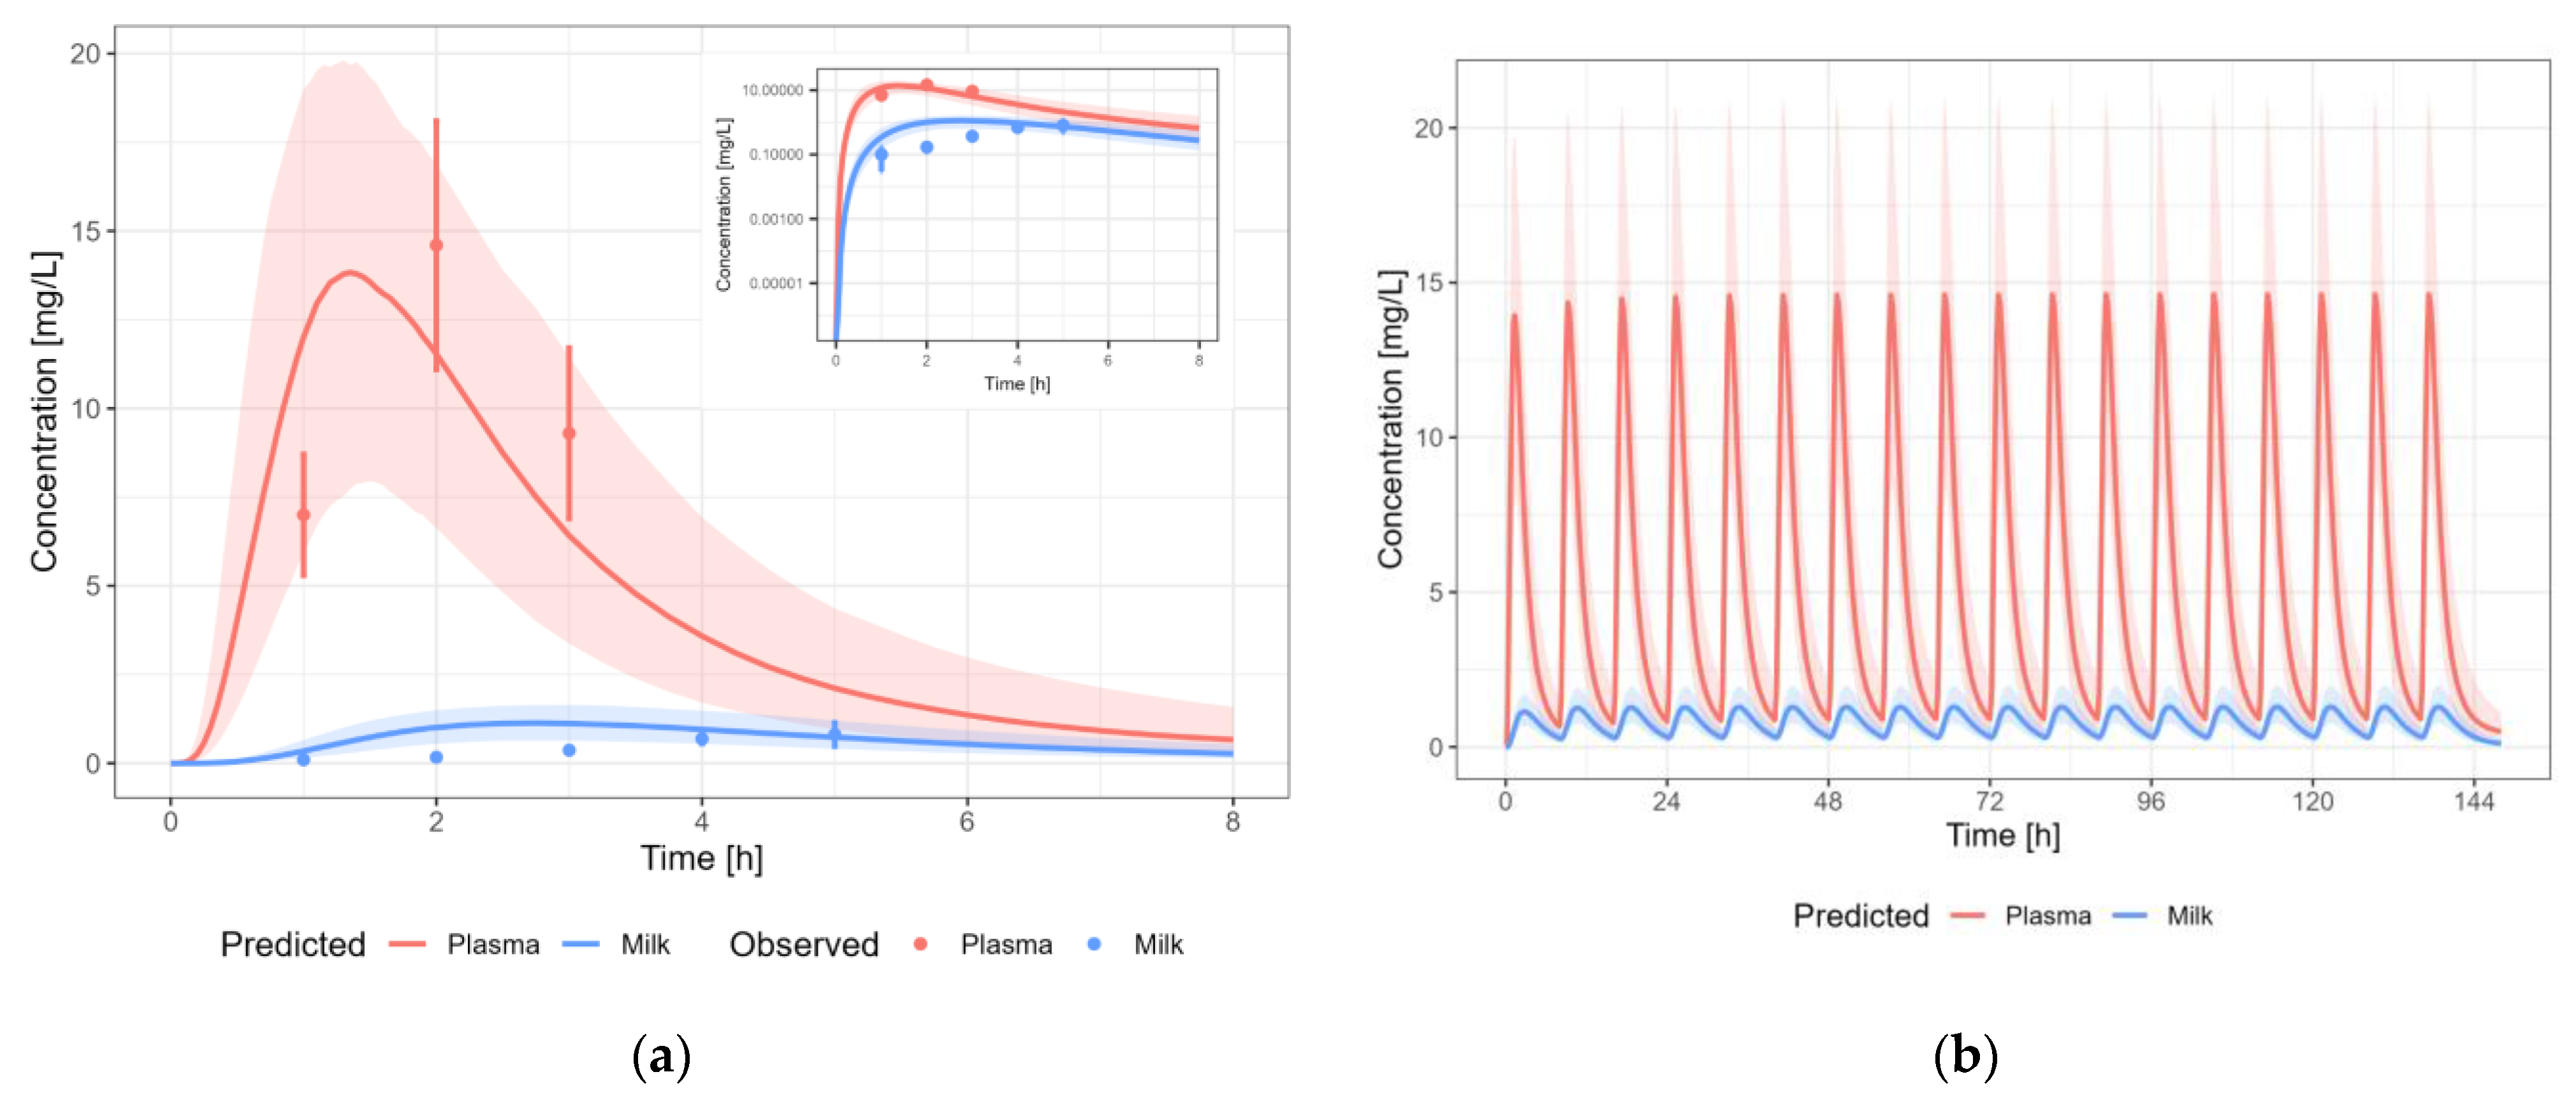
3.3.1. Amoxicillin
3.3.2. Caffeine
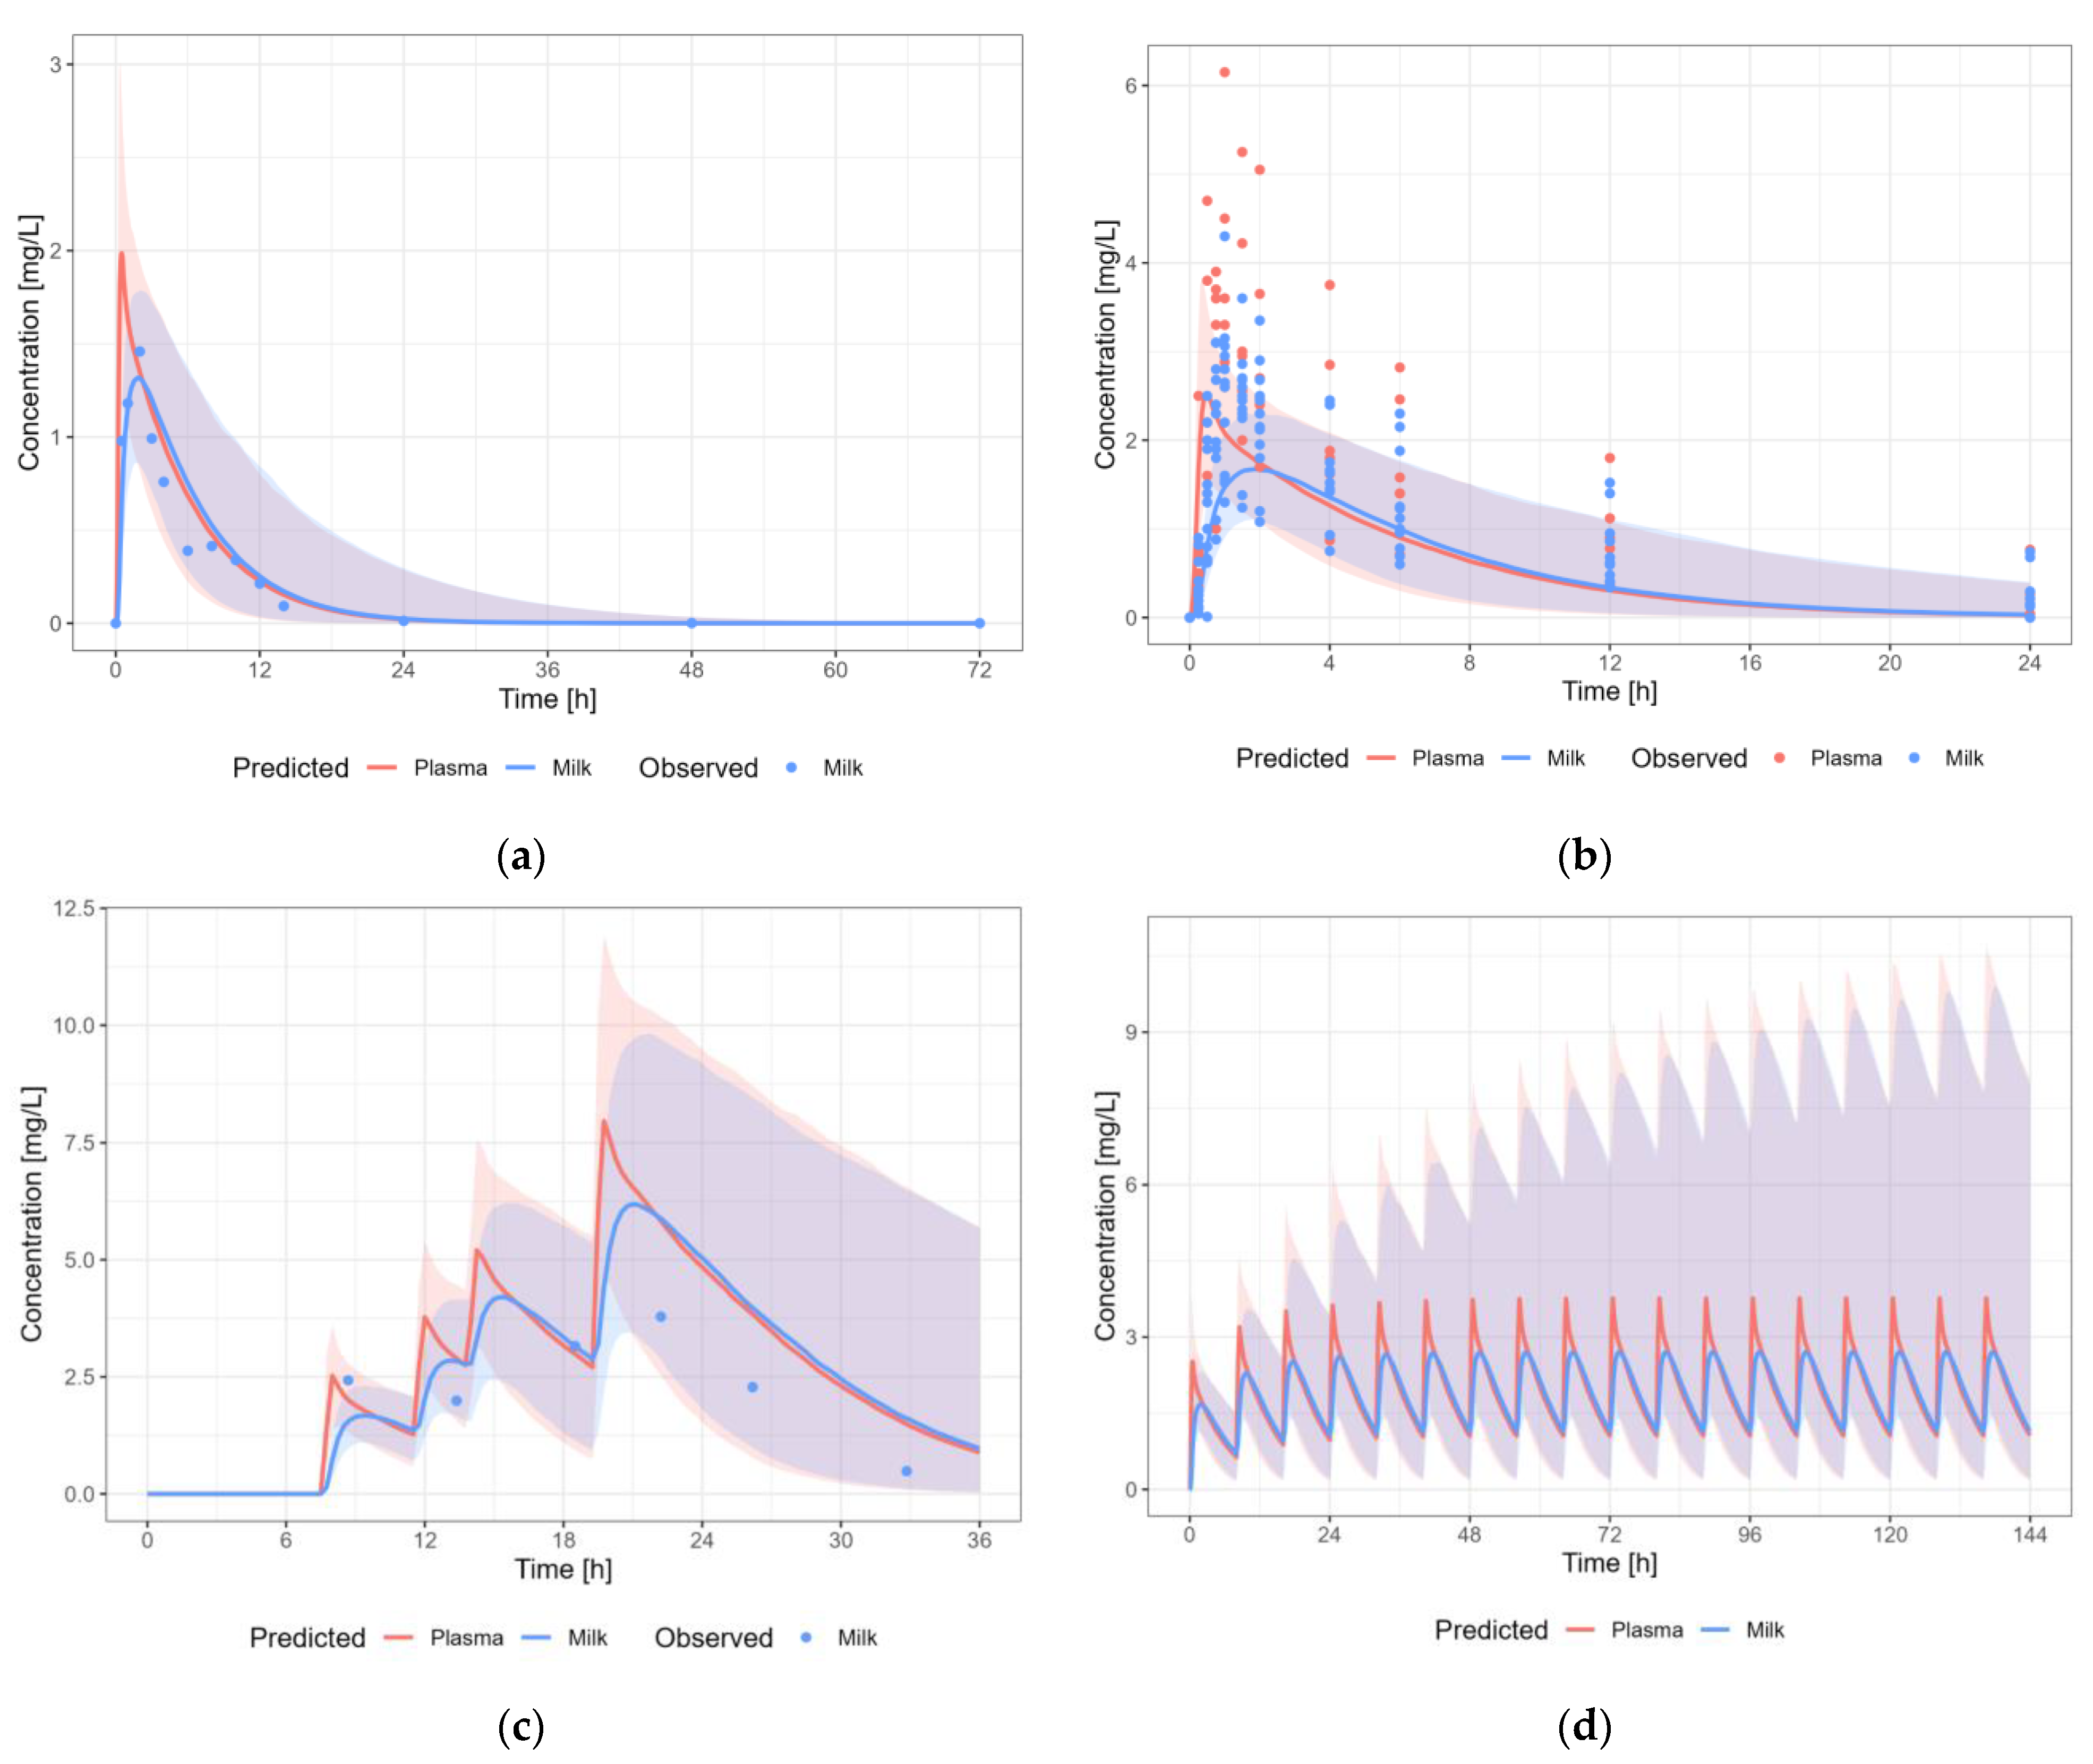
3.3.3. Cetirizine
3.3.4. Levetiracetam
3.3.5. Metformin
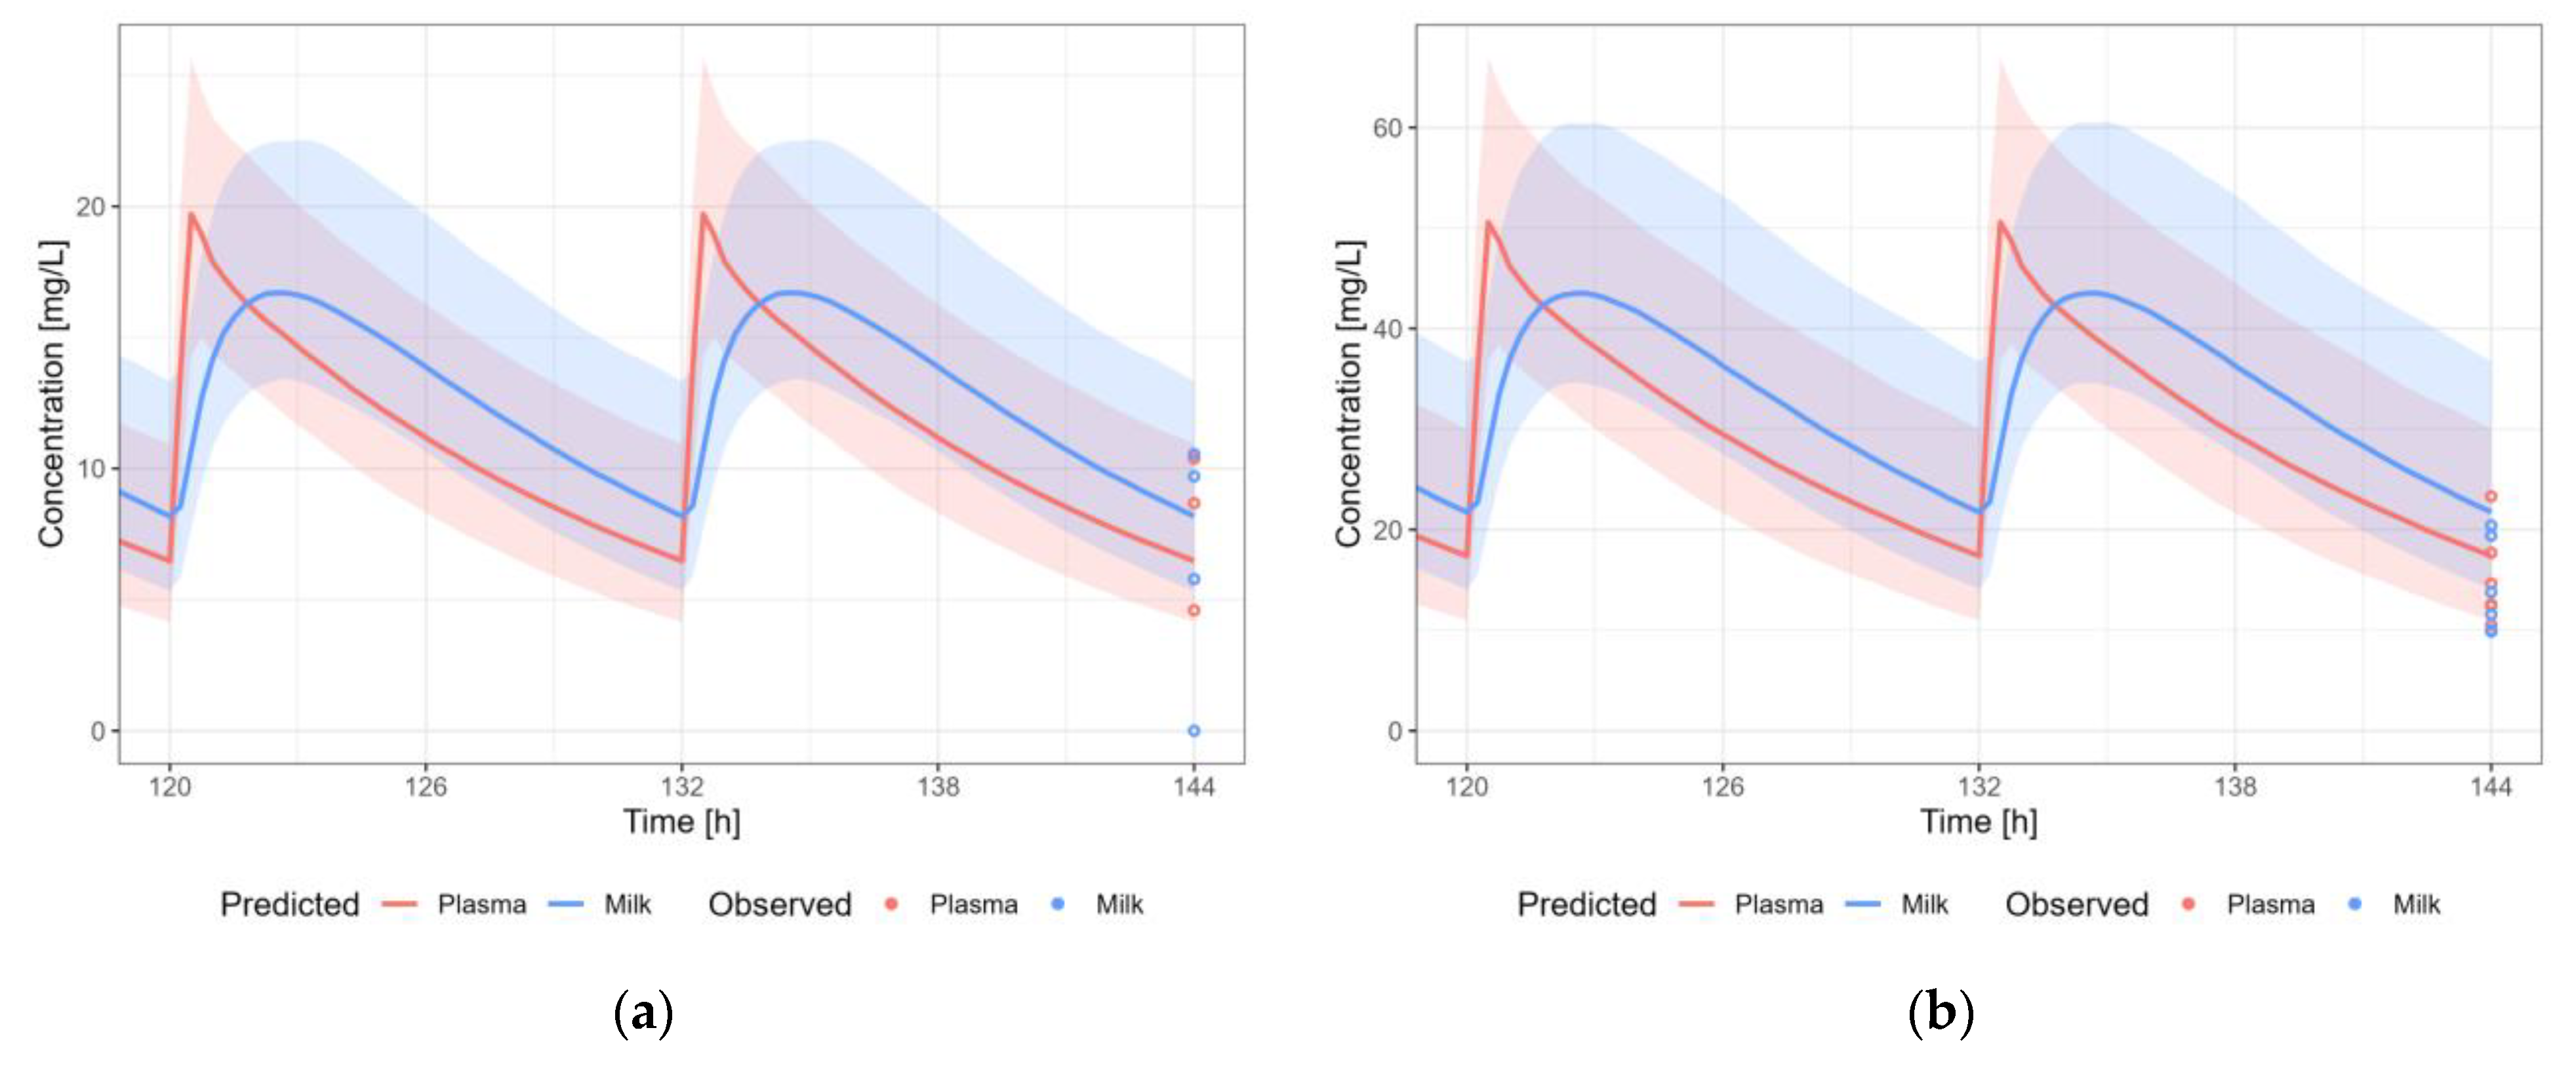
3.3.6. Nevirapine
3.3.7. Sertraline
3.3.8. Tenofovir
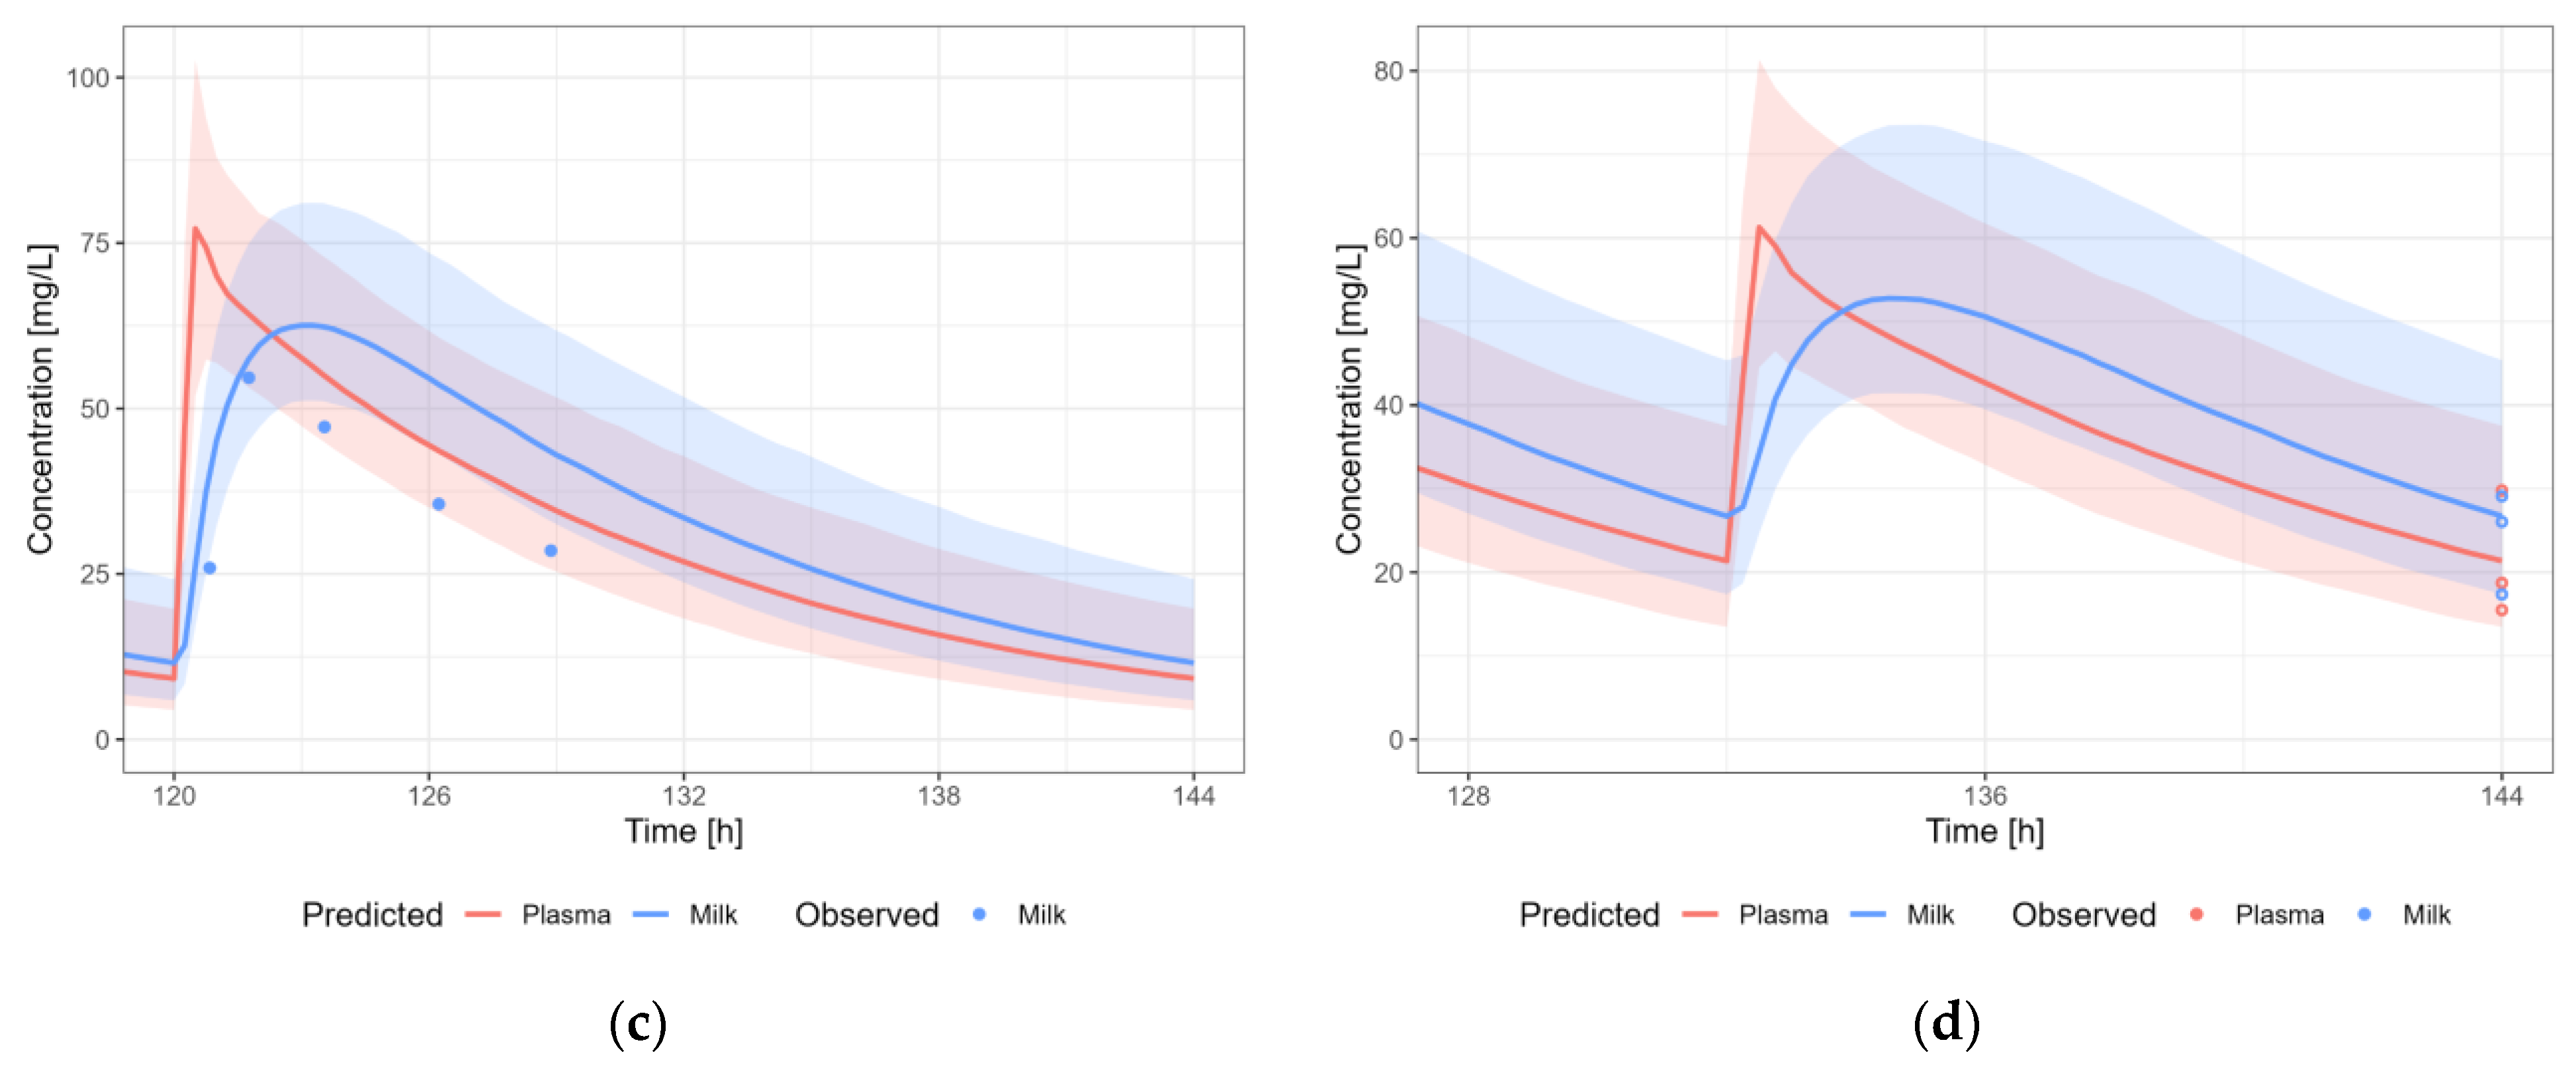
3.3.9. Valproic Acid
3.3.10. Zidovudine
3.4. Infant Dose Calculation
4. Discussion
5. Conclusions
Supplementary Materials
Author Contributions
Funding
Institutional Review Board Statement
Data Availability Statement
Acknowledgments
Conflicts of Interest
References
- Binns, C.; Lee, M.; Low, W.Y. The Long-Term Public Health Benefits of Breastfeeding. Asia-Pac. J. Public Health 2016, 28, 7–14. [Google Scholar] [CrossRef] [PubMed]
- Saha, M.R.; Ryan, K.; Amir, L.H. Postpartum Women’s Use of Medicines and Breastfeeding Practices: A Systematic Review. Int. Breastfeed. J. 2015, 10, 28. [Google Scholar] [CrossRef] [PubMed]
- Fomina, Y.Y.; Byrne, J.J.; Spong, C.Y. Evaluating Strength of Recommendations for Commonly Administered Medications in Lactating Women. J. Matern. Neonatal. Med. 2023, 36, 2163626. [Google Scholar] [CrossRef] [PubMed]
- Nauwelaerts, N.; Deferm, N.; Smits, A.; Bernardini, C.; Lammens, B.; Gandia, P.; Panchaud, A.; Nordeng, H.; Bacci, M.L.; Forni, M.; et al. A Comprehensive Review on Non-Clinical Methods to Study Transfer of Medication into Breast Milk—A Contribution from the ConcePTION Project. Biomed. Pharmacother. 2021, 136, 111038. [Google Scholar] [CrossRef]
- Ventrella, D.; Ashkenazi, N.; Elmi, A.; Allegaert, K.; Aniballi, C.; DeLise, A.; Devine, P.J.; Smits, A.; Steiner, L.; Forni, M.; et al. Animal Models for In Vivo Lactation Studies: Anatomy, Physiology and Milk Compositions in the Most Used Non-Clinical Species: A Contribution from the ConcePTION Project. Animals 2021, 11, 714. [Google Scholar] [CrossRef]
- Dallmann, A.; Himstedt, A.; Solodenko, J.; Ince, I.; Hempel, G.; Eissing, T. Integration of Physiological Changes during the Postpartum Period into a PBPK Framework and Prediction of Amoxicillin Disposition before and Shortly after Delivery. J. Pharmacokinet. Pharmacodyn. 2020, 47, 341–359. [Google Scholar] [CrossRef]
- Abduljalil, K.; Pansari, A.; Ning, J.; Jamei, M. Prediction of Drug Concentrations in Milk during Breastfeeding, Integrating Predictive Algorithms within a Physiologically-Based Pharmacokinetic Model. CPT Pharmacomet. Syst. Pharmacol. 2021, 10, 878–889. [Google Scholar] [CrossRef]
- Pansari, A.; Faisal, M.; Jamei, M.; Abduljalil, K. Prediction of Basic Drug Exposure in Milk Using a Lactation Model Algorithm Integrated within a Physiologically Based Pharmacokinetic Model. Biopharm. Drug Dispos. 2022, 43, 201–212. [Google Scholar] [CrossRef]
- Zhang, T.; Zou, P.; Fang, Y.; Li, Y. Physiologically Based Pharmacokinetic Model to Predict Drug Concentrations of Breast Cancer Resistance Protein Substrates in Milk. Biopharm. Drug Dispos. 2022, 43, 221–232. [Google Scholar] [CrossRef]
- Job, K.M.; Dallmann, A.; Parry, S.; Saade, G.; Haas, D.M.; Hughes, B.; Berens, P.; Chen, J.; Fu, C.; Humphrey, K.; et al. Development of a Generic Physiologically-Based Pharmacokinetic Model for Lactation and Prediction of Maternal and Infant Exposure to Ondansetron via Breast Milk. Clin. Pharmacol. Ther. 2022, 111, 1111–1120. [Google Scholar] [CrossRef]
- Fleishaker, J.C.; Desai, N.; McNamara, P.J. Factors Affecting the Milk-to-Plasma Drug Concentration Ratio in Lactating Women: Physical Interactions with Protein and Fat. J. Pharm. Sci. 1987, 76, 189–193. [Google Scholar] [CrossRef]
- Atkinson, U.C.; Begg, E.J.E.J.; Atkinson, H.C.; Begg, E.J.E.J. Prediction of Drug Distribution into Human Milk from Physicochemical Characteristics. Clin. Pharmacokinet. 1990, 18, 151–167. [Google Scholar] [CrossRef]
- Backman, T.W.H.; Cao, Y.; Girke, T. ChemMine Tools: An Online Service for Analyzing and Clustering Small Molecules. Nucleic Acids Res. 2011, 39, W486–W491. [Google Scholar] [CrossRef]
- Kuepfer, L.; Niederalt, C.; Wendl, T.; Schlender, J.; Willmann, S.; Lippert, J.; Block, M.; Eissing, T.; Teutonico, D. Applied Concepts in PBPK Modeling: How to Build a PBPK/PD Model. CPT Pharmacomet. Syst. Pharmacol. 2016, 5, 516–531. [Google Scholar] [CrossRef]
- European Medicines Agency. Committee for Medicinal Products for Human Use (CHMP). Guideline on the Reporting of Physiologically Based Pharmacokinetic (PBPK) Modelling and Simulation; European Medicines Agency: London, UK, 2018; Volume 44. [Google Scholar]
- Dallmann, A.; Solodenko, J.; Ince, I.; Eissing, T. Applied Concepts in PBPK Modeling: How to Extend an Open Systems Pharmacology Model to the Special Population of Pregnant Women. CPT Pharmacomet. Syst. Pharmacol. 2018, 7, 419–431. [Google Scholar] [CrossRef]
- Koshimichi, H.; Ito, K.; Hisaka, A.; Honma, M.; Suzuki, H. Analysis and Prediction of Drug Transfer into Human Milk Taking into Consideration Secretion and Reuptake Clearances across the Mammary Epithelia. Drug Metab. Dispos. 2011, 39, 2370–2380. [Google Scholar] [CrossRef]
- FDA. Clinical Lactation Studies: Considerations for Study Design Guidance for Industry. Draft Guidance; FDA: Rockville, MD, USA, 2019; pp. 1–4. [Google Scholar]
- Hanke, N.; Türk, D.; Selzer, D.; Ishiguro, N.; Ebner, T.; Wiebe, S.; Müller, F.; Stopfer, P.; Nock, V.; Lehr, T. A Comprehensive Whole-Body Physiologically Based Pharmacokinetic Drug–Drug–Gene Interaction Model of Metformin and Cimetidine in Healthy Adults and Renally Impaired Individuals. Clin. Pharmacokinet. 2020, 59, 1419–1431. [Google Scholar] [CrossRef]
- Huddart, R.; Hicks, J.K.; Ramsey, L.B.; Strawn, J.R.; Smith, D.M.; Bobonis Babilonia, M.; Altman, R.B.; Klein, T.E. PharmGKB Summary: Sertraline Pathway, Pharmacokinetics. Pharmacogenet. Genom. 2020, 30, 26–33. [Google Scholar] [CrossRef]
- Kafetzis, A.; Siafas, C.A.; Georgakopoulos, P.A.; Papadatos, C.J. Passage of cephalosporins and amoxicillin into the breast milk. Acta Paediatr. Scand. 1981, 70, 285–288. [Google Scholar] [CrossRef]
- Findlay, J.W.A.; DeAngelis, R.L.; Kearney, M.F.; Welch, R.M.; Findlay, J.M. Analgesie Drugs in Breast Milk and Plasma*. Clin. Pharmacol. Ther. 1981, 29, 625–633. [Google Scholar] [CrossRef]
- Stavchansky, S.; Delgado, M.; Joshi, A.; Combs, A.; Sagraves, R. Pharmacokinetics of Caffeine in Breast Milk and Plasma after Single Oral Administration of Caffeine to Lactating Mothers. Biopharm. Drug Dispos. 1988, 9, 285–299. [Google Scholar] [CrossRef] [PubMed]
- Tyrala, E.E.; Dodson, W.E. Caffeine Secretion into Breast Milk. Arch. Dis. Child. 1979, 54, 787–800. [Google Scholar] [CrossRef] [PubMed]
- Wilkerson, H.; Datta, P.; Rewers-Felkins, K.; Baker, T.; Hale, T.W. Maternal Transfer of Cetirizine into Human Milk. J. Hum. Lact. 2021, 37, 135–138. [Google Scholar] [CrossRef] [PubMed]
- Korsgren, M.; Andersson, M.; Borgå, O.; Larsson, L.; Aldén-Raboisson, M.; Malmqvist, U.; Greiff, L. Clinical Efficacy and Pharmacokinetic Profiles of Intranasal and Oral Cetirizine in a Repeated Allergen Challenge Model of Allergic Rhinitis. Ann. Allergy Asthma Immunol. 2007, 98, 316–321. [Google Scholar] [CrossRef]
- Dinavitser, N.; Kohn, E.; Berlin, M.; Brandriss, N.; Bar-Chaim, A.; Keidar, R.; Livne, A.; Stepensky, D.; Berkovitch, M.; Sheinberg, R. Levetiracetam in Lactation: How Much Is Excreted into Human Breast Milk? Br. J. Clin. Pharmacol. 2022, 88, 199–205. [Google Scholar] [CrossRef]
- Johannessen, S.I.; Helde, G.; Brodtkorb, E. Levetiracetam Concentrations in Serum and in Breast Milk at Birth and during Lactation. Epilepsia 2005, 46, 775–777. [Google Scholar] [CrossRef]
- Kacirova, I.; Grundmann, M.; Brozmanova, H. Umbilical Cord, Maternal Milk and Breastfed Infant Levetiracetam Concentrations Monitoring at Delivery and during Early Postpartum Period. Pharmaceutics 2021, 13, 398. [Google Scholar] [CrossRef]
- Tomson, T.; Palm, R.; Källén, K.; Ben-Menachem, E.; Söderfeldt, B.; Danielsson, B.; Johansson, R.; Luef, G.; Öhman, I. Pharmacokinetics of Levetiracetam during Pregnancy, Delivery, in the Neonatal Period, and Lactation. Epilepsia 2007, 48, 1111–1116. [Google Scholar] [CrossRef]
- Briggs, G.G.; Ambrose, P.J.; Nageotte, M.P.; Padilla, G.; Wan, S. Excretion of Metformin into Breast Milk and the Effect on Nursing Infants. Obstet. Gynecol. 2005, 105, 1437–1441. [Google Scholar] [CrossRef]
- Eyal, S.; Easterling, T.R.; Carr, D.; Umans, J.G.; Miodovnik, M.; Hankins, G.D.V.; Clark, S.M.; Risler, L.; Wang, J.; Kelly, E.J.; et al. Pharmacokinetics of Metformin during Pregnancy. Drug Metab. Dispos. 2010, 38, 833–840. [Google Scholar] [CrossRef]
- Gardiner, S.J.; Kirkpatrick, C.M.J.; Begg, E.J.; Zhang, M.; Moore, M.P.; Saville, D.J. Transfer of Metformin into Human Milk. Clin. Pharmacol. Ther. 2003, 73, 71–77. [Google Scholar] [CrossRef]
- Hale, T.W.; Kristensen, J.H.; Hackett, L.P.; Kohan, R.; Ilett, K.F. Transfer of Metformin into Human Milk. Diabetologia 2002, 45, 1509–1514. [Google Scholar] [CrossRef]
- Giuliano, M.; Guidotti, G.; Andreotti, M.; Pirillo, M.F.; Villani, P.; Liotta, G.; Marazzi, M.C.; Mancini, M.G.; Cusato, M.; Germano, P.; et al. Triple Antiretroviral Prophylaxis Administered during Pregnancy and after Delivery Significantly Reduces Breast Milk Viral Load: A Study within the Drug Resource Enhancement against AIDS and Malnutrition Program. J. Acquir. Immune Defic. Syndr. 2007, 44, 286–291. [Google Scholar] [CrossRef]
- Mirochnick, M.; Thomas, T.; Capparelli, E.; Zeh, C.; Holland, D.; Masaba, R.; Odhiambo, P.; Fowler, M.G.; Weidle, P.J.; Thigpen, M.C. Antiretroviral Concentrations in Breast-Feeding Infants of Mothers Receiving Highly Active Antiretroviral Therapy. Antimicrob. Agents Chemother. 2009, 53, 1170–1176. [Google Scholar] [CrossRef]
- Olagunju, A.; Amara, A.; Waitt, C.; Else, L.; Penchala, S.D.; Bolaji, O.; Soyinka, J.; Siccardi, M.; Back, D.; Owen, A.; et al. Validation and Clinical Application of a Method to Quantify Nevirapine in Dried Blood Spots and Dried Breast-Milk Spots. J. Antimicrob. Chemother. 2015, 70, 2816–2822. [Google Scholar] [CrossRef]
- Olagunju, A.; Khoo, S.; Owen, A. Pharmacogenetics of Nevirapine Excretion into Breast Milk and Infants’ Exposure through Breast Milk versus Postexposure Prophylaxis. Pharmacogenomics 2016, 17, 891–906. [Google Scholar] [CrossRef]
- Palombi, L.; Pirillo, M.F.; Marchei, E.; Jere, H.; Sagno, J.-B.; Luhanga, R.; Floridia, M.; Andreotti, M.; Galluzzo, C.M.; Pichini, S.; et al. Concentrations of Tenofovir, Lamivudine and Efavirenz in Mothers and Children Enrolled under the Option B-Plus Approach in Malawi. J. Antimicrob. Chemother. 2016, 71, 1027–1030. [Google Scholar] [CrossRef]
- Shapiro, R.L.; Holland, D.T.; Capparelli, E.; Lockman, S.; Thior, I.; Wester, C.; Stevens, L.; Peter, T.; Essex, M.; Connor, J.D.; et al. Antiretroviral Concentrations in Breast-Feeding Infants of Women in Botswana Receiving Antiretroviral Treatment. J. Infect. Dis. 2005, 192, 720–727. [Google Scholar] [CrossRef]
- Shapiro, R.L.; Rossi, S.; Ogwu, A.; Moss, M.; Leidner, J.; Moffat, C.; Lockman, S.; Moyo, S.; Makhema, J.; Essex, M.; et al. Therapeutic Levels of Lopinavir in Late Pregnancy and Abacavir Passage into Breast Milk in the Mma Bana Study, Botswana. Antivir. Ther. 2013, 18, 585–590. [Google Scholar] [CrossRef]
- Dodd, S.; Stocky, A.; Buist, A.; Burrows, G.D.; Maguire, K.; Norman, T.R. Sertraline in Paired Blood Plasma and Breast-Milk Samples from Nursing Mothers. Hum. Psychopharmacol. 2000, 15, 161–264. [Google Scholar] [CrossRef]
- Kristensen, J.H.; Ilett, K.F.; Dusci, L.J.; Hackett, L.P.; Yapp, P.; Wojnar-Horton, R.E.; Roberts, M.J.; Paech, M. Distribution and Excretion of Sertraline and N-Desmethylsertraline in Human Milk. Br. J. Clin. Pharmacol. 1998, 45, 453–457. [Google Scholar] [CrossRef]
- Oberlander, T.F.; Grunau, R.E.; Fitzgerald, C.; Papsdorf, M.; Rurak, D.; Riggs, W. Pain Reactivity in 2-Month-Old Infants after Prenatal and Postnatal Selective Serotonin Reuptake Inhibitor Medication Exposure. Pediatrics 2005, 115, 411–425. [Google Scholar] [CrossRef] [PubMed]
- Berle, J.Ø.; Steen, V.M.; Aamo, T.O.; Breilid, H.; Zahlsen, K.; Spigset, O. Breastfeeding during Maternal Antidepressant Treatment with Serotonin Reuptake Inhibitors: Infant Exposure, Clinical Symptoms, and Cytochrome P450 Genotypes. J. Clin. Psychiatry 2004, 65, 1228–1234. [Google Scholar] [CrossRef] [PubMed]
- Pogliani, L.; Baldelli, S.; Cattaneo, D.; Pileri, P.; Clementi, E.; Cetin, I.; Zuccotti, G. Selective Serotonin Reuptake Inhibitors’ Passage into Human Milk of Lactating Women. J. Matern. Neonatal Med. 2019, 32, 3020–3025. [Google Scholar] [CrossRef] [PubMed]
- Schoretsanitis, G.; Augustin, M.; Saßmannshausen, H.; Franz, C.; Gründer, G.; Paulzen, M. Antidepressants in Breast Milk; Comparative Analysis of Excretion Ratios. Arch. Womens Ment. Health 2019, 22, 383–390. [Google Scholar] [CrossRef]
- Weisskopf, E.; Panchaud, A.; Nguyen, K.A.; Grosjean, D.; Hascoët, J.-M.; Csajka, C.; Eap, C.B.; Ansermot, N. Simultaneous Determination of Selective Serotonin Reuptake Inhibitors and Their Main Metabolites in Human Breast Milk by Liquid Chromatography-Electrospray Mass Spectrometry. J. Chromatogr. B Anal. Technol. Biomed. Life Sci. 2017, 1057, 101–109. [Google Scholar] [CrossRef]
- Weissman, A.M.; Levy, B.T.; Hartz, A.J.; Bentler, S.; Donohue, M.; Ellingrod, V.L.; Wisner, K.L. Pooled Analysis of Antidepressant Levels in Lactating Mothers, Breast Milk, and Nursing Infants. Am. J. Psychiatry 2004, 161, 1066–1078. [Google Scholar] [CrossRef]
- Stowe, Z.N.; Hostetter, A.L.; Owens, M.J.; Ritchie, J.C.; Sternberg, K.; Cohen, L.S.; Nemeroff, C.B. The Pharmacokinetics of Sertraline Excretion into Human Breast Milk: Determinants of Infant Serum Concentrations. J. Clin. Psychiatry 2003, 64, 73–80. [Google Scholar] [CrossRef]
- Mugwanya, K.K.; Hendrix, C.W.; Mugo, N.R.; Marzinke, M.; Katabira, E.T.; Ngure, K.; Semiyaga, N.B.; John-Stewart, G.; Muwonge, T.R.; Muthuri, G.; et al. Pre-Exposure Prophylaxis Use by Breastfeeding HIV-Uninfected Women: A Prospective Short-Term Study of Antiretroviral Excretion in Breast Milk and Infant Absorption. PLoS Med. 2016, 13, e1002132. [Google Scholar] [CrossRef]
- Waitt, C.; Olagunju, A.; Nakalema, S.; Kyohaire, I.; Owen, A.; Lamorde, M.; Khoo, S. Plasma and Breast Milk Pharmacokinetics of Emtricitabine, Tenofovir and Lamivudine Using Dried Blood and Breast Milk Spots in Nursing African Mother-Infant Pairs. J. Antimicrob. Chemother. 2018, 73, 1013–1019. [Google Scholar] [CrossRef]
- Waitt, C.; Diliiy Penchala, S.; Olagunju, A.; Amara, A.; Else, L.; Lamorde, M.; Khoo, S. Development, Validation and Clinical Application of a Method for the Simultaneous Quantification of Lamivudine, Emtricitabine and Tenofovir in Dried Blood and Dried Breast Milk Spots Using LC-MS/MS. J. Chromatogr. B Anal. Technol. Biomed. Life Sci. 2017, 1060, 300–307. [Google Scholar] [CrossRef]
- Kacirova, I.; Grundmann, M.; Brozmanova, H. Valproic Acid Concentrations in Nursing Mothers, Mature Milk, and Breastfed Infants in Monotherapy and Combination Therapy. Epilepsy Behav. 2019, 95, 112–116. [Google Scholar] [CrossRef]
- Nau, H.; Rating, D.; Koch, S.; Häuser, I.; Helge, H. Valproic Acid and Its Metabolites: Placental Transfer, Neonatal Pharmacokinetics, Transfer via Mother’s Milk and Clinical Status in Neonates of Epileptic Mothers. J. Pharmacol. Exp. Ther. 1981, 219, 768–777. [Google Scholar]
- Tsuru, N.; Maeda, T.; Tsuruoka, M. Three Cases of Delivery under Sodium Valproate—Placental Transfer, Milk Transfer and Probable Teratogenicity of Sodium Valproate—. Psychiatry Clin. Neurosci. 1988, 42, 89–96. [Google Scholar] [CrossRef]
- Von Unruh, G.E.; Froescher, W.; Hoffmann, F.; Niesen, M. Valproic Acid in Breast Milk. Ther. Drug Monit. 1984, 6, 272–276. [Google Scholar] [CrossRef]
- Corbett, A.H.; Kayira, D.; White, N.R.; Davis, N.L.; Kourtis, A.P.; Chasela, C.; Martinson, F.; Phiri, G.; Musisi, B.; Kamwendo, D.; et al. Antiretroviral Pharmacokinetics in Mothers and Breastfeeding Infants from 6 to 24 Weeks Post-Partum: Results of the Ban Study. Antivir. Ther. 2014, 19, 587–595. [Google Scholar] [CrossRef]
- Palombi, L.; Pirillo, M.F.; Andreotti, M.; Liotta, G.; Erba, F.; Sagno, J.B.; Maulidi, M.; Ceffa, S.; Jere, H.; Marchei, E.; et al. Antiretroviral Prophylaxis for Breastfeeding Transmission in Malawi: Drug Concentrations, Virological Efficacy and Safety. Antivir. Ther. 2012, 17, 1511–1519. [Google Scholar] [CrossRef]
- Calvaresi, V.; Escuder, D.; Minutillo, A.; Bastons-Compta, A.; García-Algar, O.; Alonso, C.R.P.; Pacifici, R.; Pichini, S. Transfer of Nicotine, Cotinine and Caffeine into Breast Milk in a Smoker Mother Consuming Caffeinated Drinks. J. Anal. Toxicol. 2016, 40, 473–477. [Google Scholar] [CrossRef]
- Ryu, J.E. Effect of Maternal Caffeine Consumption on Heart Rate and Sleep Time of Breast-Fed Infants. Dev. Pharmacol. Ther. 1985, 8, 355–363. [Google Scholar] [CrossRef]
- Ylikotila, P.; Ketola, R.A.; Timonen, S.; Malm, H.; Ruuskanen, J.O. Early Pregnancy Cerebral Venous Thrombosis and Status Epilepticus Treated with Levetiracetam and Lacosamide throughout Pregnancy. Reprod. Toxicol. 2015, 57, 204–206. [Google Scholar] [CrossRef]
- Zhang, M.; Moore, G.A.; Lever, M.; Gardiner, S.J.; Kirkpatrick, C.M.J.; Begg, E.J. Rapid and Simple High-Performance Liquid Chromatographic Assay for the Determination of Metformin in Human Plasma and Breast Milk. J. Chromatogr. B Anal. Technol. Biomed. Life Sci. 2002, 766, 175–179. [Google Scholar] [CrossRef] [PubMed]
- Bennetto-Hood, C.; Aldrovandi, G.M.; King, J.R.; Woodman, K.; Ashouri, N.; Acosta, E.P. Persistence of Nevirapine in Breast Milk after Discontinuation of Treatment. Clin. Infect. Dis. Off. Publ. Infect. Dis. Soc. Am. 2007, 45, 391–394. [Google Scholar] [CrossRef] [PubMed]
- Salazar, F.R.; D’Avila, F.B.; de Oliveira, M.H.; Ferreira, P.L.; Bergold, A.M. Development and Validation of a Bioanalytical Method for Five Antidepressants in Human Milk by LC–MS. J. Pharm. Biomed. Anal. 2016, 129, 502–508. [Google Scholar] [CrossRef] [PubMed]
- Wisner, K.L.; Perel, J.M.; Blumer, J. Serum sertraline and N-desmethylsertraline levels in breast-feeding mother-infant pairs. Am. J. Psychiatry. 1998, 155, 690–692. [Google Scholar] [CrossRef]
- Erturk, U.S.; Mete, B.; Ozaras, R.; Saltoglu, N.; Balkan, I.I.; Mert, A.; Kacmaz, B.; Saglam, O.; Guney, B.; Sayman, O.A.; et al. Plasma and Breast Milk Pharmacokinetics of Tenofovir Disoproxil Fumarate in Nursing Mother with Chronic Hepatitis B-Infant Pairs. Antimicrob. Agents Chemother. 2021, 65, e0111021. [Google Scholar] [CrossRef]
- Yeung, C.H.T.; Fong, S.; Malik, P.R.V.; Edginton, A.N. Quantifying Breast Milk Intake by Term and Preterm Infants for Input into Paediatric Physiologically Based Pharmacokinetic Models. Matern. Child Nutr. 2020, 16, e12938. [Google Scholar] [CrossRef]
- Smits, A.; Annaert, P.; Allegaert, K. Drug Disposition and Clinical Practice in Neonates: Cross Talk between Developmental Physiology and Pharmacology. Int. J. Pharm. 2013, 452, 8–13. [Google Scholar] [CrossRef]


| Medicine | MW | BCS Class | pKa | LogP | HBD | HBA | PSA | fu | Main Elimination Route |
|---|---|---|---|---|---|---|---|---|---|
| Amoxicillin | 365.40 | I | 3.23 (acid) 7.43 (base) | 0.87 | 4 | 7 | 158 | 0.85 | Renal |
| Caffeine | 194.20 | I | 0.80 (base) | −0.07 | 0 | 3 | 58.44 | 0.70 | Hepatic (CYP1A2) |
| Cetirizine | 388.90 | III | 2.9 (acid) 8.0 (base) 2.2 (base) | 1.50 | 1 | 5 | 53.00 | 0.07 | Renal |
| Levetiracetam | 170.21 | I | - (neutral) | −0.60 | 1 | 2 | 63.40 | 0.90 | Esterases |
| Metformin | 129.16 | III | 2.80 (base) 11.50 (acid) | −1.43 | 3 | 1 | 91.50 | 1.00 | Renal |
| Nevirapine | 266.30 | II | 2.8 (base) | 1.93 | 1 | 4 | 58.10 | 0.40 | Hepatic (CYP3A4) |
| Sertraline | 306.00 | II | 9.43 (base) | 5.5 | 1 | 1 | 12.03 | 0.023 | Hepatic (CYPs) |
| Tenofovir | 287.21 | III | 1.35 (acid) 6.70 (acid) 3.80 (base) | 1.87 | 3 | 8 | 136.38 | 0.993 | Renal |
| Valproic acid | 144.21 | I | 4.80 (acid) | 2.75 | 1 | 2 | 37.30 | 0.14 | Hepatic (UGTs) |
| Zidovudine | 267.24 | I | 9.7 (acid) | 0.05 | 2 | 6 | 108.30 | 0.80 | Hepatic (UGT2B7) |
| Medicine | Secretion Clearance (mL/h) | Reuptake Clearance (mL/h) |
|---|---|---|
| Amoxicillin | 46.90 | 263.47 |
| Caffeine | 824.02 | 603.21 |
| Cetirizine | 3031.27 | 1922.74 |
| Levetiracetam | 445.38 | 357.77 |
| Metformin | 21.73 | 138.37 |
| Nevirapine | 2413.86 | 1015.01 |
| Sertraline | 8925.70 | 3597.49 |
| Tenofovir | 51.96 | 129.00 |
| Valproic acid | 248.39 | 1423.15 |
| Zidovudine | 431.04 | 345.10 |
| Medicine | Predicted M/P Ratio 1 | Observed M/P Ratio | Reference |
|---|---|---|---|
| Amoxicillin | 0.15 | 0.04–0.06 2 | [21] |
| Caffeine | 0.95 | 0.52–1.16 | [22,23,24] |
| Cetirizine | 0.12 | 0.2 3 | [25,26] |
| Levetiracetam | 1.11 | 0.46–1.79 | [27,28,29,30] |
| Metformin | 0.16 | 0.13–1.00 | [31,32,33,34] |
| Nevirapine | 2.68 | 0.2–1.5 | [35,36,37,38,39,40,41] |
| Sertraline | 1.62 | 0.12 4–5.2 | [42,43,44,45,46,47,48,49,50] |
| Tenofovir | 0.40 | 0.025 4–0.11 | [39,51,52,53] |
| Valproic acid | 0.03 | 0.013 4–0.25 | [54,55,56,57] |
| Zidovudine | 1.10 | 0.3–3.21 | [35,36,40,58,59] |
| Medicine | Daily Infant Dosage Based on Average Concentration (mg/kg/day) (Relative Infant Dose) (%) | Daily Infant Dosage Based on Maximal Concentration (mg/kg/day) (Relative Infant Dose) (%) |
|---|---|---|
| Amoxicillin | 0.12 (0.24%) | 0.19 (0.39%) |
| Caffeine | 0.30 (5.98%) | 0.41 (8.17%) |
| Cetirizine | 0.002 (1.24%) | 0.01 (3.62%) |
| Levetiracetam | 6.16 (12%) | 7.92 (16%) |
| Metformin | 0.02 (0.10%) | 0.02 (0.14%) |
| Nevirapine * | 2.43 (37%) | 2.78 (42%) |
| Sertraline | 0.005 (0.63%) | 0.01 (0.72%) |
| Tenofovir * | 0.01 (0.15%) | 0.01 (0.21%) |
| Valproic acid | 0.52 (1.50%) | 0.85 (2.44%) |
| Zidovudine | 0.04 (0.40%) | 0.12 (1.16%) |
| Medicine | Therapeutic Dosage Used as Reference (mg/kg/day) | Daily Infant Dosage Based on Average Concentration as Percentage of Therapeutic Dosage (%) | Daily Infant Dosage Based on Maximal Concentration as Percentage of Therapeutic Dosage (%) |
|---|---|---|---|
| Amoxicillin | 50 | 0.24 | 0.39 |
| Caffeine 1 | 5 | 5.96 | 8.13 |
| Cetirizine | 0.5 | 0.41 | 1.20 |
| Levetiracetam | 40 | 15.40 | 19.79 |
| Metformin | - | - | - |
| Nevirapine 2 | 12 | 20.23 | 23.16 |
| Sertraline | - | - | - |
| Tenofovir 2 | 6.5 | 0.12 | 0.16 |
| Valproic acid | 40 | 1.31 | 2.12 |
| Zidovudine | 24 | 0.17 | 0.48 |
Disclaimer/Publisher’s Note: The statements, opinions and data contained in all publications are solely those of the individual author(s) and contributor(s) and not of MDPI and/or the editor(s). MDPI and/or the editor(s) disclaim responsibility for any injury to people or property resulting from any ideas, methods, instructions or products referred to in the content. |
© 2023 by the authors. Licensee MDPI, Basel, Switzerland. This article is an open access article distributed under the terms and conditions of the Creative Commons Attribution (CC BY) license (https://creativecommons.org/licenses/by/4.0/).
Share and Cite
Nauwelaerts, N.; Macente, J.; Deferm, N.; Bonan, R.H.; Huang, M.-C.; Van Neste, M.; Bibi, D.; Badee, J.; Martins, F.S.; Smits, A.; et al. Generic Workflow to Predict Medicine Concentrations in Human Milk Using Physiologically-Based Pharmacokinetic (PBPK) Modelling—A Contribution from the ConcePTION Project. Pharmaceutics 2023, 15, 1469. https://doi.org/10.3390/pharmaceutics15051469
Nauwelaerts N, Macente J, Deferm N, Bonan RH, Huang M-C, Van Neste M, Bibi D, Badee J, Martins FS, Smits A, et al. Generic Workflow to Predict Medicine Concentrations in Human Milk Using Physiologically-Based Pharmacokinetic (PBPK) Modelling—A Contribution from the ConcePTION Project. Pharmaceutics. 2023; 15(5):1469. https://doi.org/10.3390/pharmaceutics15051469
Chicago/Turabian StyleNauwelaerts, Nina, Julia Macente, Neel Deferm, Rodolfo Hernandes Bonan, Miao-Chan Huang, Martje Van Neste, David Bibi, Justine Badee, Frederico S. Martins, Anne Smits, and et al. 2023. "Generic Workflow to Predict Medicine Concentrations in Human Milk Using Physiologically-Based Pharmacokinetic (PBPK) Modelling—A Contribution from the ConcePTION Project" Pharmaceutics 15, no. 5: 1469. https://doi.org/10.3390/pharmaceutics15051469