
Intraperitoneally Administered Vancomycin in Patients with Peritoneal Dialysis-Associated Peritonitis: Population Pharmacokinetics and Dosing Implications
 , , , and
Abstract
:1. Introduction
2. Materials and Methods
2.1. Patients and Dosing
2.2. Vancomycin Analysis
2.3. Population PK Analysis
- Development of structural and statistical model.
- 2.
- Covariate analysis.
- Body weight (BW), lean body mass (LBM), serum level of urea, creatinine, albumin, potassium, C-reactive protein at the beginning of the peritonitis treatment (CRP), estimated glomerular filtration rate (eGFR, calculated by the CKD-EPI 2009 formula), age, and volume of residual diuresis were tested as continuous covariates.
- Preserved diuresis (yes = over 500 mL urine daily or no = less than 500 mL urine daily), type of peritoneal solution (low, medium, or high glucose content, or icodextrin based), and sex were tested as categorical covariates.
- 3.
- Validation of the final model.
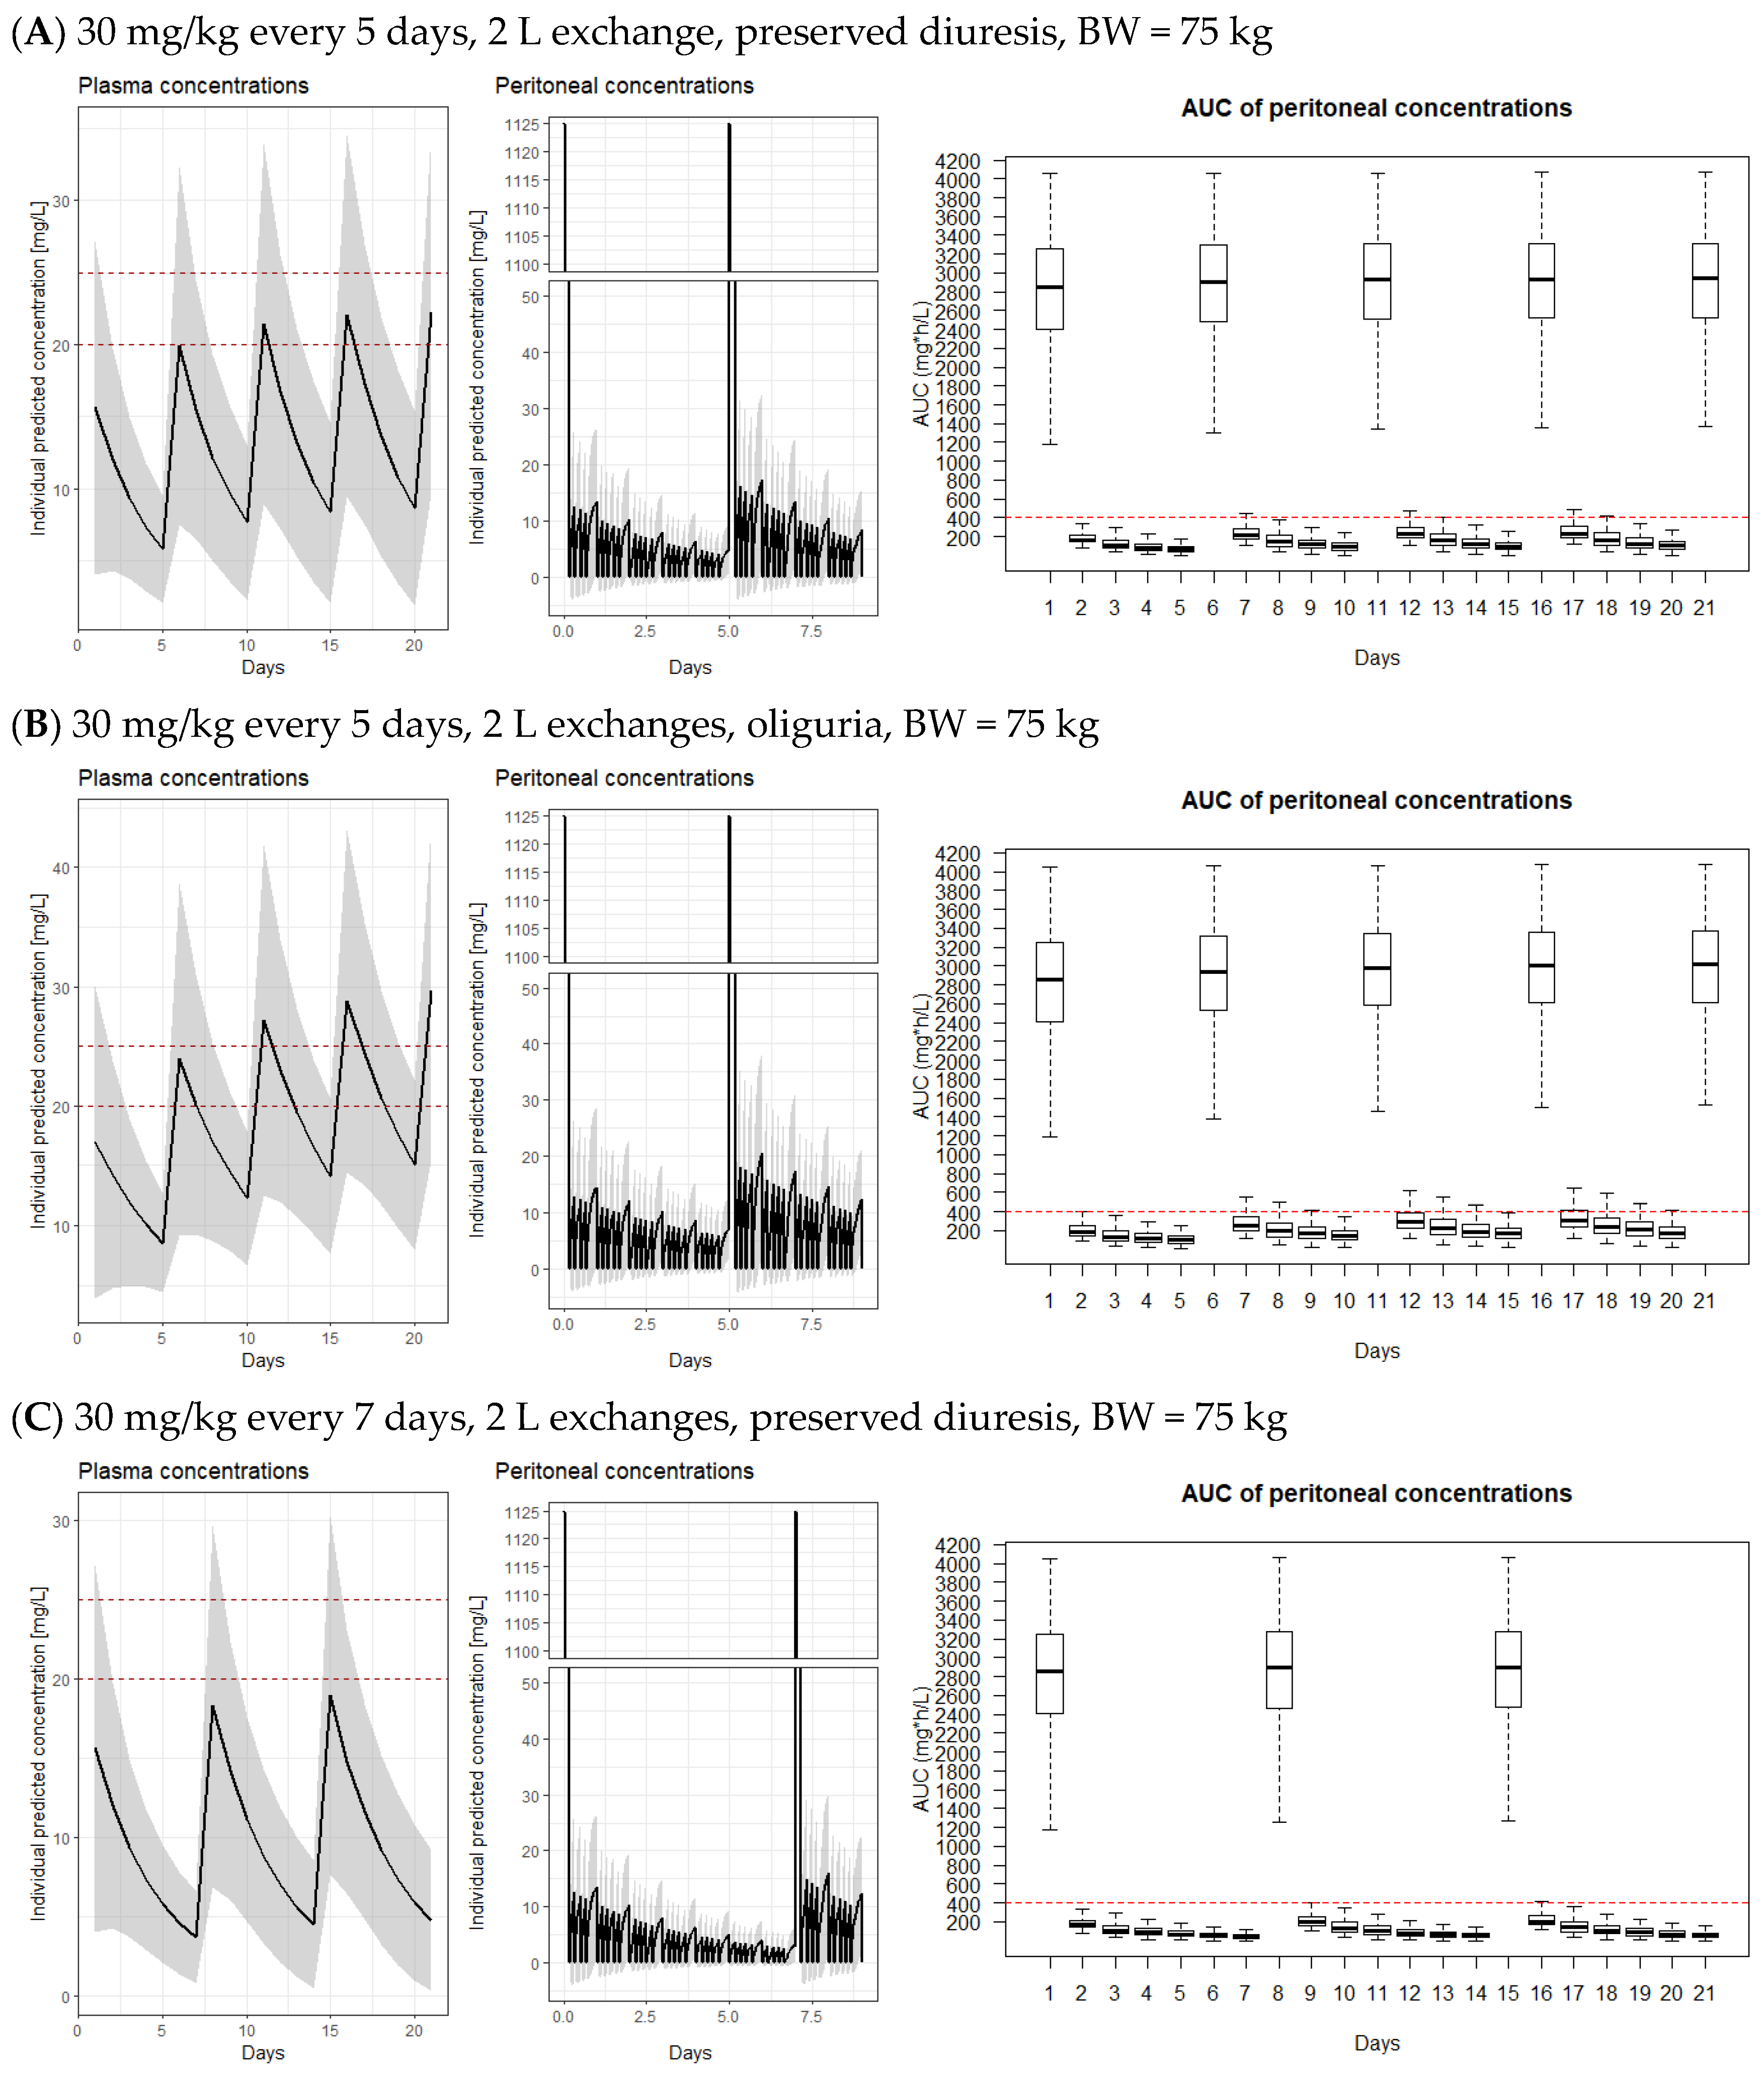
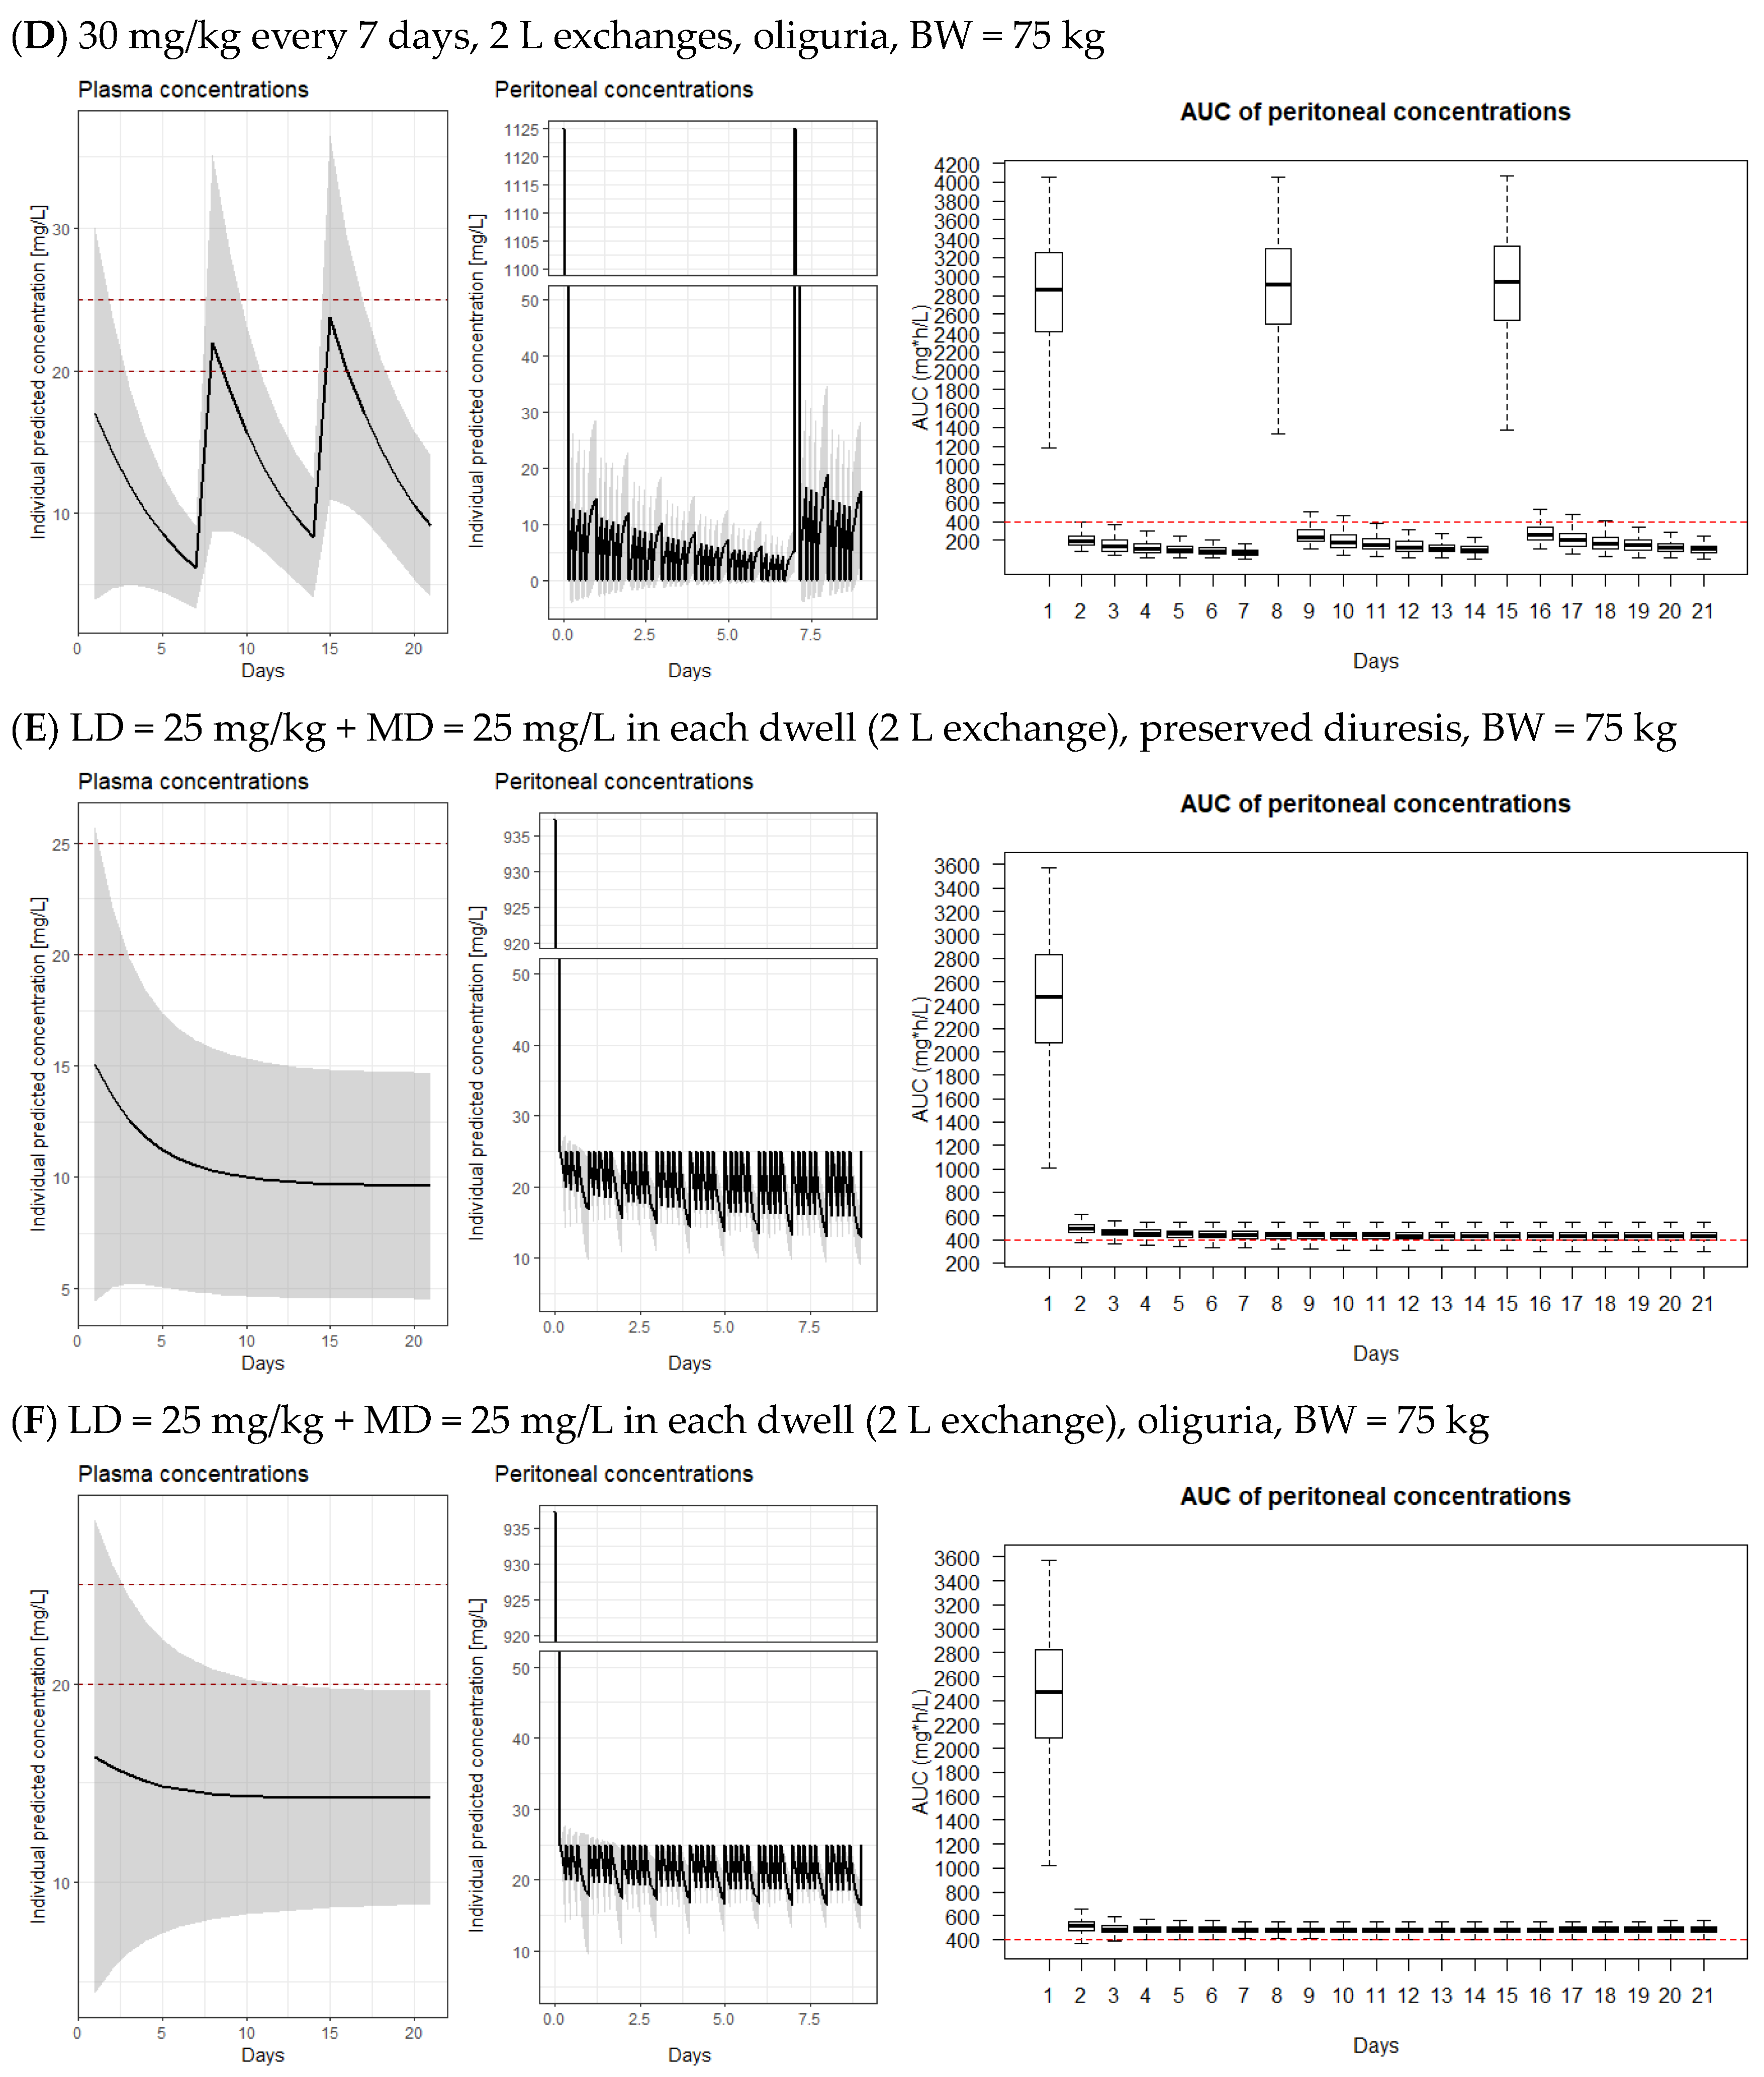
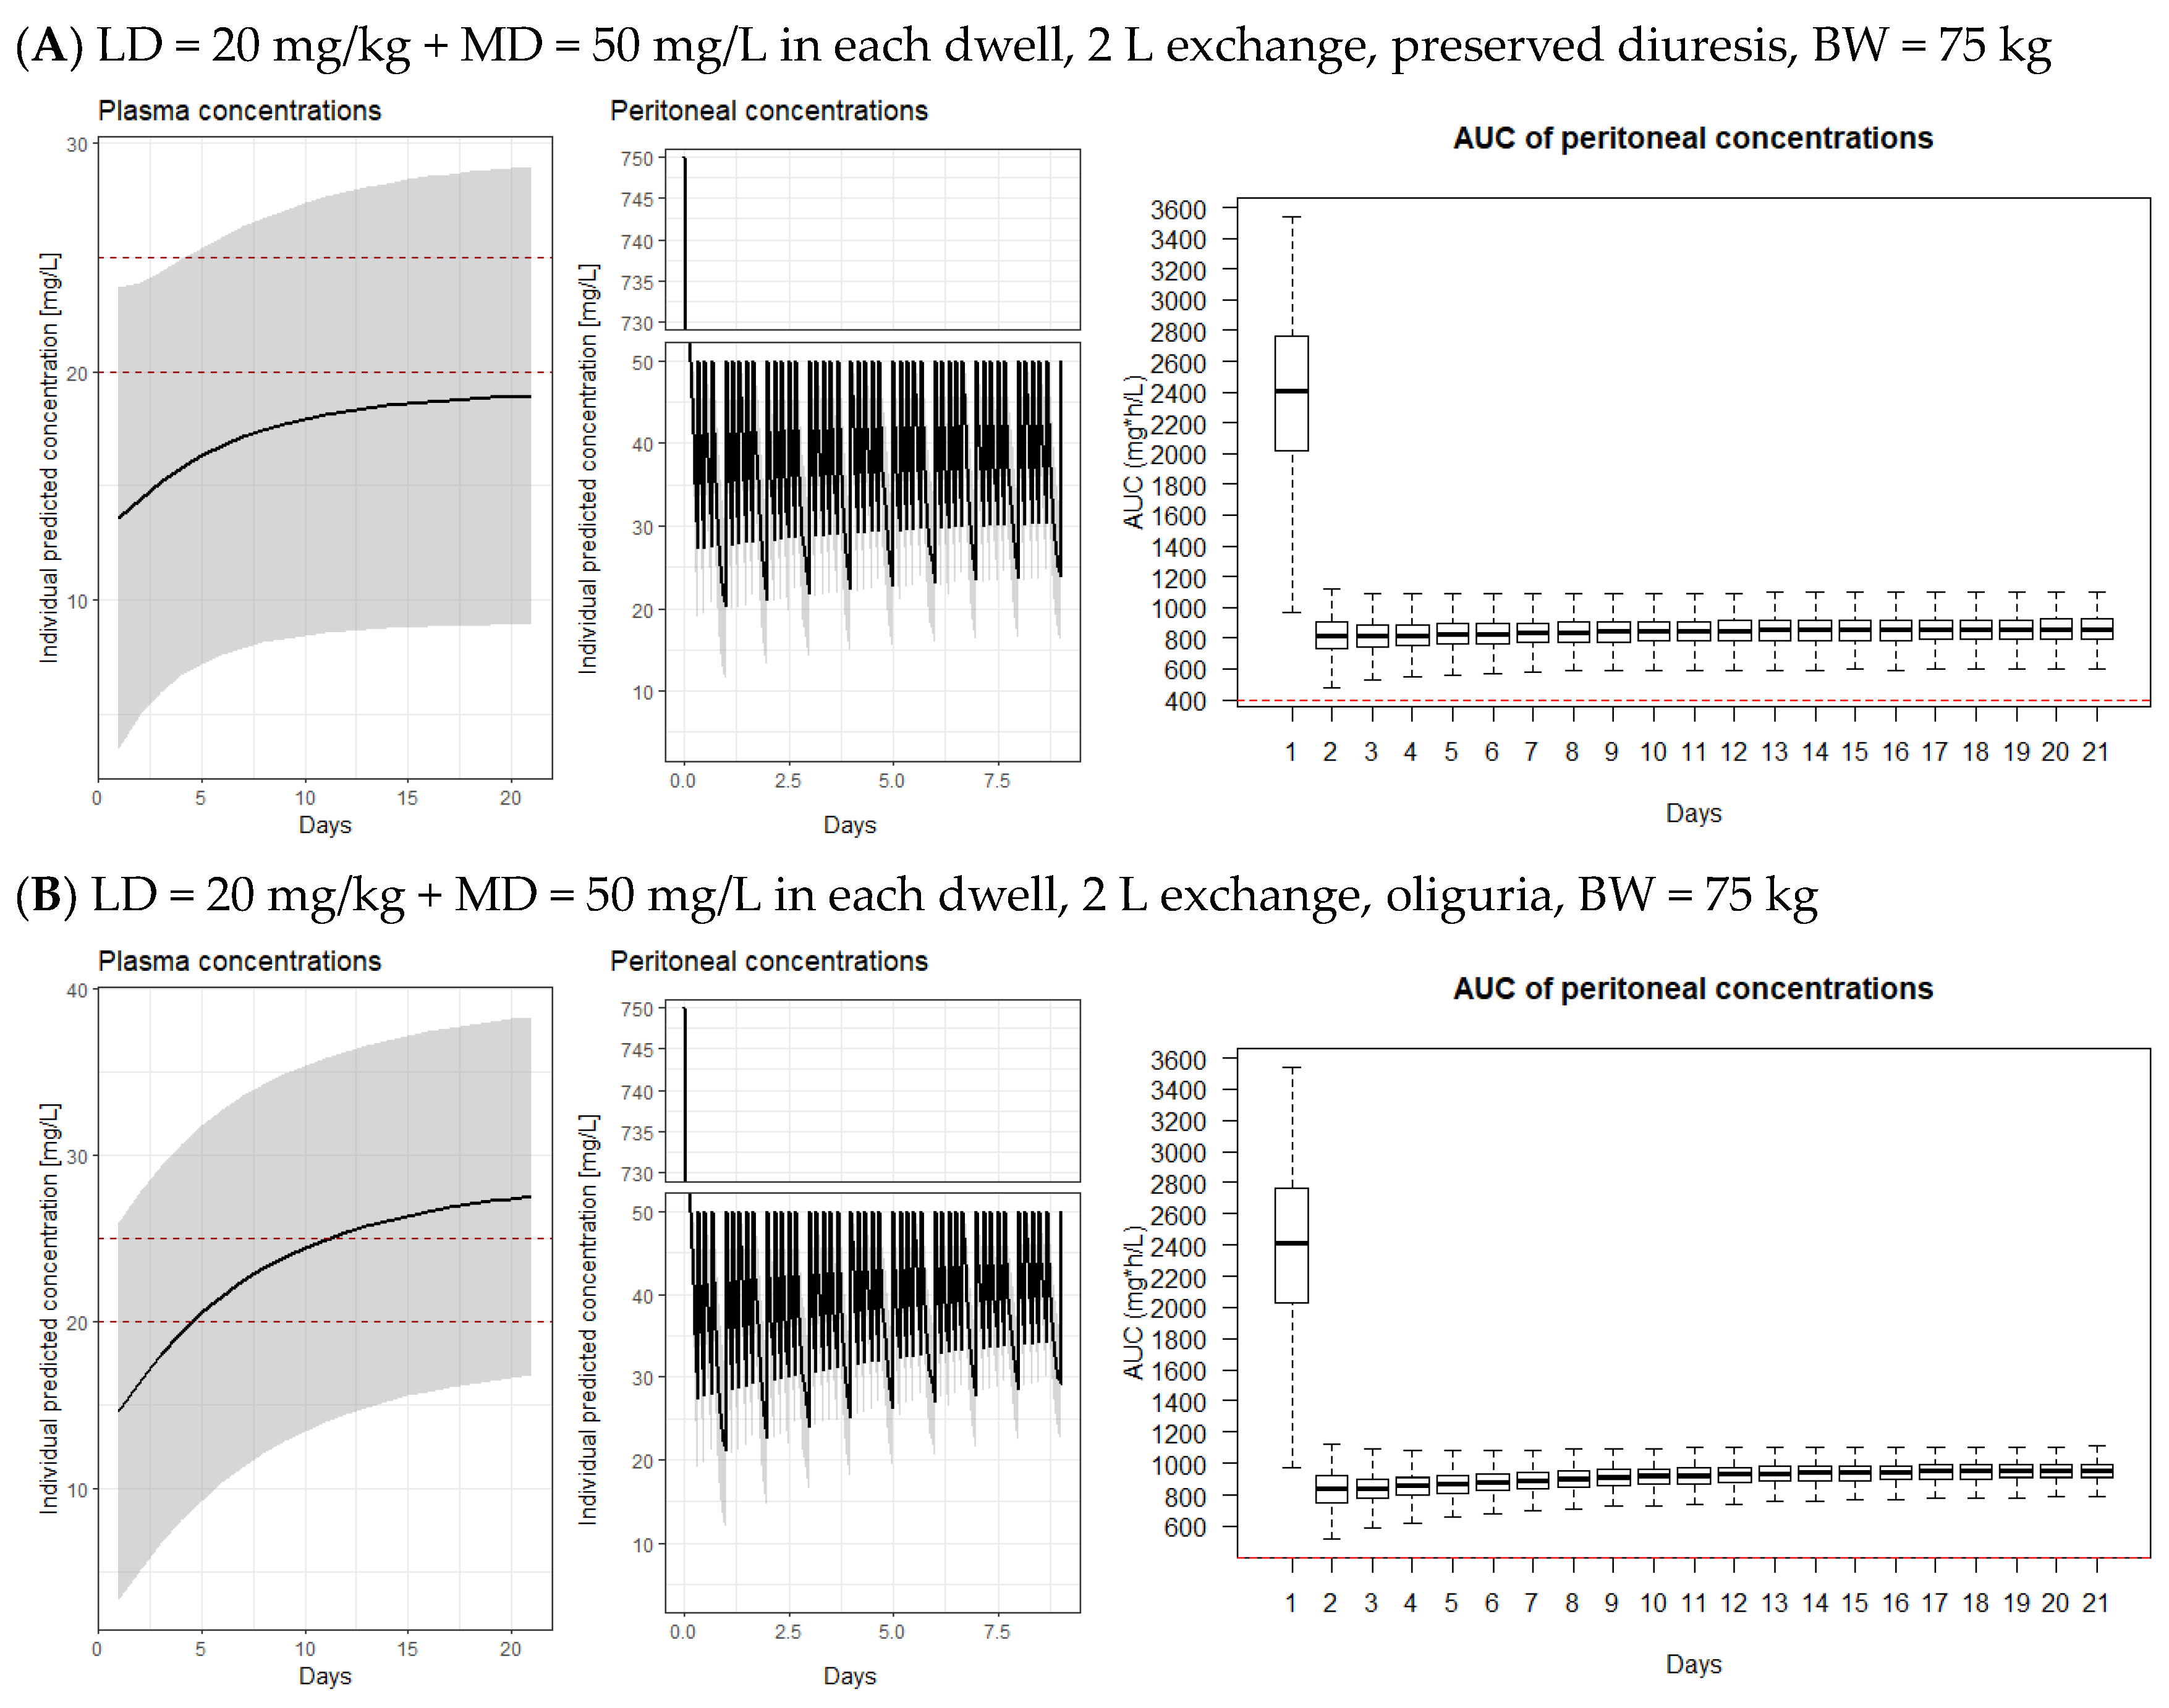
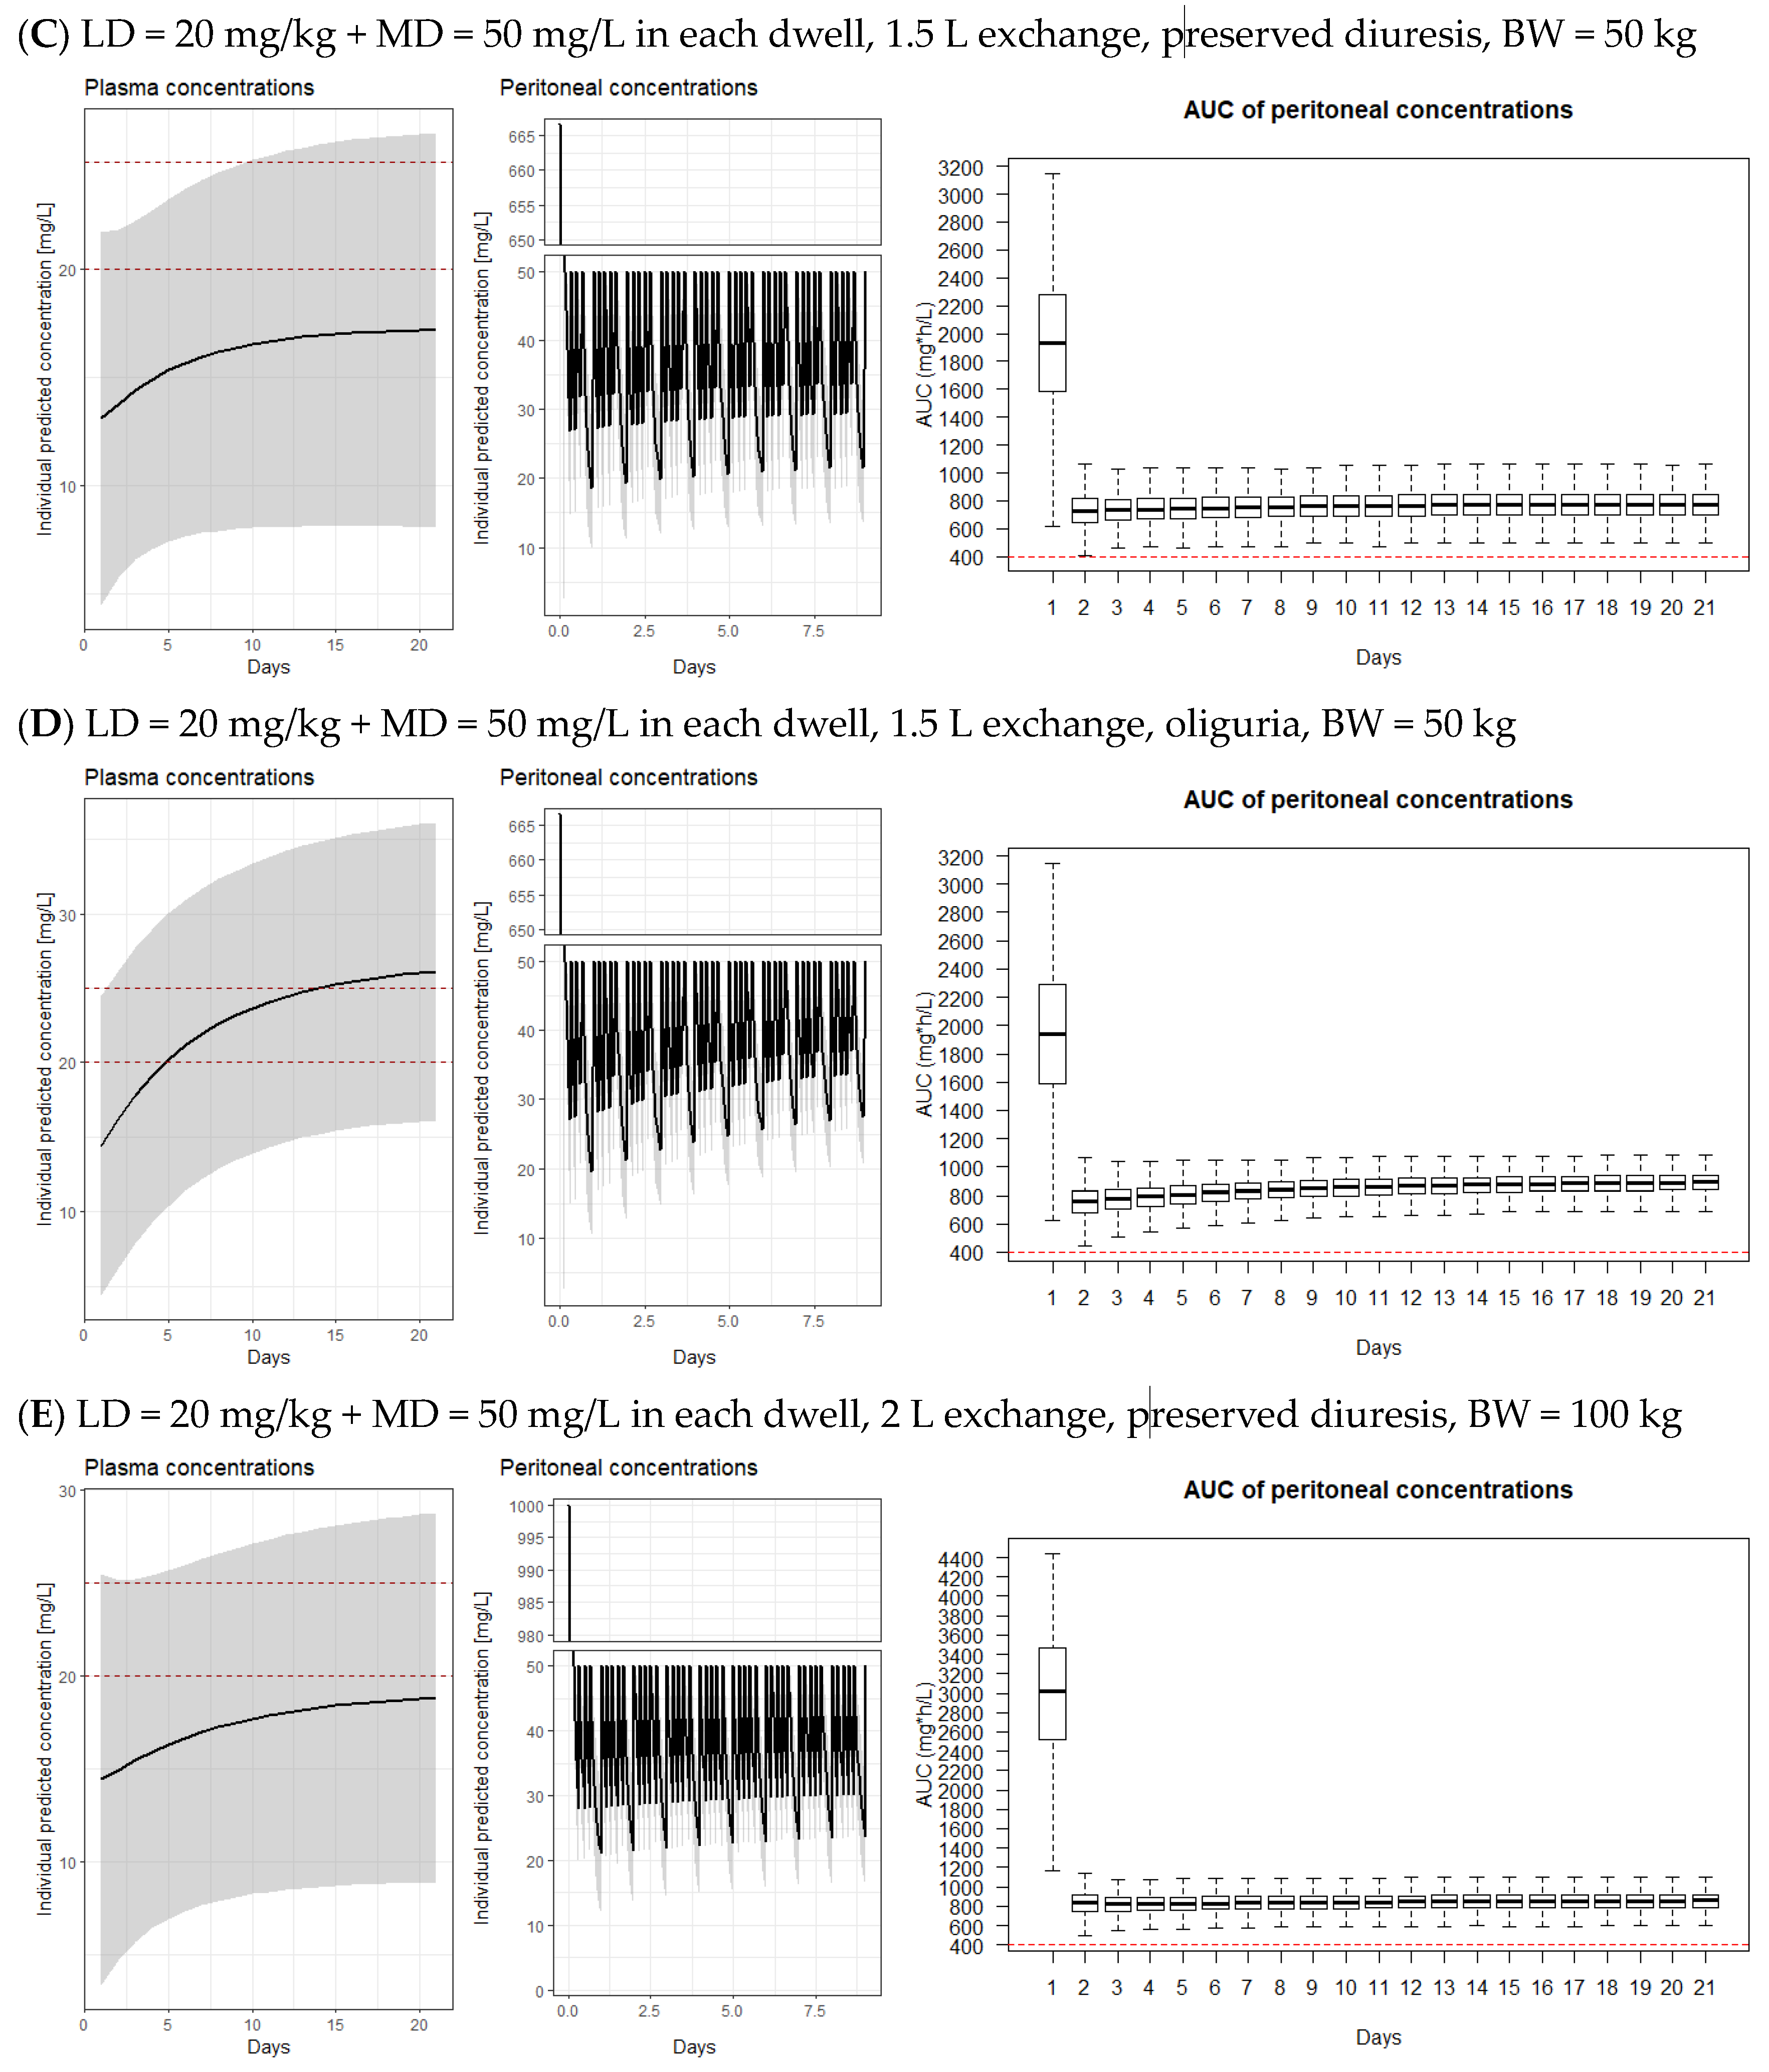
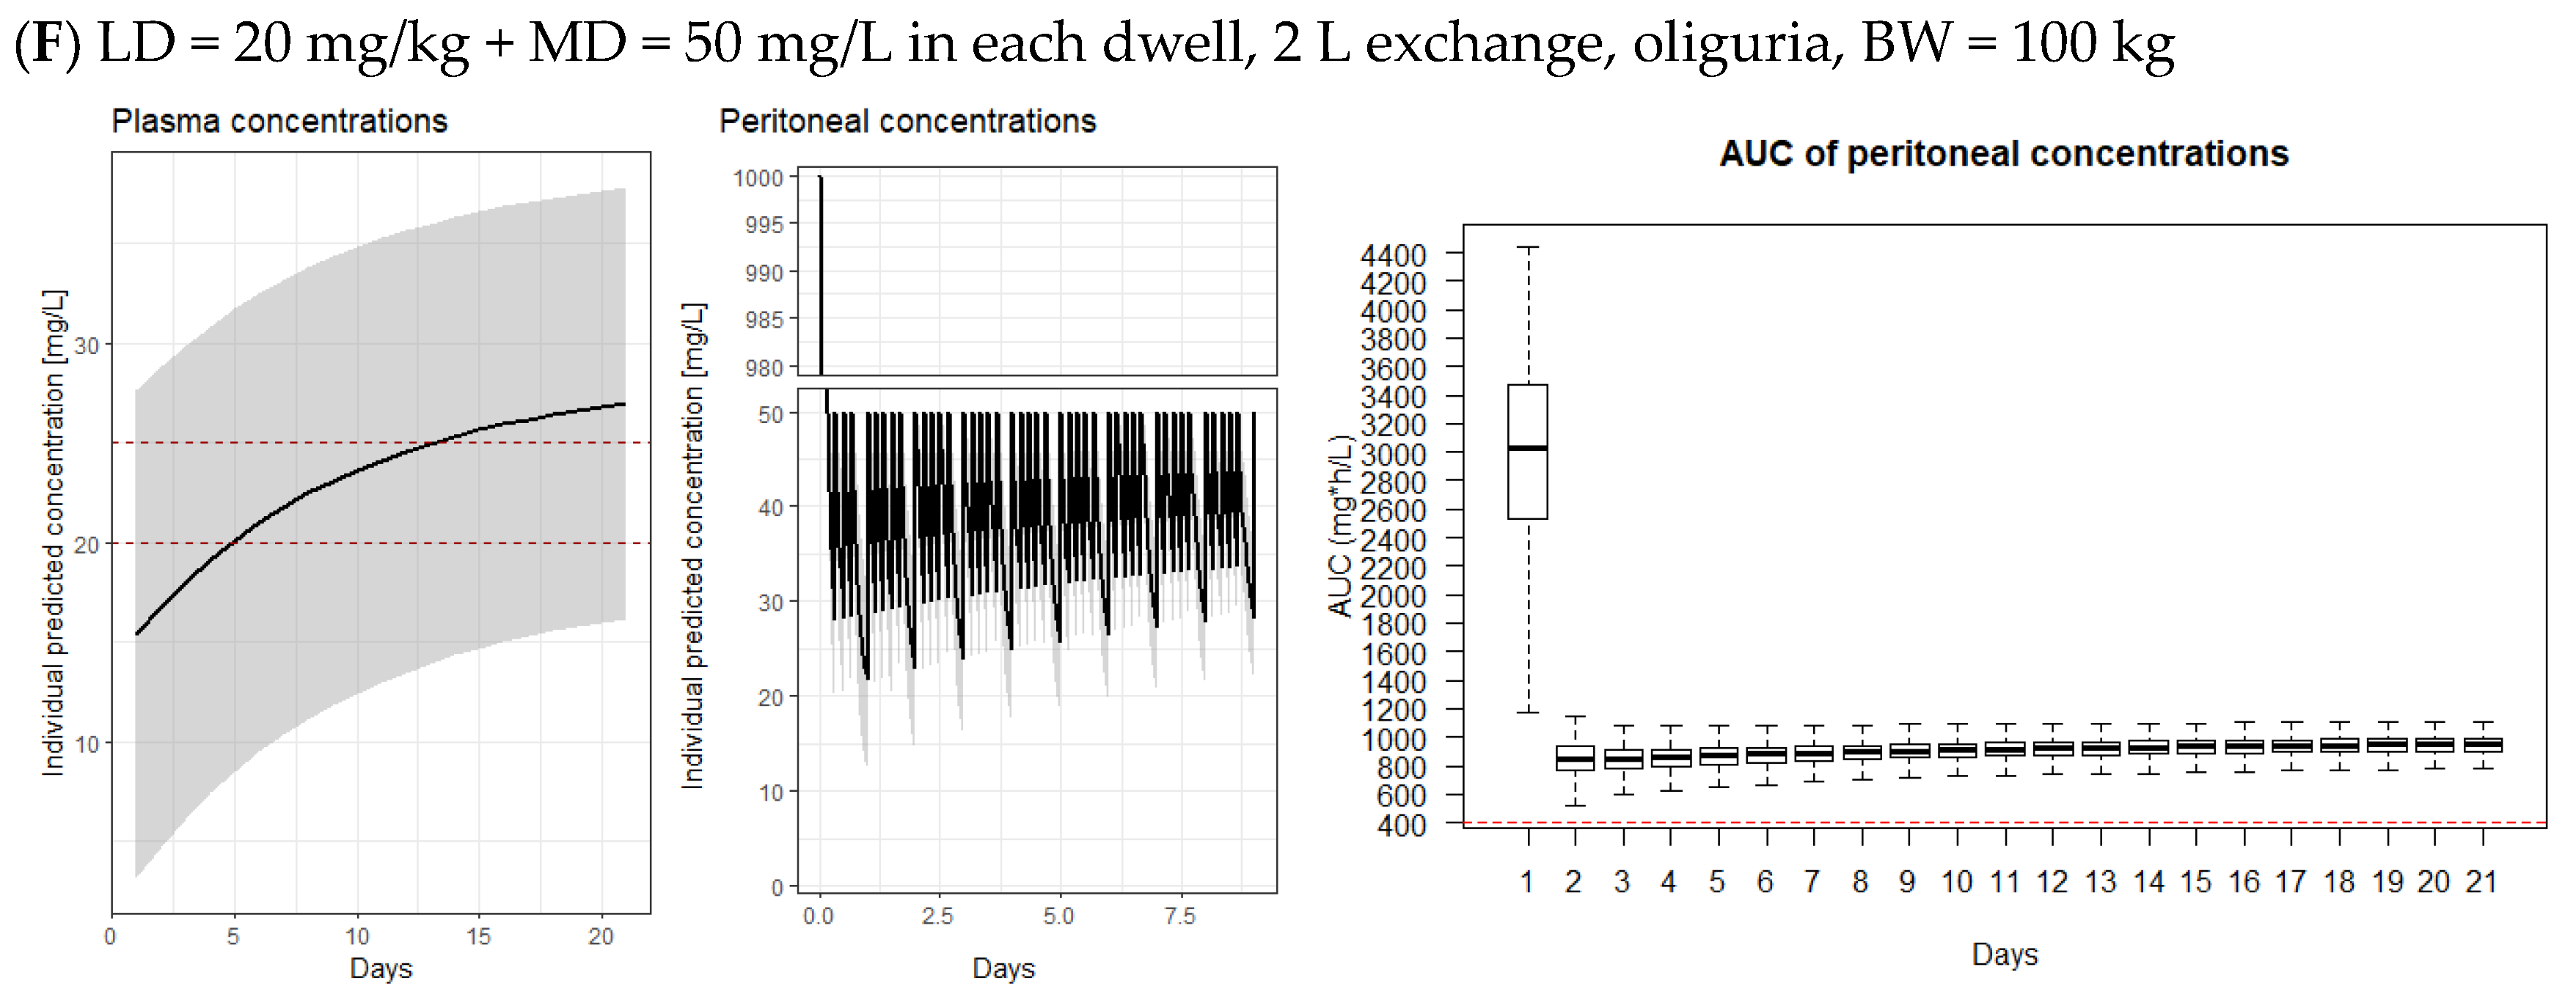
2.4. Model-Derived Dosing Implications
2.5. Microbiological Testing
3. Results
3.1. Final Population PK Model
3.2. Model-Derived Dosing Implications
3.3. Bactericidal Efficacy of Vancomycin Diluted in the Peritoneal Dialysate
4. Discussion
5. Conclusions
Supplementary Materials
Author Contributions
Funding
Institutional Review Board Statement
Informed Consent Statement
Data Availability Statement
Conflicts of Interest
References
- Teitelbaum, I. Peritoneal Dialysis. N. Engl. J. Med. 2021, 385, 1786–1795. [Google Scholar] [CrossRef]
- Salzer, W. Antimicrobial-resistant gram-positive bacteria in PD peritonitis and the newer antibiotics used to treat them. Perit. Dial. Int. 2005, 25, 313–319. [Google Scholar] [CrossRef]
- Li, P.K.-T.; Chow, K.M.; Cho, Y.; Fan, S.; E Figueiredo, A.; Harris, T.; Kanjanabuch, T.; Kim, Y.-L.; Madero, M.; Malyszko, J.; et al. ISPD peritonitis guideline recommendations: 2022 update on prevention and treatment. Perit. Dial. Int. 2022, 42, 110–153. [Google Scholar] [CrossRef] [PubMed]
- Rubin, J. Vancomycin absorption from the peritoneal cavity during dialysis-related peritonitis. Perit. Dial. Int. 1990, 10, 283–285. [Google Scholar] [CrossRef] [PubMed]
- Morse, G.D.; Apicella, M.A.; Walshe, J.J. Absorption of intraperitoneal antibiotics. Drug Intell. Clin. Pharm. 1988, 22, 58–61. [Google Scholar]
- Morse, G.D.; Farolino, D.F.; Apicella, M.A.; Walshe, J.J. Comparative study of intraperitoneal and intravenous vancomycin pharmacokinetics during continuous ambulatory peritoneal dialysis. Antimicrob. Agents Chemother. 1987, 31, 173–177. [Google Scholar] [CrossRef] [PubMed]
- Blowey, D.L.; Warady, B.A.; Abdel-Rahman, S.; Frye, R.F.; Manley, H.J. Vancomycin disposition following intraperitoneal administration in children receiving peritoneal dialysis. Perit. Dial. Int. 2007, 27, 79–85. [Google Scholar] [CrossRef]
- Hartinger, J.M.; Šíma, M.; Hronová, K.; Halouzková, B.A.; Szonowská, B.; Polakovič, V.; Bednářová, V.; Hladinová, Z.; Tesař, V.; Slanař, O. Vancomycin pharmacokinetics in patients treated with intermittent haemodialysis based on therapeutic drug monitoring. J. Chemother. 2021, 34, 149–156. [Google Scholar] [CrossRef]
- Šíma, M.; Hartinger, J.; Grus, T.; Slanař, O. Initial dosing of intermittent vancomycin in adults: Estimation of dosing interval in relation to dose and renal function. Eur. J. Hosp. Pharm. 2019, 28, 276–279. [Google Scholar] [CrossRef]
- Schaefer, F.; Klaus, G.; Muller-Wiefel, D.E.; Mehls, O. Intermittent versus continuous intraperitoneal glycopeptide/ceftazidime treatment in children with peritoneal dialysis-associated peritonitis. The Mid-European Pediatric Peritoneal Dialysis Study Group (MEPPS). J. Am. Soc. Nephrol. 1999, 10, 136–145. [Google Scholar] [CrossRef]
- Whitty, R.; Bargman, J.M.; Kiss, A.; Dresser, L.; Lui, P. Residual Kidney Function and Peritoneal Dialysis-Associated Peritonitis Treatment Outcomes. Clin. J. Am. Soc. Nephrol. 2017, 12, 2016–2022. [Google Scholar] [CrossRef] [PubMed]
- Rybak, M.J.; Le, J.; Lodise, T.P.; Levine, D.P.; Bradley, J.S.; Liu, C.; Mueller, B.A.; Pai, M.P.; Wong-Beringer, A.; Rotschafer, J.C.; et al. Therapeutic monitoring of vancomycin for serious methicillin-resistant Staphylococcus aureus infections: A revised consensus guideline and review by the American Society of Health-System Pharmacists, the Infectious Diseases Society of America, the Pediatric Infectious Diseases Society, and the Society of Infectious Diseases Pharmacists. Am. J. Health Syst. Pharm. 2020, 77, 835–864. [Google Scholar] [CrossRef]
- Tobudic, S.; Poeppl, W.; Kratzer, C.; Vychytil, A.; Burgmann, H. Comparative in vitro antimicrobial activity of vancomycin, teicoplanin, daptomycin and ceftobiprole in four different peritoneal dialysis fluids. Eur. J. Clin. Microbiol. Infect. Dis. 2012, 31, 1327–1334. [Google Scholar] [CrossRef] [PubMed]
- Sima, M.; Hartinger, J.; Netikova, I.S.; Slanar, O. Creatinine Clearance Estimations for Vancomycin Maintenance Dose Adjustments. Am. J. Ther. 2017, 25, e602–e604. [Google Scholar] [CrossRef]
- Lindbom, L.; Pihlgren, P.; Jonsson, N. PsN-Toolkit—A collection of computer intensive statistical methods for non-linear mixed effect modeling using NONMEM. Comput. Methods Programs Biomed. 2005, 79, 241–257. [Google Scholar] [CrossRef] [PubMed]
- Lindbom, L.; Ribbing, J.; Jonsson, E.N. Perl-speaks-NONMEM (PsN)--a Perl module for NONMEM related programming. Comput. Methods Programs Biomed. 2004, 75, 85–94. [Google Scholar] [CrossRef]
- Keizer, R.J.; van Benten, M.; Beijnen, J.H.; Schellens, J.H.; Huitema, A.D. Piraña and PCluster: A modeling environment and cluster infrastructure for NONMEM. Comput. Methods Programs Biomed. 2011, 101, 72–79. [Google Scholar] [CrossRef]
- Comets, E.; Brendel, K.; Mentré, F. Computing normalised prediction distribution errors to evaluate nonlinear mixed-effect models: The npde add-on package for R. Comput. Methods Programs Biomed. 2008, 90, 154–166. [Google Scholar] [CrossRef] [PubMed]
- Wise, R.; Andrews, J.M. The bactericidal activity of gatifloxacin in plasma and urine. Clin. Microbiol. Infect. 1998, 4, 392–396. [Google Scholar] [CrossRef]
- Stevenson, S.; Tang, W.; Cho, Y.; Mudge, D.; Hawley, C.; Badve, S.; Johnson, D.W. The role of monitoring vancomycin levels in patients with peritoneal dialysis-associated peritonitis. Perit. Dial. Int. 2015, 35, 222–228. [Google Scholar] [CrossRef] [PubMed]
- Blunden, M.; Zeitlin, D.; Ashman, N.; Fan, S.L. Single UK centre experience on the treatment of PD peritonitis--antibiotic levels and outcomes. In Nephrology Dialysis Transplantation; Oxford University Press: Oxford, UK, 2007; Volume 22, pp. 1714–1719. [Google Scholar]
- Aljutayli, A.; Marsot, A.; Nekka, F. An Update on Population Pharmacokinetic Analyses of Vancomycin, Part I: In Adults. Clin. Pharmacokinet. 2020, 59, 671–698. [Google Scholar] [CrossRef] [PubMed]
- Zaric, R.Z.; Milovanovic, J.; Rosic, N.; Milovanovic, D.; Zecevic, D.R.; Folic, M.; Jankovic, S. Pharmacokinetics of vancomycin in patients with different renal function levels. Open Med. 2018, 13, 512–519. [Google Scholar] [CrossRef] [PubMed]
- Zhou, Y.; Gao, F.; Chen, C.; Ma, L.; Yang, T.; Liu, X.; Liu, Y.; Wang, X.; Zhao, X.; Que, C.; et al. Development of a Population Pharmacokinetic Model of Vancomycin and its Application in Chinese Geriatric Patients with Pulmonary Infections. Eur. J. Drug Metab. Pharmacokinet. 2019, 44, 361–370. [Google Scholar] [CrossRef] [PubMed]
- Hui, K.; Patel, K.; Nalder, M.; Nelson, C.; Buising, K.; Pedagogos, E.; Kong, D.C.M.; Kirkpatrick, C.M.J. Optimizing vancomycin dosage regimens in relation to high-flux haemodialysis. J. Antimicrob. Chemother. 2019, 74, 130–134. [Google Scholar] [CrossRef]


| Parameter (Unit) | Value * |
|---|---|
| Age (years) | 68 (53–74) |
| Gender (F/M) | 17/24 |
| Body weight (kg) | 75 (70–84) |
| Body mass index (BMI, kg/m2) | 26.67 (21.6–28.34) |
| Lean body weight (LBW, kg) | 54.31 (46.18–59.89) |
| Ideal Body Weight (IBW according to Devine equation, kg) | 63.28 (59.28–72.18) |
| Fat Free Mass (FFM, kg) | 54.3 (46.2–59.9) |
| Preserved diuresis (mL/day) | 1000 (350–1450) |
| Oliguria (<500 mL/day), N (%) | 10 (24.4%) |
| Preserved diuresis (>500 mL/day), N (%) | 31 (75.6%) |
| Creatinine (µmol/L) ** | 694 (564–849) |
| Estimated glomerular filtration rate (mL/min/1.73 m2) *** | 6.76 (5.07–7.92) |
| Urea (mmol/L) ** | 18 (14.9–22.3) |
| Uric acid (µmol/L) ** | 313 (269–349) |
| C-reactive protein (mg/L) ** | 31.7 (10.9–96.5) |
| Serum potassium (mmol/L) ** | 4.1 (3.8–4.6) |
| Serum albumin (g/L) ** | 28 (26–31) |
| Patients with 1500 mL exchanges, N (%) | 16 (39%) |
| Patients with 2000 mL exchanges, N (%) | 23 (56%) |
| Patients with 1000 mL exchanges, N (%) | 1 (2%) |
| Patients with 1200 mL exchanges, N (%) | 1 (2%) |
| Cultivations in peritoneal dialysate | |
| culture negative | 13 (23%) |
| G+ | 36 (63%) |
| G− | 4 (7%) |
| mixed | 3 (5%) |
| G+, candida | 1 (2%) |
| Concomitant exit-site infections | 27 (47%) |
| Months on PD | 22.5 (9–46.75) |
| Parameter [Units] | Final Model (RSE %) | Bootstrap Median (Range) |
|---|---|---|
| Fixed effects | ||
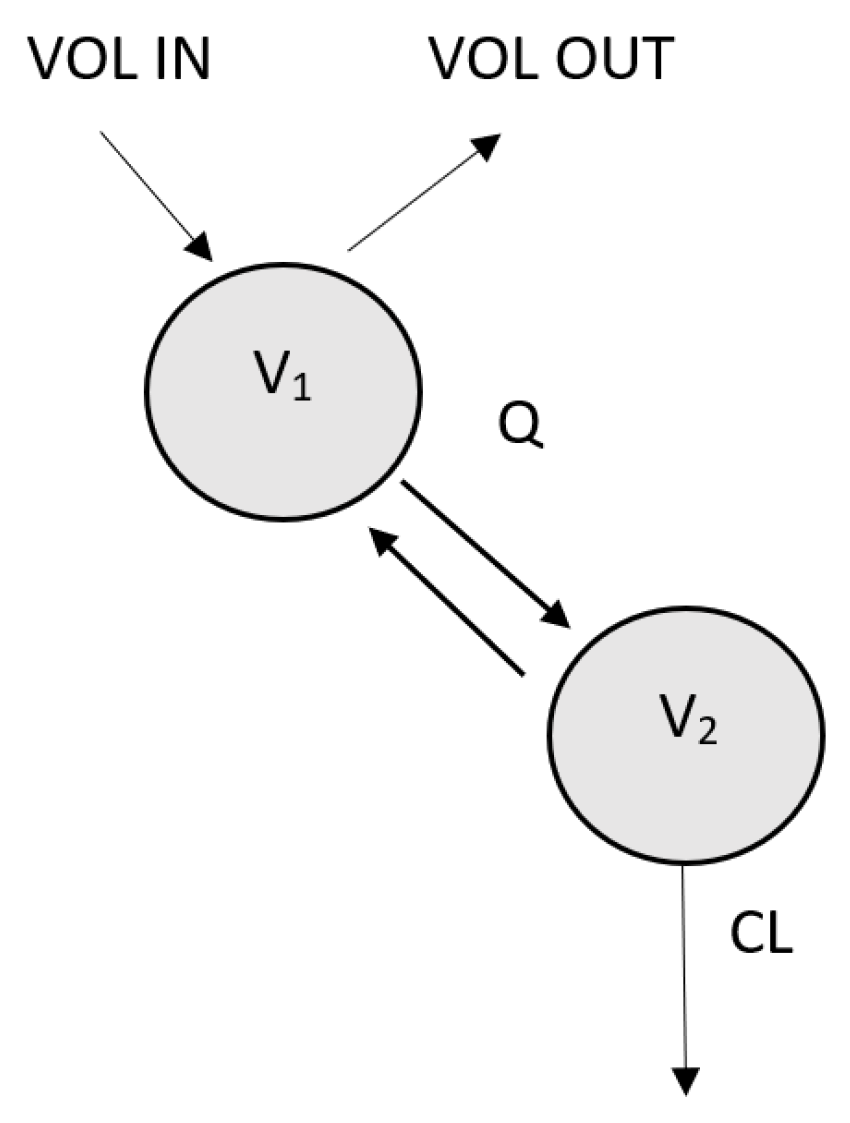
| V1 [L] | FIXED * | |
| CLi [L/h] = CLp × ((1 + θRESDIU) × (CRCL/6.76))RESDIU>500 | ||
| CLp [L/h] | 0.192 (17%) | 0.186 (0.144–0.267) |
| θRESDIU | 1.26 (31%) | 1.36 (0.50–2.25) |
| V2i [L] = V2p + θBWV × (BW/75) | ||
| V2p [L] | 23.6 (78%) | 27.2 (1.68–65.3) |
| θBWV | 50.9 (38%) | 45.9 (9.6–76.0) |
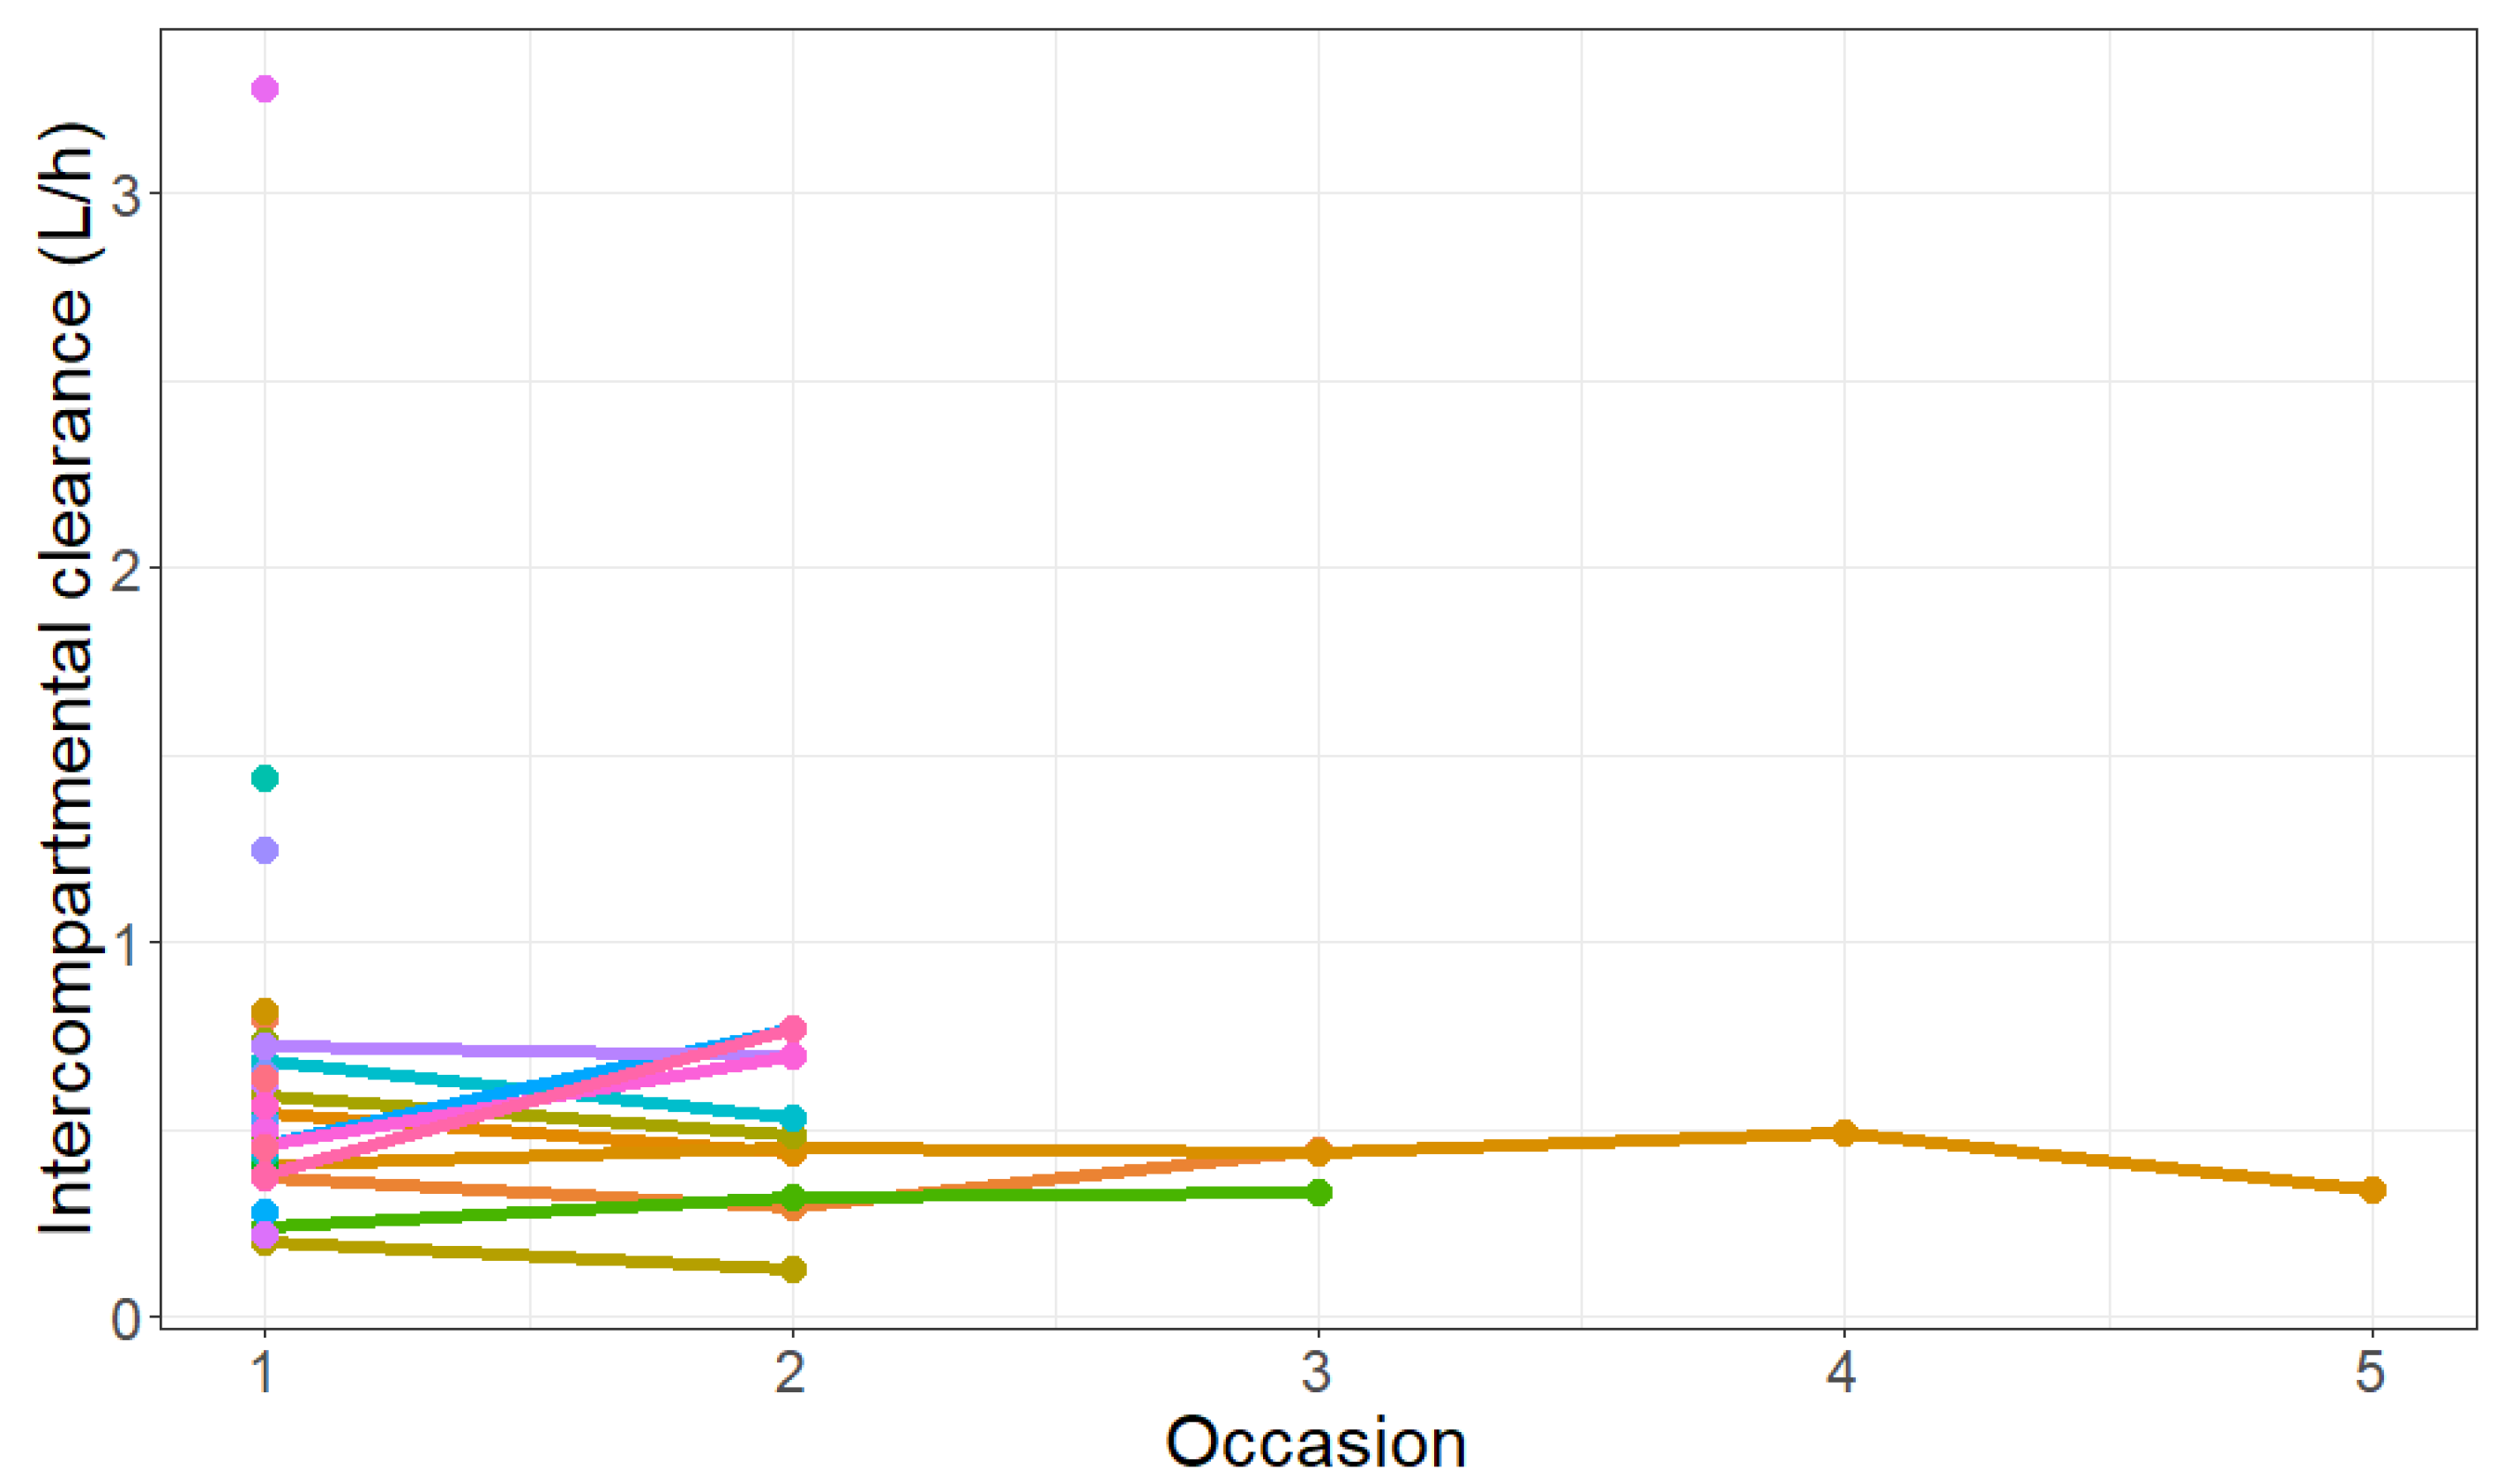
| Q [L/h] | 0.544 (16%) | 0.53 (0.40–0.76) |
| Inter-individual variability | ||
| CL (%) | 34.2% (22%) | 32.2% (16.0–45.8%) |
| V2 (%) | 30.3% (21%) | 29.2% (13.8–40.4%) |
| Q (%) | 50.7 (23%) | 45.3% (20.1–79.6%) |
| IOC on Q (%) | 31% (37%) | 30.1% (17.3–51.7%) |
| Residual variability | ||
| Proportional error, peritoneal concentration | 0.091 (15%) | 0.089 (0.064–0.146) |
| Additive error, plasma concentration | 4.72 (31%) | 4.74 (1.38–7.11) |
| Proportional error, plasma concentration | 0.00604 (54%) | 0.00649 (0.000450–0.01489) |
| Patient 1—Intravenous Vancomycin, Infection of Unknown Origin, Staphylococcus lugdunensis in Exit-Site of PD Catheter; Plasma Level = 25.19 mg/L | ||||||
| Vancomycin concentration at the end of the dwell (mg/L) | 6.67 | 8.14 | 11.78 | 7.78 | 8.03 | 12.19 |
| Dialysis solution | glucose (1.36%) | glucose (2.27%) | glucose (2.27%) | glucose (2.27%) | glucose (1.36%) | glucose (1.36%) |
| Staphylococcus epidermidis | unmeasurable (<1:2) | 1:2 | 1:2 | 1:2 | 1:2 | unmeasurable (<1:2) |
| Staphylococcus aureus | unmeasurable (<1:2) | unmeasurable (<1:2) | 1:2 | 1:2 | 1:2 | 1:2 |
| Enterococcus faecalis | unmeasurable (<1:2) | unmeasurable (<1:2) | unmeasurable (<1:2) | unmeasurable (<1:2) | unmeasurable (<1:2) | unmeasurable (<1:2) |
| Patient 2—intraperitoneal vancomycin and gentamicin; peritonitis caused by Enterobacter cloacae complex + Acinetobacter dijkshoorniae; PD exit-site positive for Staphylococcus aureus | ||||||
| Administered amount of vancomycin | 50 mg/2 L (=25 mg/L) | 1000 mg/2 L (=500 mg/L) | 50 mg/2 L (=25 mg/L) | 50 mg/2 L (=25 mg/L) | 50 mg/2 L (=25 mg/L) | |
| Vancomycin concentration at the end of the dwell (mg/L) | 7.1 | 117.94 | 10.61 | 12.36 | 12.24 | |
| Dialysis solution | icodextrin | glucose (3.86%) | icodextrin | glucose (2.27%) | icodextrin | |
| Staphylococcus epidermidis | 1:16 | 1:16 | 1:16 | 1:8 | 1:8 | |
| Staphylococcus aureus | 1:8 | 1:16 | 1:8 | 1:8 | 1:4 | |
| Enterococcus faecalis | 1:2 | 1:2 | 1:2 | 1:2 | 1:2 | |
Disclaimer/Publisher’s Note: The statements, opinions and data contained in all publications are solely those of the individual author(s) and contributor(s) and not of MDPI and/or the editor(s). MDPI and/or the editor(s) disclaim responsibility for any injury to people or property resulting from any ideas, methods, instructions or products referred to in the content. |
© 2023 by the authors. Licensee MDPI, Basel, Switzerland. This article is an open access article distributed under the terms and conditions of the Creative Commons Attribution (CC BY) license (https://creativecommons.org/licenses/by/4.0/).
Share and Cite
Hartinger, J.M.; Michaličková, D.; Dvořáčková, E.; Hronová, K.; Krekels, E.H.J.; Szonowská, B.; Bednářová, V.; Benáková, H.; Kroneislová, G.; Závora, J.; et al. Intraperitoneally Administered Vancomycin in Patients with Peritoneal Dialysis-Associated Peritonitis: Population Pharmacokinetics and Dosing Implications. Pharmaceutics 2023, 15, 1394. https://doi.org/10.3390/pharmaceutics15051394
Hartinger JM, Michaličková D, Dvořáčková E, Hronová K, Krekels EHJ, Szonowská B, Bednářová V, Benáková H, Kroneislová G, Závora J, et al. Intraperitoneally Administered Vancomycin in Patients with Peritoneal Dialysis-Associated Peritonitis: Population Pharmacokinetics and Dosing Implications. Pharmaceutics. 2023; 15(5):1394. https://doi.org/10.3390/pharmaceutics15051394
Chicago/Turabian StyleHartinger, Jan Miroslav, Danica Michaličková, Eliška Dvořáčková, Karolína Hronová, Elke H. J. Krekels, Barbora Szonowská, Vladimíra Bednářová, Hana Benáková, Gabriela Kroneislová, Jan Závora, and et al. 2023. "Intraperitoneally Administered Vancomycin in Patients with Peritoneal Dialysis-Associated Peritonitis: Population Pharmacokinetics and Dosing Implications" Pharmaceutics 15, no. 5: 1394. https://doi.org/10.3390/pharmaceutics15051394