
Evidence of Strong Guest–Host Interactions in Simvastatin Loaded in Mesoporous Silica MCM-41
 , , ,
, , ,
Abstract
:
1. Introduction
2. Materials and Methods
2.1. Materials
2.2. Methods
2.2.1. Matrix Textural Analysis
2.2.2. Drug Loading
2.2.3. Thermogravimetric Analysis (TGA)
2.2.4. Attenuated Total Reflectance-Fourier Transform Infrared (ATR-FTIR) Spectroscopy
2.2.5. Powder X-ray Diffraction (PXRD)
2.2.6. Solid-State Nuclear Magnetic Resonance (ssNMR)
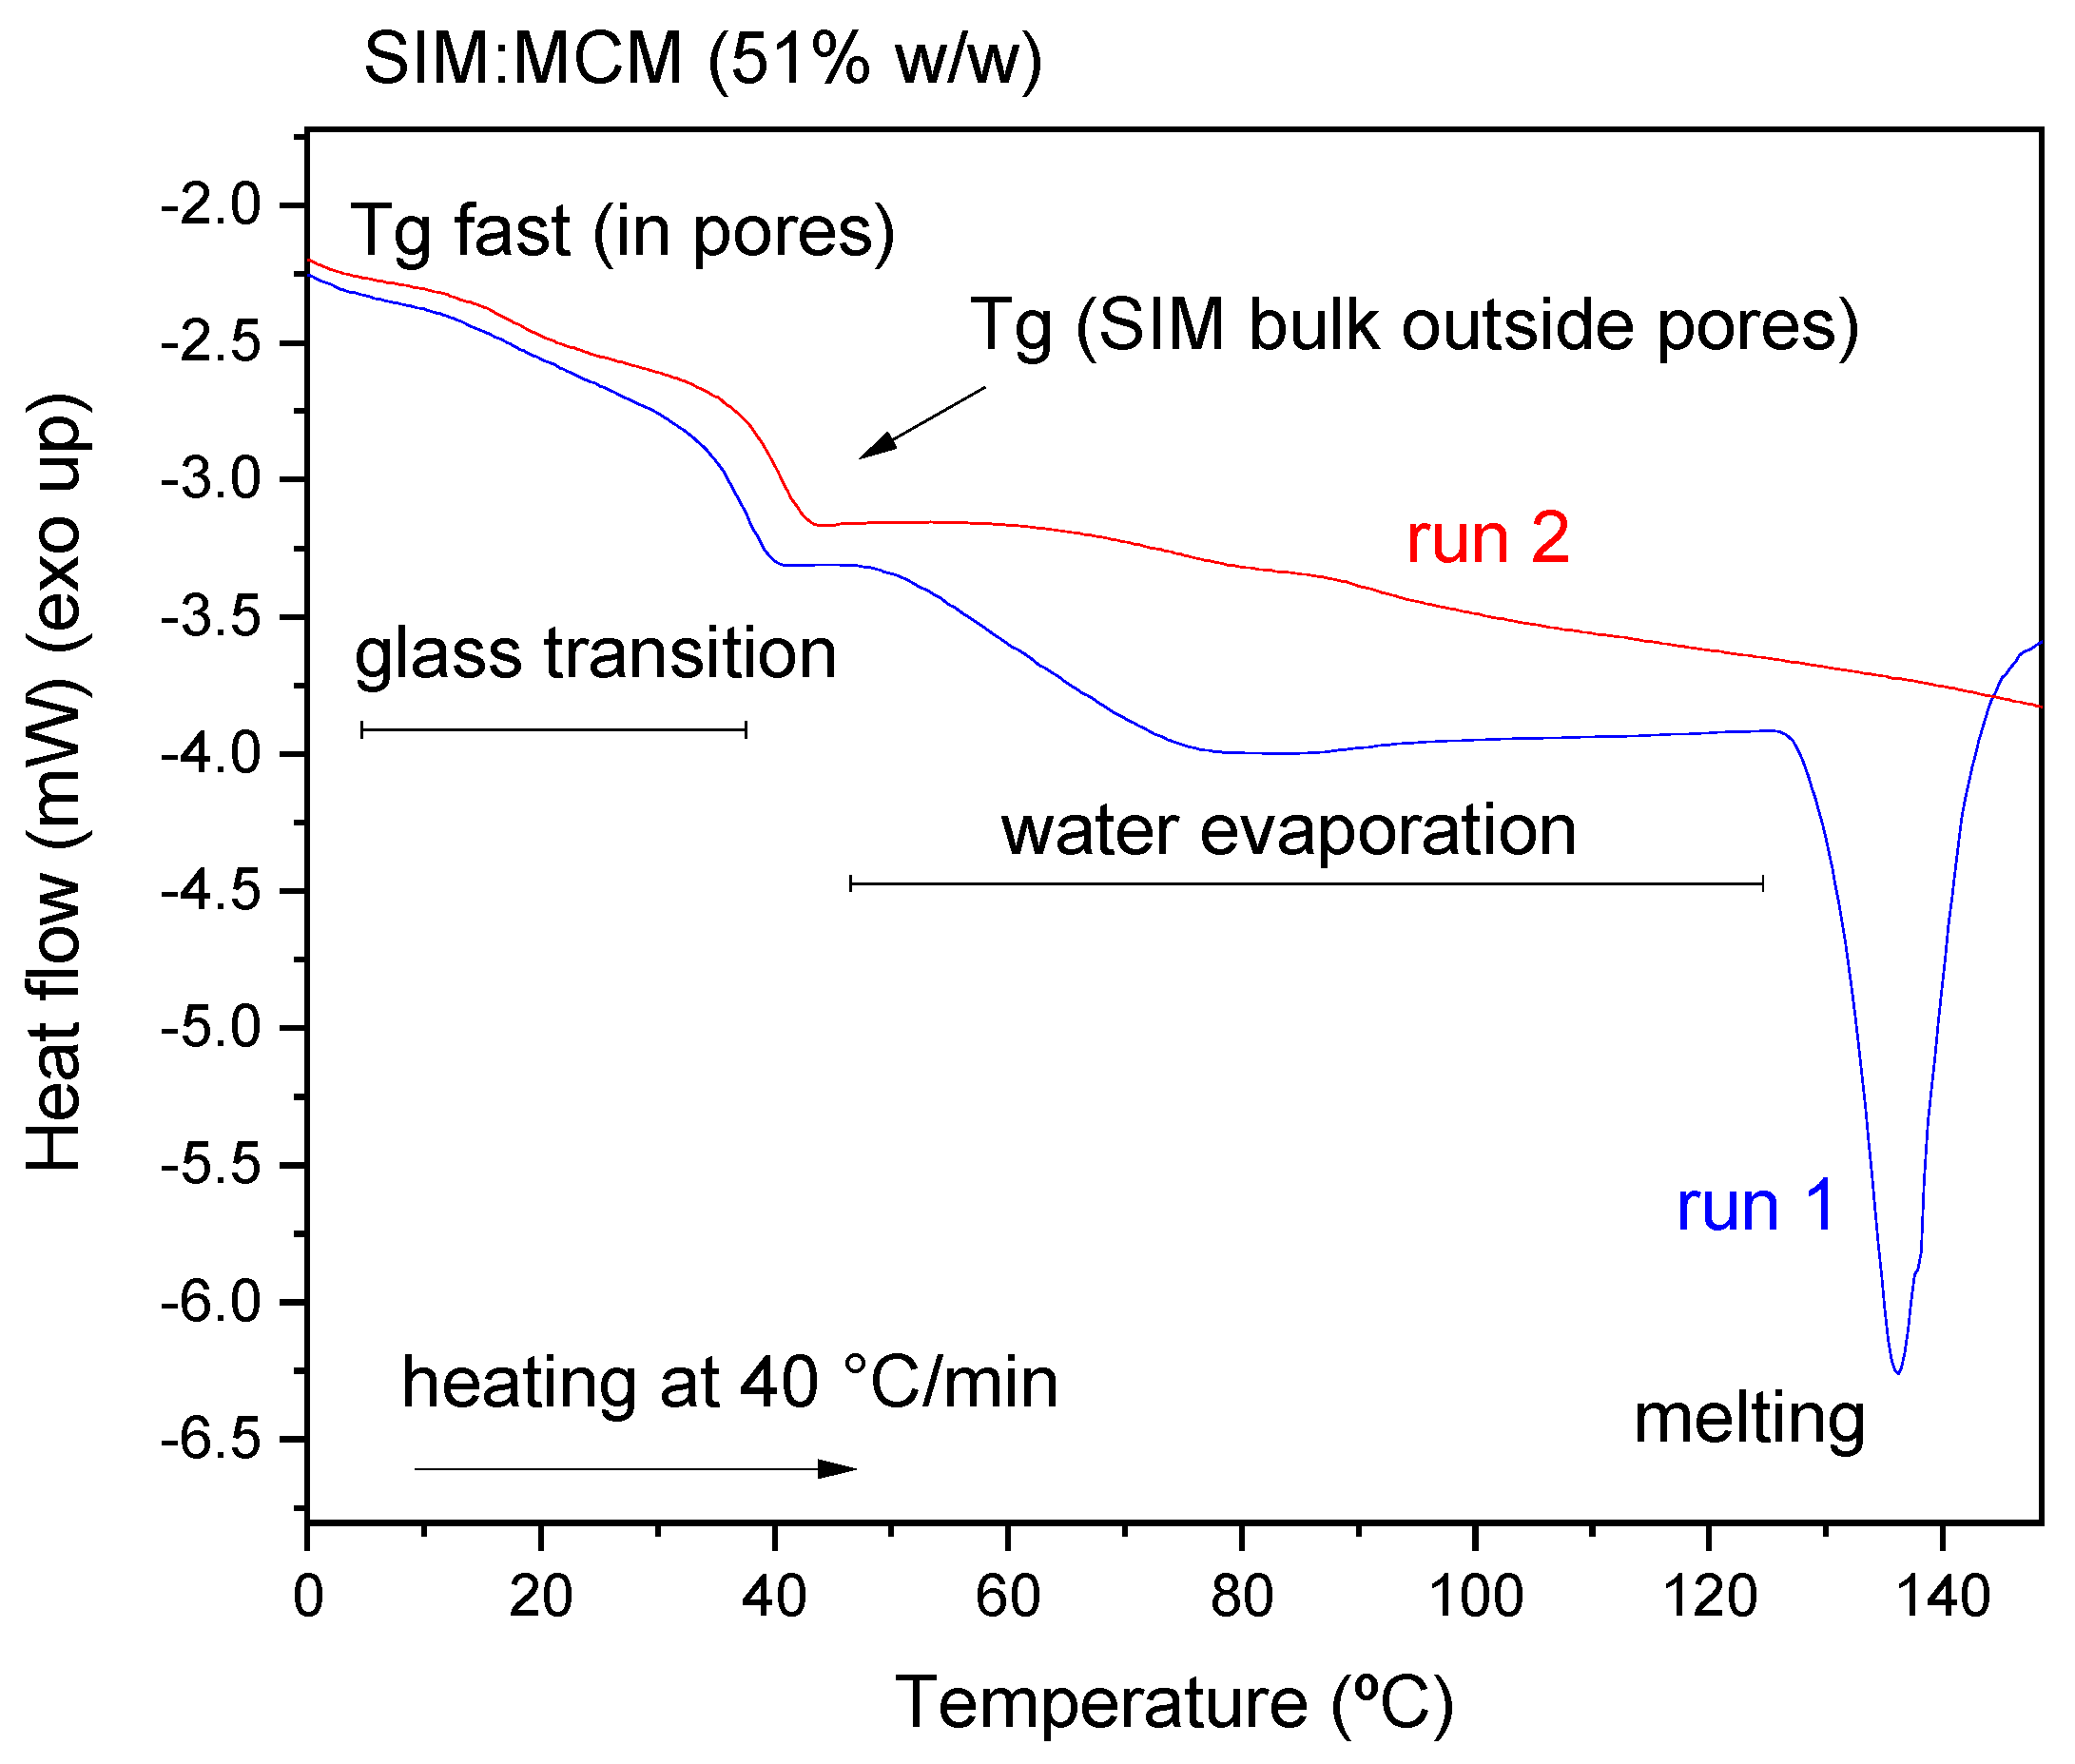
2.2.7. Differential Scanning Calorimetry (DSC)
2.2.8. Dielectric Relaxation Spectroscopy (DRS)
2.2.9. In Vitro Drug Dissolution and Drug Release Studies
2.2.10. Molecular Dynamics Simulations
3. Results and Discussion
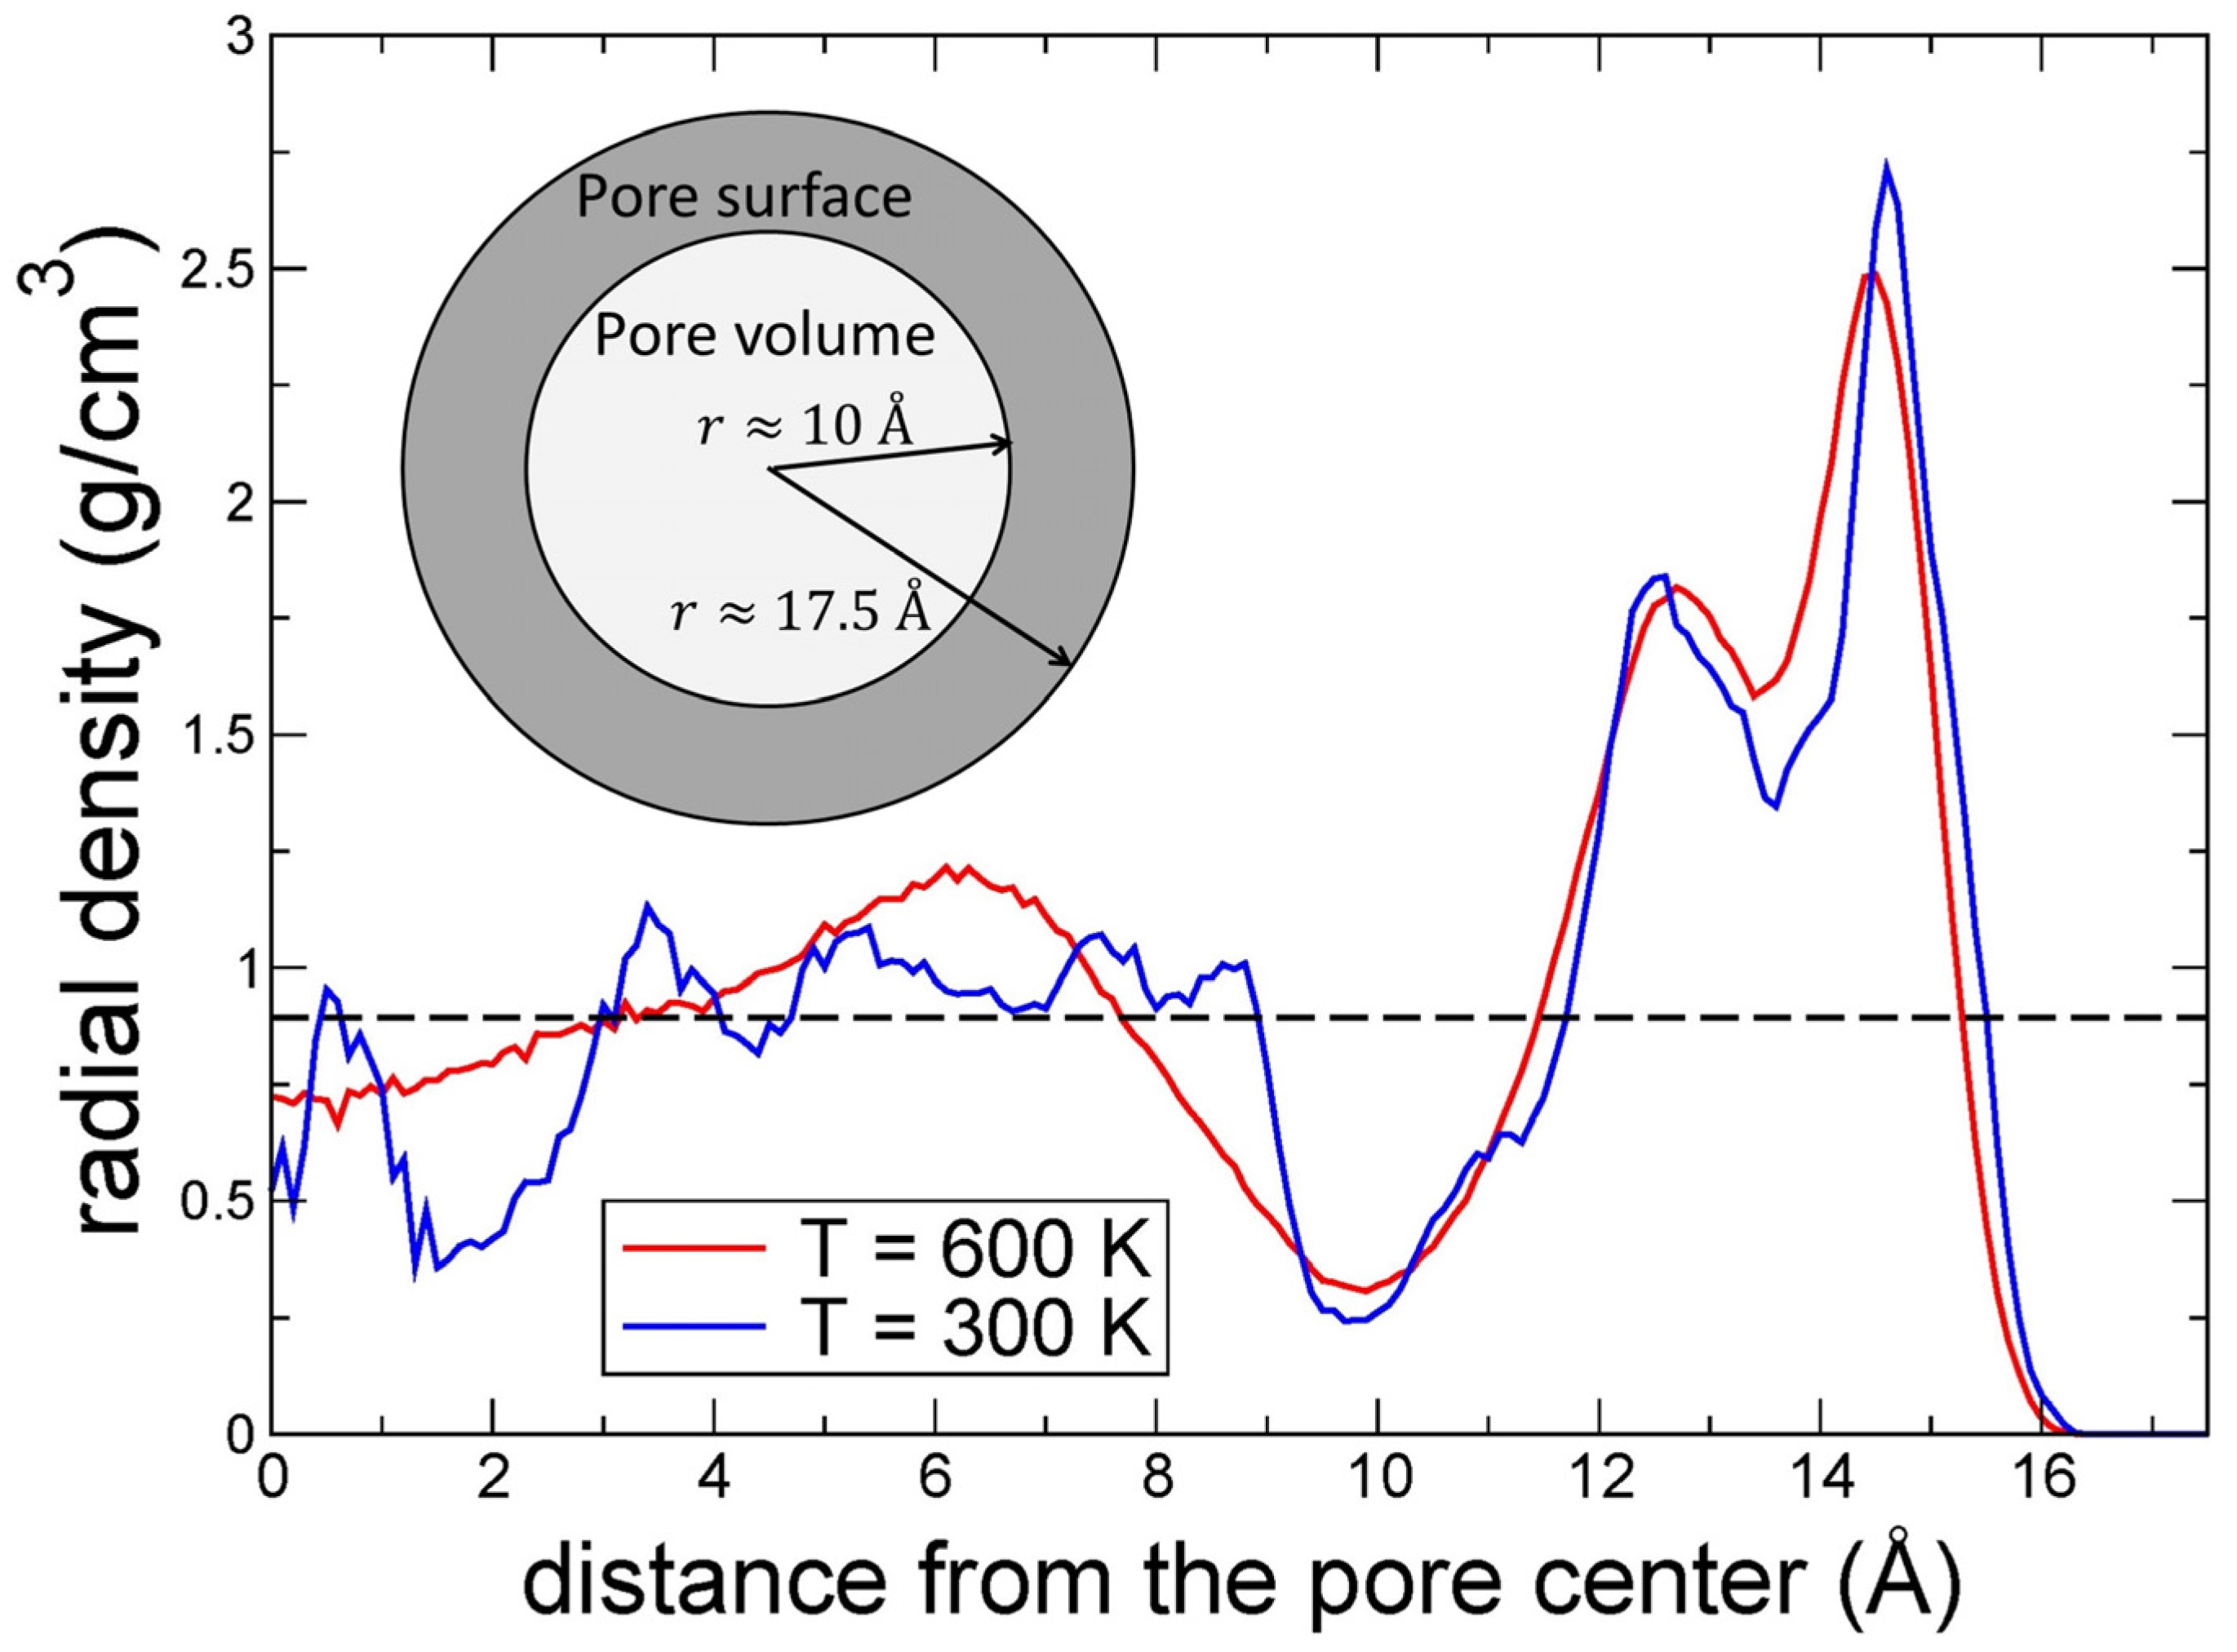
3.1. Textural Analysis
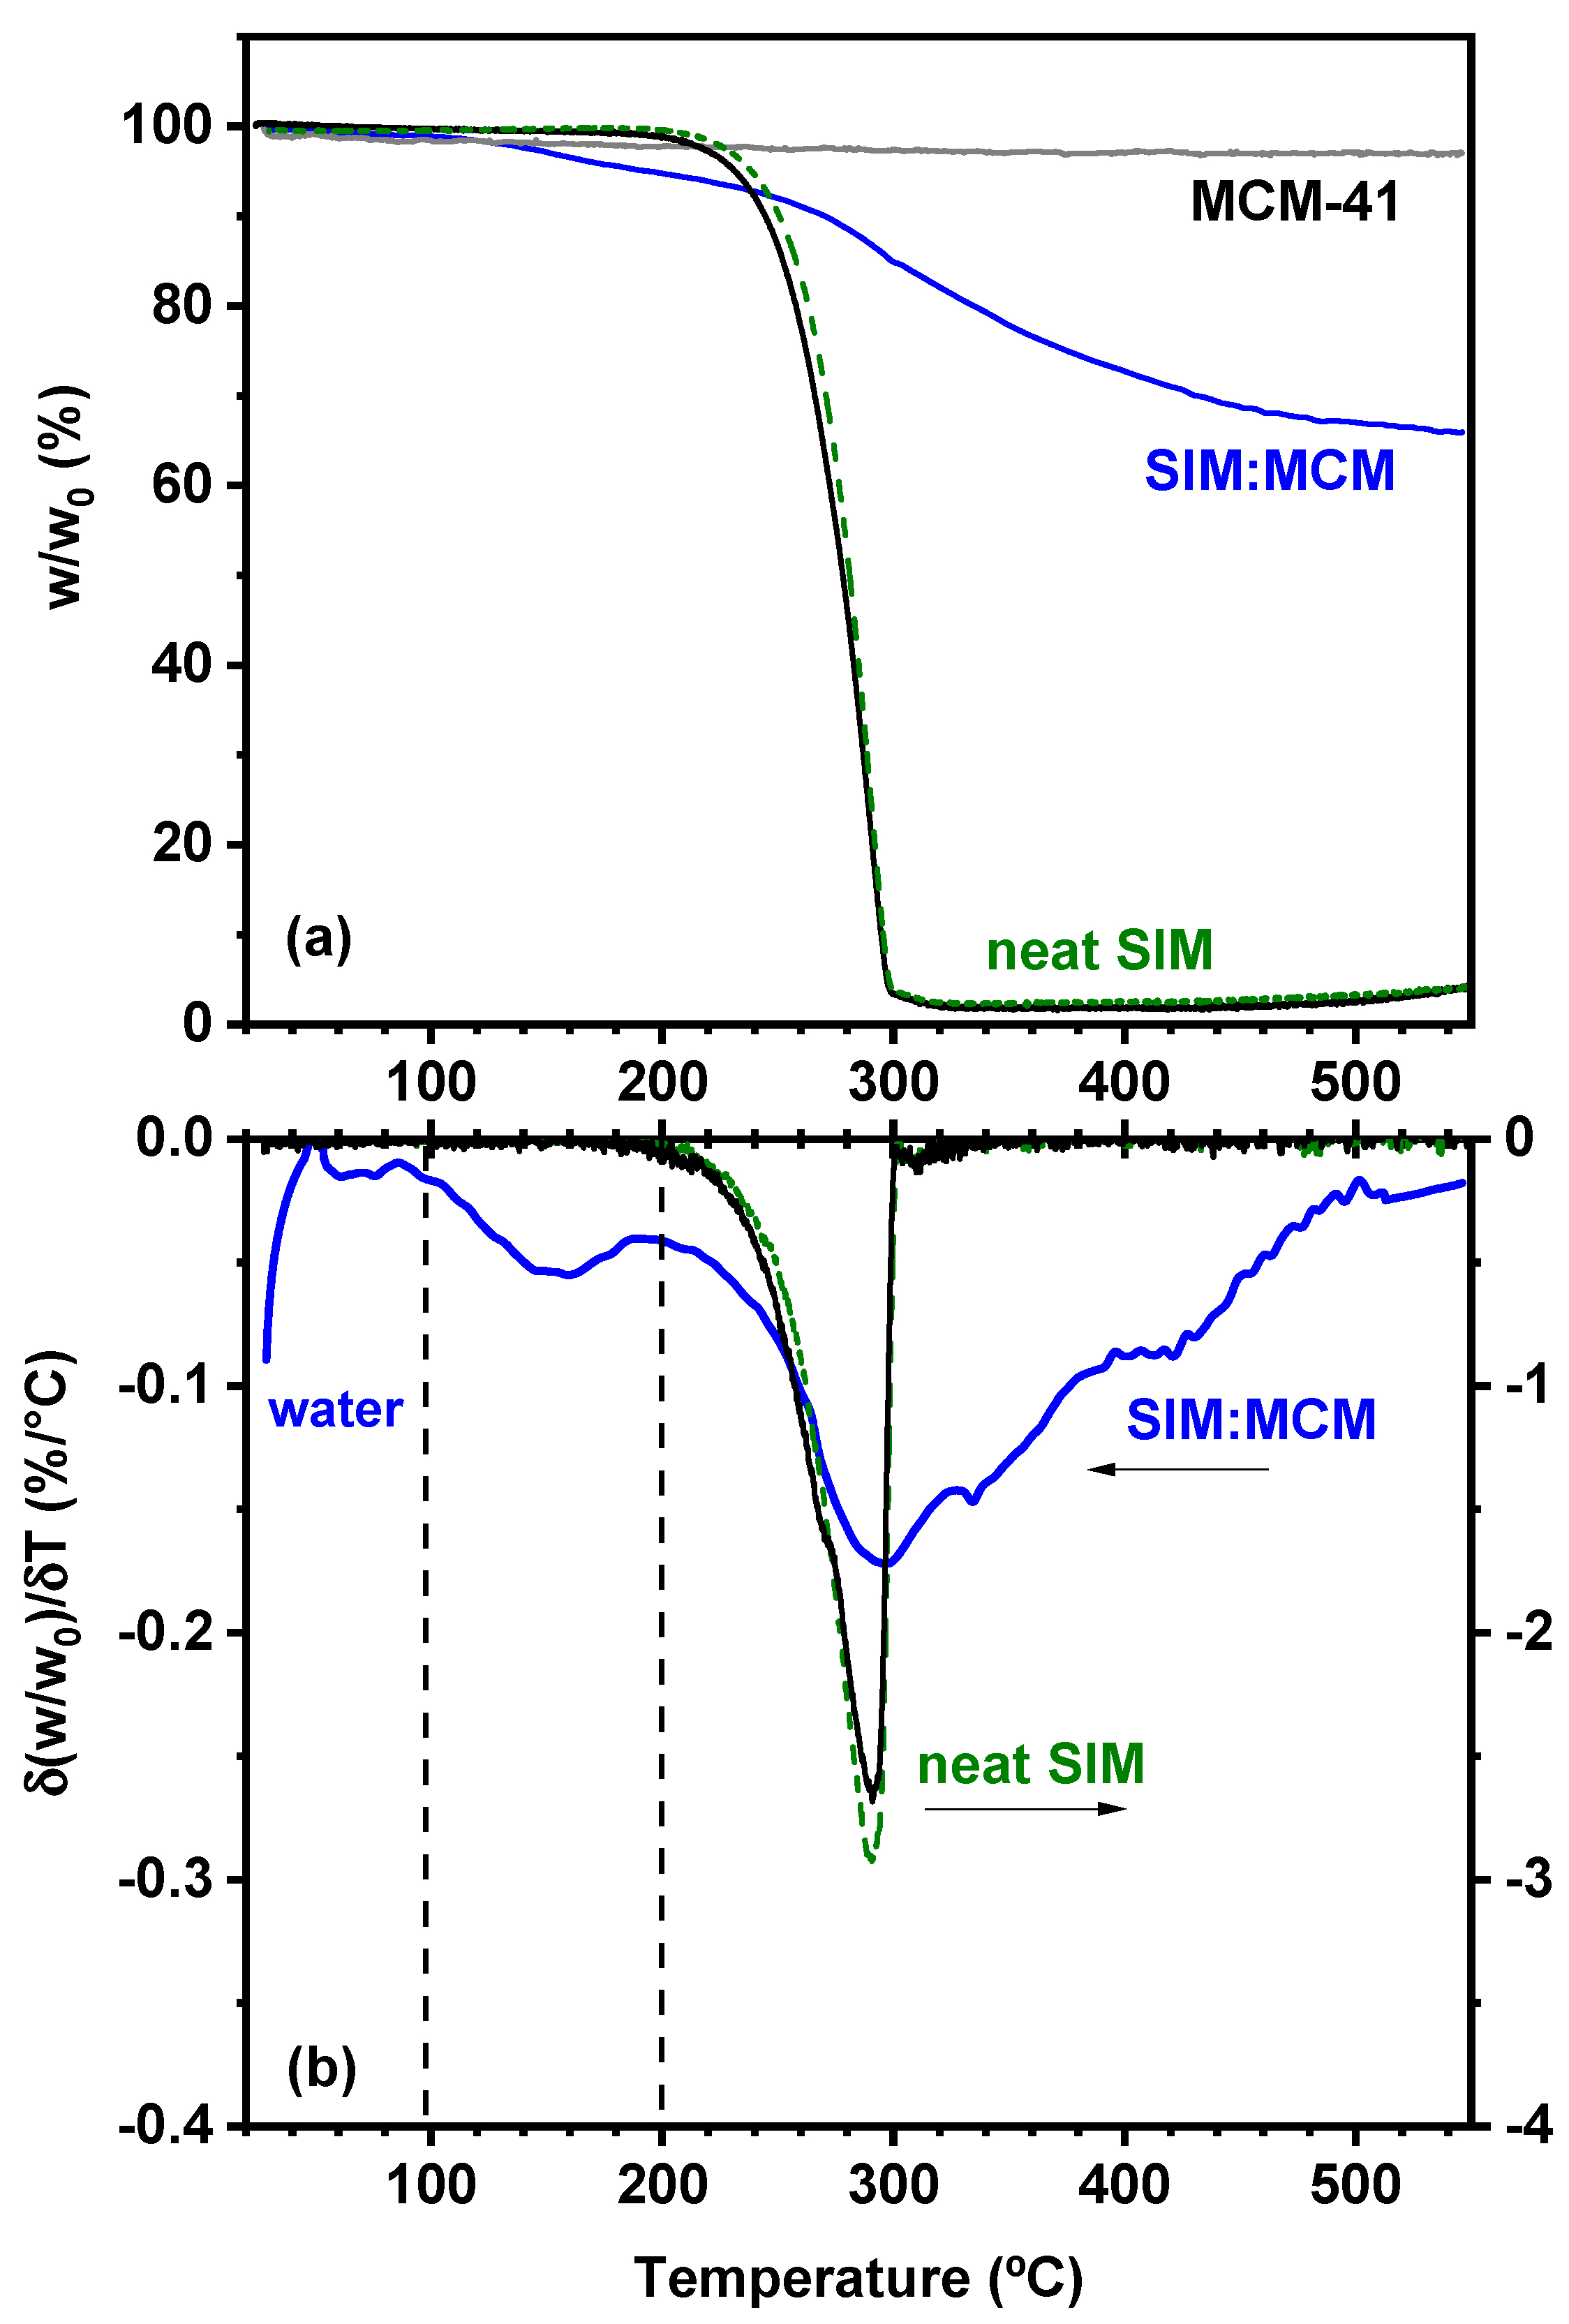
3.2. Thermogravimetric Analysis (TGA)
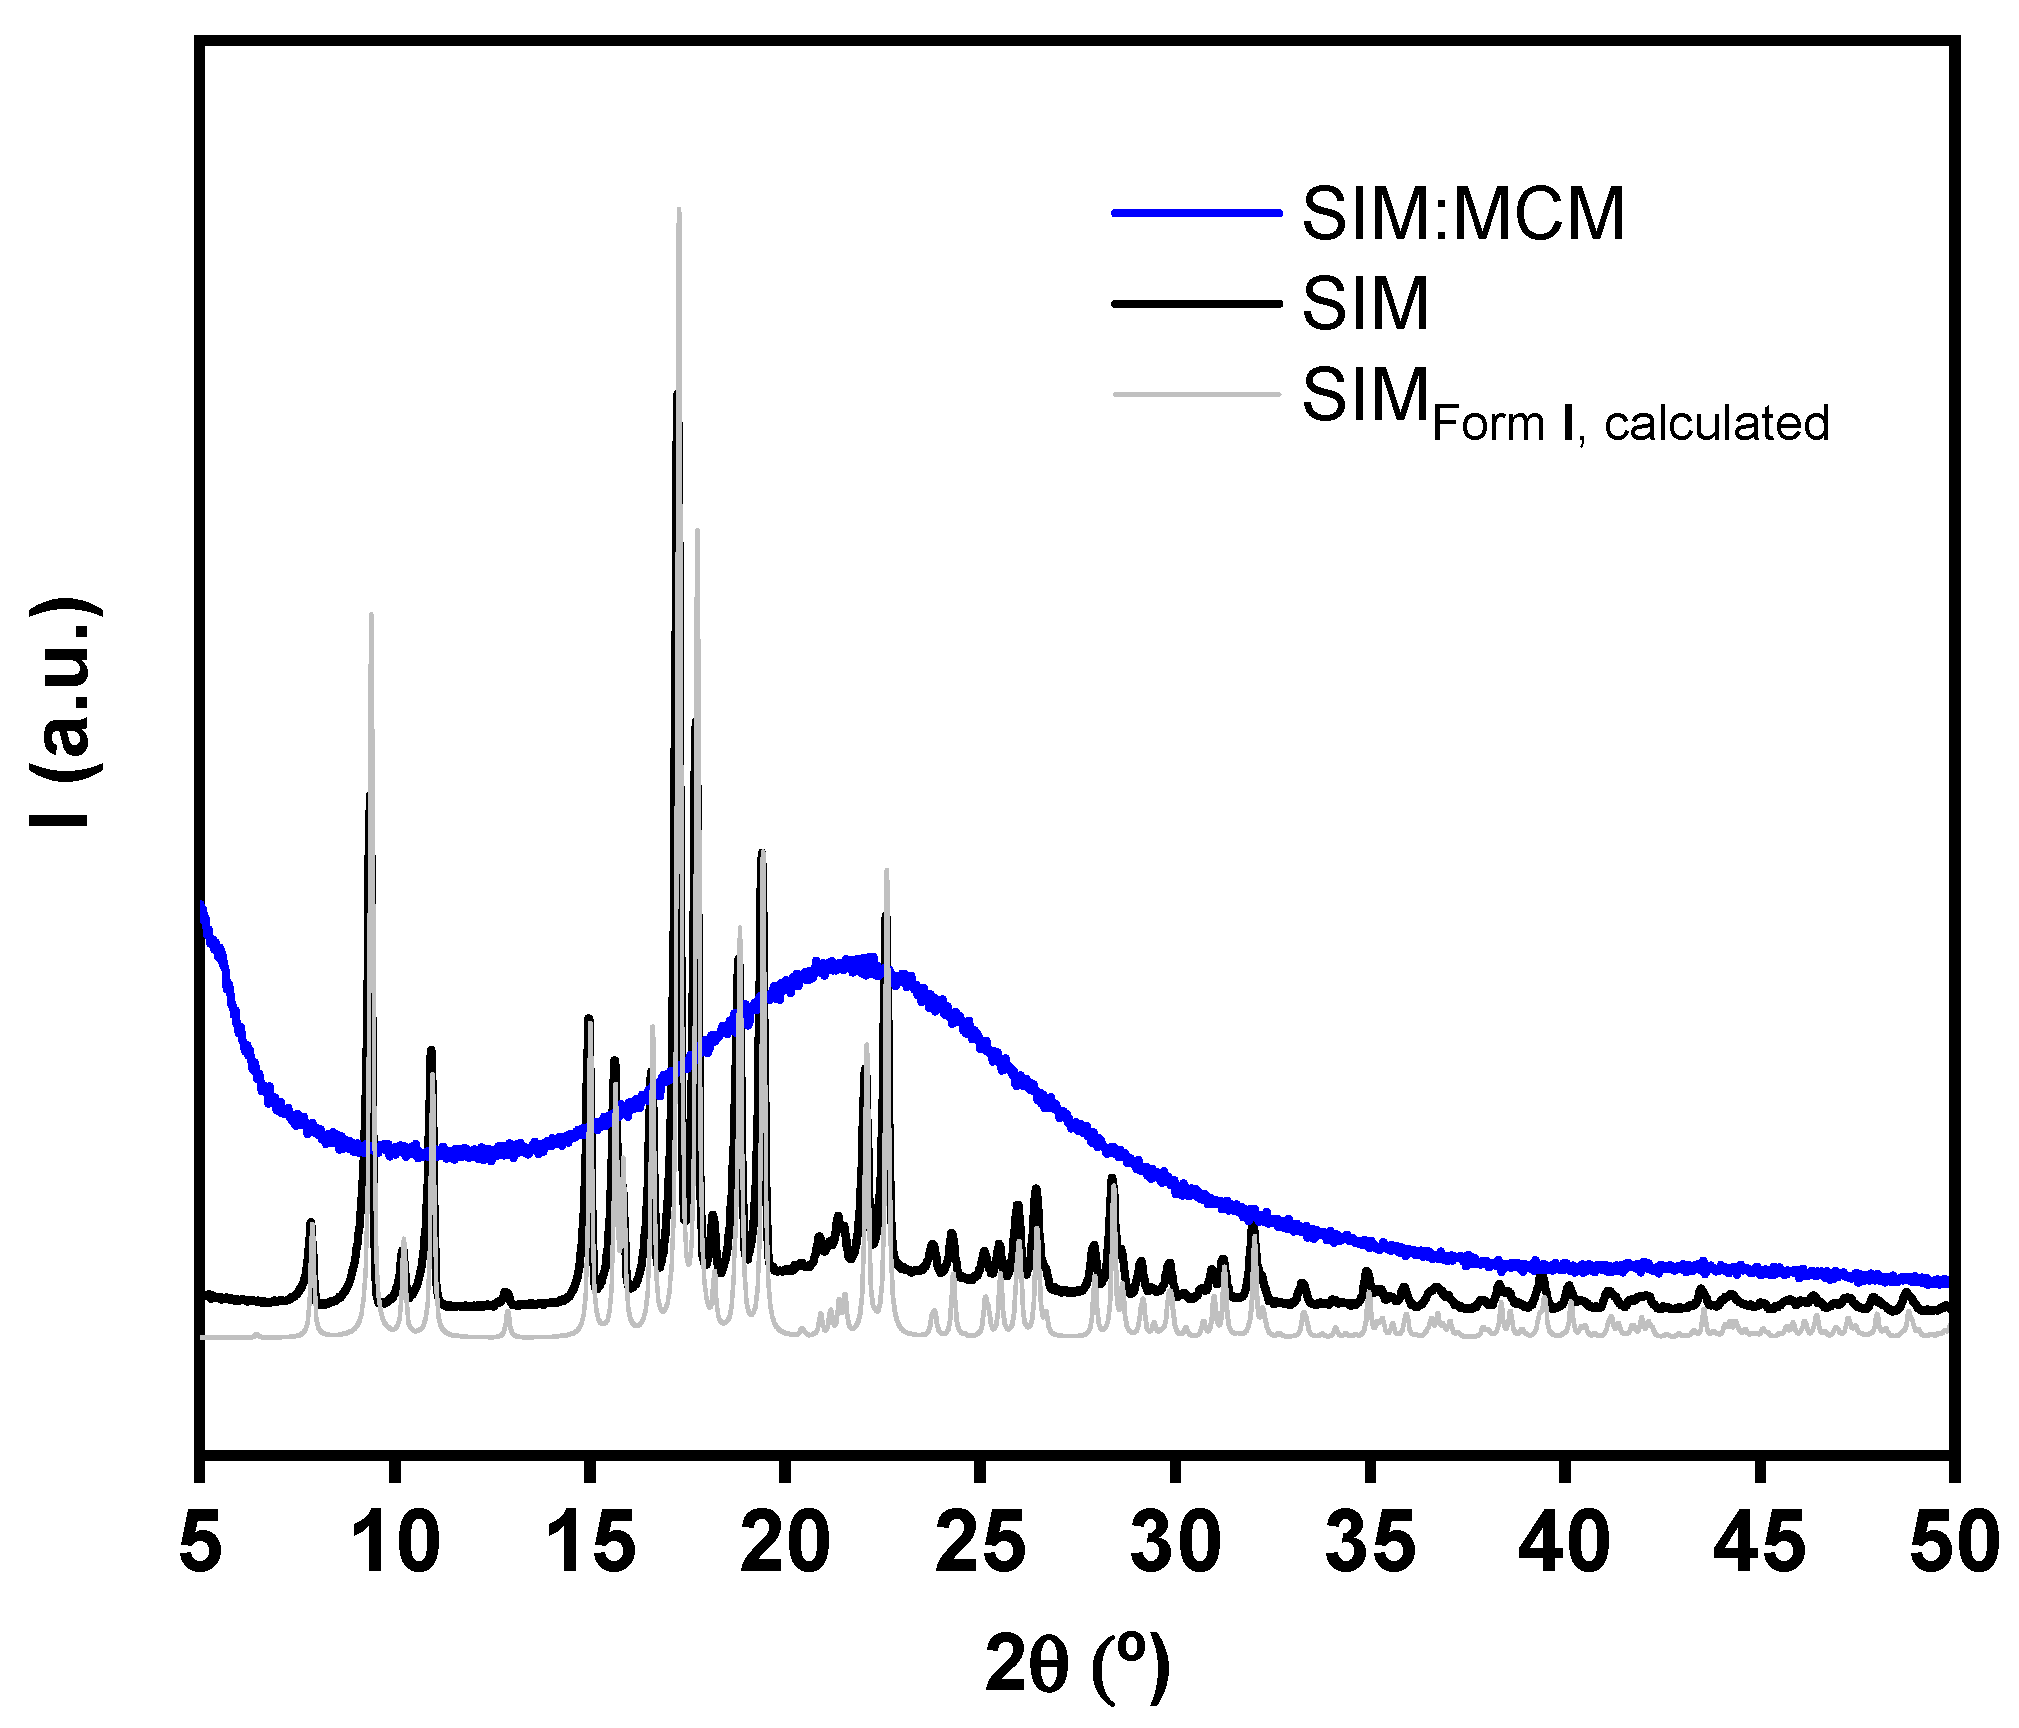
3.3. Powder X-ray Diffraction Analysis
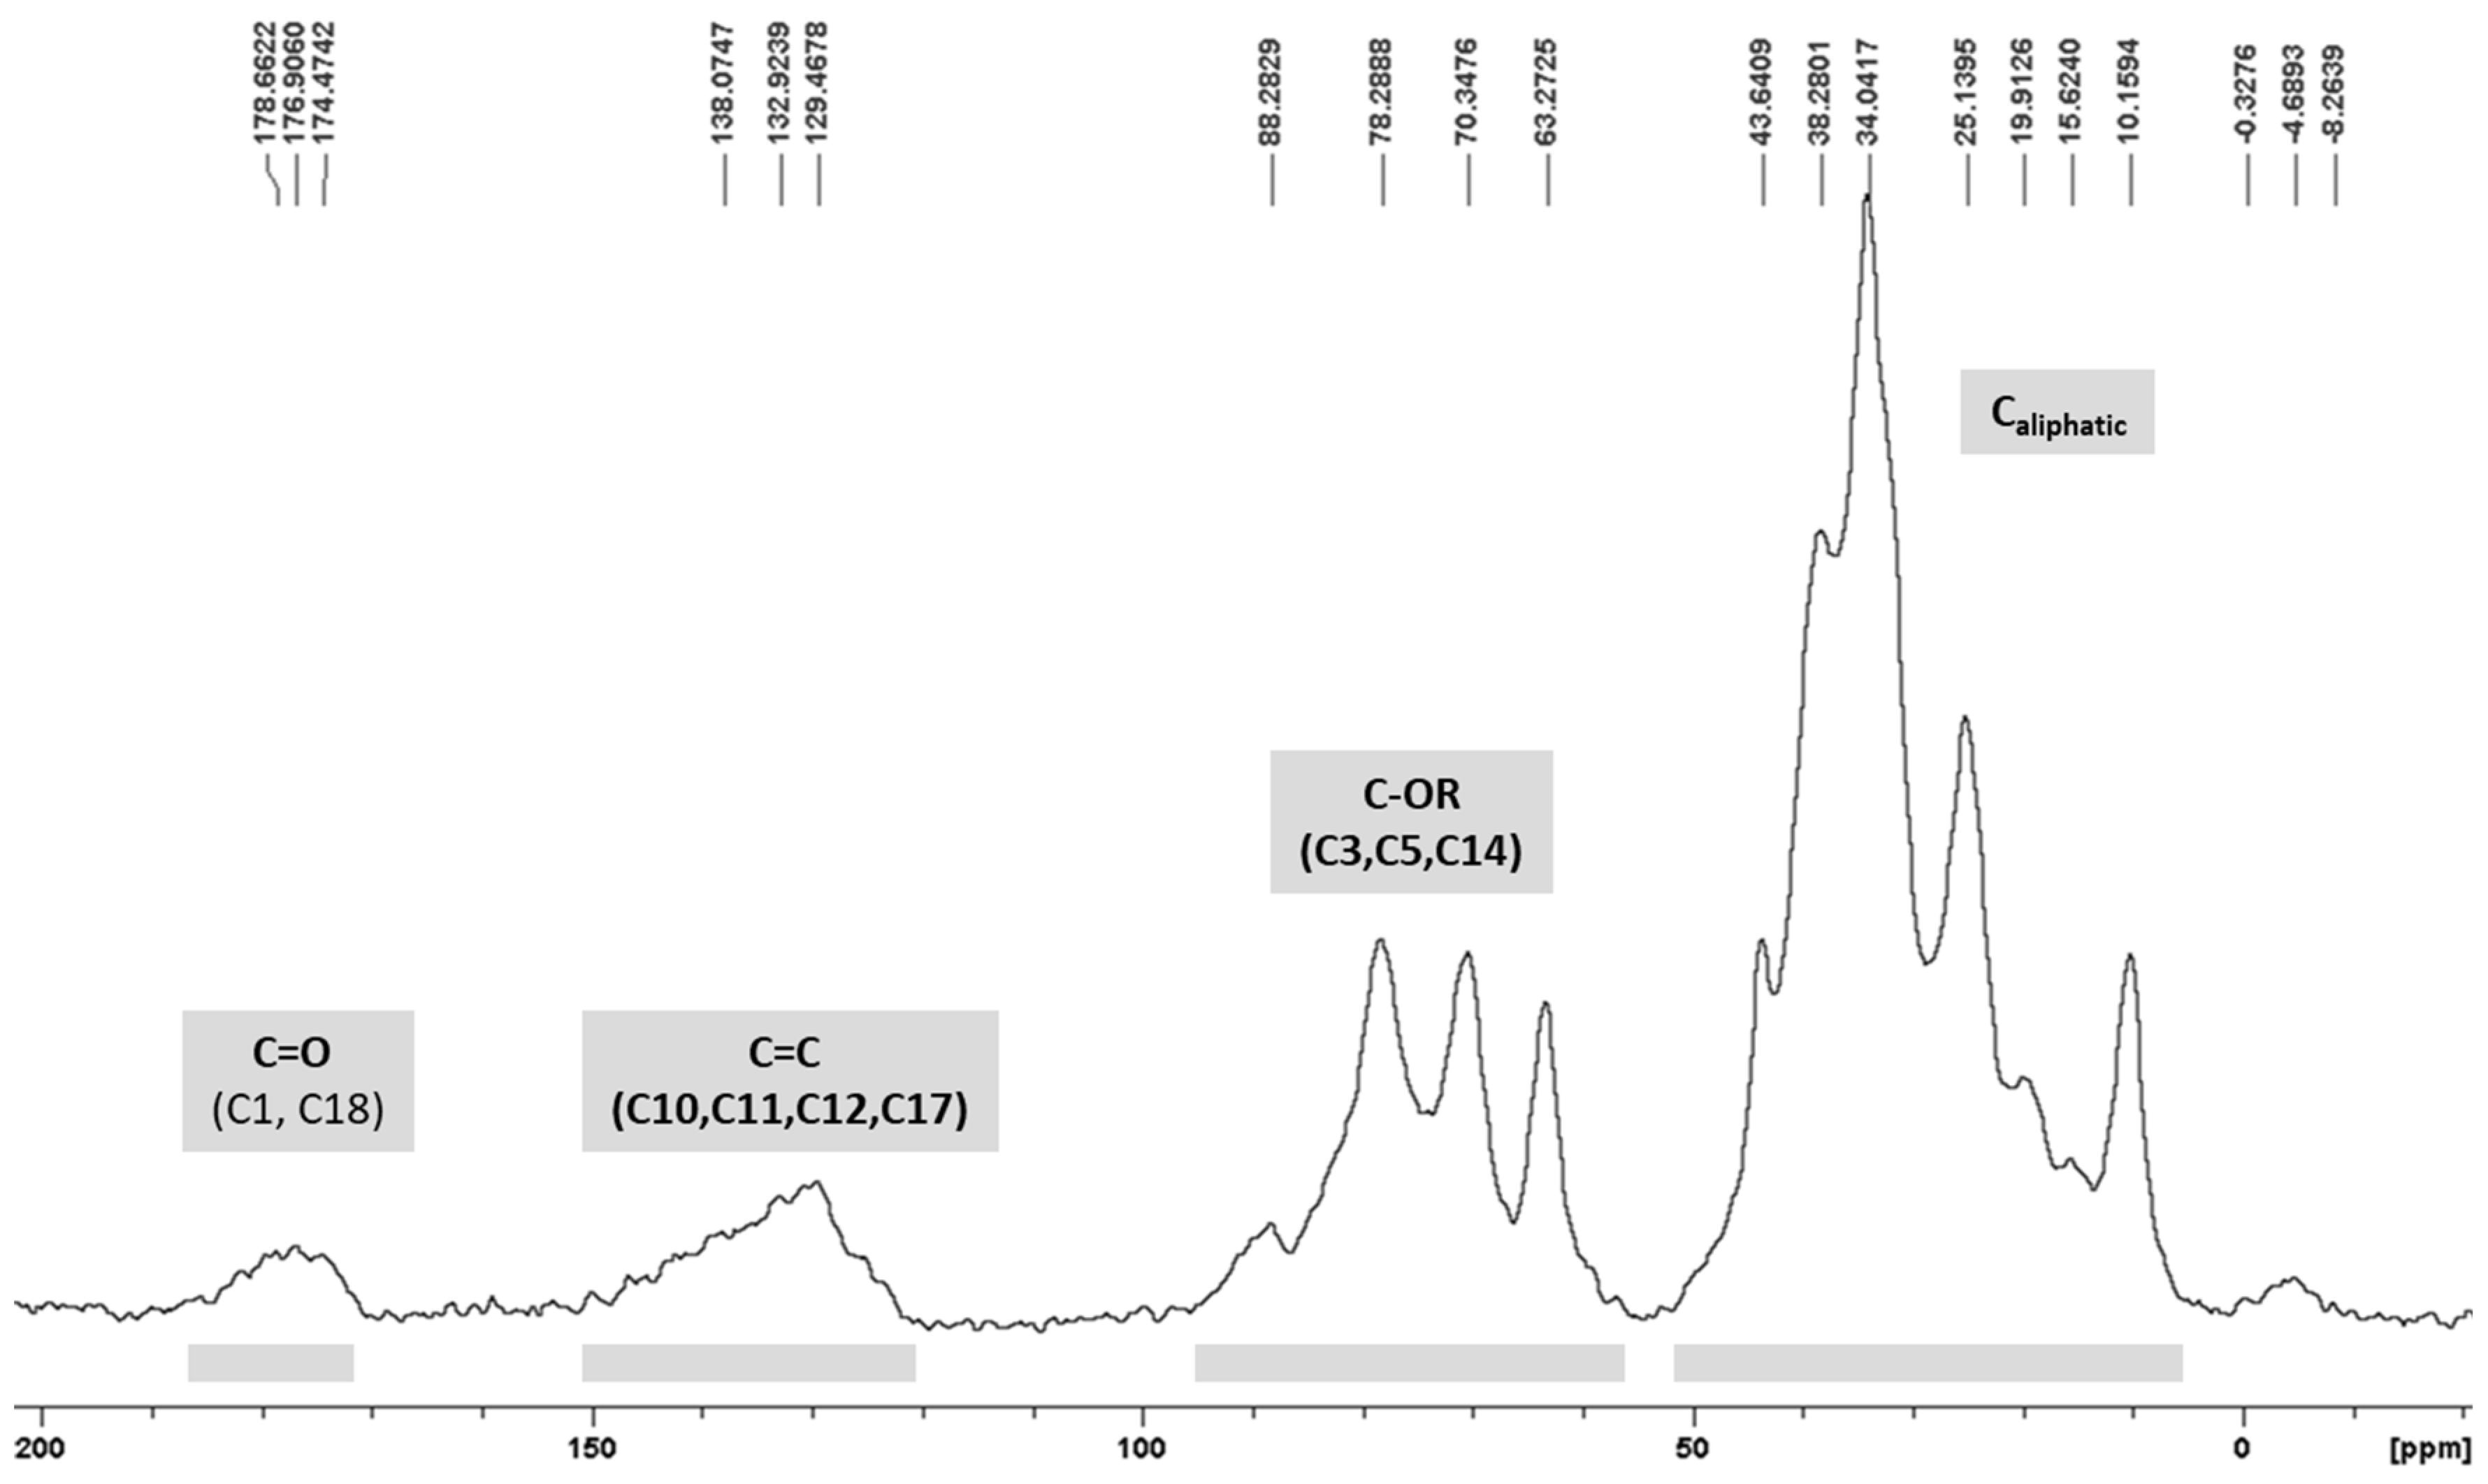
3.4. 13C CP/MAS ssNMR Analysis
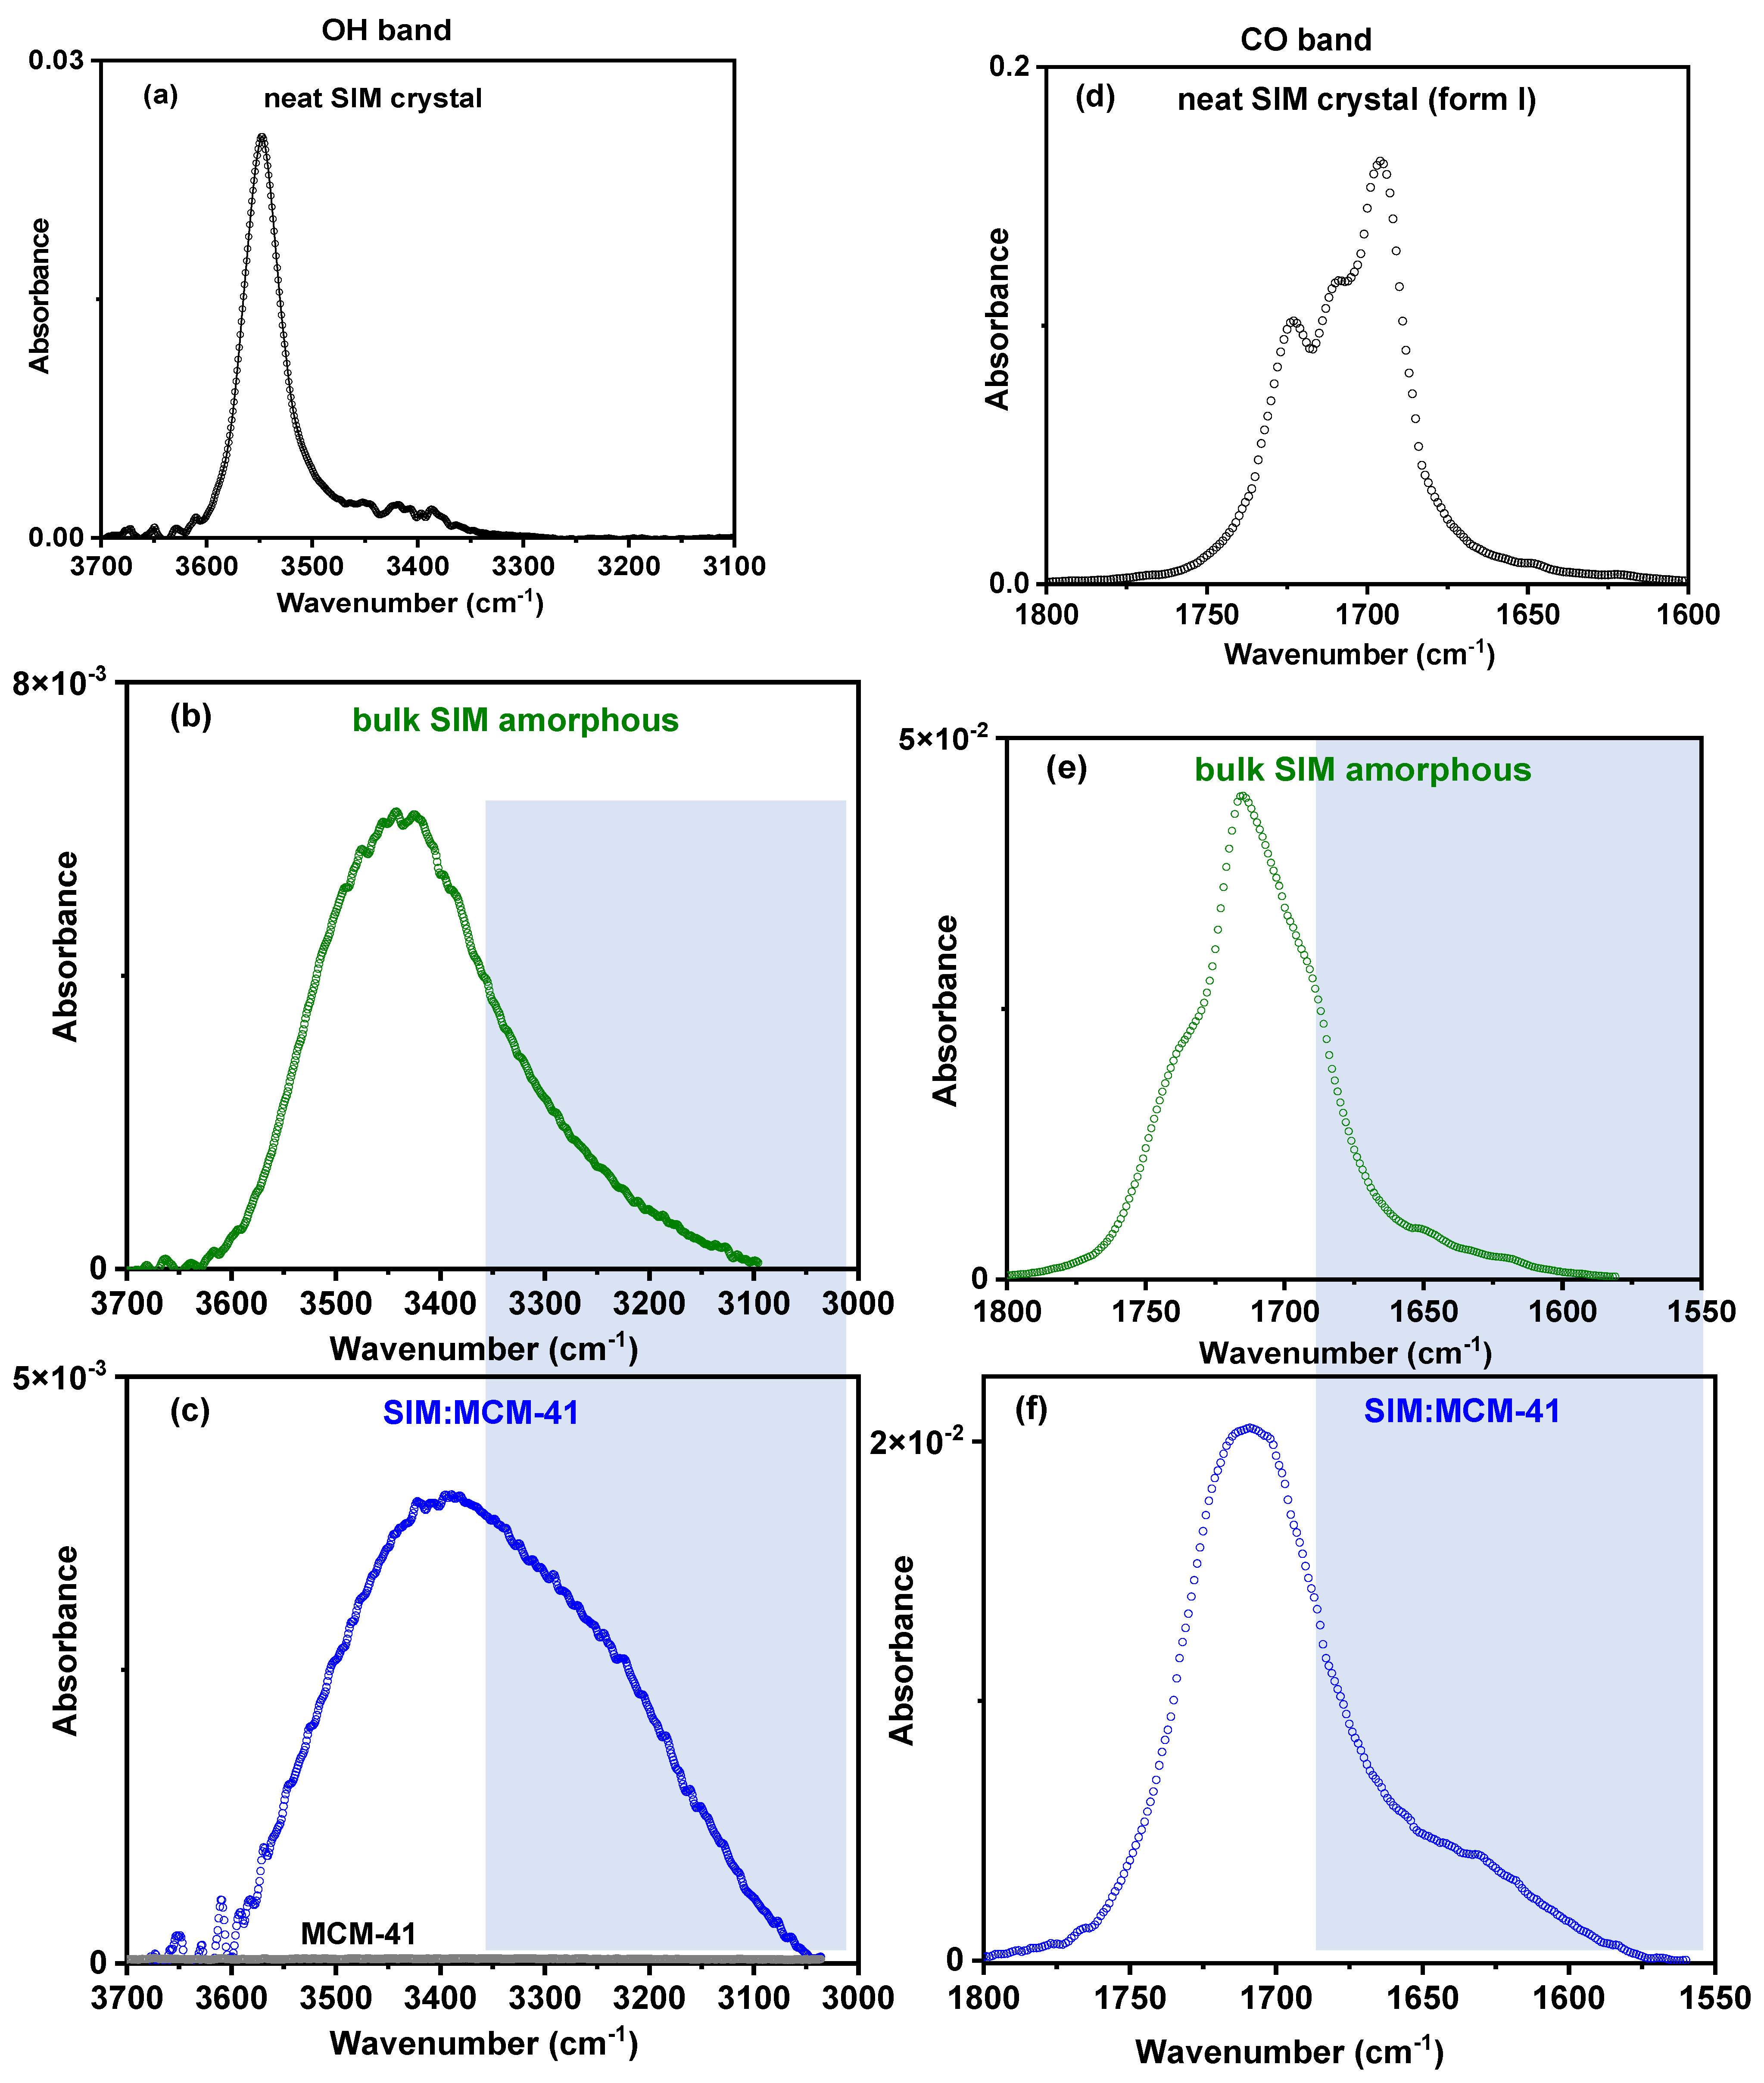
3.5. ATR-FTIR Analysis
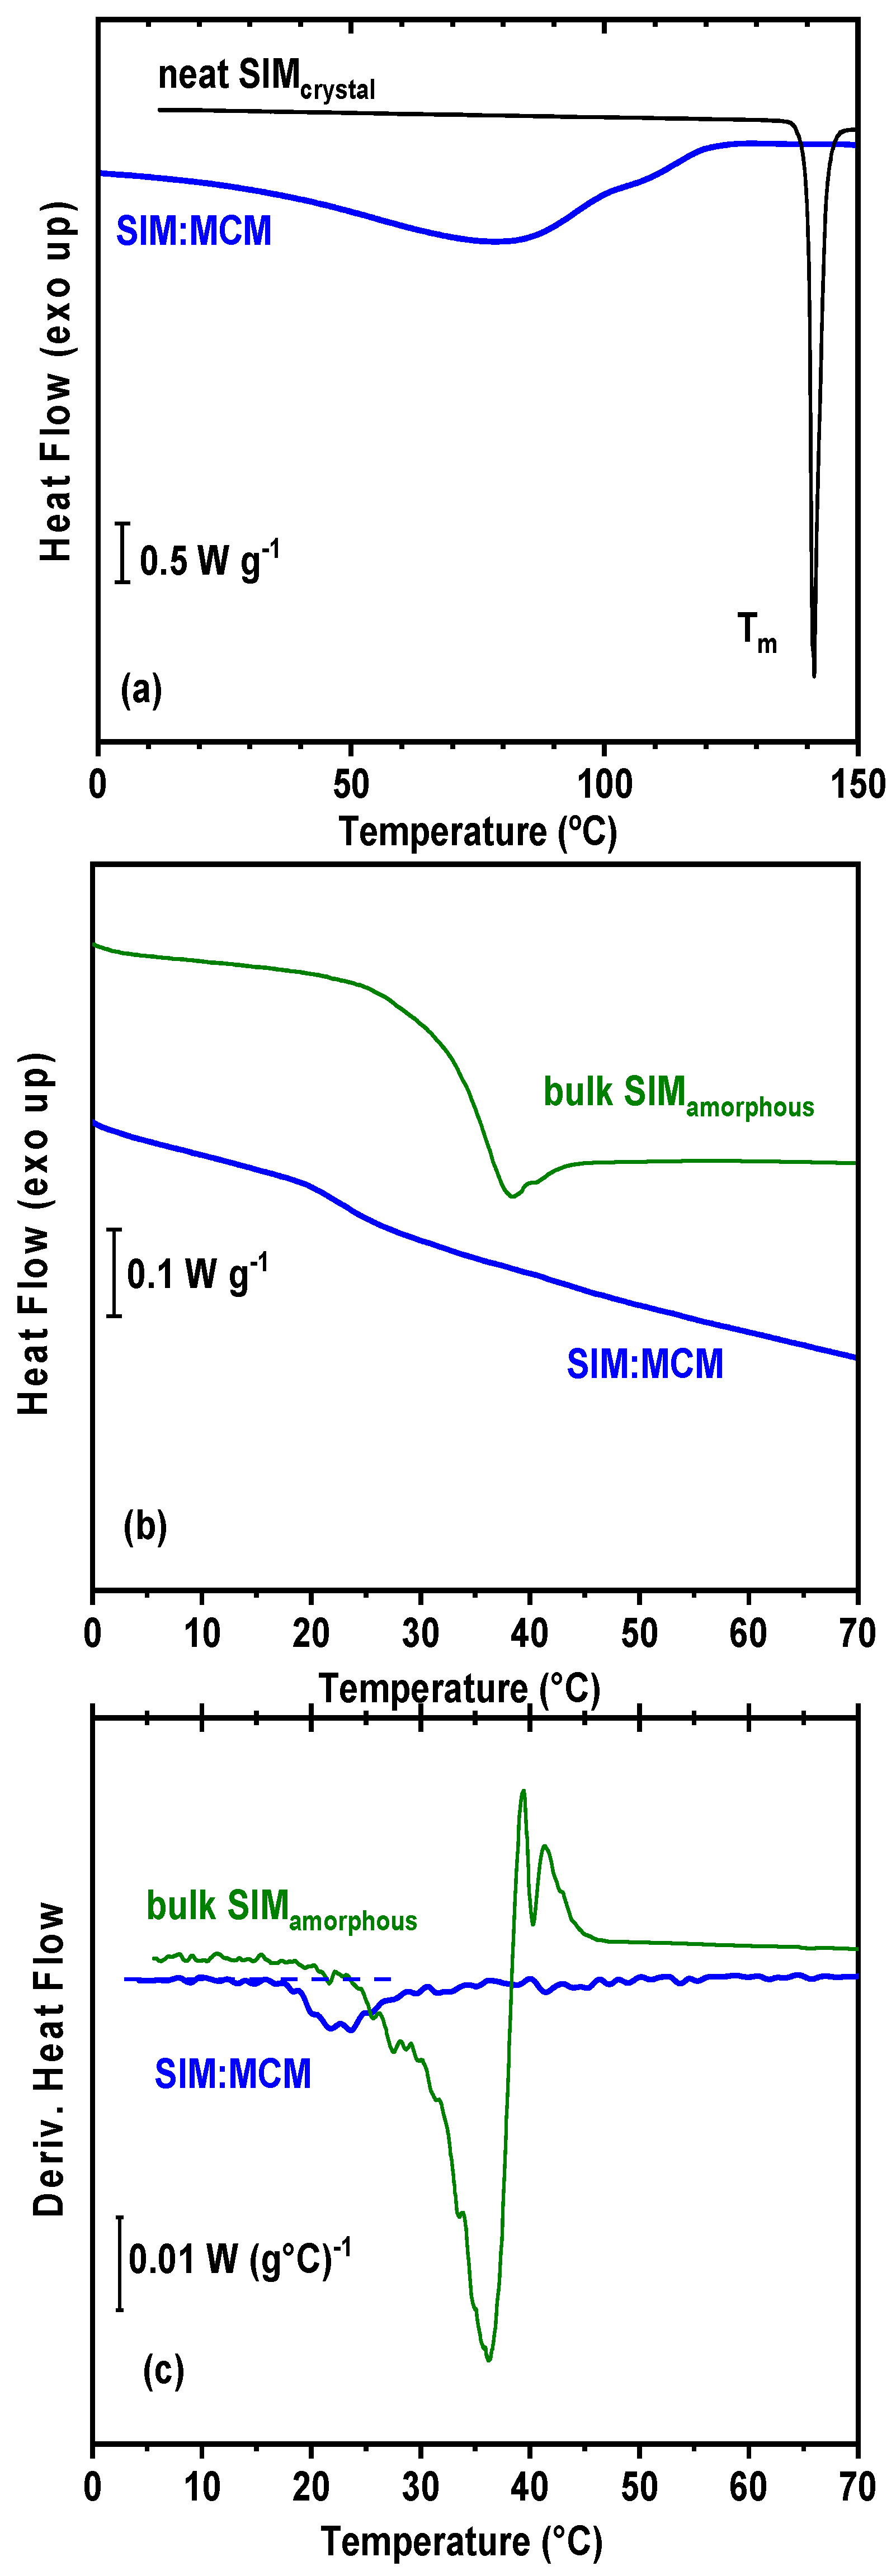
3.6. Differential Scanning Calorimetry (DSC) Analysis
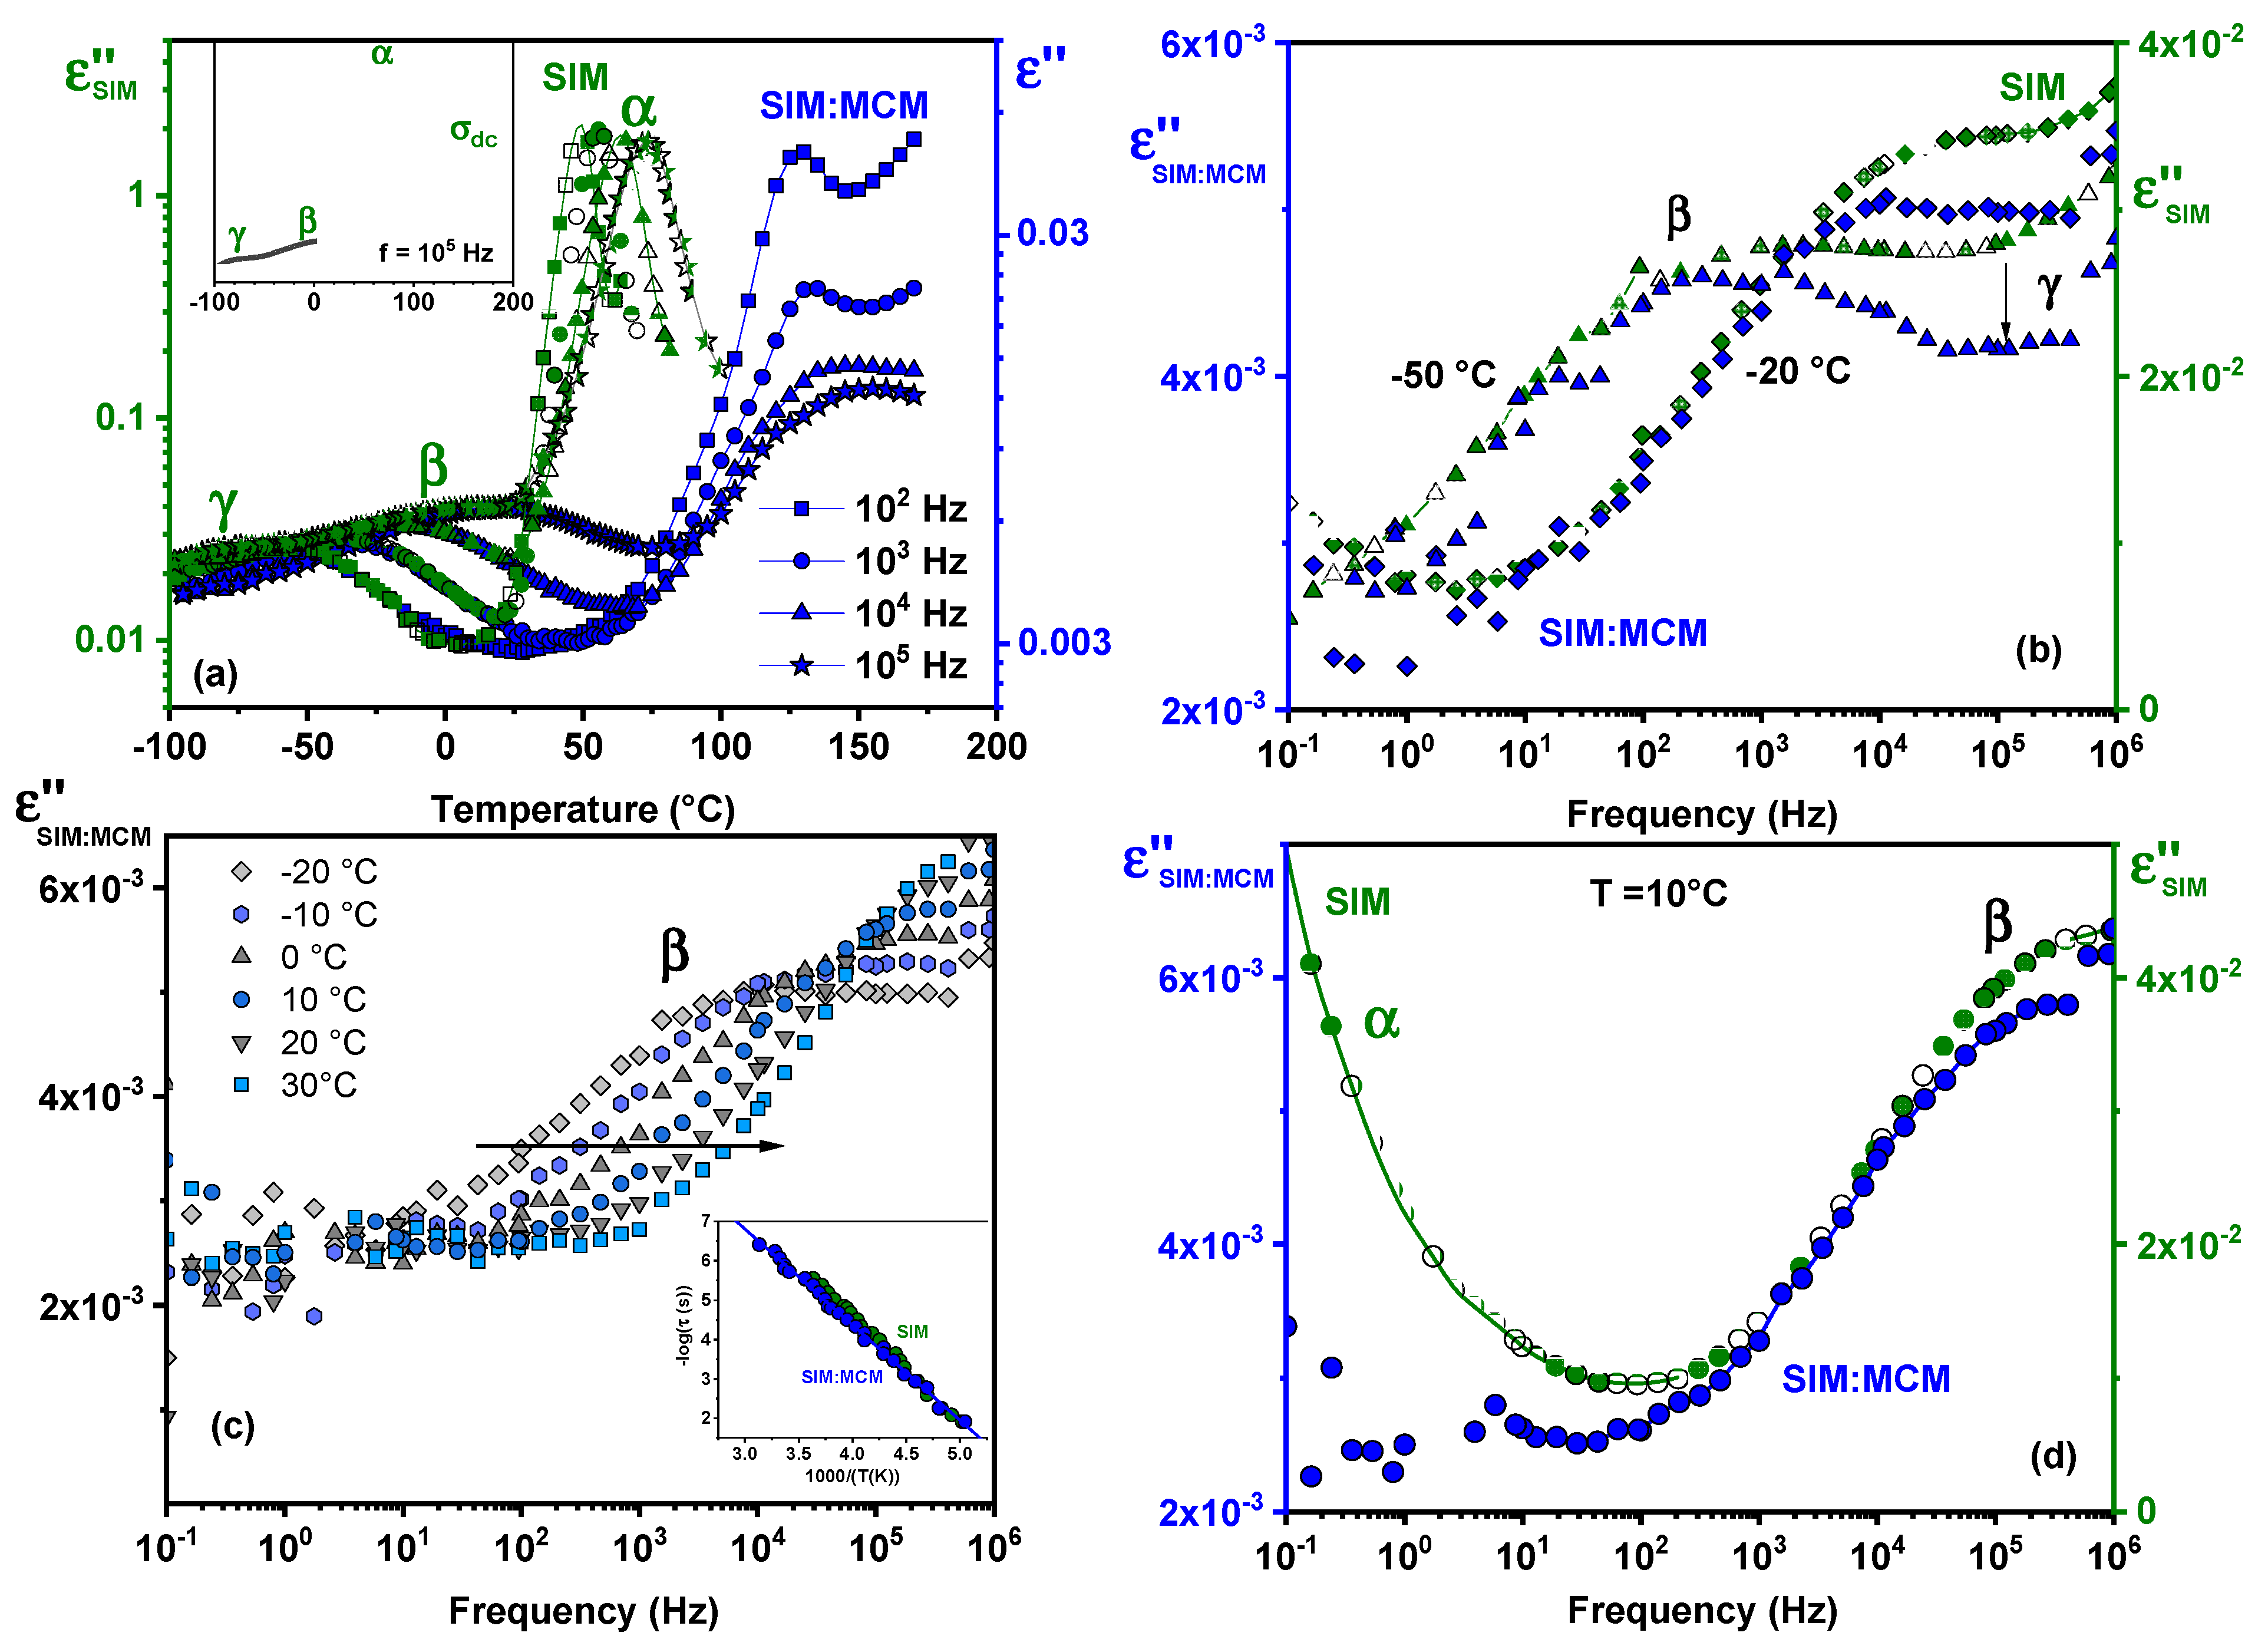
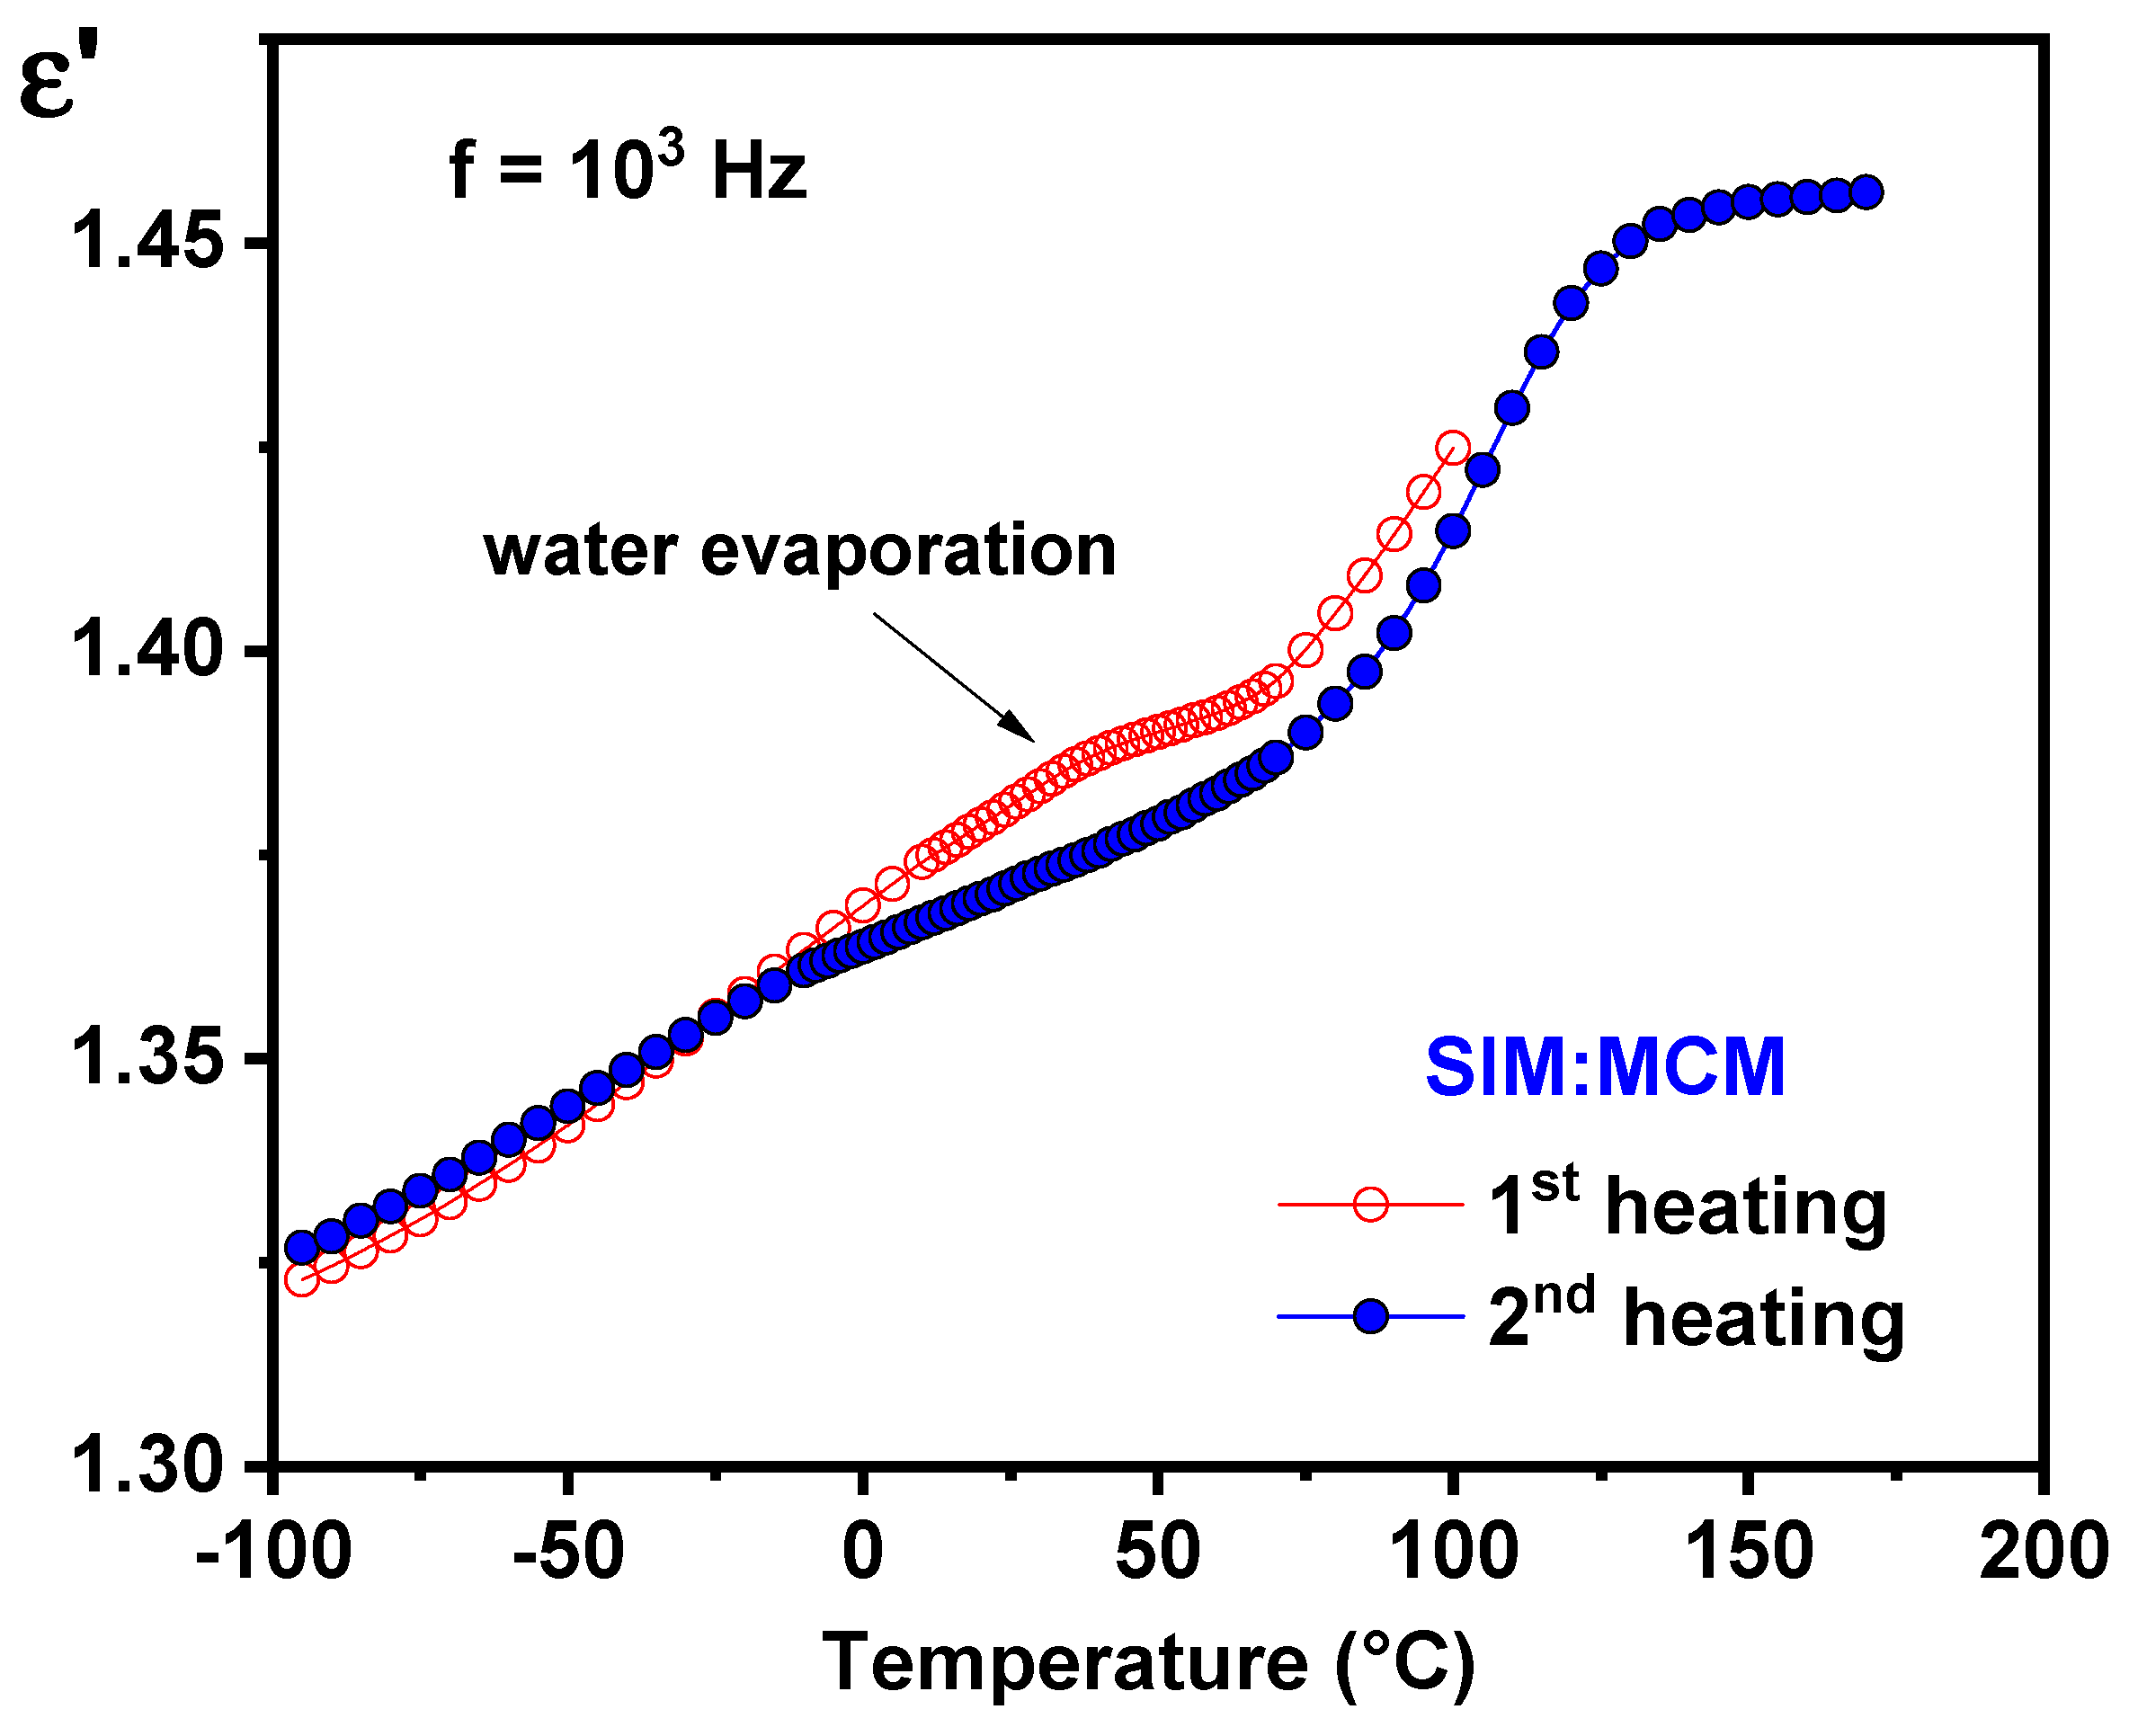
3.7. Dielectric Analysis
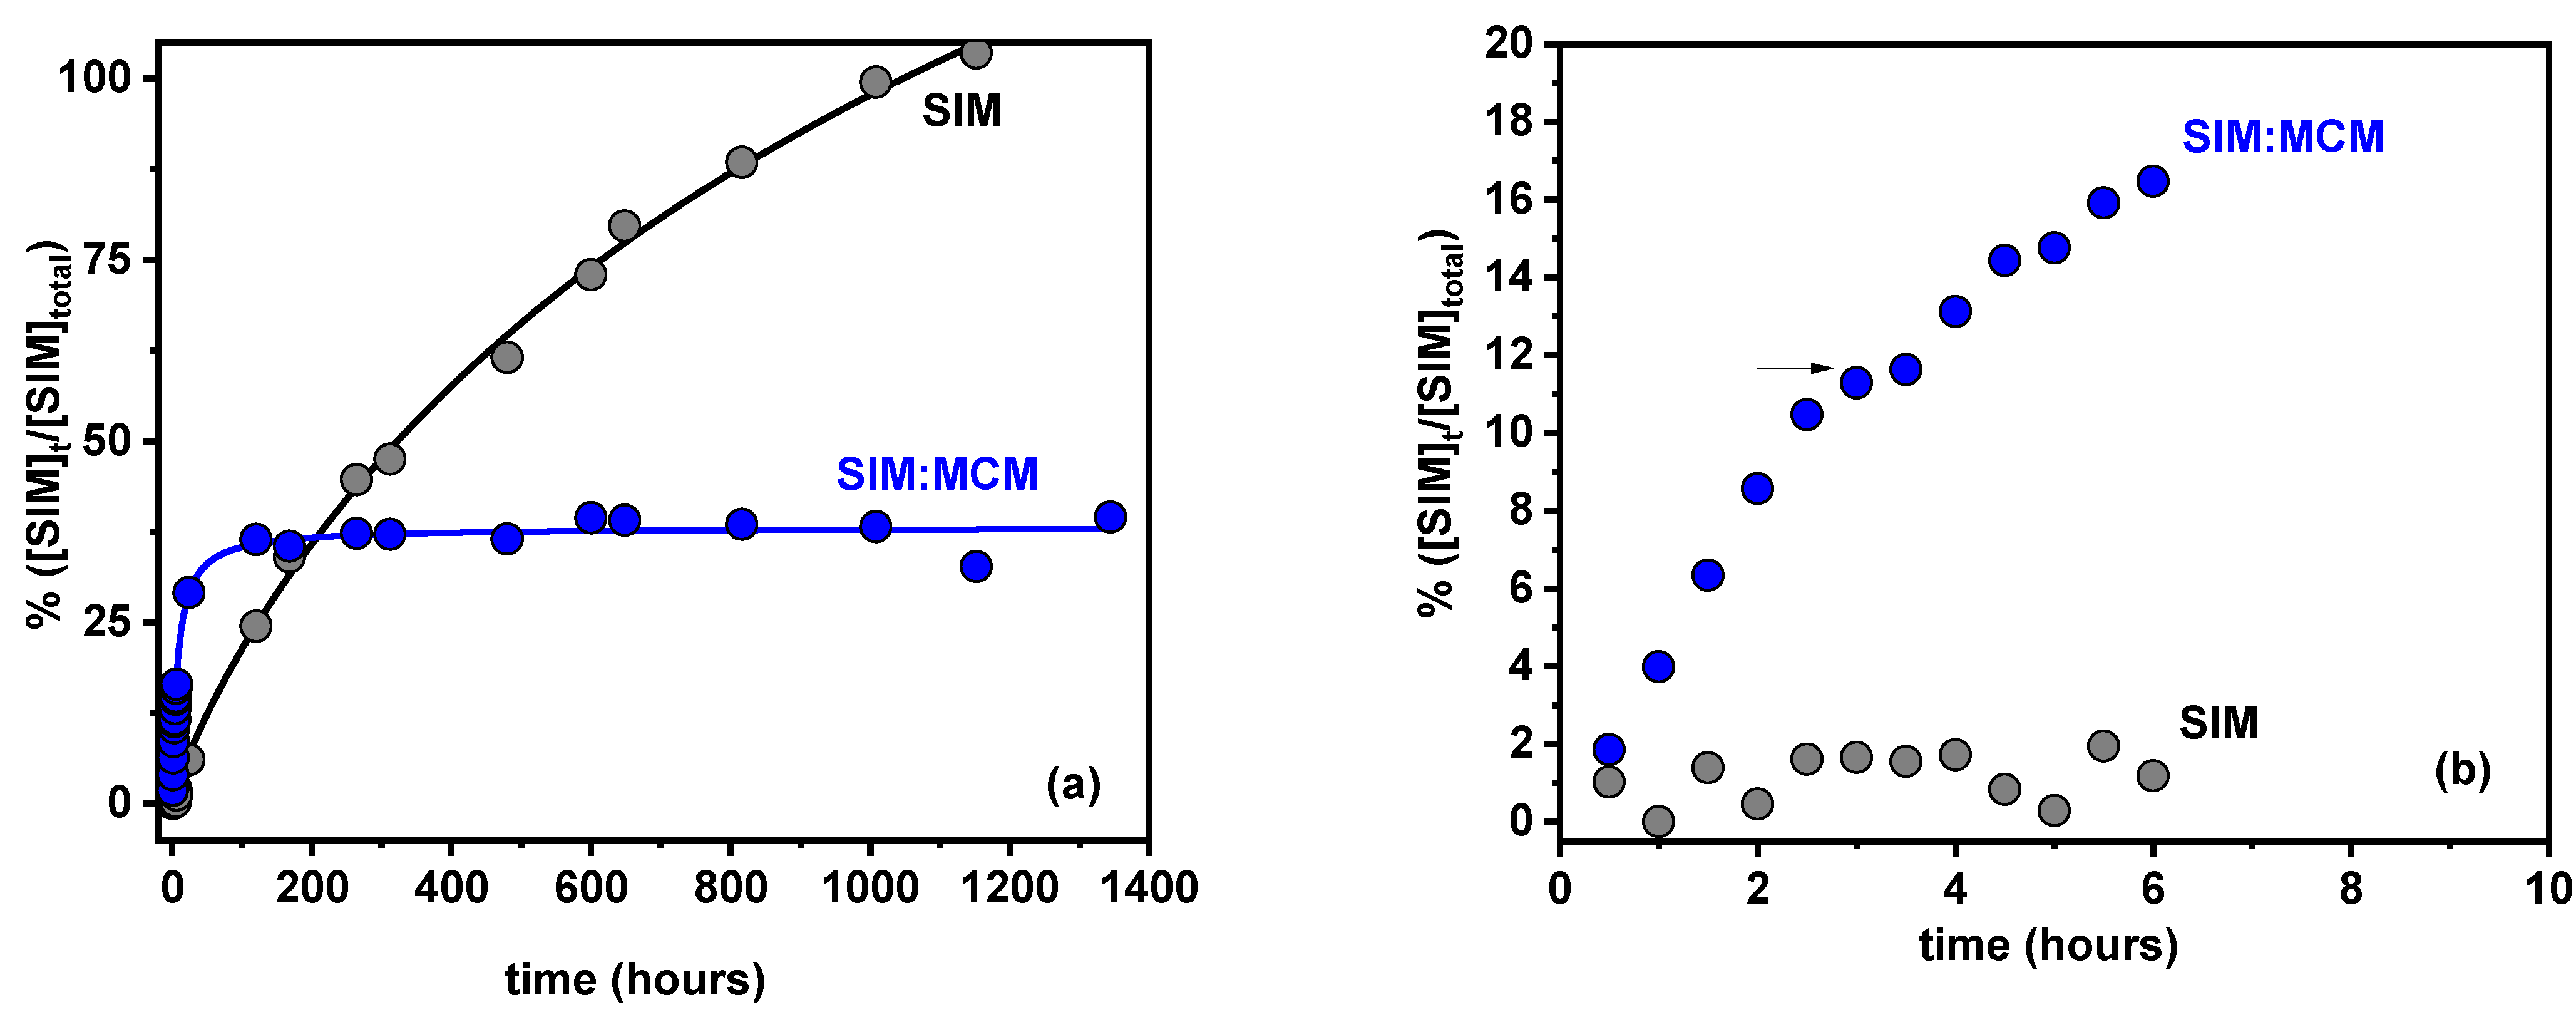
3.8. In Vitro Drug Release Studies
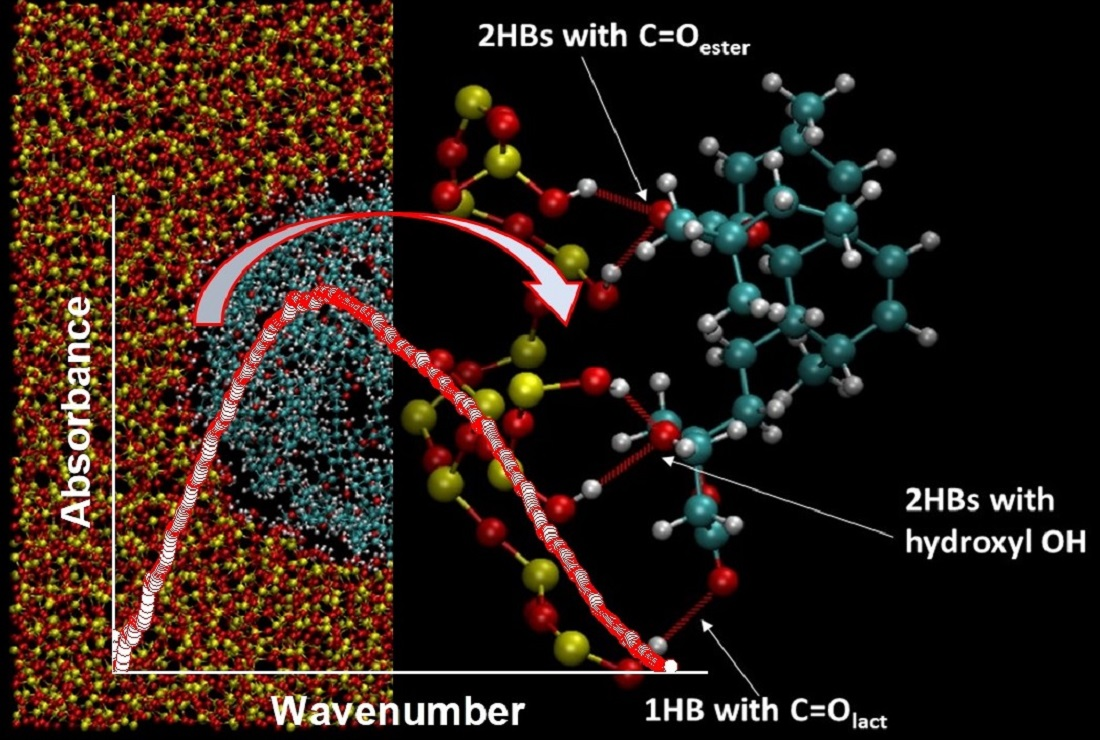
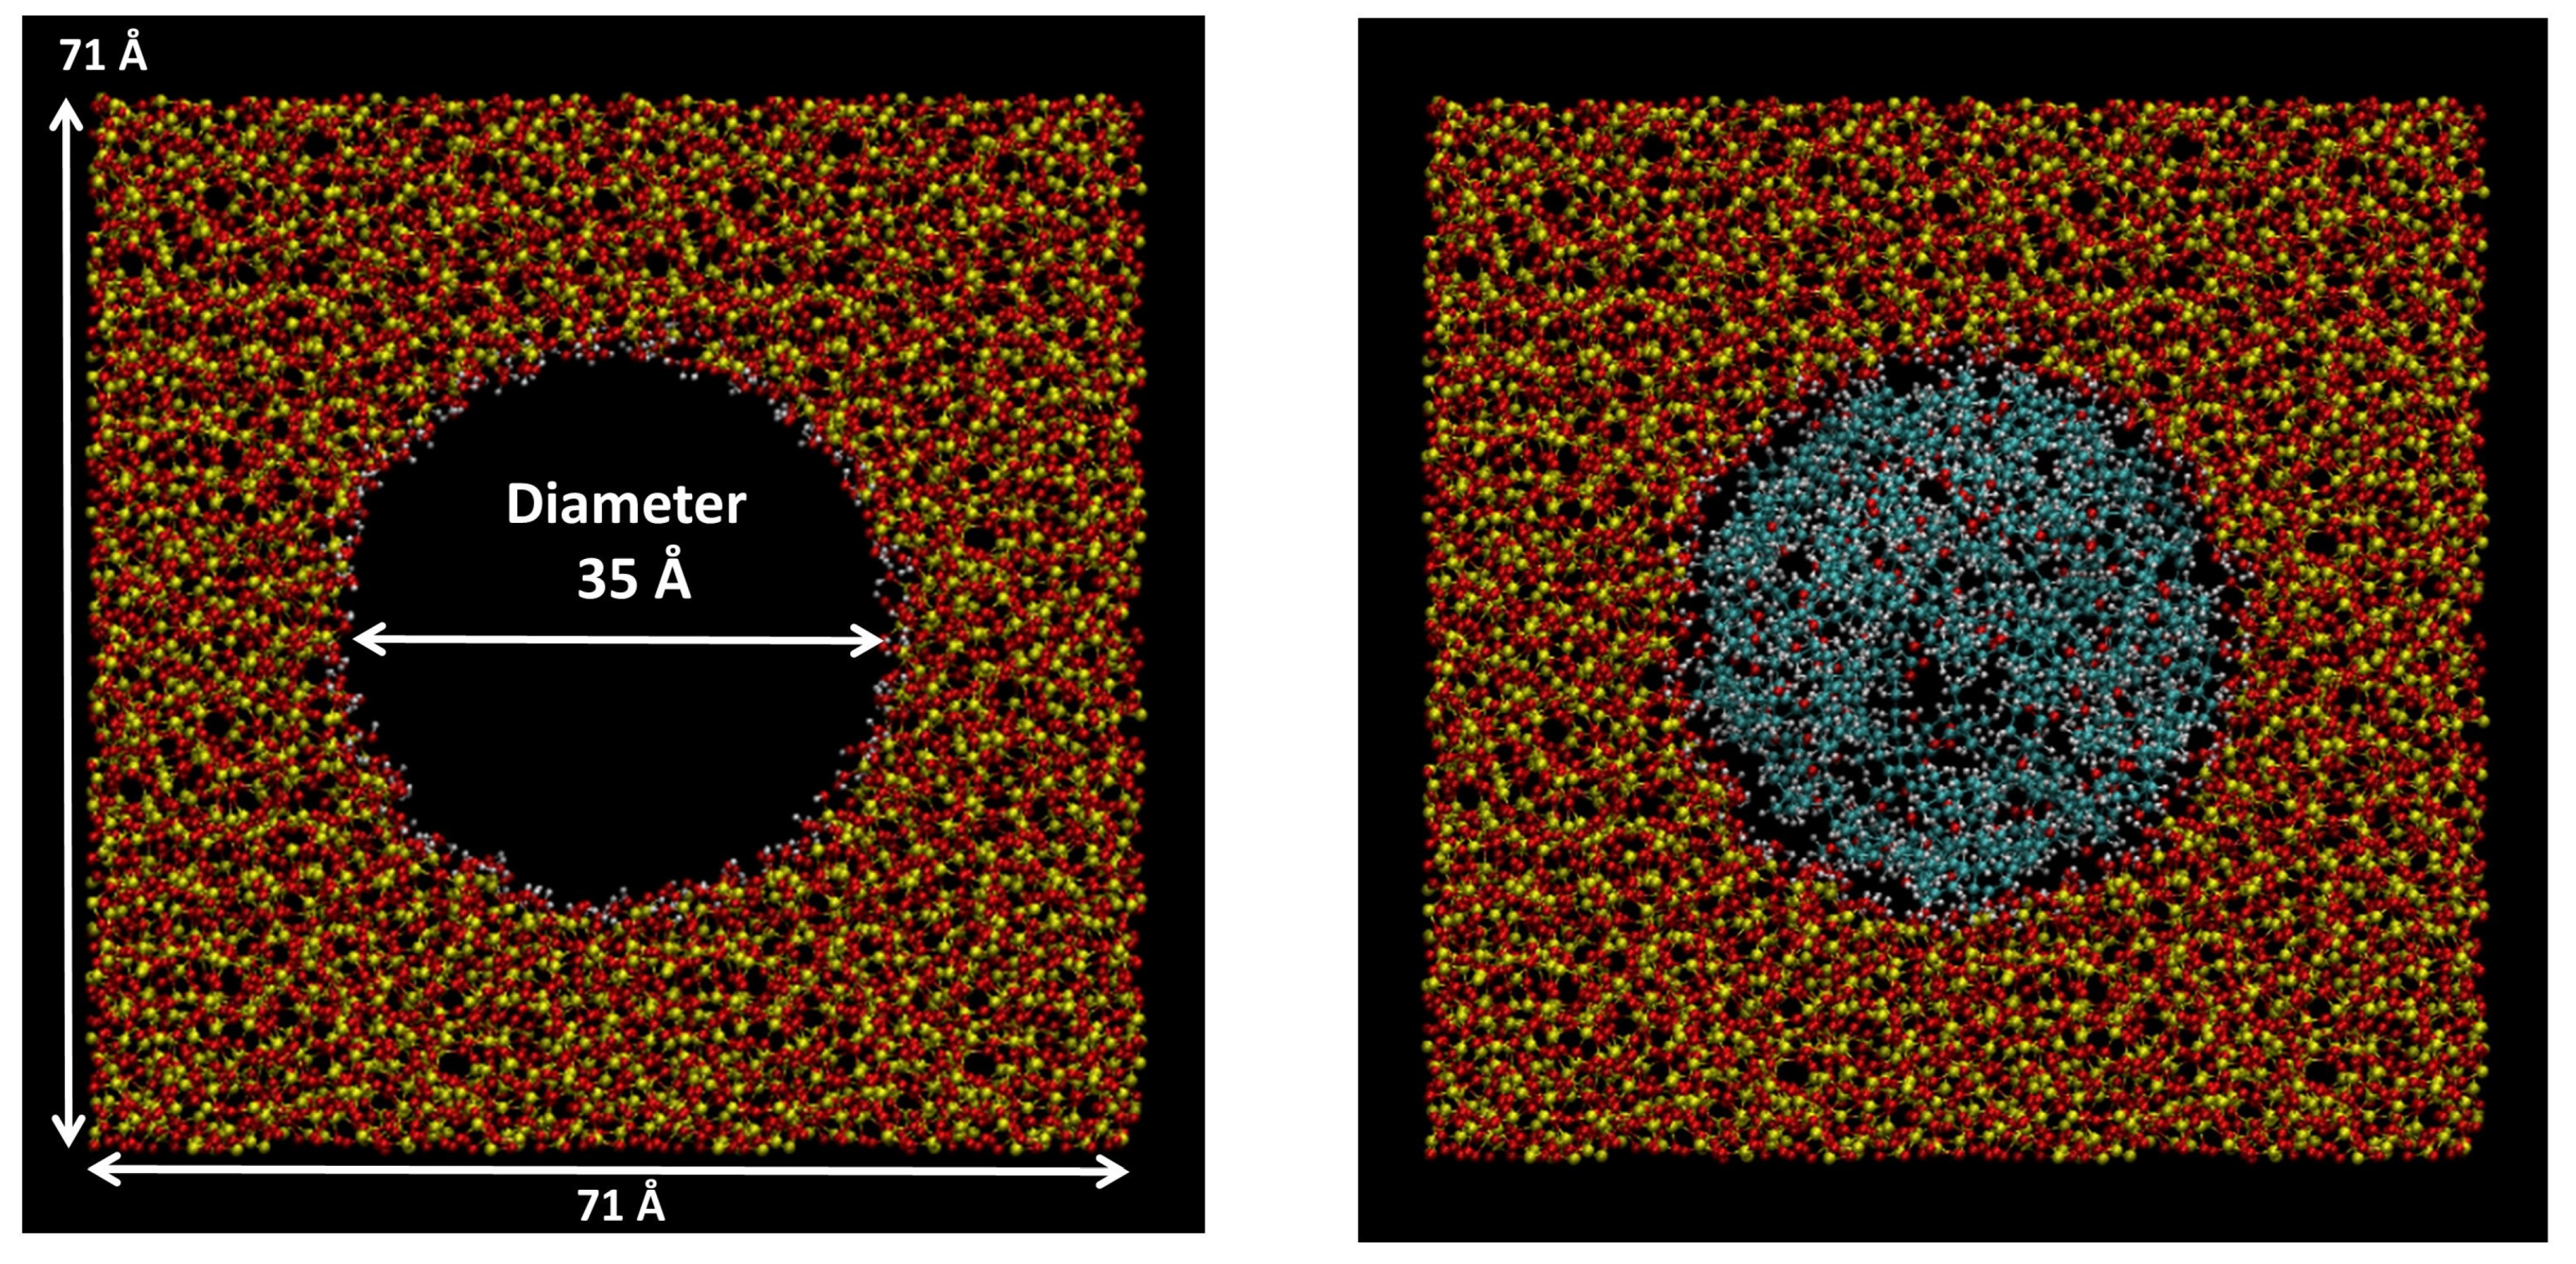
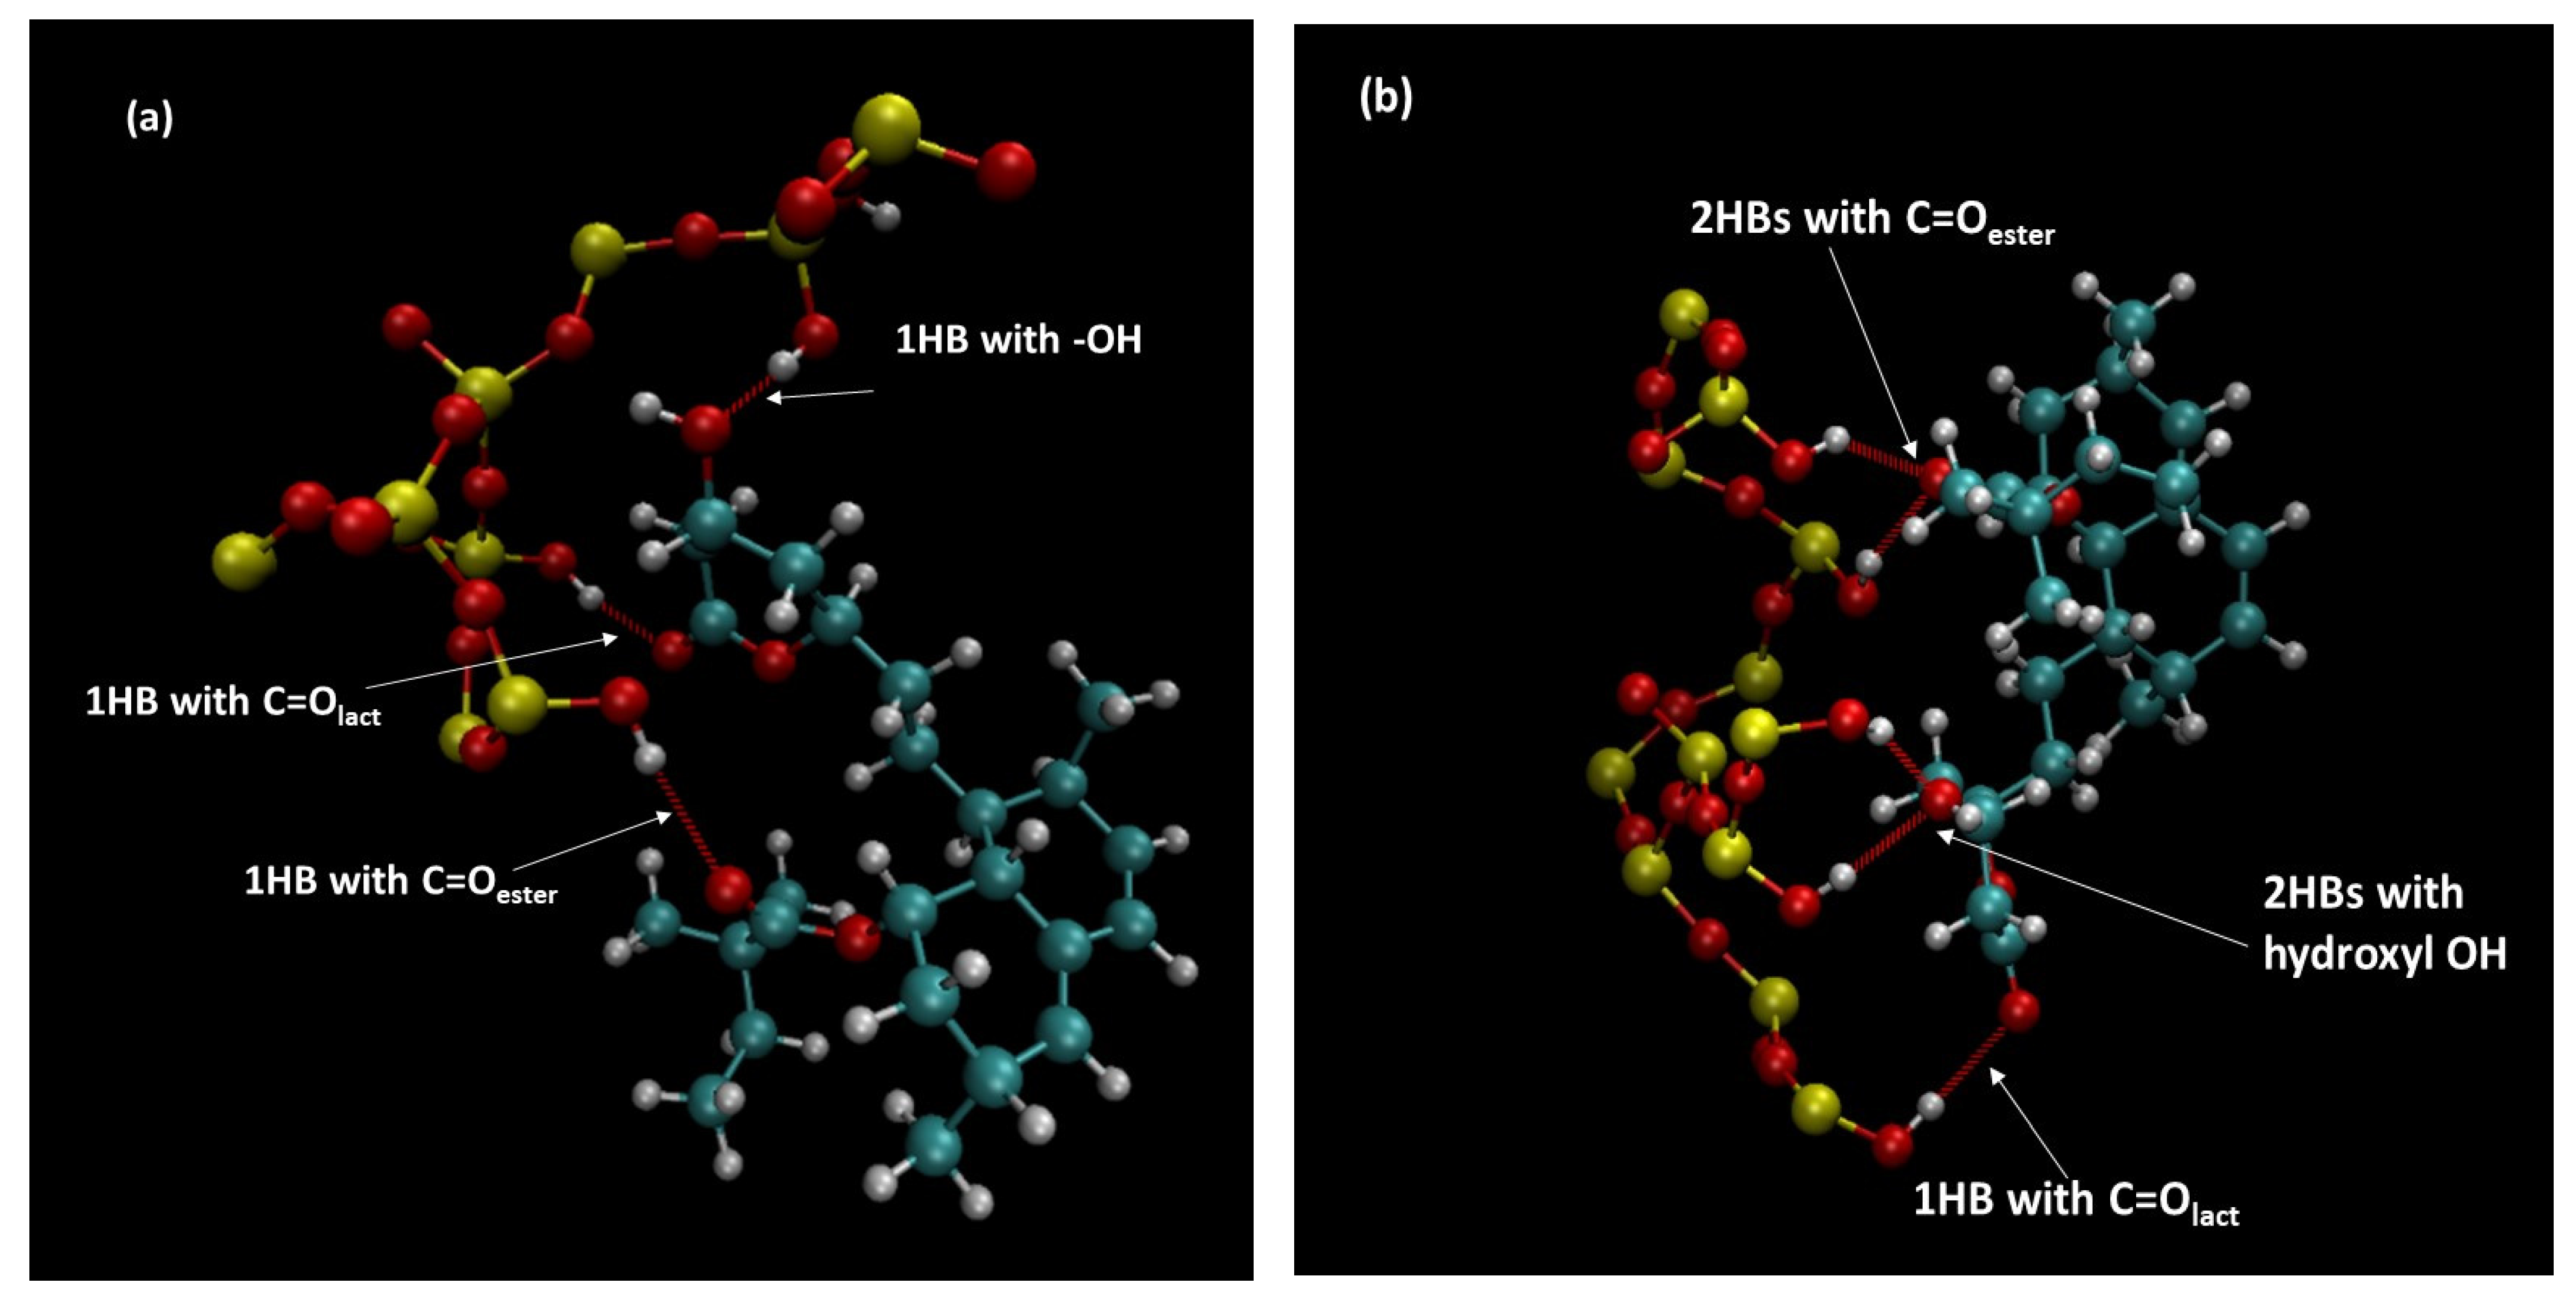
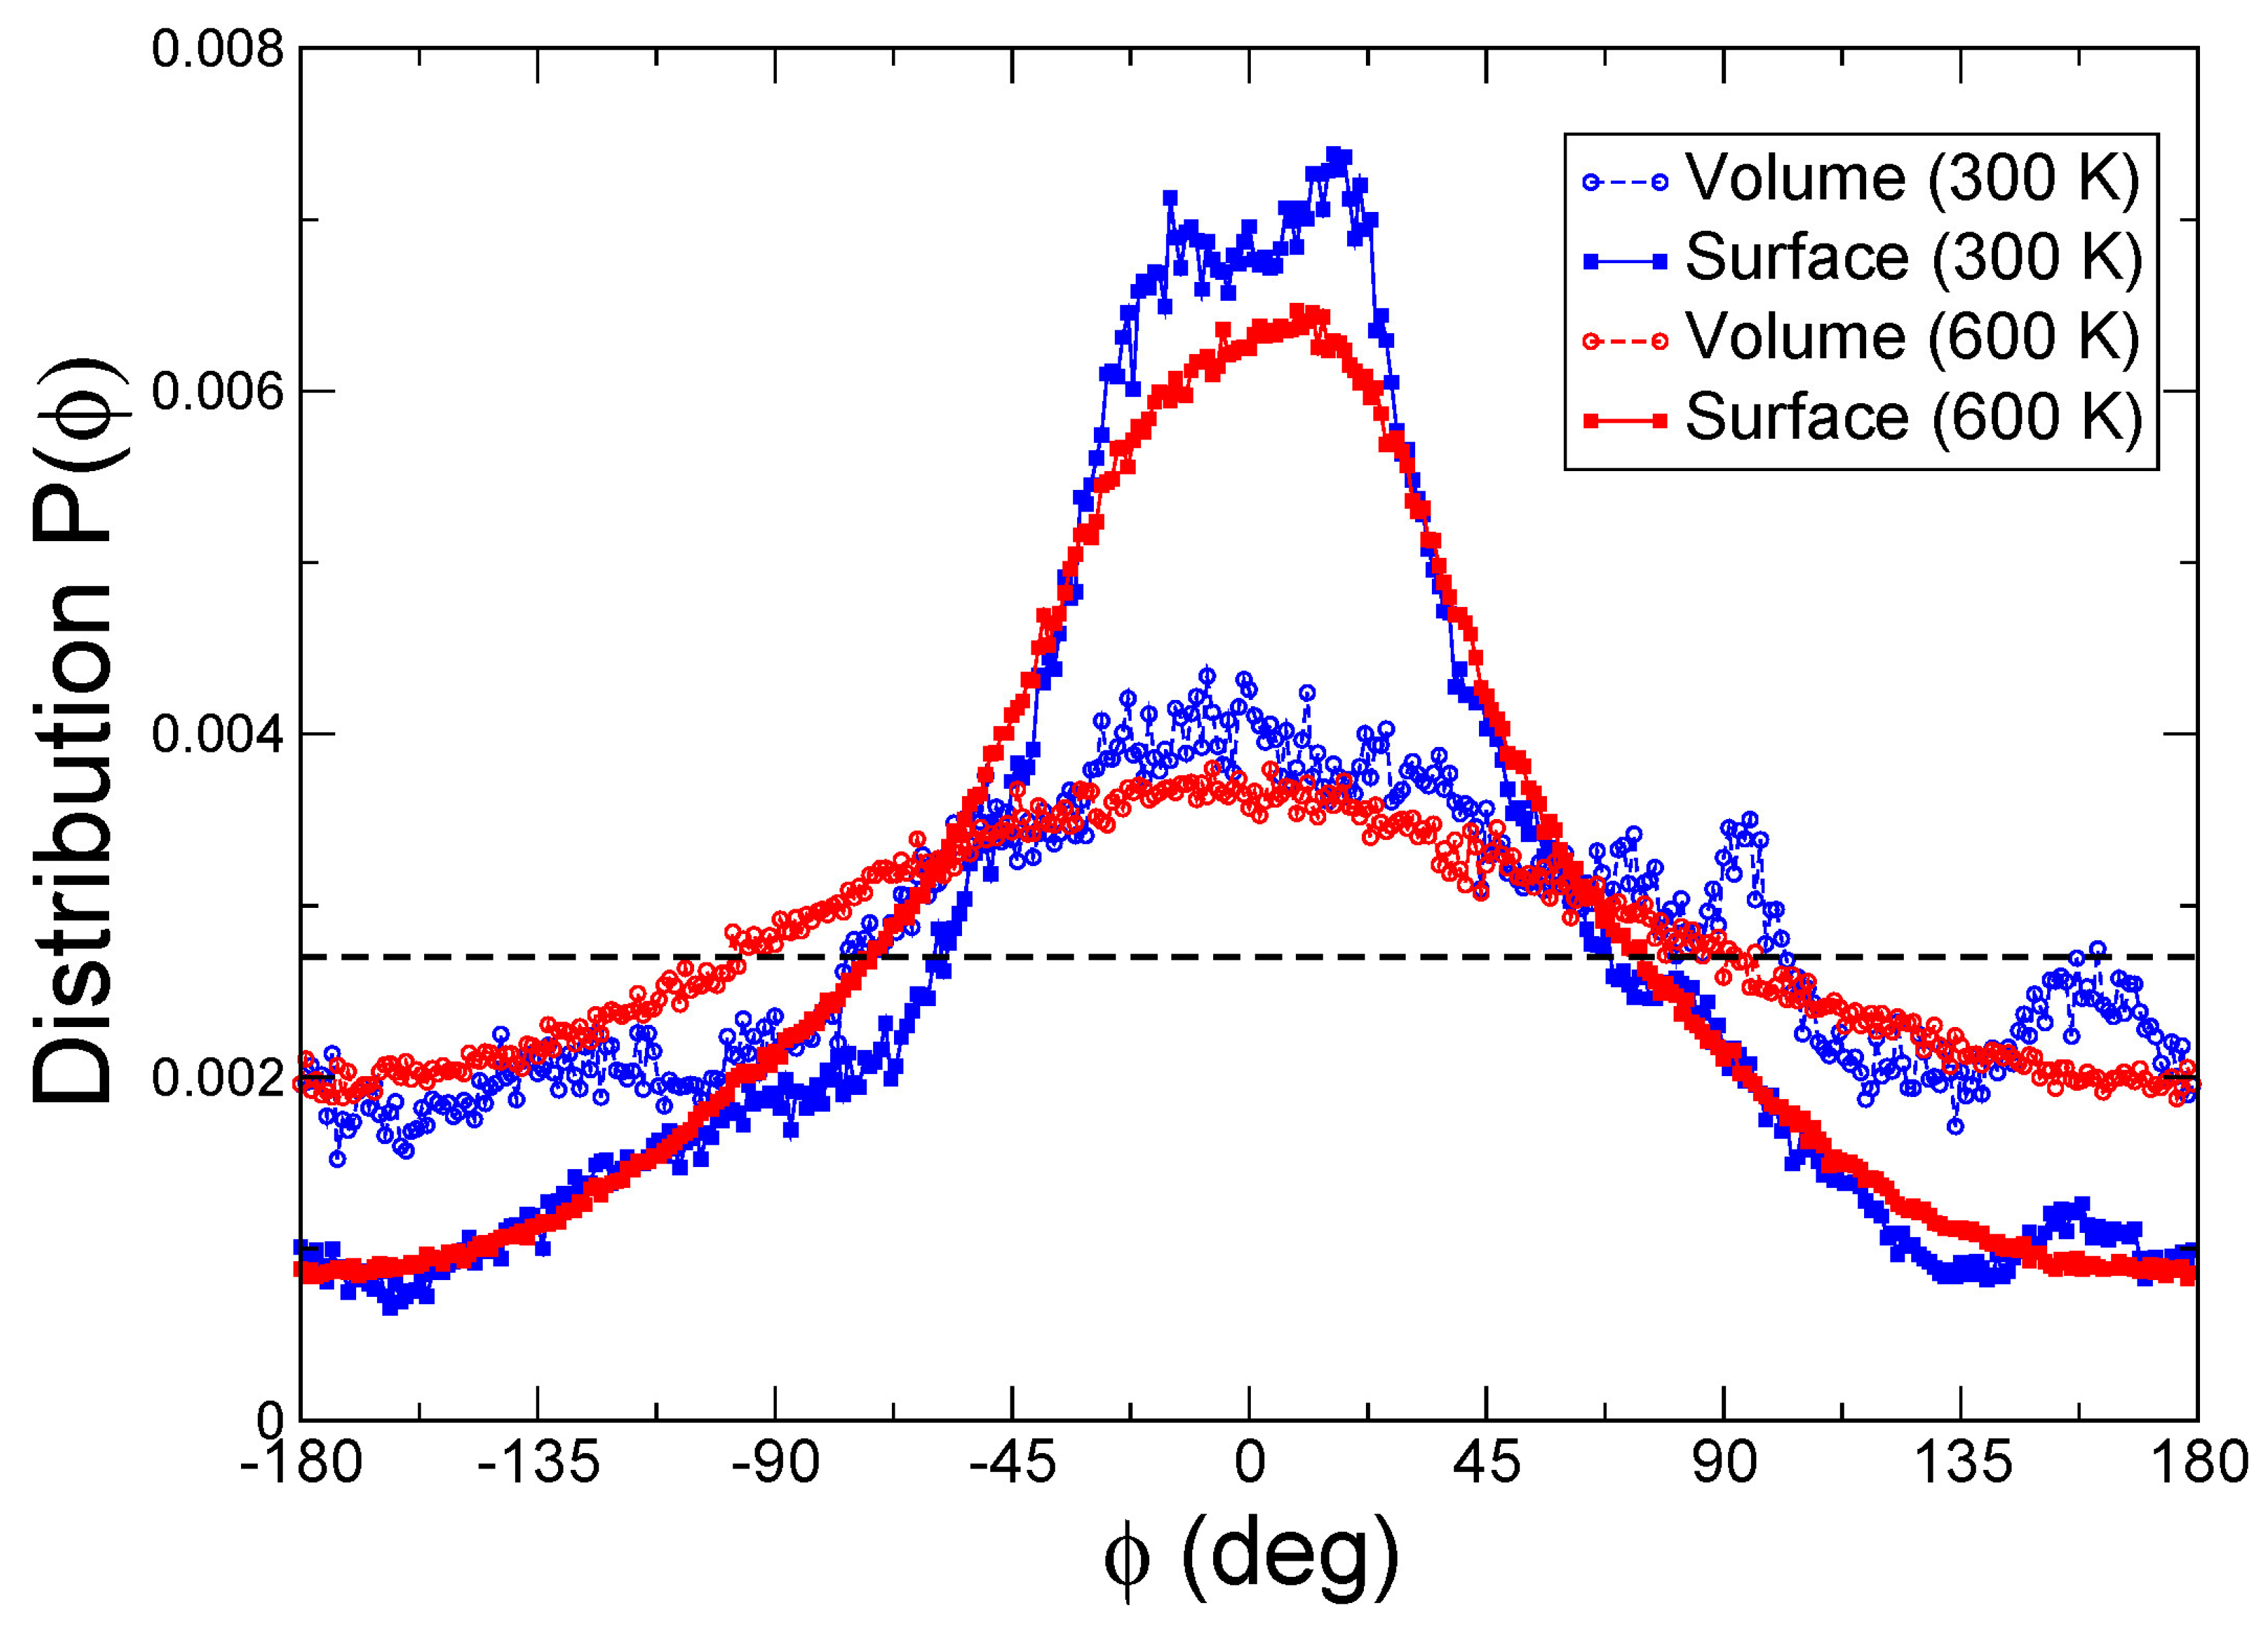
3.9. Molecular Dynamics Simulations
4. Conclusions
Author Contributions
Funding
Institutional Review Board Statement
Informed Consent Statement
Data Availability Statement
Acknowledgments
Conflicts of Interest
Appendix A
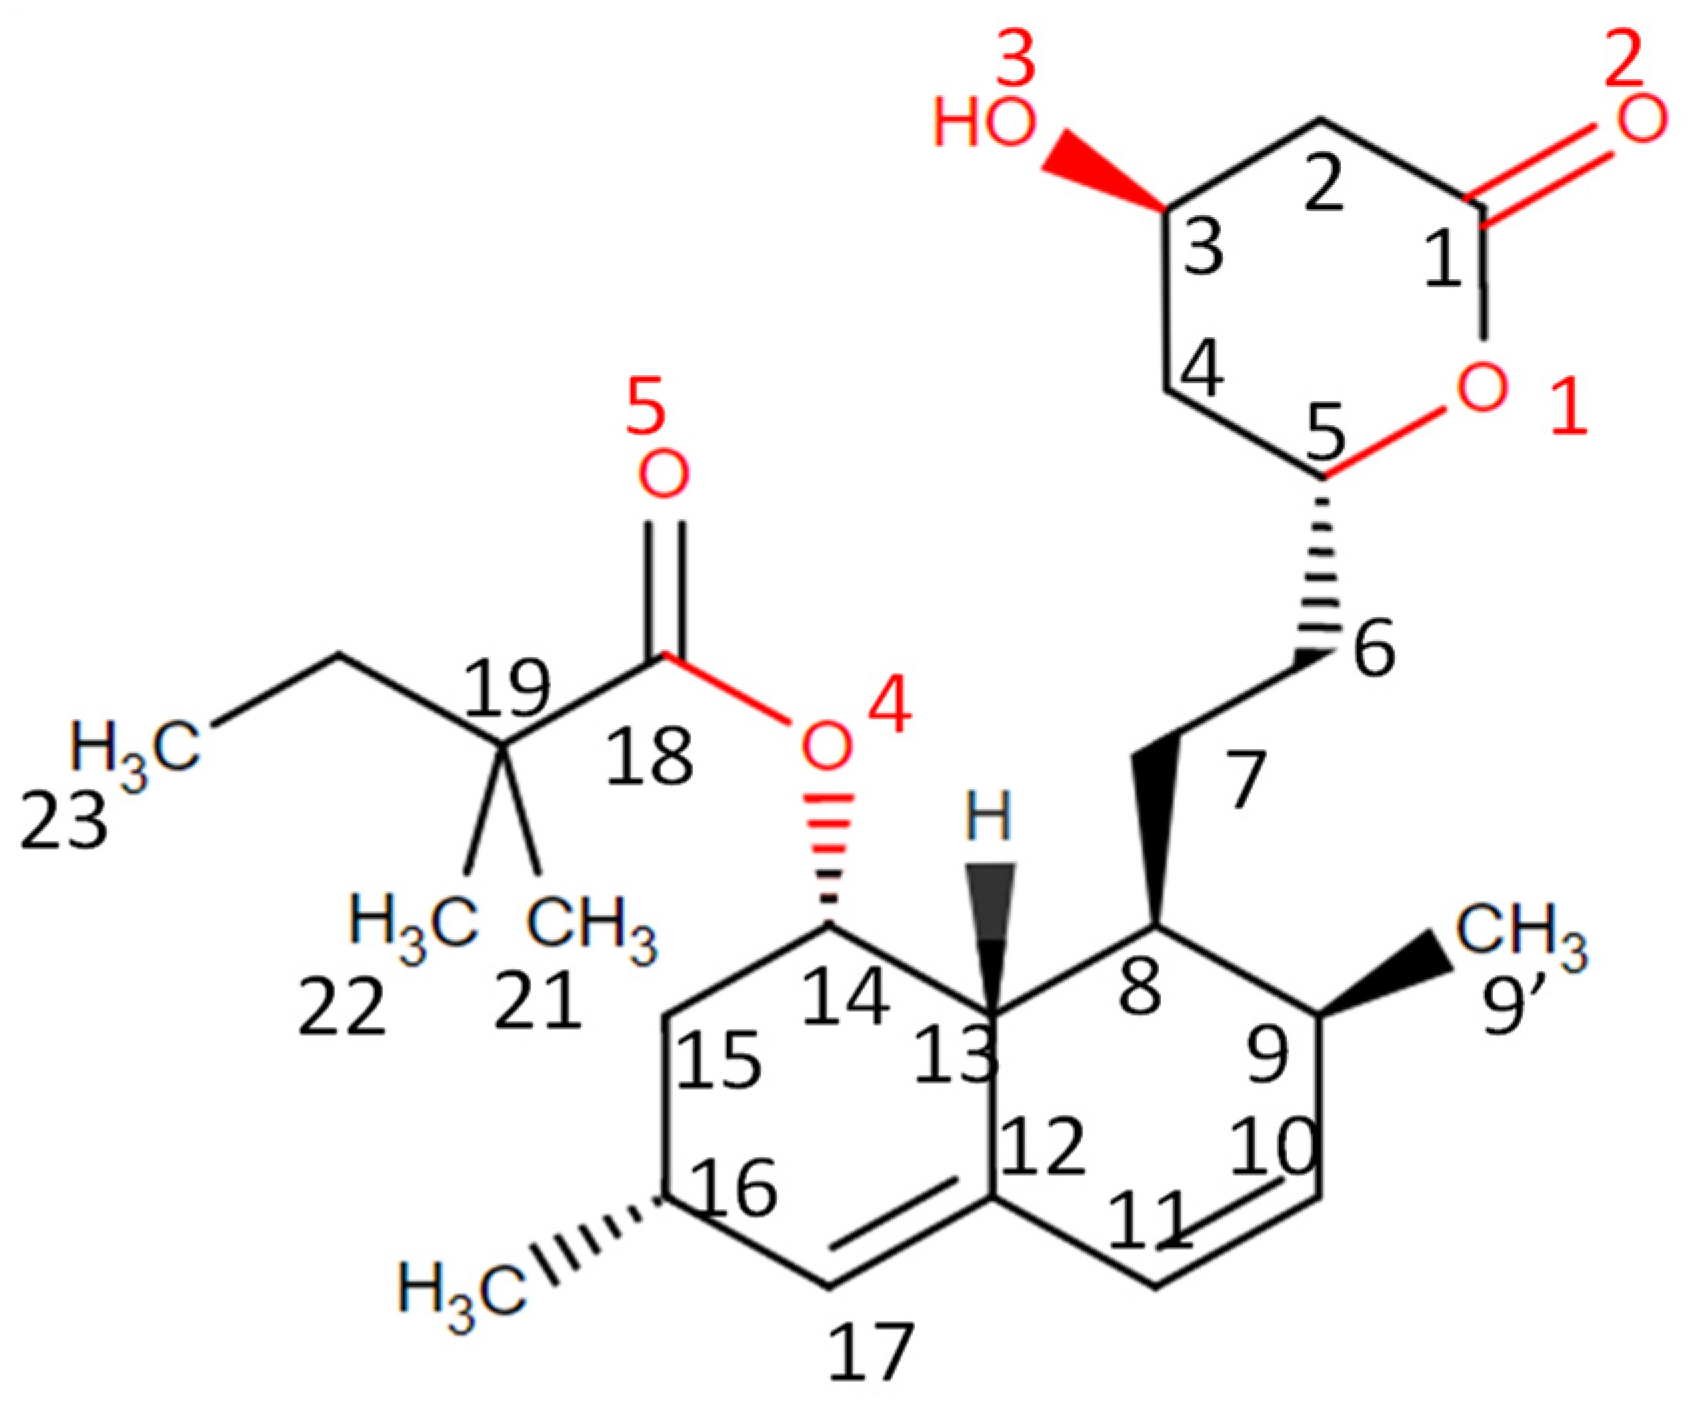
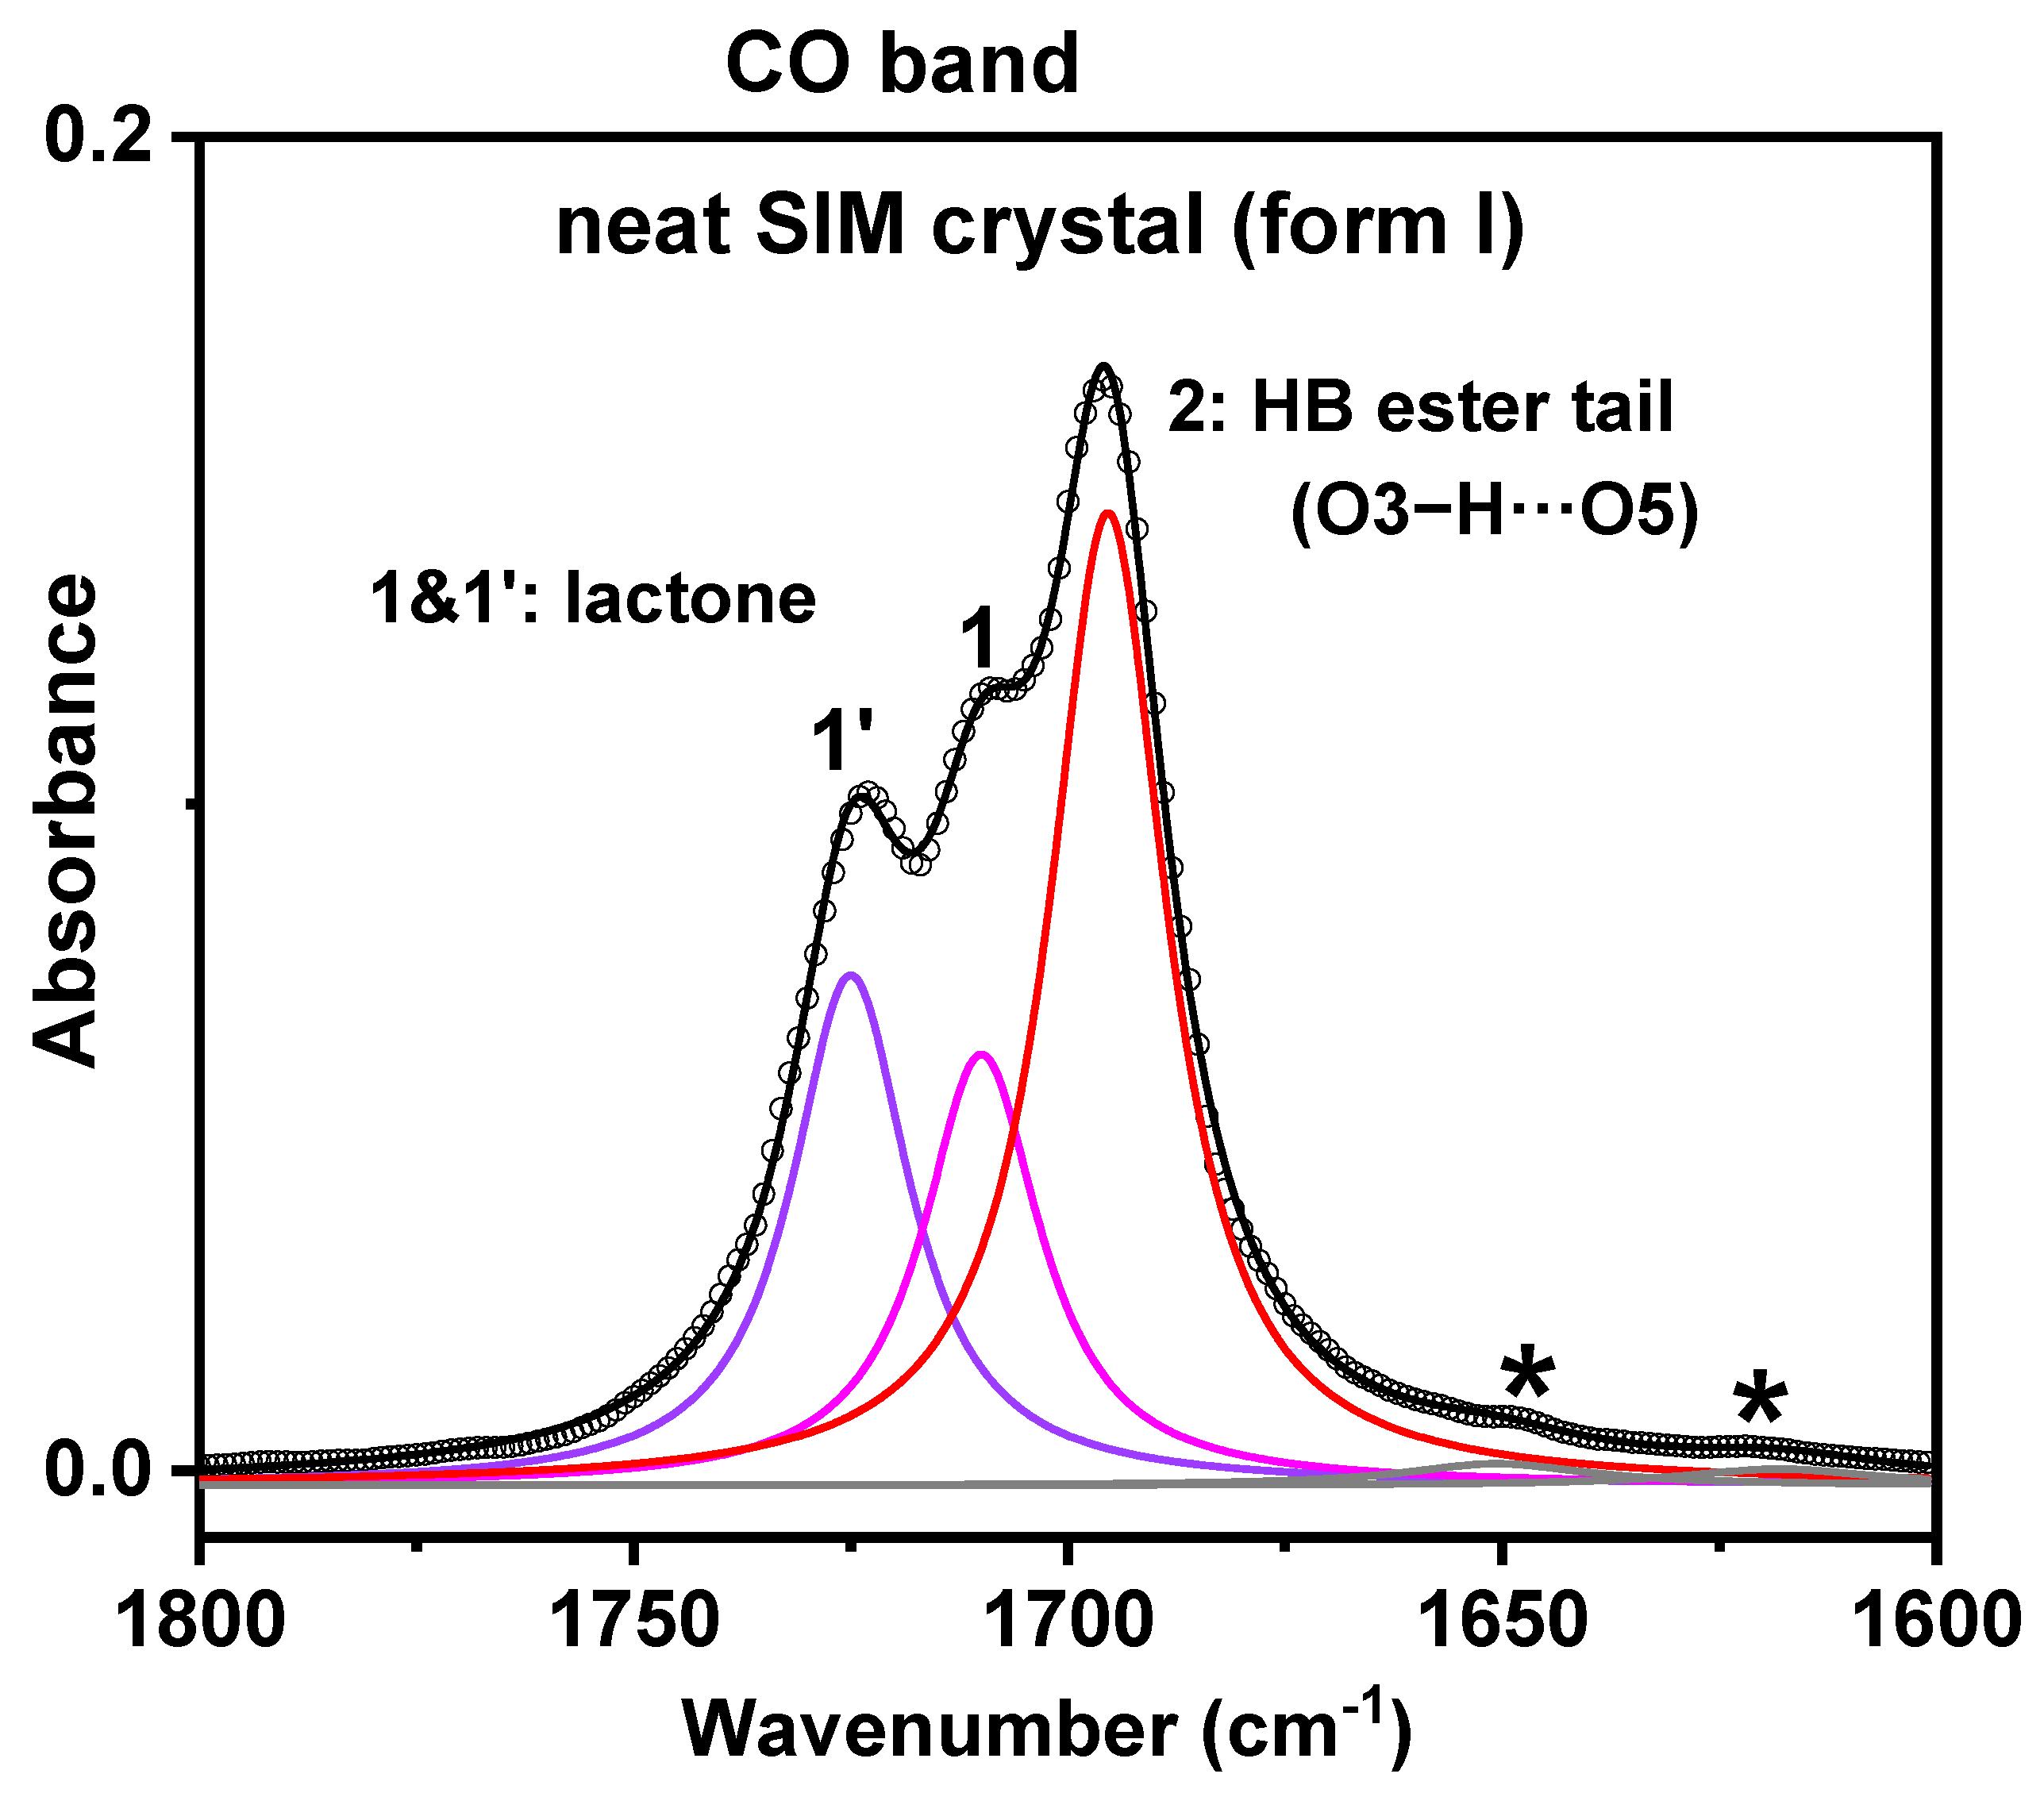
- FTIR results


| Peak | Neat SIM Crystal | |
|---|---|---|
| Max (Width) (cm−1) | A/Atotal (%) | |
| 1′ (C=Olact) | 1725 (16.5) | 47.7 |
| 1 (C=Olact) | 1710 (16.5) | |
| 2 (C=Oester) | 1695 (16.5) | 49.3 |
| * (C=C) | 1651 (26) | 3 |
| * (C=C) | 1618 (27) | |
- DSC results

- Dielectric results

References
- Kasim, N.A.; Whitehouse, M.; Ramachandran, C.; Bermejo, M.; Lennernäs, H.; Hussain, A.S.; Junginger, H.E.; Stavchansky, S.A.; Midha, K.K.; Shah, V.P.; et al. Molecular Properties of WHO Essential Drugs and Provisional Biopharmaceutical Classification. Mol. Pharm. 2004, 1, 85–96. [Google Scholar] [CrossRef]
- DrugStats Database ClinCalc DrugStats Database. Available online: https://clincalc.com/DrugStats/ (accessed on 26 March 2023).
- Ellison, D.K.; Moore, W.D.; Petts, C.R. Simvastatin. In Analytical Profiles of Drug Substances and Excipients; Brittain, H.G., Ed.; Elsevier: Amsterdam, The Netherlands, 1993; pp. 359–388. [Google Scholar]
- Shitara, Y.; Sugiyama, Y. Pharmacokinetic and Pharmacodynamic Alterations of 3-Hydroxy-3-Methylglutaryl Coenzyme A (HMG-CoA) Reductase Inhibitors: Drug–Drug Interactions and Interindividual Differences in Transporter and Metabolic Enzyme Functions. Pharmacol. Ther. 2006, 112, 71–105. [Google Scholar] [CrossRef] [PubMed]
- Jiang, T.; Han, N.; Zhao, B.; Xie, Y.; Wang, S. Enhanced Dissolution Rate and Oral Bioavailability of Simvastatin Nanocrystal Prepared by Sonoprecipitation. Drug Dev. Ind. Pharm. 2012, 38, 1230–1239. [Google Scholar] [CrossRef]
- Serajuddin, A.T.M.; Ranadive, S.A.; Mahoney, E.M. Relative Lipophilicities, Solubilities, and Structure–Pharmacological Considerations of 3-Hydroxy-3-Methylglutaryl-Coenzyme A (HMG-CoA) Reductase Inhibitors Pravastatin, Lovastatin, Mevastatin, and Simvastatin. J. Pharm. Sci. 1991, 80, 830–834. [Google Scholar] [CrossRef] [PubMed]
- Matsuyama, K.; Nakagawa, K.; Nakai, A.; Konishi, Y.; Nishikata, M.; Tanaka, H.; Uchida, T. Evaluation of Myopathy Risk for HMG-CoA Reductase Inhibitors by Urethane Infusion Method. Biol. Pharm. Bull. 2002, 25, 346–350. [Google Scholar] [CrossRef] [PubMed]
- Jun, S.W.; Kim, M.-S.; Kim, J.-S.; Park, H.J.; Lee, S.; Woo, J.-S.; Hwang, S.-J. Preparation and Characterization of Simvastatin/Hydroxypropyl-β-Cyclodextrin Inclusion Complex Using Supercritical Antisolvent (SAS) Process. Eur. J. Pharm. Biopharm. 2007, 66, 413–421. [Google Scholar] [CrossRef] [PubMed]
- Amidon, G.L.; Lennernäs, H.; Shah, V.P.; Crison, J.R. A Theoretical Basis for a Biopharmaceutic Drug Classification: The Correlation of in Vitro Drug Product Dissolution and in Vivo Bioavailability. Pharm. Res. 1995, 12, 413–420. [Google Scholar] [CrossRef]
- Khadka, P.; Ro, J.; Kim, H.; Kim, I.; Kim, J.T.; Kim, H.; Cho, J.M.; Yun, G.; Lee, J. Pharmaceutical Particle Technologies: An Approach to Improve Drug Solubility, Dissolution and Bioavailability. Asian J. Pharm. Sci. 2014, 9, 304–316. [Google Scholar] [CrossRef]
- Crowley, P.J.; Martini, L.G. Formulation Design: New Drugs from Old. Drug Discov. Today Ther. Strateg. 2004, 1, 537–542. [Google Scholar] [CrossRef]
- Korani, S.; Bahrami, S.; Korani, M.; Banach, M.; Johnston, T.P.; Sahebkar, A. Parenteral Systems for Statin Delivery: A Review. Lipids Health Dis. 2019, 18, 193. [Google Scholar] [CrossRef]
- Zidan, A.S.; Hosny, K.M.; Ahmed, O.A.A.; Fahmy, U.A. Assessment of Simvastatin Niosomes for Pediatric Transdermal Drug Delivery. Drug Deliv. 2016, 23, 1536–1549. [Google Scholar] [CrossRef]
- Salem, H.F.; Kharshoum, R.M.; Abou-Taleb, H.A.; Farouk, H.O.; Zaki, R.M. Fabrication and Appraisal of Simvastatin via Tailored Niosomal Nanovesicles for Transdermal Delivery Enhancement: In Vitro and In Vivo Assessment. Pharmaceutics 2021, 13, 138. [Google Scholar] [CrossRef] [PubMed]
- Chavhan, S.; Joshi, G.; Petkar, K.; Sawant, K. Enhanced Bioavailability and Hypolipidemic Activity of Simvastatin Formulations by Particle Size Engineering: Physicochemical Aspects and in Vivo Investigations. Biochem. Eng. J. 2013, 79, 221–229. [Google Scholar] [CrossRef]
- Patel, J.K.; Sutariya, V.B. Micronisation of Simvastatin by the Supercritical Antisolvent Technique: In Vitro–in Vivo Evaluation. J. Microencapsul. 2015, 32, 193–200. [Google Scholar] [CrossRef] [PubMed]
- Padhye, S.G.; Nagarsenker, M.S. Simvastatin Solid Lipid Nanoparticles for Oral Delivery: Formulation Development and In Vivo Evaluation. Indian J. Pharm. Sci. 2013, 75, 591–598. [Google Scholar] [PubMed]
- Rao, M.; Mandage, Y.; Thanki, K.; Bhise, S. Dissolution Improvement of Simvastatin by Surface Solid Dispersion Technology. Dissolution Technol. 2010, 17, 27–34. [Google Scholar] [CrossRef]
- Pandya, P.; Gattani, S.; Jain, P.; Khirwal, L.; Surana, S. Co-Solvent Evaporation Method for Enhancement of Solubility and Dissolution Rate of Poorly Aqueous Soluble Drug Simvastatin: In Vitro–In Vivo Evaluation. AAPS PharmSciTech 2008, 9, 1247–1252. [Google Scholar] [CrossRef]
- Kang, B.K.; Lee, J.S.; Chon, S.K.; Jeong, S.Y.; Yuk, S.H.; Khang, G.; Lee, H.B.; Cho, S.H. Development of Self-Microemulsifying Drug Delivery Systems (SMEDDS) for Oral Bioavailability Enhancement of Simvastatin in Beagle Dogs. Int. J. Pharm. 2004, 274, 65–73. [Google Scholar] [CrossRef]
- Bannow, J.; Yorulmaz, Y.; Löbmann, K.; Müllertz, A.; Rades, T. Improving the Drug Load and in Vitro Performance of Supersaturated Self-Nanoemulsifying Drug Delivery Systems (Super-SNEDDS) Using Polymeric Precipitation Inhibitors. Int. J. Pharm. 2020, 575, 118960. [Google Scholar] [CrossRef]
- Craye, G.; Löbmann, K.; Grohganz, H.; Rades, T.; Laitinen, R. Characterization of Amorphous and Co-Amorphous Simvastatin Formulations Prepared by Spray Drying. Molecules 2015, 20, 21532–21548. [Google Scholar] [CrossRef]
- Redzuan Meor Mohd Affandi, M.M.; Tripathy, M.; Majeed, A.B.A. Arginine Complexes with Simvastatin: Apparent Solubility, In Vitro Dissolution and Solid State Characterization. Curr. Drug Deliv. 2018, 15, 77–86. [Google Scholar] [CrossRef]
- Ambike, A.A.; Mahadik, K.R.; Paradkar, A. Spray-Dried Amorphous Solid Dispersions of Simvastatin, a Low Tg Drug: In Vitro and in Vivo Evaluations. Pharm. Res. 2005, 22, 990–998. [Google Scholar] [CrossRef]
- Ambike, A.A.; Mahadik, K.R.; Paradkar, A. Physico-Chemical Characterization and Stability Study of Glassy Simvastatin. Drug Dev. Ind. Pharm. 2005, 31, 895–899. [Google Scholar] [CrossRef] [PubMed]
- Nunes, T.G.; Viciosa, M.T.; Correia, N.T.; Danède, F.; Nunes, R.G.; Diogo, H.P. A Stable Amorphous Statin: Solid-State NMR and Dielectric Studies on Dynamic Heterogeneity of Simvastatin. Mol. Pharm. 2014, 11, 727–737. [Google Scholar] [CrossRef]
- Graeser, K.A.; Strachan, C.J.; Patterson, J.E.; Gordon, K.C.; Rades, T. Physicochemical Properties and Stability of Two Differently Prepared Amorphous Forms of Simvastatin. Cryst. Growth Des. 2008, 8, 128–135. [Google Scholar] [CrossRef]
- Zhang, F.; Aaltonen, J.; Tian, F.; Saville, D.; Rades, T. Influence of Particle Size and Preparation Methods on the Physical and Chemical Stability of Amorphous Simvastatin. Eur. J. Pharm. Biopharm. 2009, 71, 64–70. [Google Scholar] [CrossRef] [PubMed]
- Modhave, D.; Saraf, I.; Karn, A.; Paudel, A. Understanding Concomitant Physical and Chemical Transformations of Simvastatin During Dry Ball Milling. AAPS PharmSciTech 2020, 21, 152. [Google Scholar] [CrossRef] [PubMed]
- Löbmann, K.; Strachan, C.; Grohganz, H.; Rades, T.; Korhonen, O.; Laitinen, R. Co-Amorphous Simvastatin and Glipizide Combinations Show Improved Physical Stability without Evidence of Intermolecular Interactions. Eur. J. Pharm. Biopharm. 2012, 81, 159–169. [Google Scholar] [CrossRef] [PubMed]
- Nandi, U.; Ajiboye, A.L.; Patel, P.; Douroumis, D.; Trivedi, V. Preparation of Solid Dispersions of Simvastatin and Soluplus Using a Single-Step Organic Solvent-Free Supercritical Fluid Process for the Drug Solubility and Dissolution Rate Enhancement. Pharmaceuticals 2021, 14, 846. [Google Scholar] [CrossRef] [PubMed]
- Xiao, J.; Wan, Y.; Yang, Z.; Huang, Y.; Yao, F.; Luo, H. Bioactive Glass Nanotube Scaffold with Well-Ordered Mesoporous Structure for Improved Bioactivity and Controlled Drug Delivery. J. Mater. Sci. Technol. 2019, 35, 1959–1965. [Google Scholar] [CrossRef]
- Song, K.; Tang, Z.; Song, Z.; Meng, S.; Yang, X.; Guo, H.; Zhu, Y.; Wang, X. Hyaluronic Acid-Functionalized Mesoporous Silica Nanoparticles Loading Simvastatin for Targeted Therapy of Atherosclerosis. Pharmaceutics 2022, 14, 1265. [Google Scholar] [CrossRef]
- Knapik-Kowalczuk, J.; Kramarczyk, D.; Chmiel, K.; Romanova, J.; Kawakami, K.; Paluch, M. Importance of Mesoporous Silica Particle Size in the Stabilization of Amorphous Pharmaceuticals—The Case of Simvastatin. Pharmaceutics 2020, 12, 384. [Google Scholar] [CrossRef]
- Inocêncio, S.; Cordeiro, T.; Matos, I.; Danède, F.; Sotomayor, J.C.; Fonseca, I.M.; Correia, N.T.; Corvo, M.C.; Dionísio, M. Ibuprofen Incorporated into Unmodified and Modified Mesoporous Silica: From Matrix Synthesis to Drug Release. Microporous Mesoporous Mater. 2021, 310, 110541. [Google Scholar] [CrossRef]
- Varache, M.; Bezverkhyy, I.; Saviot, L.; Bouyer, F.; Baras, F.; Bouyer, F. Optimization of MCM-41 Type Silica Nanoparticles for Biological Applications: Control of Size and Absence of Aggregation and Cell Cytotoxicity. J. Non. Cryst. Solids 2015, 408, 87–97. [Google Scholar] [CrossRef]
- Shevtsov, M.A.; Parr, M.A.; Ryzhov, V.A.; Zemtsova, E.G.; Arbenin, A.Y.; Ponomareva, A.N.; Smirnov, V.M.; Multhoff, G. Zero-Valent Fe Confined Mesoporous Silica Nanocarriers (Fe(0) @ MCM-41) for Targeting Experimental Orthotopic Glioma in Rats. Sci. Rep. 2016, 6, 29247. [Google Scholar] [CrossRef] [PubMed]
- Skwira, A.; Szewczyk, A.; Konopacka, A.; Górska, M.; Majda, D.; Sądej, R.; Prokopowicz, M. Silica-Polymer Composites as the Novel Antibiotic Delivery Systems for Bone Tissue Infection. Pharmaceutics 2019, 12, 28. [Google Scholar] [CrossRef]
- Alharthi, S.; Ziora, Z.M.; Janjua, T.; Popat, A.; Moyle, P.M. Formulation and Biological Evaluation of Mesoporous Silica Nanoparticles Loaded with Combinations of Sortase A Inhibitors and Antimicrobial Peptides. Pharmaceutics 2022, 14, 986. [Google Scholar] [CrossRef]
- D’Orey, P.; Cordeiro, T.; Lourenço, M.A.O.; Matos, I.; Danède, F.; Sotomayor, J.C.; Fonseca, I.M.; Ferreira, P.; Correia, N.T.; Dionísio, M. How Molecular Mobility, Physical State, and Drug Distribution Influence the Naproxen Release Profile from Different Mesoporous Silica Matrices. Mol. Pharm. 2021, 18, 898–914. [Google Scholar] [CrossRef]
- Schönhals, A.; Kremer, F. Theory of Dielectric Relaxation. In Broadband Dielectric Spectroscopy; Kremer, F., Schönhals, A., Eds.; Springer Berlin Heidelberg: Berlin/Heidelberg, Germany, 2003; pp. 1–33. [Google Scholar]
- Villarroel Rocha, J.; Barrera, D.; Sapag, K. Improvement in the Pore Size Distribution for Ordered Mesoporous Materials with Cylindrical and Spherical Pores Using the Kelvin Equation. Top. Catal. 2011, 54, 121–134. [Google Scholar] [CrossRef]
- Barrett, E.P.; Joyner, L.G.; Halenda, P.P. The Determination of Pore Volume and Area Distributions in Porous Substances. I. Computations from Nitrogen Isotherms. J. Am. Chem. Soc. 1951, 73, 373–380. [Google Scholar] [CrossRef]
- Simões, R.G.; Bernardes, C.E.S.; Joseph, A.; Piedade, M.F.M.; Kraus, W.; Emmerling, F.; Diogo, H.P.; Minas da Piedade, M.E. Polymorphism in Simvastatin: Twinning, Disorder, and Enantiotropic Phase Transitions. Mol. Pharm. 2018, 15, 5349–5360. [Google Scholar] [CrossRef] [PubMed]
- McCrum, N.; Williams, B.; Read, G. Anelastic and Dielectric Effects in Polymeric Solids; Wiley: New York, NY, USA, 1967; ISBN 978-0486667522. [Google Scholar]
- Smith, W.; Forester, T.R.; Todorov, I.T. The DL POLY Classic User Manual; 1.9; Daresbury Laboratory: Warrington, UK, 2012. [Google Scholar]
- Vink, R.L.C.; Barkema, G.T. Large Well-Relaxed Models of Vitreous Silica, Coordination Numbers, and Entropy. Phys. Rev. B 2003, 67, 245201. [Google Scholar] [CrossRef]
- Bródka, A.; Zerda, T.W. Properties of Liquid Acetone in Silica Pores: Molecular Dynamics Simulation. J. Chem. Phys. 1996, 104, 6319–6326. [Google Scholar] [CrossRef]
- Puibasset, J.; Pellenq, R.J.-M. Grand Canonical Monte Carlo Simulation Study of Water Structure on Hydrophilic Mesoporous and Plane Silica Substrates. J. Chem. Phys. 2003, 119, 9226–9232. [Google Scholar] [CrossRef]
- Busselez, R.; Lefort, R.; Ji, Q.; Affouard, F.; Morineau, D. Molecular Dynamics Simulation of Nanoconfined Glycerol. Phys. Chem. Chem. Phys. 2009, 11, 11127–11133. [Google Scholar] [CrossRef]
- Jorgensen, W.L.; Maxwell, D.S.; Tirado-Rives, J. Development and Testing of the OPLS All-Atom Force Field on Conformational Energetics and Properties of Organic Liquids. J. Am. Chem. Soc. 1996, 118, 11225–11236. [Google Scholar] [CrossRef]
- Costa, J.A.S.; de Jesus, R.A.; da Silva, C.M.P.; Romão, L.P.C. Efficient Adsorption of a Mixture of Polycyclic Aromatic Hydrocarbons (PAHs) by Si–MCM–41 Mesoporous Molecular Sieve. Powder Technol. 2017, 308, 434–441. [Google Scholar] [CrossRef]
- Azaïs, T.; Tourné-Péteilh, C.; Aussenac, F.; Baccile, N.; Coelho, C.; Devoisselle, J.-M.; Babonneau, F. Solid-State NMR Study of Ibuprofen Confined in MCM-41 Material. Chem. Mater. 2006, 18, 6382–6390. [Google Scholar] [CrossRef]
- Cheng, Y.-J.; Zhang, A.-Q.; Hu, J.-J.; He, F.; Zeng, X.; Zhang, X.-Z. Multifunctional Peptide-Amphiphile End-Capped Mesoporous Silica Nanoparticles for Tumor Targeting Drug Delivery. ACS Appl. Mater. Interfaces 2017, 9, 2093–2103. [Google Scholar] [CrossRef]
- Rahoui, N.; Jiang, B.; Hegazy, M.; Taloub, N.; Wang, Y.; Yu, M.; Huang, Y.D. Gold Modified Polydopamine Coated Mesoporous Silica Nano-Structures for Synergetic Chemo-Photothermal Effect. Colloids Surf. B Biointerfaces 2018, 171, 176–185. [Google Scholar] [CrossRef]
- Dressaire, E.; Sauret, A. Clogging of Microfluidic Systems. Soft Matter 2017, 13, 37–48. [Google Scholar] [CrossRef] [PubMed]
- Bouhid de Aguiar, I.; Schroën, K. Microfluidics Used as a Tool to Understand and Optimize Membrane Filtration Processes. Membranes 2020, 10, 316. [Google Scholar] [CrossRef] [PubMed]
- Čejka, J.; Kratochvíl, B.; Císařová, I.; Jegorov, A. Simvastatin. Acta Crystallogr. Sect. C Cryst. Struct. Commun. 2003, C59, o428–o430. [Google Scholar] [CrossRef]
- Hušák, M.; Kratochvíl, B.; Jegorov, A.; Brus, J.; Maixner, J.; Rohlíček, J. Simvastatin: Structure Solution of Two New Low-Temperature Phases from Synchrotron Powder Diffraction and ss-NMR. Struct. Chem. 2010, 21, 511–518. [Google Scholar] [CrossRef]
- Brus, J.; Jegorov, A. Through-Bonds and Through-Space Solid-State NMR Correlations at Natural Isotopic Abundance: Signal Assignment and Structural Study of Simvastatin. J. Phys. Chem. A 2004, 108, 3955–3964. [Google Scholar] [CrossRef]
- Silverstein, R.M.; Bassler, G.C.; Morril, T.C. Spectrometric Identification of Organic Compounds; John Wiley & Sons: New York, NY, USA, 1991; ISBN 0471 63404 2. [Google Scholar]
- Simões, R.G.; Bernardes, C.E.S.; Diogo, H.P.; Agapito, F.; Minas da Piedade, M.E. Energetics and Structure of Simvastatin. Mol. Pharm. 2013, 10, 2713–2722. [Google Scholar] [CrossRef]
- Kremer, F.; Huwe, A.; Schönhals, A.; Różański, S.A. Molecular Dynamics in Confining Space. In Broadband Dielectric Spectroscopy; Kremer, F., Schönhals, A., Eds.; Springer Berlin Heidelberg: Berlin/Heidelberg, Germany, 2003; pp. 171–224. [Google Scholar]
- Wübbenhorst, M.; Napolitano, S. Deviations from Bulk Glass Transition Dynamics of Small Molecule Glass Formers: Some Scenarios in Relation to the Dimensionality of the Confining Geometry. In Dynamics in geometrical confinement; Kremer, F., Ed.; Springer: Berlin/Heidelberg, Germany, 2014; pp. 247–277. [Google Scholar]
- Richert, R. Dynamics of Nanoconfined Supercooled Liquids. Annu. Rev. Phys. Chem. 2011, 62, 65–84. [Google Scholar] [CrossRef] [PubMed]
- Dionísio, M.; Correia, N.T.; Brás, A.R. Molecular Mobility and Phase Transformations of Several Low Molecular Weight Glass Formers Confined to Nanoporous Silica Matrices. In Dynamics in Geometrical Confinement; Kremer, F., Ed.; Springer: Berlin/Heidelberg, Germany, 2014; pp. 213–245. [Google Scholar]
- Steeman, P.A.M.; van Turnhout, J. Dielectric Properties of Inhomogeneous Media. In Broadband Dielectric Spectroscopy; Kremer, F., Schönhals, A., Eds.; Springer Berlin Heidelberg: Berlin/Heidelberg, Germany, 2003; pp. 495–522. [Google Scholar]
- Horstmann, R.; Hecht, L.; Kloth, S.; Vogel, M. Structural and Dynamical Properties of Liquids in Confinements: A Review of Molecular Dynamics Simulation Studies. Langmuir 2022, 38, 6506–6522. [Google Scholar] [CrossRef]
- Renou, R.; Szymczyk, A.; Ghoufi, A. Water Confinement in Nanoporous Silica Materials. J. Chem. Phys. 2014, 140, 044704. [Google Scholar] [CrossRef]


| Material | Surface Area (m2 g−1) | Total Pore Volume (cm3 g−1) | Pore Diameter (nm) |
|---|---|---|---|
| MCM-41 | 927.3 | 0.84 | 3.0 (a); 3.5 (b) |
| SIM:MCM | 34.73 | n.a. (c) | n.a. (c) |
Disclaimer/Publisher’s Note: The statements, opinions and data contained in all publications are solely those of the individual author(s) and contributor(s) and not of MDPI and/or the editor(s). MDPI and/or the editor(s) disclaim responsibility for any injury to people or property resulting from any ideas, methods, instructions or products referred to in the content. |
© 2023 by the authors. Licensee MDPI, Basel, Switzerland. This article is an open access article distributed under the terms and conditions of the Creative Commons Attribution (CC BY) license (https://creativecommons.org/licenses/by/4.0/).
Share and Cite
Cordeiro, T.; Matos, I.; Danède, F.; Sotomayor, J.C.; Fonseca, I.M.; Corvo, M.C.; Dionísio, M.; Viciosa, M.T.; Affouard, F.; Correia, N.T. Evidence of Strong Guest–Host Interactions in Simvastatin Loaded in Mesoporous Silica MCM-41. Pharmaceutics 2023, 15, 1320. https://doi.org/10.3390/pharmaceutics15051320
Cordeiro T, Matos I, Danède F, Sotomayor JC, Fonseca IM, Corvo MC, Dionísio M, Viciosa MT, Affouard F, Correia NT. Evidence of Strong Guest–Host Interactions in Simvastatin Loaded in Mesoporous Silica MCM-41. Pharmaceutics. 2023; 15(5):1320. https://doi.org/10.3390/pharmaceutics15051320
Chicago/Turabian StyleCordeiro, Teresa, Inês Matos, Florence Danède, João C. Sotomayor, Isabel M. Fonseca, Marta C. Corvo, Madalena Dionísio, María Teresa Viciosa, Frédéric Affouard, and Natália T. Correia. 2023. "Evidence of Strong Guest–Host Interactions in Simvastatin Loaded in Mesoporous Silica MCM-41" Pharmaceutics 15, no. 5: 1320. https://doi.org/10.3390/pharmaceutics15051320