Article

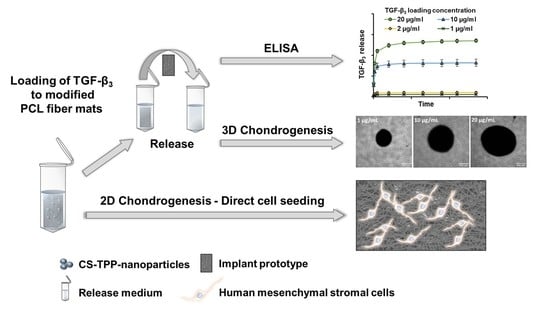
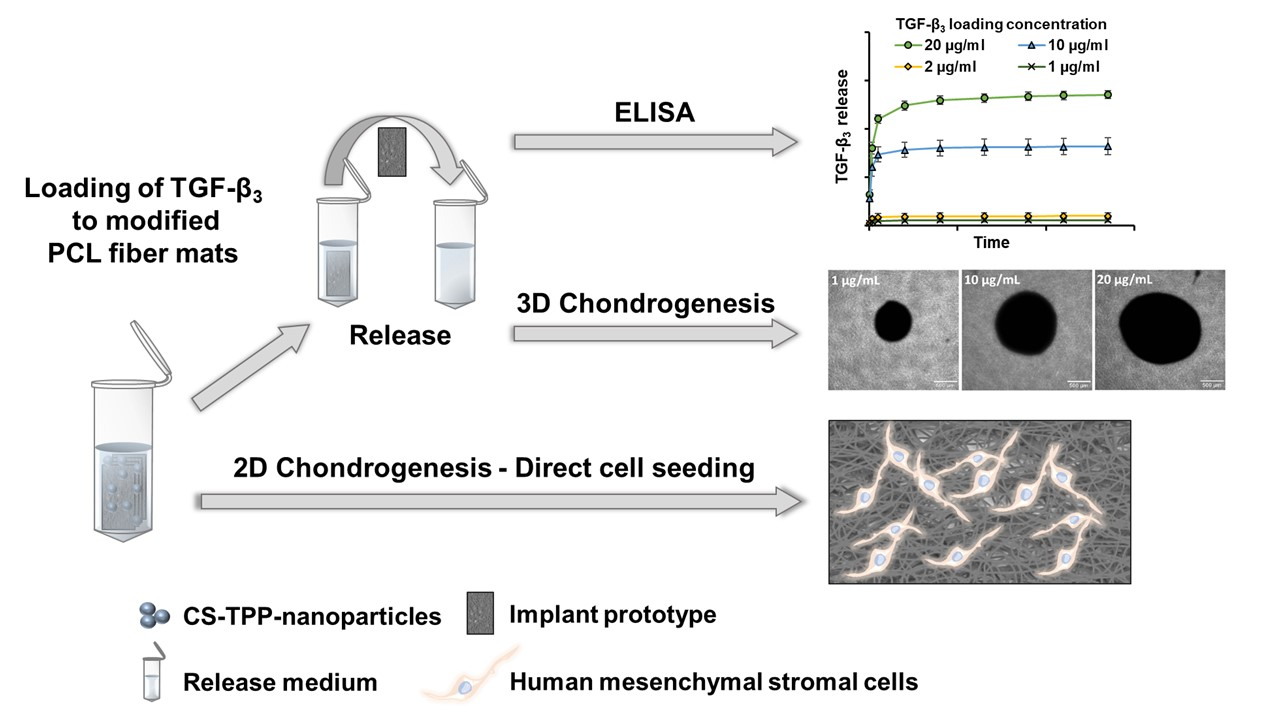
Release of TGF-β3 from Surface-Modified PCL Fiber Mats Triggers a Dose-Dependent Chondrogenic Differentiation of Human Mesenchymal Stromal Cells

by
Leonie Berten-Schunk
1,†,
Yvonne Roger
2,3,†,
Heike Bunjes
1,4,* and
Andrea Hoffmann
2,3,*
1
Technische Universität Braunschweig, Institut für Pharmazeutische Technologie und Biopharmazie, 38106 Braunschweig, Germany
2
Hannover Medical School, Department of Orthopedic Surgery, Graded Implants and Regenerative Strategies, Laboratory of Biomechanics and Biomaterials, 30625 Hannover, Germany
3
Niedersächsisches Zentrum für Biomedizintechnik, Implantatforschung und Entwicklung (NIFE), 30625 Hannover, Germany
4
Technische Universität Braunschweig, Zentrum für Pharmaverfahrenstechnik (PVZ), 38106 Braunschweig, Germany
*
Authors to whom correspondence should be addressed.
These authors contributed equally to this paper.
Pharmaceutics 2023, 15(4), 1303; https://doi.org/10.3390/pharmaceutics15041303
Submission received: 14 March 2023 / Revised: 7 April 2023 / Accepted: 18 April 2023 / Published: 21 April 2023
(This article belongs to the Special Issue Innovative Drug Delivery Systems for Regenerative Medicine)

Abstract

:
The design of implants for tissue transitions remains a major scientific challenge. This is due to gradients in characteristics that need to be restored. The rotator cuff in the shoulder, with its direct osteo-tendinous junction (enthesis), is a prime example of such a transition. Our approach towards an optimized implant for entheses is based on electrospun fiber mats of poly(ε-caprolactone) (PCL) as biodegradable scaffold material, loaded with biologically active factors. Chitosan/tripolyphosphate (CS/TPP) nanoparticles were used to load transforming growth factor-β3 (TGF-β3) with increasing loading concentrations for the regeneration of the cartilage zone within direct entheses. Release experiments were performed, and the concentration of TGF-β3 in the release medium was determined by ELISA. Chondrogenic differentiation of human mesenchymal stromal cells (MSCs) was analyzed in the presence of released TGF-β3. The amount of released TGF-β3 increased with the use of higher loading concentrations. This correlated with larger cell pellets and an increase in chondrogenic marker genes (SOX9, COL2A1, COMP). These data were further supported by an increase in the glycosaminoglycan (GAG)-to-DNA ratio of the cell pellets. The results demonstrate an increase in the total release of TGF-β3 by loading higher concentrations to the implant, which led to the desired biological effect.

Graphical Abstract

1. Introduction

With the improvement of health and living conditions, the life expectancy rises and the clinical need for therapy for degenerated tissues and organs increases rapidly, with a strong focus on musculoskeletal disorders [1,2]. One major clinical problem is tearing of the rotator cuff within any of the osteo-tendinous junctions of the respective muscles in the shoulder [3,4,5].
The use of cell-containing therapeutic systems for the regenerative treatment of such injuries involves several challenges. Critical aspects regarding the type, isolation or availability of cells, as well as the phenotypic stability, rejection reactions, risk of infection, malignant degenerations and requirements for clinical use and regulatory provisions, can cause high effort and costs. In a previous in vivo study, the regeneration of the entire articular joint surface without cell transplantation was demonstrated. Hence, cell-free approaches entail many advantages, which further include the exact definition of the ingredients of such systems and, thus, a simplified approval procedure [6,7]. Nevertheless, the anticipated mode of action of such cell-free systems needs to be confirmed in vitro or ex vivo.
The regeneration of tissues low in blood vessels and nerves, like cartilage, is still a complex ssue and currently results in scar or fibrotic tissue rather than in healthy functional tissue [8,9,10]. This leads to pain and even decreased functionality of the specific tissue [11]. In recent decades, cartilage regeneration has been the focus of numerous research projects with different approaches involving new biomaterials, stem cells and/or different cytokines. One possible approach is the use of different types of artificially produced scaffolds, which form the basis for the regeneration of tissues [12,13,14,15]. In various systems, growth factors are introduced into such scaffolds to promote migration, attachment and differentiation of stem cells [16,17,18]. However, none of these approaches was successful in the regeneration of functional cartilage, especially of hyaline cartilage, as in joints. Contrary to joint cartilage, the direct osteo-tendinous junctions of our bodies include a zone of fibrocartilage, which connects tendon to bone. Considering the fibrotic outcomes of many approaches, it might be more realistic to restore such a cartilage zone for biomedical purposes.
The transforming growth factor β (TGF-β) superfamily of multifunctional proteins consists of a variety of different proteins, such as bone morphogenetic protein 2 (BMP-2) and TGF-β isoforms, which are involved in many different processes such as growth, development and differentiation. While BMP-2 is known to induce osteogenesis, the TGF-β isoforms, especially TGF-β3, are one of the key players in the chondrogenic differentiation of mesenchymal stromal cells (MSCs) [19,20].
The current study contributes to the development of an innovative implant for the treatment of tears within tissue transitions in the rotator cuff. This implant is meant to be biodegradable and graded regarding various characteristics. The implant will be designed as a scaffold of PCL fibers [21], loaded with proteins. The proteins are selected based on their biological activity to recruit surrounding cells to the implant and to induce adequate differentiation in order to regenerate a natural tendon-to-bone transition. To avoid the rapid removal and degradation of the growth factors after implantation, the loading and binding of the protein on the fiber surface is an important step, which can be realized, e.g., by encapsulation into nanoparticles. This supports the transport and attachment of the proteins to the fiber surface and to tailor release kinetics [22,23]. In the present study, nanoparticles formed from chitosan (CS) and sodium tripolyphosphate (TPP) by ionotropic gelation serve as a loading system for TGF-β3. After the loading process, the nanoparticles transform into a layer coating on the fiber surface [24].
In preceding studies, we were able to demonstrate the cytocompatibility (evidenced by a survival rate of over 70%) of CS/TPP nanoparticles for human MSCs up to a concentration of to 625 μg/mL for surface-modified fiber mats and the successful release of TGF-β3 from CS/TPP nanoparticles. MSCs subjected to in vitro chondrogenic differentiation with a release medium containing TGF-β3 experienced three-dimensional pellet growth, generation of extracellular matrix, and chondrogenic marker gene expression [22,25]. However, these data do not allow the extrapolation of TGF-β3 release nor the confirmation of its biological activity when such nanoparticles are attached to a solid carrier material as a film. Therefore, in the present work, we focused on a range of loading concentrations of TGF-β3 in the nanoparticle suspension, determined the release from modified PCL fiber mats and studied the chondrogenic differentiation behavior of MSCs in vitro. With regard to the intended future in vivo tests of the implant prototype in small animals, we aimed to release a total dose of 125 ng TGF-β3 (minimal effective dose for small animal testing, MEDin vivo) according to the doses described in the literature (100–150 ng for a single subcutaneous administration to induce chondrogenesis) [26,27].

2. Materials and Methods

All chemicals were purchased from Sigma-Aldrich, Taufkirchen, Germany, unless otherwise stated. Human recombinant TGF-β3, derived from E. coli, was obtained from PeproTech, Hamburg, Germany. CS, with a degree of acetylation (DA) of 42%, was provided by the Institute for Technical Chemistry, Technische Universität Braunschweig, Braunschweig, Germany, and was produced by acetylation [28,29] of CS (Mn 190,000–310,000 g/mol) with a DA of 15-25%, purchased from Sigma-Aldrich. Sodium azide was purchased from Carl Roth, Darmstadt, Germany.

2.1. Implant Prototypes

The PCL fiber mats were provided by the Institute of Multiphase Processes, Leibniz Universität Hannover, Hannover, Germany. They were produced as described previously in an optimized electro-spinning process for non-aligned, randomly oriented fibers from PCL with a mean molecular weight of 80,000 g mol−1 dissolved with 17% in 2,2,2-trifluoroethanol [30].
After the electro-spinning process, the fiber mat surface was modified with a chitosan-grafted PCL (CS-g-PCL), and, subsequently, with alginate (called “modified fiber mat”), at the Institute for Technical Chemistry, Technische Universität Braunschweig, Braunschweig, Germany, as described by de Cassan et al. [22]. In short, a solution of a graft copolymer consisting of a chitosan backbone and poly(ε-caprolactone) sidechains was used to coat the fibers in order to achieve a positive surface charge. An additional coating from an alginate solution generated a negative charge.
These fiber mats were cut into pieces 16 × 8 mm in size, weighed with a microbalance (XS3DU, Mettler Toledo, Greifensee, Switzerland; for further information, see Section 2.5) and packed into sterilization pouches. The samples were electron-beam-sterilized with a radiation dose of 25 kGy by Mediscan, Kremsmünster, Austria.

2.2. Nanoparticle Preparation and Protein Loading

CS with a DA of 42% was added to 0.1% (v/v) acetic acid to a concentration of 1 mg/mL and stirred overnight at room temperature to ensure complete dissolution. A solution of TPP at 1 mg/mL was prepared in deionized water.
All of the following steps were executed in a biosafety cabinet under aseptic conditions. Before use, both, the CS and TPP solutions and deionized water were sterile-filtered with a 0.22 µm polyether sulfone filter. TGF-β3 was prepared by reconstitution of the lyophilized substance in sterile 10 mM citric acid to a concentration of 400 µg/mL. The required amount of protein was diluted with sterile 10 mM citric acid to the targeted concentration immediately before use.
Polypropylene low-binding tubes 2 mL in volume (Sorenson BioScience, Salt Lake City, UT, USA) were used for all following steps to avoid protein adsorption. Nanoparticle suspensions were prepared according to Roger et al. [25] by premixing 675 µL of CS solution with 100 µL of TGF-β3 solutions to obtain final TGF-β3 loading concentrations of 1, 2, 10 and 20 µg/mL. Subsequently, 225 µL of TPP solution was added and rapidly mixed by pipetting to form the nanoparticles within the loading suspension. A stack of four fiber mat samples was placed in each loading suspension and incubated for 20 min at room temperature. After repeated rinsing with 1 mL deionized water for 1 min (Figure 1), the fiber mat samples were separated into individual tubes and left to dry overnight at room temperature in the open tubes within the biosafety cabinet.

2.3. Particle Size and Zeta Potential Measurements

Particle sizes and zeta potentials were determined with the Zetasizer Nano ZS (Malvern Instruments, Worcestershire, United Kingdom). Freshly prepared CS/TPP-nanosuspensions, which had been produced in the same manner as for the loading of the fiber mats, were used without further dilution. The determination of the particle sizes was performed at 25 °C with an equilibration time of 180 s and 3 serial measurements with a duration of 300 s each. For zeta potential measurements, a disposable folded capillary cell, an equilibration time of 180 s and 30 runs in each measurement in a series of 3 were used. The results are given as the hydrodynamic diameters (z-average), polydispersity indices (PDI) and zeta potentials of the nanoparticles, as well as the standard deviation of the three serial measurements.

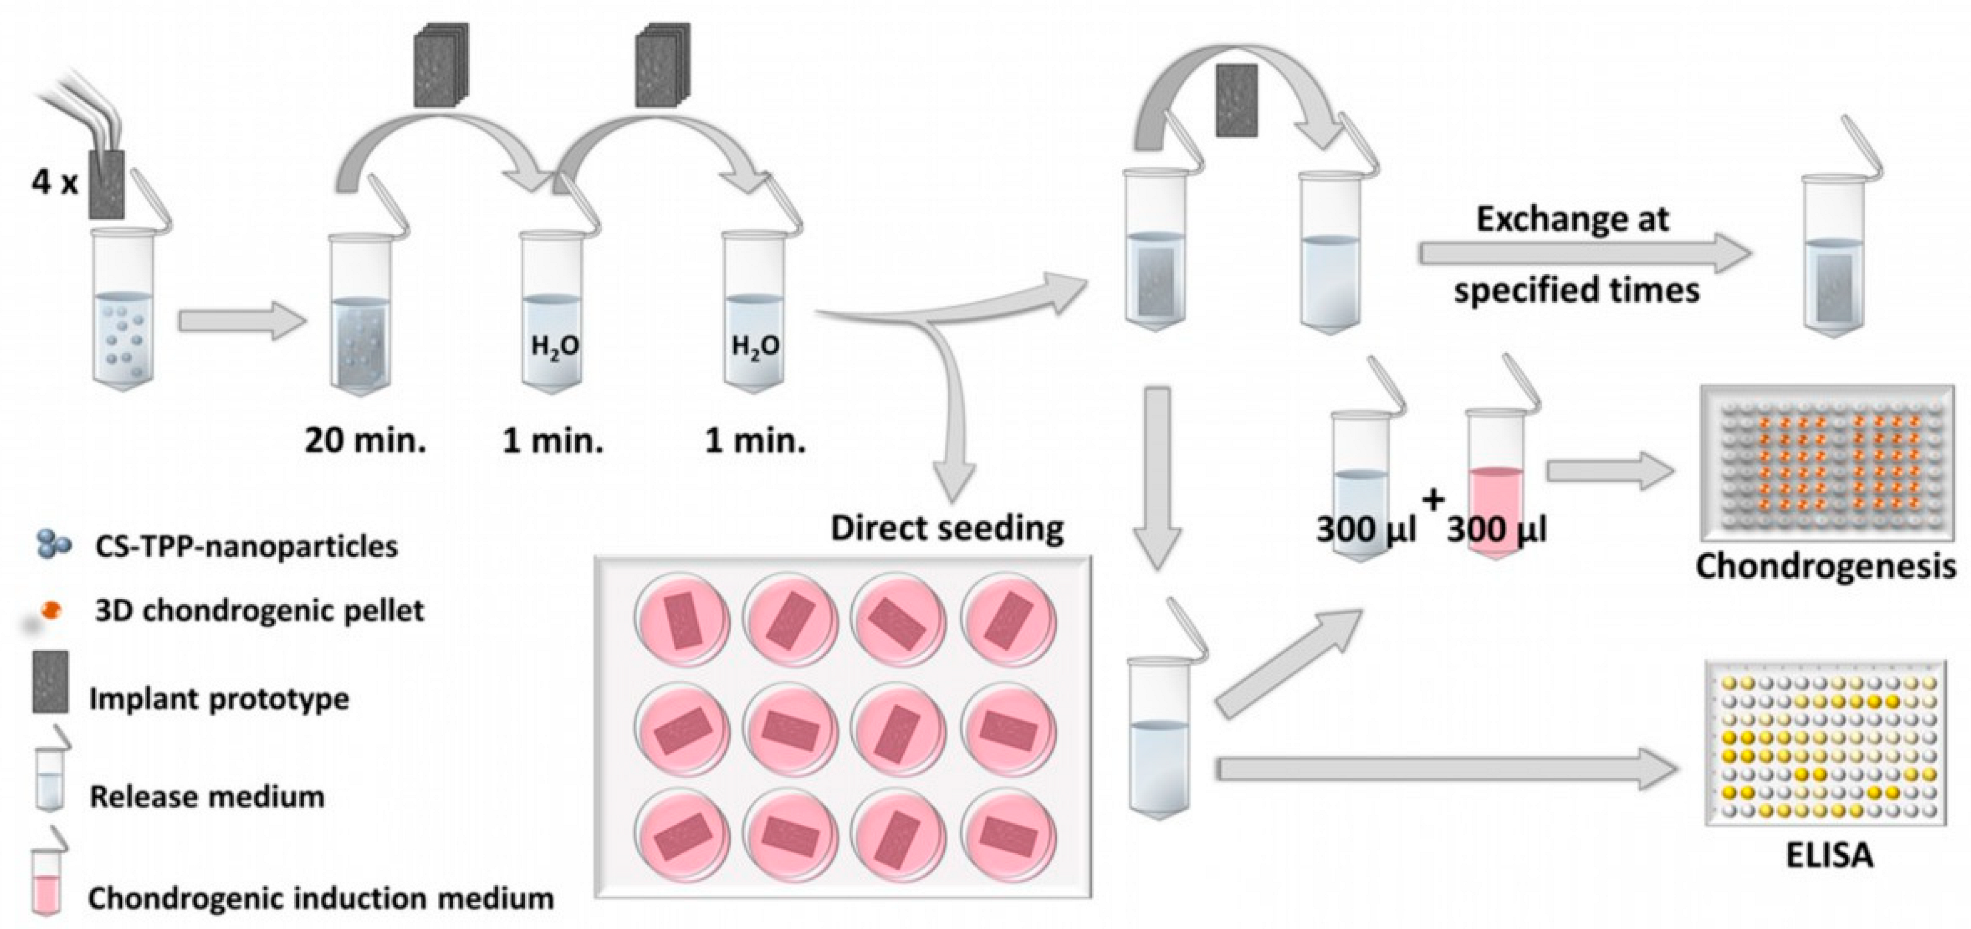
2.4. Release Experiments

The release experiments (4 fiber mat samples per loading concentration) with ELISA determination of the released TGF-β3 were performed in 2 mL polypropylene low-binding tubes (Sorenson BioScience, Salt Lake City, UT, USA) as well. The release medium was a mixture of phosphate-buffered saline (PBS, Peprotech composition), 0.1% (w/v) bovine serum albumin (BSA, heat shock fraction, pH 7, ≥98%) and 0.02% (w/v) sodium azide. The samples were placed individually in 1 mL release medium, and the sealed tubes were put into a climatic chamber at 37 °C. After 1 h, 8 h and 25 h, as well as after 4, 8, 13, 18, 22, 27 and 32 days, the release medium was replaced with fresh release medium (Figure 1). At each medium change, the fiber mat sample was removed from the medium and placed on a KIMTECH precision wipe to thoroughly soak off any embedded medium, thus avoiding carryover of already released protein into the fresh release medium.
A further, slightly modified release experiment was used to prepare the release samples for use in the cell culture (Figure 1, see Section 2.6 and following sections for detailed information about cell culture methods). This experiment was performed with sodium azide-free medium under aseptic conditions, as sodium azide is toxic for cells. This time, the sampling time points were synchronized with the exchange time points of the cell culture medium (a total of 200 µL per well). During each medium change, from 200 µL of spent medium, 100 µL was removed and replaced by 50 µL release medium sample plus 50 µL fresh culture medium [25]. The loading concentrations studied were 0, 1, 10 and 20 µg/mL. Nanoparticles without added TGF-β3 (0 µg/mL) were used for two different culture conditions, once with and once without the external addition of 100 µL of 10 ng/mL TGF-β3 solution (1 ng TGF-β3 during each medium exchange), as positive and negative controls. After 27 days, the cells were examined. In the meantime, all resulting release samples were stored at −20 °C until examination by ELISA. To quantify the exact amount of released TGF-β3 in the sodium azide-free release samples for the cell culture, the remainder of the release samples were analyzed via ELISA as well.

2.5. ELISA and Data Processing

The ELISA was performed with the Human TGF-beta 3 DuoSet ELISA kit combined with the Duoset ELISA Ancillary Kit 2, purchased from R&D Systems, Minneapolis, USA. The samples were prepared by diluting them with washing buffer from the R&D kit (PBS + 1% BSA) to an appropriate concentration for ELISA calibration. A continuous dilution series (PBS + 1% BSA), starting at 2000 pg/mL and ending at 1.95 pg/mL, was used for calibration. The proprietary TGF-β3 standard from the kit was replaced by protein from the identical vial used for nanoparticle loading to optimize the accuracy of the ELISA. All further steps were carried out according to the manual of the kit. The calibration solutions, the blank buffer and each sample were assessed in duplicate. The mean value of both measurements of each sample was calculated and used for further evaluation.
The masses of the individual fiber mat pieces were used to standardize the measured values to the mean mass of all included samples. Since a full change of medium was performed, the released amounts of protein for each time point were cumulated for the release curves. The release rate was defined as the released amount per day during each interval between medium exchanges.
Different fiber mat batches were used for the different experiments. Therefore, the mean fiber diameter (determined via scanning electron microscopy by the Institute of Multiphase Processes, Leibniz Universität Hannover) was used to calculate the mass-specific surface area of each batch, as described by Sundermann et al. [31]. This step served to normalize the release data, since the loaded and consequently released amount of TGF-β3 depends on the available surface area.

2.6. Cultivation of Bone Marrow-Derived Mesenchymal Stromal Cells

Bone marrow-derived mesenchymal stromal cells (MSCs) from two different donors (A and B, respectively) known to successfully differentiate into the chondrogenic lineage [32] were cultivated in tissue culture flasks at 37 °C and 5% CO2 in growth medium (DMEM FG0415 from Biochrom; 10% FCS Hyclone from Thermo Fisher Scientific; 25 mM N-(2-Hydroxyethyl)piperazine-N’-(2-ethanesulfonic acid (HEPES) from Biochrom; 100 U/mL penicillin and 100 µg/mL streptomycin from Biochrom; 2 ng/mL recombinant human FGF-2 from Peprotech) until they reached 70–80% confluency. Cells were detached with trypsin/EDTA (Biochrom) and used for individual experiments with specific cell densities.

2.7. Chondrogenic Differentiation

The biological activity of TGF-β3 released from modified PCL fiber mats was analyzed with MSCs in a 3D chondrogenic cell pellet culture, as well as by seeding the cells directly onto the fiber mats. For 3D chondrogenesis, the required amount of cells (125,000 cells per pellet) was placed in a conical centrifuge tube and centrifuged at 200× g for 5 min. After a washing step with medium containing 4.5 g/L glucose (Biochrom FG 0435) supplemented with 20 mM HEPES from Biochrom, 100 U/mL penicillin and 100 µg/mL streptomycin at 200× g for 5 min, the pellet was mixed with the required amount of FG0435 DMEM plus supplements (Biochrom; 20 mM HEPES Biochrom; 100 U/mL penicillin and 100 μg/mL streptomycin; 0.1 μM dexamethasone; 1:100 ITS + supplements (354352, Corning, contains: insulin, human transferrin and selenous acid); 170 μM ascorbate-2-phosphate; 1 mM sodium pyruvate; 350 μM proline). Aliquots of 200 µL of the resulting cell suspension (containing 125,000 cells) were transferred into individual wells of a 96-well plate with round bottoms (polypropylene, 3879, Corning: does not allow cell attachment, but aggregation of the cells into pellets) and centrifuged at 200× g for 5 min. Medium exchange was performed after 24 h. Here, the used media (100 µL) were replaced with either fresh media plus release solution (Figure 1) or with media plus PBS/0.1% (w/v) BSA solution at a 1+1 ratio [25]. For the positive controls, 10 ng/mL soluble recombinant human TGF-β3 was used, and the negative controls consisted of media with PBS/0.1% BSA in a 1+1 ratio without TGF-β3. Half of the used medium was removed and substituted with freshly mixed medium (as described above) every second day over a time period of 27 days.
The analysis regarding whether cells were able to grow and differentiate on modified fiber mats loaded with TGF-β3 was conducted as follows. After the modified fiber mats had been loaded with TGF-β3 (see Section 2.2), the mats were washed twice by incubation with PBS at 37 °C and 5% CO2 for 30 min. Subsequently they were incubated with the medium at 37 °C and 5% CO2 for 60 min in order to prepare the mats for cell seeding. The medium was removed just before starting the experiment. The cells were detached with trypsin/EDTA, and 125,000 cells per mat were seeded onto the fiber mats in a 12-well plate with 1 mL chondrogenic medium. Half of the used medium was removed and substituted with fresh medium twice a week for 27 days.

2.8. GAG/DNA

The ratio of glycosaminoglycans (GAG) to DNA was determined by digestion of chondrogenic cell pellets at 60 °C with papain overnight. Subsequently, the DNA was stained with Hoechst 33258 (0.2 µg/mL, Sigma), and the fluorescence was determined with a plate reader (excitation: 360 nm, emission: 460 nm). In order to determine the amount of DNA, a standard series (0, 1, 2, 4, 8, 12, 16, 18, 20 µg/mL) was used. The glycosaminoglycan content of the same digested cell pellet was measured by staining with 1,9-dimethyl methylene blue (0.1 mg/mL, Sigma-Aldrich), and the absorbance was read with a plate reader (absorbance: OD530). In order to determine the GAG amount, a standard series of chondroitin sulfate (5, 12, 25, 50, 75, 100, 150, 200, 300, 400, 500, 600, 800 and 1000 µg/mL) was used. The calculation of the GAG/DNA ratio was performed using Excel.

2.9. RNA Isolation and cDNA Synthesis

A homogenizer from bertin technologies (Precellys® 24 lysis and homogenization; 2 × 30 s, 6000 rpm with 40 s pause in between) and a Precellys® RNA Kit (732-3122, VWR) were used to isolate RNA from the chondrogenic cell pellets. The isolation was performed according to the manufacturer’s manual. In short, chondrogenic pellets were washed with PBS and transferred into a tube with ceramic beads in different sizes and 100 µL lysis buffer. After the use of the homogenizer (2 × 30 s, 6000 rpm with 40 s pause in between), an additional 350 µL of lysis buffer was added to the vial and incubated at room temperature for 15 min, with shaking every few minutes. The mixture was transferred into a DNA-removing column and the flow-through was mixed with 70% ethanol before transferring it to the RNA collecting column. The RNA on the membrane was washed twice with washing buffer and eluted with RNase-free water.
In order to remove contamination with genomic DNA, 200 ng RNA was treated with DNase I for 30 min at 37 °C, and, subsequently, cDNA synthesis was performed according to the manufacturer’s manual (Fermentas) using oligo-dT15 primer.

2.10. qRT-PCR

The Applied Biosystems StepOnePlus instrument (Life Technologies) was used to perform quantitative real-time PCR. According to the manufacturer’s instructions, the analysis was performed using the following gene assays purchased from Life Technologies: RPS29 Hs03004310_g1 (housekeeping gene), SOX9 Hs00165814_m1, COL2A1 Hs01064869_m1, ACAN Hs00153936_m1 and MMP13 Hs00233992_m1.

3. Results

3.1. Particle Size and Zeta Potential of CS/TPP Nanoparticles

The method used to load the fiber mats with TGF-β3 depends on the diffusion behavior and the electric charges of the nanoparticles. Alterations to these parameters might affect the loading process. Therefore, the possible impact of the TGF-β3 concentration on CS/TPP-nanoparticle properties and the particle size characteristics (z-average diameter and PDI), as well as their zeta potential, was determined (Table 1). Similar values were obtained for all TGF-β3 concentrations as well as for nanoparticles formed in the absence of the protein, and there were no trends in the values depending on the TGF-β3 loading concentration. This may indicate unaltered diffusion and electrostatic properties of the tested samples. Slight differences between the values might be related to the manual preparation procedure of the CS/TPP nanoparticles. Furthermore, the zeta potentials were positive for all nanoparticle suspensions; thus, a later interaction with the negatively charged alginate layer on the fibers could be expected.

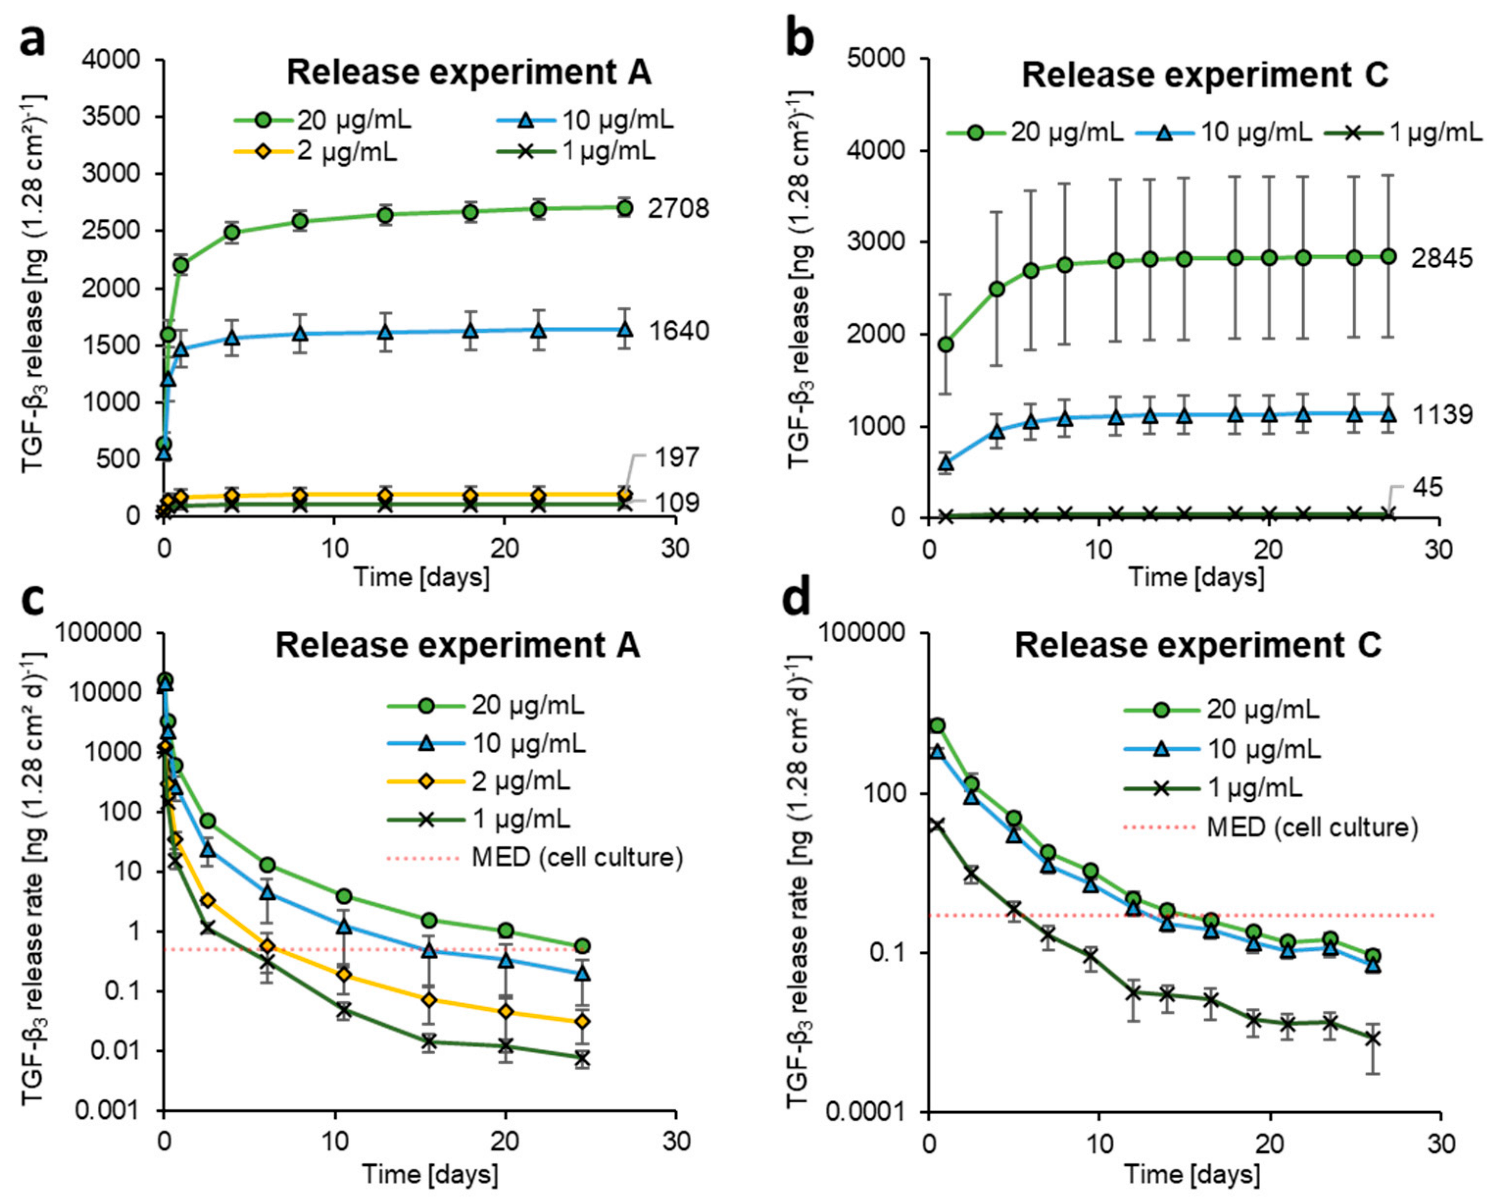
3.2. TGF-β3 Release from Implant Samples

Release studies were performed on the fiber mat samples loaded with different concentrations of TGF-β3. In Figure 2a, the cumulative release of the fiber mats is shown for release experiment A over time. It is evident that the higher loading concentrations led to an increase in the released amount of TGF-β3. The release mode was a burst release, especially during the first 24 h, regardless of the loading concentration used, which has also been observed in the release profile of TGF-β3 from suspended nanoparticles in other studies [24,25]. The majority (approx. 95 to 99%) of the protein was released within the first four to eight days. These findings are supported by release experiments B and C, as they showed an increase in the total release depending on the loading concentrations utilized and the characteristic burst release at the beginning of the release process (Figure 2b and Figure S1a).
For release experiment A, the total release after loading with 2 µg/mL compared to that with 1 µg/mL was nearly doubled, which also applies to the total TGF-β3 release values of the fiber mats loaded with 20 and 10 µg/mL. In the case of loading with 10 µg/mL compared to 1 µg/mL or 20 µg/mL compared to 2 µg, the total release was more than ten times higher. This finding might indicate that the loading becomes more efficient with an increasing loading concentration.
In release experiments B (Figure S1a) and C (Figure 2b), the increases in the total released amounts were different from those observed in experiment A. Hence, the differences might, rather, be caused by a deviation due to the small number of samples (n = 4) or by the general increase in variations in total release with the use of higher loading concentrations. In order to establish a connection between the observations made in all release experiments, the values of total TGF-β3 release for the included individual samples were plotted against the corresponding loading concentration. The resulting graph is discussed in Section 3.3.

3.3. Correlation between TGF-β3 Loading Concentration and Total Release

To gain a better understanding of the correlation between loading concentration and the resulting total release amount of TGF-β3, all corresponding data were combined into a single graph (Figure 3). In spite of the considerable variability, particularly for the data obtained from fiber mats loaded with high TGF-β3 concentrations, the linear correlation between both parameters was obvious. The low adjusted coefficient of determination for a linear fit of 0.881 was presumably due to the rather high variation in samples loaded with higher concentrations of TGF-β3. The linear function of the fit may be useful to approximately estimate the total release to be expected at a given loading concentration. Inversely, this function could serve to choose a suitable loading concentration for the desired application.

3.4. Evolution of TGF-β3 Release Rate over Time

To induce chondrogenesis in cell culture, a minimal effective dose (MEDcell culture) of 0.5 ng per day over a minimum time period of 14 days is required (Figure S3). To determine the loading concentration required for this purpose, in Figure 2c,d the release rate over time is shown, as well as the threshold for chondrogenesis. In all three release studies (A, Figure 2c; B, Figure S1b; C, Figure 2d) the minimum release rate of 0.5 ng/day over at least 14 days was achieved with 20 µg/mL TGF-β3 loading concentration. In release experiment A, the loading with 10 µg/mL also met this aim, while in the other experiments, this loading concentration resulted in a release rate that dropped below 0.5 ng/d too quickly.

3.5. Calculation of Expected In Vivo Dose

Since the studies also served to prepare for in vivo experiments, we used the results to calculate the expected total release of smaller fiber mat samples. For testing in small animals, the implant prototypes should be 5 × 3 mm = 15 mm2, and the mats used in the present studies measured 16 × 8 mm = 128 mm2. Thus, the total release is expected to be 8.53 times lower from fiber mat prototypes for the intended in vivo applications. The resulting doses for loading concentrations of 1, 2, 10 and 20 µg/mL, calculated from the linear correlation function established in Section 3.3 for 128 mm2 fiber mats, and the doses for 15 mm2 fiber mats, calculated via the dimension factor of 8.53, are listed in Table 2, including a score denoting whether the requirements would be met. According to these calculations, the MEDin vivo for animal testing (125 ng [26,27]) would be met by using loading concentrations of 10 or 20 µg/mL for 15 mm2 fiber mats. The results of all release experiments performed (A, Figure 2a; B, Figure S1a; C, Figure 2b), support this assumption. Furthermore, the correlation function results in a minimum loading concentration of 7.44 µg/mL TGF-β3, for a total release of 125 ng from the 15 mm2 fiber mats.

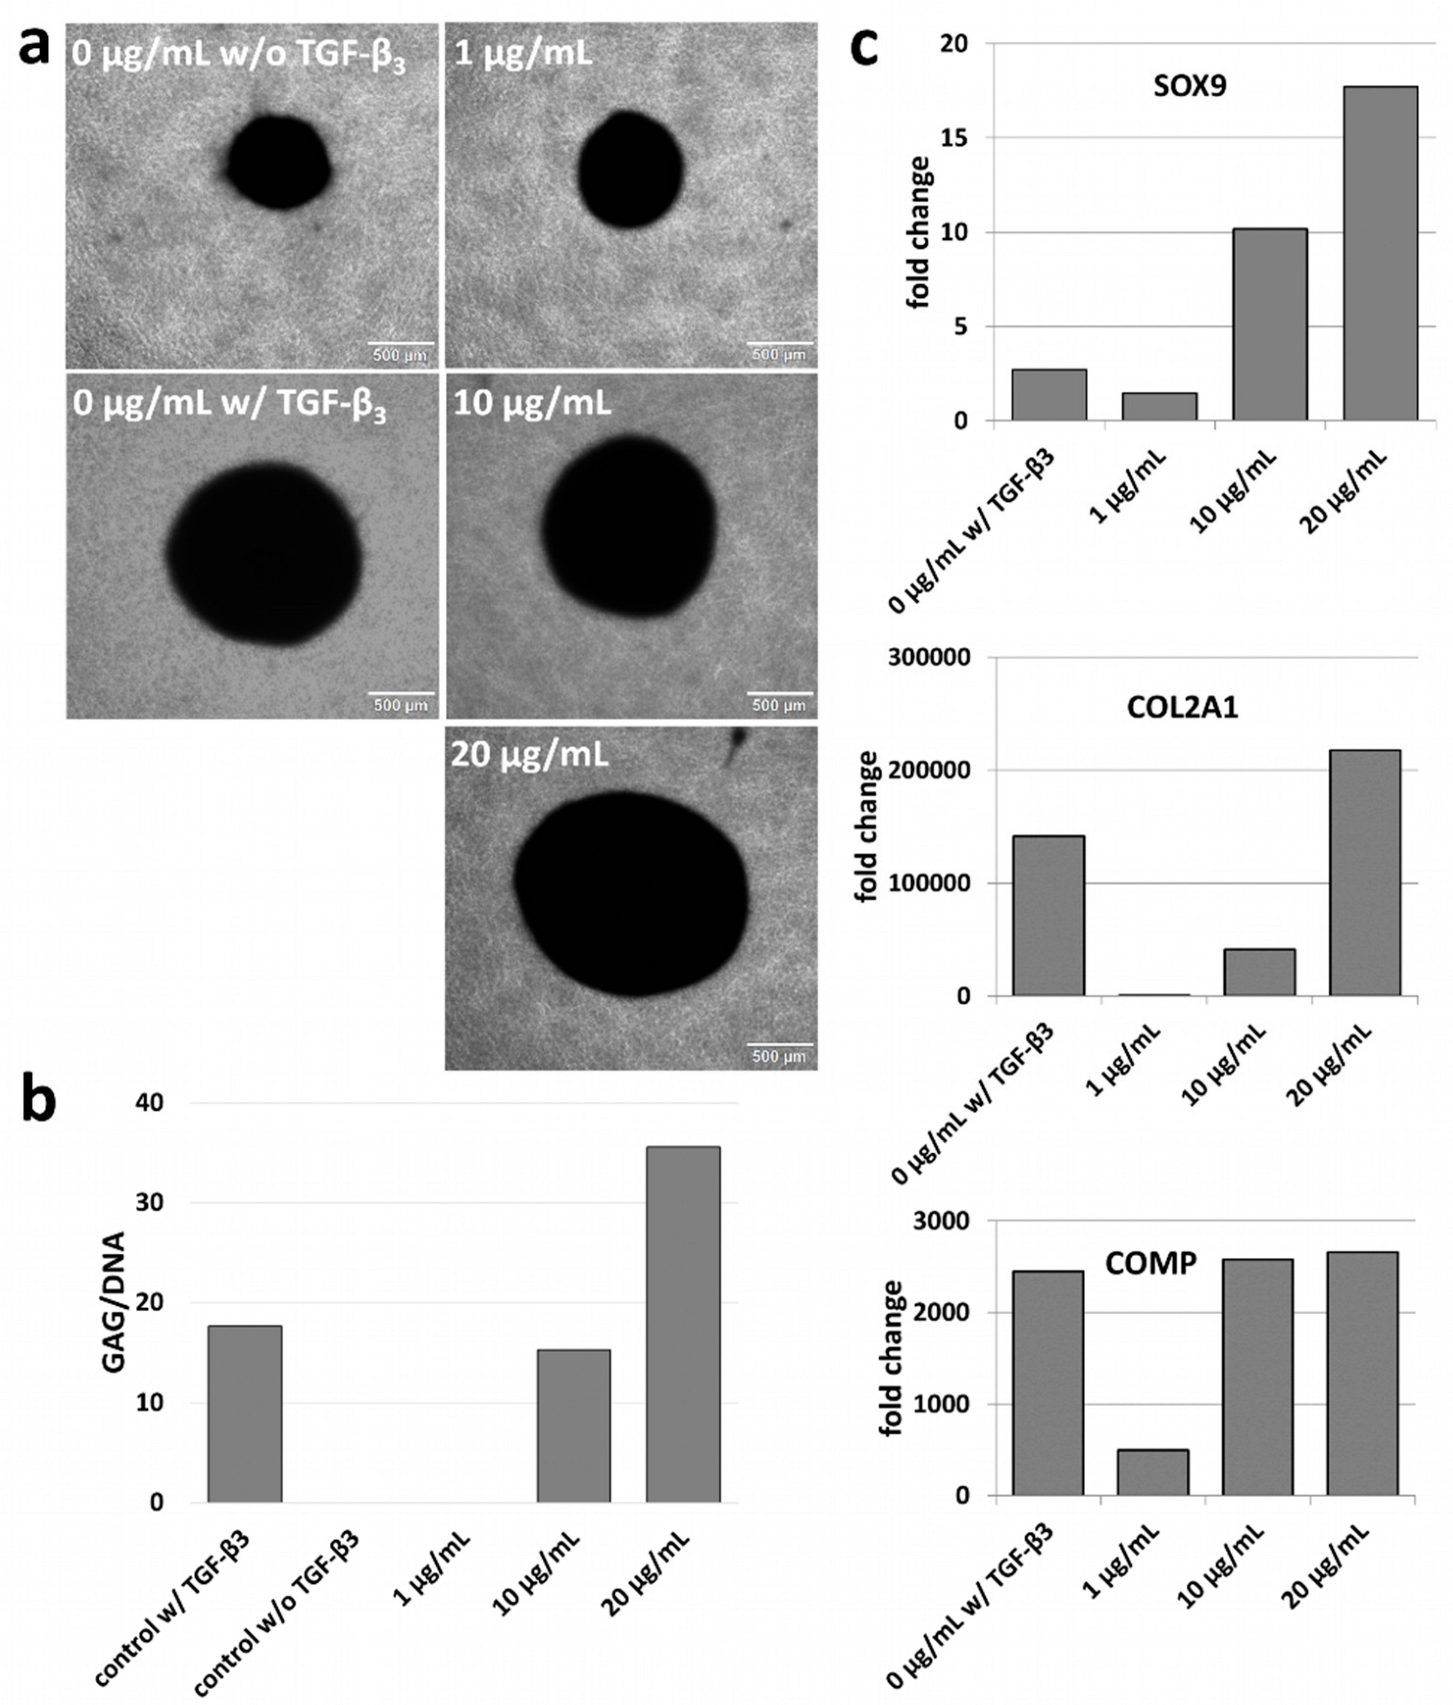
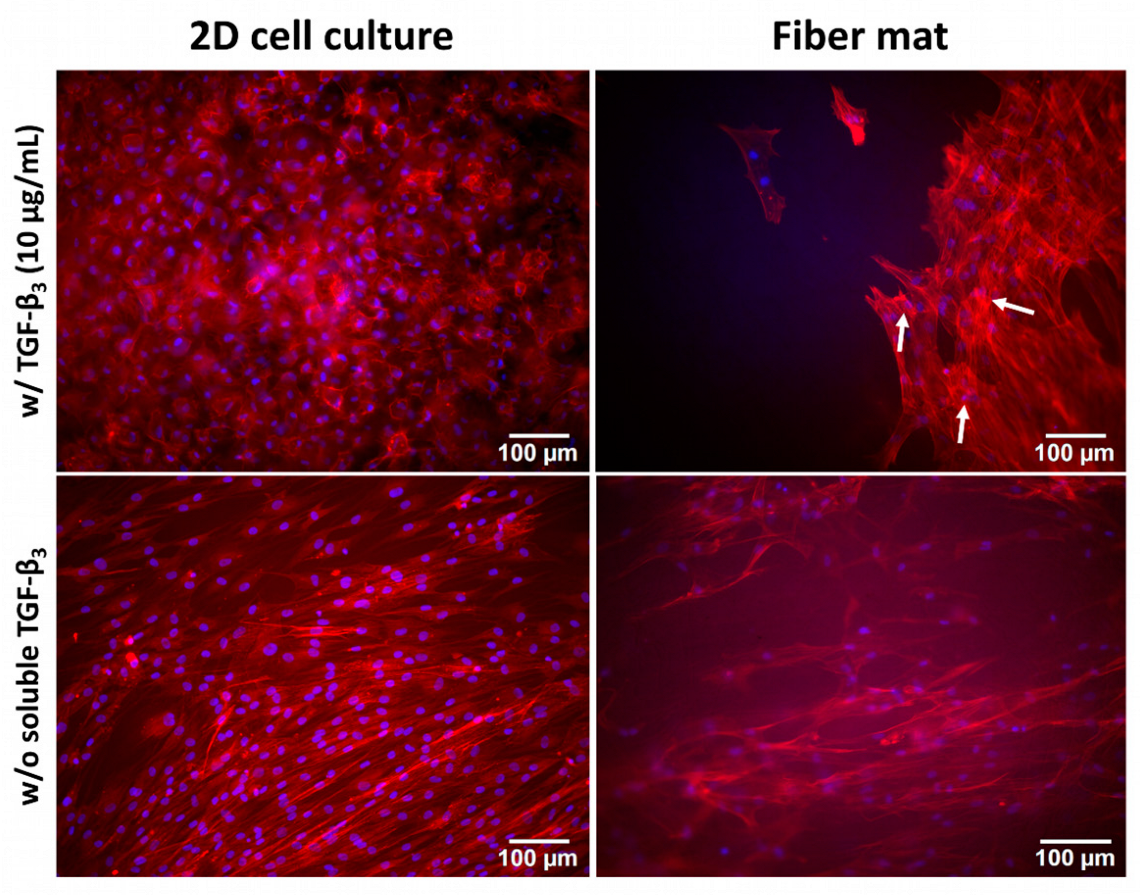
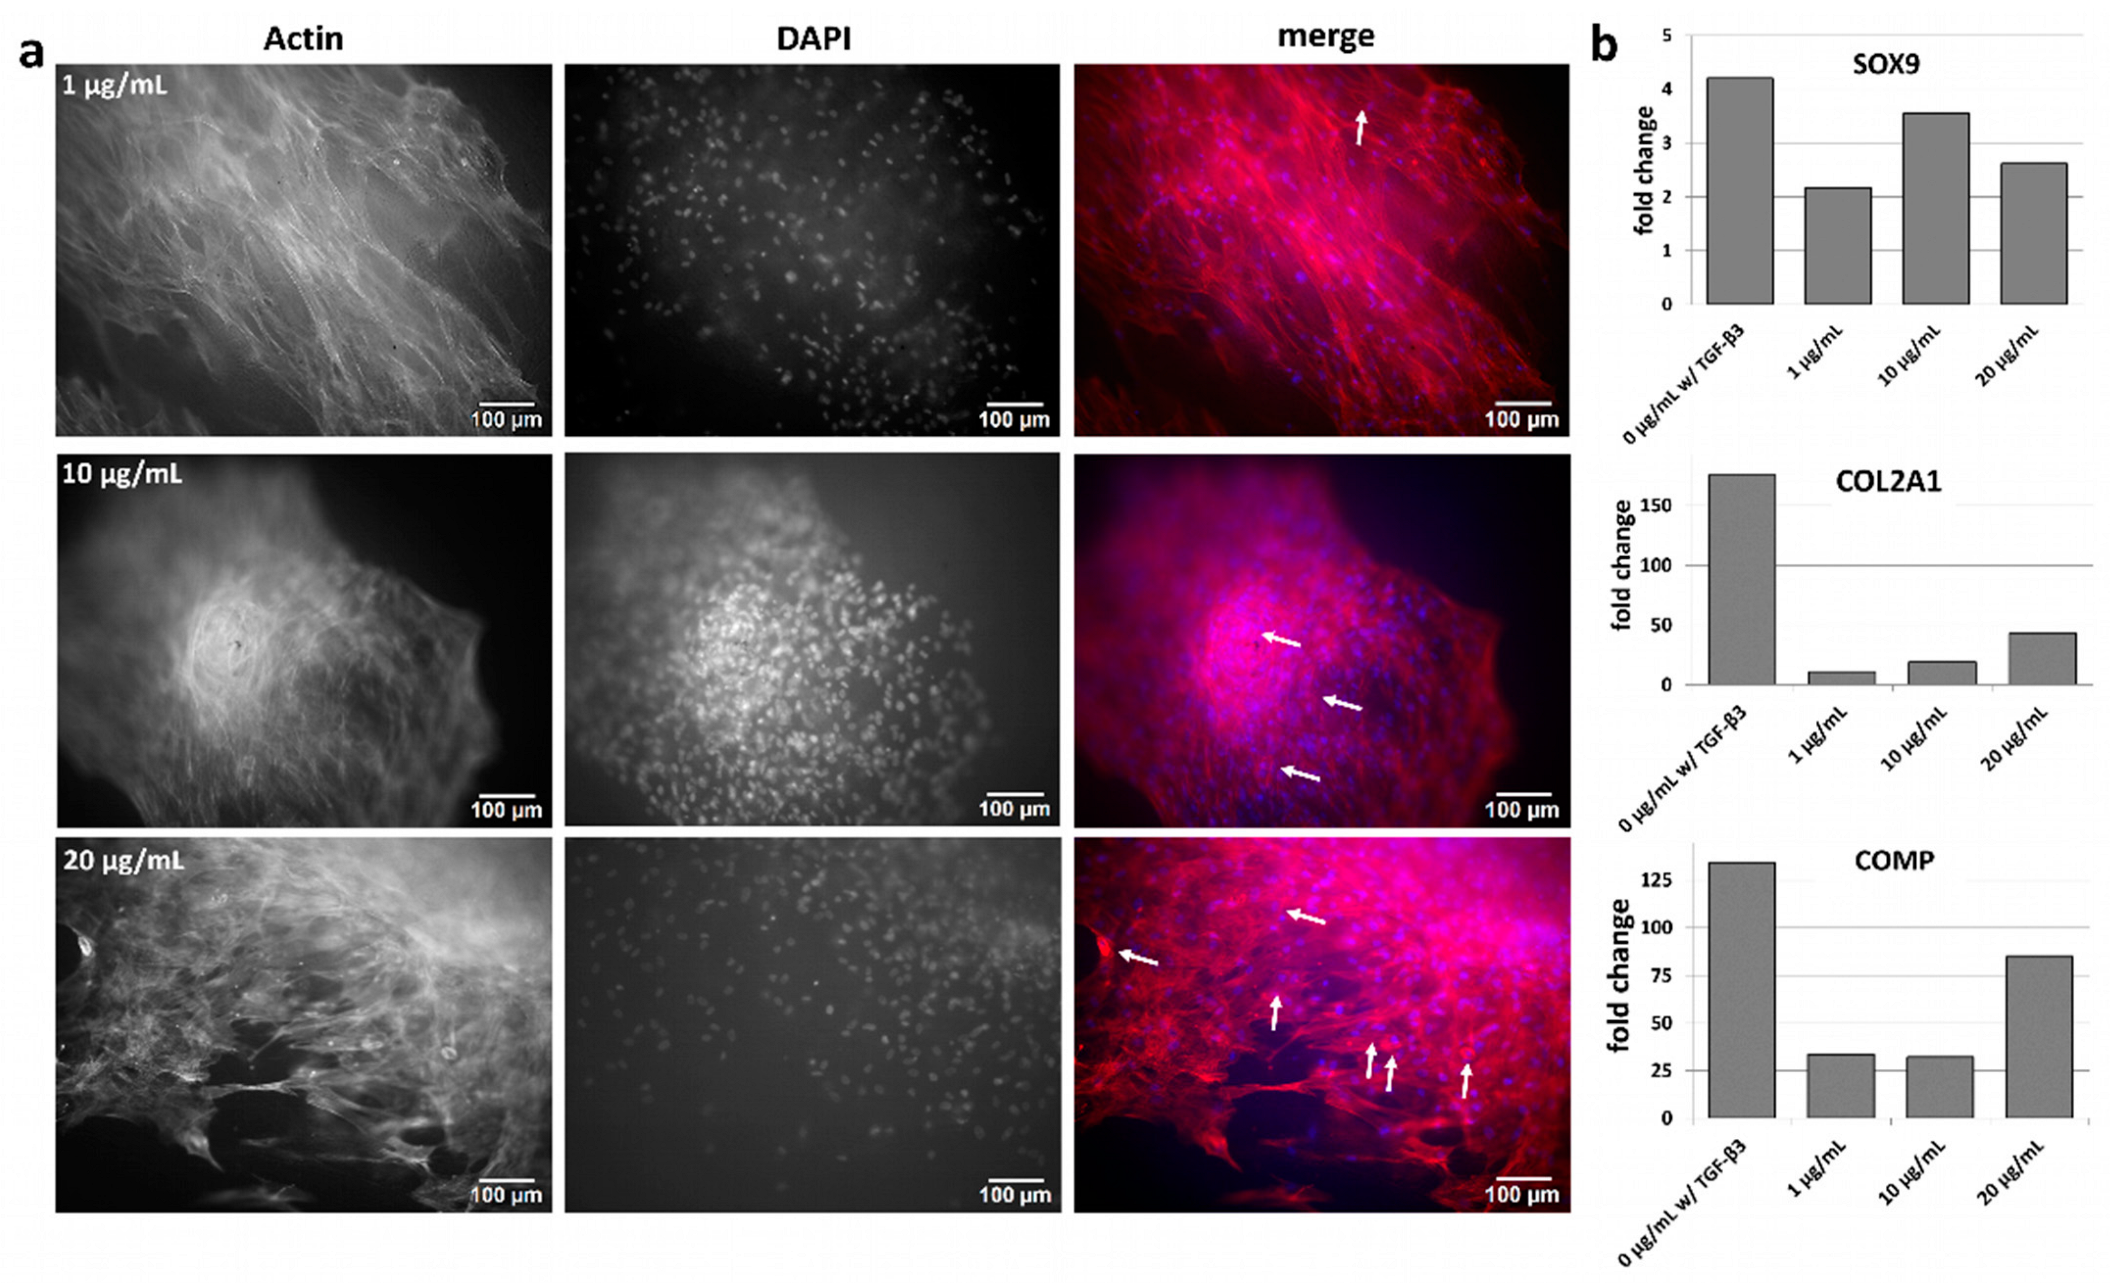
3.6. Chondrogenic Differentiation

Given the successful increase in TGF-β3 released from fiber mats loaded with higher loading concentrations, a corresponding enhancement of the chondrogenic differentiation behavior of MSCs was studied. Initially, analyses in 3D cell pellet setups, a well-recognized method for chondrogenic in vitro differentiation, were performed, and the pellets were cultivated with a mixture of release medium and cell culture medium (Figure 4). After a cultivation period of 27 days with MSCs from donor A, the pellets incubated with externally added soluble TGF-β3 (Figure 4a; 0 µg/mL w/ TGF-β3) showed a notable increase in size in comparison to the negative control without TGF-β3 (Figure 4a; 0 µg/mL w/o TGF-β3). The pellet size increased with the increasing loading concentrations of TGF-β3 used in the release experiments. The pellet incubated with the release medium of the lowest loading concentration (1 µg/mL) was smaller than the one incubated with 10 µg/mL TGF-β3, and an even larger pellet was observed with the highest loading concentration (20 µg/mL, Figure 4a, right). The same could be observed for MSCs from donor B (Figure S2a). This effect correlated with formation of extracellular matrix, since larger pellets demonstrated a higher GAG-to-DNA ratio. Cell pellets, which were not treated with TGF-β3 at all (0 µg/mL w/o TGF-β3) or were treated only with release medium resulting from the lowest loading concentration (1 µg/mL), showed a very low GAG/DNA ratio (Figure 4b). Gene expression analysis of chondrogenic marker genes resulted in a similar tendency. The negative controls without TGF-β3 showed almost no expression of SOX9, COL2A1 or COMP and relatively low expression for 1 µg/mL, but this increased with increasing loading concentrations or with the addition of external TGF-β3 (Figure 4c).
The next step was the direct seeding of MSCs onto the modified fiber mats loaded with different concentrations of TGF-β3. Here, we analyzed two positive and two negative sets of controls. For Set 1, the cells were seeded on cell culture plates (2D) both with (control w/ TGF-β3) and without the addition of external TGF-β3 (control w/o TGF-β3). For Set 2, the cells were seeded on modified fiber mats loaded with empty chitosan nanoparticles both with and without the addition of external TGF-β3 (Figure 5). A difference in cell morphology in the absence and presence of TGF-β3 was observed. The positive 2D control showed a round morphology in comparison to the negative control, reminiscent of the morphology of chondrocytes (Figure 5, left). The cells seeded on fiber mats exhibited a slightly different phenotype. The addition of TGF-β3 caused cell growth in several layers, and some cells began to develop a round morphology (Figure 5, right upper panel, white arrows), whereas the cells without TGF-β3 showed the elongated, fibroblast-like morphology of MSCs (Figure 5, right lower panel).
In summary, the addition of TGF-β3 caused cells seeded onto modified fiber mats or onto cell culture plates to develop a chondrocyte-like morphology.
Furthermore, it was investigated whether the modified fiber mats loaded with different TGF-β3 concentrations showed similar effects. Here, the modified fiber mats were loaded with different TGF-β3 concentrations (1, 10 and 20 µg/mL). Cells were seeded directly onto the loaded fiber mats and analyzed after 27 days for morphology and gene expression. With increasing loading concentration, more cells developed a round morphology. The concentration of 1 µg/mL TGF-β3 led to just a few rounded cells (Figure 6a, white arrow, upper right panel, “merge”), while the concentration of 10 µg/mL TGF-β3 resulted into more rounded cells (Figure 6a, white arrows, middle right panel, “merge”). Even more rounded cells were observed at a 20 µg/mL TGF-β3 loading concentration (Figure 6a, white arrows, lower right panel, “merge”).
In the gene expression analyses, the chondrogenic marker genes SOX9, COL2A1 and COMP were almost undetectable for the negative controls without the external addition of TGF-β3, and a very low expression was observed for the 1 µg/mL condition. However, with higher loading concentrations, the gene expressions of COL2A1 and COMP increased while SOX9 demonstrated low induction, which was at its highest with loading concentration of 10 µg/mL (Figure 6b).

4. Discussion

The regeneration of bone, cartilage and tendon tissue is of increasing relevance in the medical field. In the present study, different concentrations of TGF-β3 were loaded onto modified PCL fiber mats and were able to successfully release a required amount of protein from these fiber mats.
Our aim was to deliver a minimum dose of 125 ng per fiber mat piece measuring 5 × 3 mm, that are the dimensions expected to be suitable for studies in small animals. With the use of loading concentrations from 1 to 20 µg/mL of TGF-β3, we achieved a wide range of total released doses, including amounts high enough for the envisaged in vivo experiments in mice and/or rats. Furthermore, we were able to show that the daily MEDcell culture for TGF-β3 of 0.5 ng for a time period of 14 days could be delivered with implant prototypes loaded with 20 µg/mL TGF-β3. Hence, chondrogenesis was expected to occur in cell culture studies with this loading concentration.
Loading concentrations and total release of TGF-β3 showed a clear correlation. With a linear fitting trend-line function, we were able to approximately predict the anticipated release for a fixed loading concentration. Vice versa, the function could serve as a tool to determine the required loading concentration for a desired release dose.
While ELISA confirmed the successful release of TGF-β3 in our study, this does not necessarily mean that the released protein was still biologically active. Protein activity cannot be taken for granted after encapsulation in nanoparticles, the loading process and the release. Therefore, as an important complementary addition, cell culture tests confirmed that TGF-β3 was released in a biologically active form. The release of TGF-β3 from the fiber mats loaded with high concentrations enhanced the chondrogenic differentiation considerably, especially for the 20 µg/mL loading concentration. With increasing loading concentrations, an increase in the chondrogenic responses of the cells was clearly documented. Depending on the TGF-β3 concentration used for nanoparticle loading, at the time of evaluation (after 27 days for all treatments), the cells were in different stages of chondrogenesis. A low TGF-β3 loading concentration and, thus, a low total release led to early stages of chondrogenic differentiation along with expression of early chondrogenic marker genes, exemplified by SOX9, a low GAG/DNA ratio and the small pellet sizes. With increasingly higher loading concentrations, expressions of late chondrogenic marker genes (COL2A1, ACAN) could be detected, the GAG/DNA ratio became higher and the cell pellets grew in size.
Sundermann et al. were able to prepare an implant based on an electrospun and surface-modified (CS-g-PCL and alginate coating) PCL carrier. In that study, CS/TPP-nanoparticles were also used to load BMP-2 and TGF-β3 onto the fiber surfaces in separate areas of the implants. The spatial gradation of the two loaded growth factors was meant to induce stem cell differentiation in a graded manner, matching the physiological tissue transition between bone and cartilage in entheses [23]. In these studies, successful loading and release of BMP-2 and TGF-β3 were achieved in vitro. However, for future in vivo applications, the total release doses were too low, and they would require adaptation [26,27,33]. With the present work, we solved the first of these challenges by enabling the adequate and bioactive release of TGF-β3 for this delivery system.
Various cell-free strategies for the treatment of cartilage injuries have already been tested in vivo. Scaffolds obtained by the decellularization of cartilage or bone tissue, from other naturally-derived materials such as collagens, as well as synthetically produced scaffolds with or without additional loading of TGF-β3, successfully recruited mononuclear cells, including stem cells, and thus improved the regeneration of tissue in artificial defects [34,35,36,37,38]. Following these examples, in vivo studies would now be appropriate to further demonstrate the applicability of the system presented in the current study.
The transforming growth factor β isoforms are known for their importance in wound healing and tissue regeneration, as well as for their potential impact on the formation of fibrotic tissue [39,40,41]. Further, it has been found that inhibition of TGF-β with a soluble TGF-β type II receptor reduced fibrotic effects depending on the administered dose [42]. Another work indicated a dose-dependency for agents inducing the TGF-β/Smad signaling pathway, mediating kidney fibrosis [42,43]. Hence, this pro-fibrotic effect may possibly be dose-dependent in peripheral tissue as well, and would need to be reconsidered if the current approach for dose adaption was transferred to in vivo applications.

5. Conclusions

The present examinations and findings contribute to the development of scalability between in vitro and in vivo use of regenerative implants for tissue transitions based on the controlled release of biologically active factors from nanofiber carriers. Besides the general demonstration of successful release of TGF-β3 from electrospun PCL fiber mats, we were able to prove the biological activity of the released growth factor via a dose-dependent chondrogenic response in MSCs. Thereby, a sound basis for in vivo studies was created. The correlation between the loading concentration and total release could be used to support the preparation of implant prototypes with defined release doses, which may be helpful in adjusting the implant for different applications.
The next important step to prove the transferability needs to be actual in vivo analyses in small animals. Through these studies, it would become possible to gain a better understanding of the distribution, elimination processes and defense reactions of the organism, such as inflammation or fibrosis after implantation.

Supplementary Materials

The following supporting information can be downloaded at: https://www.mdpi.com/article/10.3390/pharmaceutics15041303/s1, Figure S1: Cumulative release (a) and release rate (b) of TGF-β3 from fiber mats (1.28 cm2) loaded with various protein concentrations in a repetitive experiment (“release experiment B”); Figure S2: Chondrogenic differentiation of MSCs from donor B increases with increasing loading concentration; Figure S3: Chondrogenic differentiation after addition of TGF-β3 (5 ng/mL) over specific periods.

Author Contributions

Conceptualization, L.B.-S., Y.R., H.B. and A.H.; methodology, L.B.-S., Y.R., H.B. and A.H.; validation, L.B.-S. and Y.R.; formal analysis, L.B.-S. and Y.R.; investigation, L.B.-S. and Y.R.; resources, H.B. and A.H.; writing—original draft preparation, L.B.-S. and Y.R.; writing—review and editing, L.B.-S., Y.R., H.B. and A.H.; visualization, L.B.-S. and Y.R.; supervision, H.B. and A.H.; funding acquisition, H.B. and A.H. All authors have read and agreed to the published version of the manuscript.

Funding

This research was funded by the German Research Foundation (DFG) as part of the research group FOR 2180 “Graded implants” (DFG, HO 2058/16-2: 270206734; HO 2058/15-2: 269986331, BU 2352/3-2: 270206734). H.B. acknowledges additional funding by the Ministry of Science and Culture (MWK) of Lower Saxony, Germany, within the framework of the SMART BIOTECS alliance between the Technische Universität Braunschweig and the Leibniz Universität Hannover.

Institutional Review Board Statement

The study was conducted in accordance with the Declaration of Helsinki and approved by the Institutional Ethics Committee of Hannover Medical School (565-2009 on 28 August 2009 and 565-2016 on 22 April 2016 to A.H. for the use of cells isolated from bone marrow of human donors.

Informed Consent Statement

Informed consent was obtained from all de-identified subjects whose cells were used in the study.

Data Availability Statement

Data are contained within the article.

Acknowledgments

The authors thank the group of B. Glasmacher (Institute of Multiphase Processes, Leibniz Universität Hannover) for providing the electrospun PCL fiber mats, as well as the group of H. Menzel at the Institute of Technical Chemistry (Technische Universität Braunschweig) for conducting the surface modification of the fiber mats and providing chitosan. Furthermore, we would like to thank Stefanie Dirksen-Thedens, Anika Hamm and Kirsten Elger for their valuable technical assistance within this work.

Conflicts of Interest

The authors declare no conflict of interest.

References

  1. Michaud, C.M.; McKenna, M.T.; Begg, S.; Tomijima, N.; Majmudar, M.; Bulzacchelli, M.T.; Ebrahim, S.; Ezzati, M.; Salomon, J.A.; Kreiser, J.G.; et al. The burden of disease and injury in the United States 1996. Popul. Health Metr. 2006, 4, 11. [Google Scholar] [CrossRef]
  2. Buckwalter, J.A.; Martin, J.A. Osteoarthritis. Adv. Drug Deliv. Rev. 2006, 58, 150–167. [Google Scholar] [CrossRef]
  3. Milgrom, C.; Schaffler, M.; Gilbert, S.; van Holsbeeck, M. Rotator-cuff changes in asymptomatic adults. The effect of age, hand dominance and gender. J. Bone Jt. Surg. Br. 1995, 77-B, 296–298. [Google Scholar] [CrossRef]
  4. Minagawa, H.; Yamamoto, N.; Abe, H.; Fukuda, M.; Seki, N.; Kikuchi, K.; Kijima, H.; Itoi, E. Prevalence of symptomatic and asymptomatic rotator cuff tears in the general population: From mass-screening in one village. J. Orthop. 2013, 10, 8–12. [Google Scholar] [CrossRef]
  5. Yamamoto, A.; Takagishi, K.; Osawa, T.; Yanagawa, T.; Nakajima, D.; Shitara, H.; Kobayashi, T. Prevalence and risk factors of a rotator cuff tear in the general population. J. Shoulder Elb. Surg. 2010, 19, 116–120. [Google Scholar] [CrossRef]
  6. Lee, C.H.; Cook, J.L.; Mendelson, A.; Moioli, E.K.; Yao, H.; Mao, J.J. Regeneration of the articular surface of the rabbit synovial joint by cell homing: A proof of concept study. Lancet 2010, 376, 440–448. [Google Scholar] [CrossRef]
  7. Martino, M.M.; Briquez, P.S.; Ranga, A.; Lutolf, M.P.; Hubbell, J.A. Heparin-binding domain of fibrin(ogen) binds growth factors and promotes tissue repair when incorporated within a synthetic matrix. Proc. Natl. Acad. Sci. USA 2013, 110, 4563–4568. [Google Scholar] [CrossRef]
  8. Zumstein, M.-A.; Lädermann, A.; Raniga, S.; Schär, M.-O. The biology of rotator cuff healing. Orthop. Traumatol. Surg. Res. OTSR 2017, 103, S1–S10. [Google Scholar] [CrossRef]
  9. Hays, P.L.; Kawamura, S.; Deng, X.-H.; Dagher, E.; Mithoefer, K.; Ying, L.; Rodeo, S.A. The role of macrophages in early healing of a tendon graft in a bone tunnel. J. Bone Jt. Surg. Am. Vol. 2008, 90, 565–579. [Google Scholar] [CrossRef]
  10. Kawamura, S.; Ying, L.; Kim, H.-J.; Dynybil, C.; Rodeo, S.A. Macrophages accumulate in the early phase of tendon-bone healing. J. Orthop. Res. Off. Publ. Orthop. Res. Soc. 2005, 23, 1425–1432. [Google Scholar] [CrossRef]
  11. Itoi, E.; Minagawa, H.; Yamamoto, N.; Seki, N.; Abe, H. Are pain location and physical examinations useful in locating a tear site of the rotator cuff? Am. J. Sport. Med. 2006, 34, 256–264. [Google Scholar] [CrossRef] [PubMed]
  12. Jiang, T.; Carbone, E.J.; Lo, K.W.-H.; Laurencin, C.T. Electrospinning of polymer nanofibers for tissue regeneration. Prog. Polym. Sci. 2015, 46, 1–24. [Google Scholar] [CrossRef]
  13. Li, W.-J.; Laurencin, C.T.; Caterson, E.J.; Tuan, R.S.; Ko, F.K. Electrospun nanofibrous structure: A novel scaffold for tissue engineering. J. Biomed. Mater. Res. 2002, 60, 613–621. [Google Scholar] [CrossRef] [PubMed]
  14. Laurencin, C.T.; Attawia, M.A.; Elgendy, H.E.; Herbert, K.M. Tissue engineered bone-regeneration using degradable polymers: The formation of mineralized matrices. Bone 1996, 19, 93S–99S. [Google Scholar] [CrossRef]
  15. Borden, M.; El-Amin, S.F.; Attawia, M.; Laurencin, C.T. Structural and human cellular assessment of a novel microsphere-based tissue engineered scaffold for bone repair. Biomaterials 2003, 24, 597–609. [Google Scholar] [CrossRef]
  16. Kovacevic, D.; Fox, A.J.; Bedi, A.; Ying, L.; Deng, X.-H.; Warren, R.F.; Rodeo, S.A. Calcium-phosphate matrix with or without TGF-β3 improves tendon-bone healing after rotator cuff repair. Am. J. Sport. Med. 2011, 39, 811–819. [Google Scholar] [CrossRef]
  17. Wang, X.; Wenk, E.; Zhang, X.; Meinel, L.; Vunjak-Novakovic, G.; Kaplan, D.L. Growth factor gradients via microsphere delivery in biopolymer scaffolds for osteochondral tissue engineering. J. Control. Release 2009, 134, 81–90. [Google Scholar] [CrossRef]
  18. Park, J.Y.; Shim, J.-H.; Choi, S.-A.; Jang, J.; Kim, M.; Lee, S.H.; Cho, D.-W. 3D printing technology to control BMP-2 and VEGF delivery spatially and temporally to promote large-volume bone regeneration. J. Mater. Chem. B 2015, 3, 5415–5425. [Google Scholar] [CrossRef]
  19. Mueller, M.B.; Fischer, M.; Zellner, J.; Berner, A.; Dienstknecht, T.; Prantl, L.; Kujat, R.; Nerlich, M.; Tuan, R.S.; Angele, P. Hypertrophy in mesenchymal stem cell chondrogenesis: Effect of TGF-beta isoforms and chondrogenic conditioning. Cells Tissues Organs 2010, 192, 158–166. [Google Scholar] [CrossRef]
  20. Barry, F.; Boynton, R.E.; Liu, B.; Murphy, J.M. Chondrogenic differentiation of mesenchymal stem cells from bone marrow: Differentiation-dependent gene expression of matrix components. Exp. Cell Res. 2001, 268, 189–200. [Google Scholar] [CrossRef]
  21. Fricke, D.; Becker, A.; Jütte, L.; Bode, M.; de Cassan, D.; Wollweber, M.; Glasmacher, B.; Roth, B. Mueller matrix measurement of electrospun fiber scaffolds for tissue engineering. Polymers 2019, 11, 2062. [Google Scholar] [CrossRef] [PubMed]
  22. de Cassan, D.; Sydow, S.; Schmidt, N.; Behrens, P.; Roger, Y.; Hoffmann, A.; Hoheisel, A.L.; Glasmacher, B.; Hänsch, R.; Menzel, H. Attachment of nanoparticulate drug-release systems on poly(ε-caprolactone) nanofibers via a graftpolymer as interlayer. Colloids Surf. B Biointerfaces 2018, 163, 309–320. [Google Scholar] [CrossRef] [PubMed]
  23. Sundermann, J.; Sydow, S.; Burmeister, L.; Hoffmann, A.; Menzel, H.; Bunjes, H. Spatially and temporally controllable BMP-2 and TGF-β3 double release from polycaprolactone fiber scaffolds via chitosan-based polyelectrolyte coatings. ACS Biomater. Sci. Eng. 2022, in press. [Google Scholar] [CrossRef] [PubMed]
  24. Sydow, S.; de Cassan, D.; Hänsch, R.; Gengenbach, T.R.; Easton, C.D.; Thissen, H.; Menzel, H. Layer-by-layer deposition of chitosan nanoparticles as drug-release coatings for PCL nanofibers. Biomater. Sci. 2018, 7, 233–246. [Google Scholar] [CrossRef] [PubMed]
  25. Roger, Y.; Sydow, S.; Burmeister, L.; Menzel, H.; Hoffmann, A. Sustained release of TGF-β3 from polysaccharide nanoparticles induces chondrogenic differentiation of human mesenchymal stromal cells. Colloids Surfaces B Biointerfaces 2020, 189, 110843. [Google Scholar] [CrossRef]
  26. Sharma, B.; Williams, C.G.; Khan, M.; Manson, P.; Elisseeff, J.H. In vivo chondrogenesis of mesenchymal stem cells in a photopolymerized hydrogel. Plast. Reconstr. Surg. 2007, 119, 112–120. [Google Scholar] [CrossRef]
  27. Bian, L.; Zhai, D.Y.; Tous, E.; Rai, R.; Mauck, R.L.; Burdick, J.A. Enhanced MSC chondrogenesis following delivery of TGF-β3 from alginate microspheres within hyaluronic acid hydrogels in vitro and in vivo. Biomaterials 2011, 32, 6425–6434. [Google Scholar] [CrossRef]
  28. Sydow, S.; Aniol, A.; Hadler, C.; Menzel, H. Chitosan-azide nanoparticle coating as a degradation barrier in multilayered polyelectrolyte drug delivery systems. Biomolecules 2019, 9, 573. [Google Scholar] [CrossRef]
  29. Poth, N.; Seiffart, V.; Gross, G.; Menzel, H.; Dempwolf, W. Biodegradable chitosan nanoparticle coatings on titanium for the delivery of BMP-2. Biomolecules 2015, 5, 3–19. [Google Scholar] [CrossRef]
  30. de Cassan, D.; Hoheisel, A.L.; Glasmacher, B.; Menzel, H. Impact of sterilization by electron beam, gamma radiation and X-rays on electrospun poly-(ε-caprolactone) fiber mats. J. Mater. Sci. Mater. Med. 2019, 30, 42. [Google Scholar] [CrossRef]
  31. Sundermann, J.; Oehmichen, S.; Sydow, S.; Burmeister, L.; Quaas, B.; Hänsch, R.; Rinas, U.; Hoffmann, A.; Menzel, H.; Bunjes, H. Varying the sustained release of BMP-2 from chitosan nanogel-functionalized polycaprolactone fiber mats by different polycaprolactone surface modifications. J. Biomed. Mater. Res. Part A 2020, 109, 600–614. [Google Scholar] [CrossRef] [PubMed]
  32. Scheper, V.; Schwieger, J.; Hamm, A.; Lenarz, T.; Hoffmann, A. BDNF-overexpressing human mesenchymal stem cells mediate increased neuronal protection in vitro. J. Neurosci. Res. 2019, 97, 1414–1429. [Google Scholar] [CrossRef] [PubMed]
  33. Uludag, H.; D’Augusta, D.; Golden, J.; Li, J.; Timony, G.; Riedel, R.; Wozney, J.M. Implantation of recombinant human bone morphogenetic proteins with biomaterial carriers: A correlation between protein pharmacokinetics and osteoinduction in the rat ectopic model. J. Biomed. Mater. Res. 2000, 50, 227–238. [Google Scholar] [CrossRef]
  34. Pugliese, E.; Sallent, I.; Ribeiro, S.; Trotier, A.; Korntner, S.H.; Bayon, Y.; Zeugolis, D.I. Development of three-layer collagen scaffolds to spatially direct tissue-specific cell differentiation for enthesis repair. Mater. Today Bio 2023, 19, 100584. [Google Scholar] [CrossRef] [PubMed]
  35. Jia, L.; Zhang, P.; Ci, Z.; Hao, X.; Bai, B.; Zhang, W.; Jiang, H.; Zhou, G. Acellular cartilage matrix biomimetic scaffold with immediate enrichment of autologous bone marrow mononuclear cells to repair articular cartilage defects. Mater. Today Bio 2022, 15, 100310. [Google Scholar] [CrossRef] [PubMed]
  36. Yang, Z.; Li, H.; Tian, Y.; Fu, L.; Gao, C.; Zhao, T.; Cao, F.; Liao, Z.; Yuan, Z.; Liu, S.; et al. Biofunctionalized structure and ingredient mimicking scaffolds achieving recruitment and chondrogenesis for staged cartilage regeneration. Front. Cell Dev. Biol. 2021, 9, 655440. [Google Scholar] [CrossRef]
  37. Li, H.; Zhao, T.; Cao, F.; Deng, H.; He, S.; Li, J.; Liu, S.; Yang, Z.; Yuan, Z.; Guo, Q. Integrated bioactive scaffold with aptamer-targeted stem cell recruitment and growth factor-induced pro-differentiation effects for anisotropic meniscal regeneration. Bioeng. Transl. Med. 2022, 7, e10302. [Google Scholar] [CrossRef]
  38. Hua, Y.; Huo, Y.; Bai, B.; Hao, J.; Hu, G.; Ci, Z.; Wu, X.; Yu, M.; Wang, X.; Chen, H.; et al. Fabrication of biphasic cartilage-bone integrated scaffolds based on tissue-specific photo-crosslinkable acellular matrix hydrogels. Mater. Today Bio 2022, 17, 100489. [Google Scholar] [CrossRef]
  39. Branton, M.H.; Kopp, J.B. TGF-beta and fibrosis. Microbes Infect. 1999, 1, 1349–1365. [Google Scholar] [CrossRef]
  40. Hernandez-Pando, R.; Bornstein, Q.L.; Leon, D.A.; Orozco, E.H.; Madrigal, V.K.; Cordero, E.M. Inflammatory cytokine production by immunological and foreign body multinucleated giant cells. Immunology 2000, 100, 352–358. [Google Scholar] [CrossRef]
  41. Ihn, H. Scleroderma, fibroblasts, signaling, and excessive extracellular matrix. Curr. Rheumatol. Rep. 2005, 7, 156–162. [Google Scholar] [CrossRef] [PubMed]
  42. Yata, Y.; Gotwals, P.; Koteliansky, V.; Rockey, D.C. Dose-dependent inhibition of hepatic fibrosis in mice by a TGF-beta soluble receptor: Implications for antifibrotic therapy. Hepatology 2002, 35, 1022–1030. [Google Scholar] [CrossRef] [PubMed]
  43. Cai, Y.; Ma, W.; Xiao, Y.; Wu, B.; Li, X.; Liu, F.; Qiu, J.; Zhang, G. High doses of baicalin induces kidney injury and fibrosis through regulating TGF-β/Smad signaling pathway. Toxicol. Appl. Pharmacol. 2017, 333, 1–9. [Google Scholar] [CrossRef] [PubMed]
Figure 1. Procedure of fiber mat loading and release experiments for ELISA/cell culture testing. During release experiments, loaded fiber mat samples were transferred to fresh release medium at each sampling time point. Furthermore, the release samples were used to determine the TGF-β3 concentration by ELISA and to examine the chondrogenic effect in the cell culture.
Pharmaceutics 15 01303 g001
Figure 2. Cumulative release and release rate of TGF-β3 from fiber mats (1.28 cm2) loaded with various protein concentrations. The graphs show the results of (a) release experiment “A” (ELISA analysis) and (b) the corresponding release experiment “C” for cell culture (sodium azide-free medium, ELISA analysis, later use for chondrogenic induction). The cumulated amount of TGF-β3 released until the end of the experiment increased with the use of higher loading concentrations, as indicated in the two upper graphs. (c) The release rate of TGF-β3 from fiber mats (1.28 cm2) loaded with various protein concentrations (release experiment “A”) and (d) the release rate in the corresponding release experiment “C” for the cell culture. With the use of higher loading concentrations, release doses above the minimal effective dose for cell culture (MEDcell culture, marked in c,d) of 0.5 ng/d could be maintained for a longer period of time.
Pharmaceutics 15 01303 g002
Figure 3. Correlation between TGF-β3 loading concentration and total release from implant prototype. The adjusted coefficient of determination for a linear correlation was 0.881, while variations increased with higher loading concentrations.
Pharmaceutics 15 01303 g003
Figure 4. Chondrogenic differentiation of MSCs from donor A was enhanced with increasing loading concentrations. w/: with TGF-β3, w/o: without TGF-β3. (a) Chondrogenic cell pellets. In the presence of TGF-β3 (0 µg/mL w/ TGF-β3 (i.e., release medium of fiber mats w/o TGF-β3 loading, but with external addition of TGF-β3, positive control), 1 µg/mL, 10 µg/mL, 20 µg/mL), the morphology of the pellets was round and compact, and the size increased with increasing loading concentrations. In contrast, without TGF-β3 (0 µg/mL w/o TGF-β3), the pellets showed considerably less compact growth and were smaller in size. Scale bar: 500 µm. (b) Ratio of glycosaminoglycan (GAG) to DNA. The increasing loading concentration led to an increase in GAG/DNA. Cell pellets, which were not treated with TGF-β3 (0 µg/mL w/o TGF-β3) or were treated with release medium from the lowest loading concentration (1 µg/mL), showed a very low GAG/DNA ratio. (c) Gene expression analysis of the chondrogenic marker genes SOX9, COL2A1 and COMP. Shown is the fold change against 0 µg/mL w/o TGF-β3. All three chondrogenic marker genes resulted in an increase in expression with the treatment of TGF-β3, and almost no expression without TGF-β3 treatment.
Pharmaceutics 15 01303 g004
Figure 5. MSCs seeded as positive and negative controls in a 2D manner (left panel) as well as on modified fiber mats loaded with empty chitosan nanoparticles (right panel). Cells were stained with phalloidin (red) and DAPI (blue) to visualize the actin cytoskeleton and the nuclei, respectively. Both sets were analyzed in the presence and absence of TGF-β3 (upper and lower panel, respectively). The control with TGF-β3 under 2D conditions showed rounded cells (left, upper panel), with morphology similar to that of chondrocytes and in striking contrast to the elongated fibroblast-like cells observed in the absence of TGF-β3 (left, lower panel). The right panel shows MSCs seeded on modified fiber mats loaded with empty chitosan nanoparticles. The right upper panel shows the condition with TGF-β3 with some rounded cells (white arrow) and the lower panel without TGF-β3.
Pharmaceutics 15 01303 g005
Figure 6. Chondrogenic differentiation on modified fiber mats. (a) Modified fiber mats loaded with different TGF-β3 concentrations (1 µg/mL (upper panel), 10 µg/mL (middle panel) and 20 µg/mL (lower panel)), were seeded with MSCs and cultivated for 27 days. Cells were stained with phalloidin for the actin cytoskeleton and with DAPI for the DNA. Chondrocyte-like cells are marked with white arrows in the merge panel. Scale bar: 100 µm. (b) Gene expression analyses of chondrogenic marker genes SOX9, COL2A1 and COMP, normalized to the housekeeper RPS29 and shown in fold change to the negative control 0 µg/mL w/o TGF-β3.
Pharmaceutics 15 01303 g006
Table 1. Size, PDI and zeta potential of CS/TPP nanoparticles loaded with different TGF-β3 concentrations.
TGF-β3
Concentration
Z-average Diameter
(nm)
PDIZeta Potential
(mV)
0 µg/mL267.8 ± 2.380.262 ± 0.00316.2 ± 1.01
1 µg/mL259.9 ± 1.190.258 ± 0.00216.6 ± 0.75
2 µg/mL278.3 ± 0.810.253 ± 0.00617.6 ± 0.60
10 µg/mL264.1 ± 0.870.259 ± 0.00316.9 ± 0.40
20 µg/mL249.4 ± 0.230.252 ± 0.00216.6 ± 0.58
Table 2. Calculated total release of TGF-β3 from fiber mats with dimensions used for in vivo studies in small animals (15 mm2).
Loading Concentration [µg/mL]Calculated Total Release from 128 mm2 Fiber Mats
(ng)
Calculated Total Release from 15 mm2 Fiber Mats
(ng)
MEDin vivo Achieved
203012.3353.0yes
101463.3171.5yes
2224.126.3no
169.28.1no
Disclaimer/Publisher’s Note: The statements, opinions and data contained in all publications are solely those of the individual author(s) and contributor(s) and not of MDPI and/or the editor(s). MDPI and/or the editor(s) disclaim responsibility for any injury to people or property resulting from any ideas, methods, instructions or products referred to in the content.

