
mTOR Inhibition Impairs the Activation and Function of Belatacept-Resistant CD4+CD57+ T Cells In Vivo and In Vitro
 ,
,
Abstract
:1. Introduction
2. Materials and Methods
2.1. Cell Culture
2.2. Dendritic Cell Differentiation
2.3. Mixed Lymphocyte Reaction (MLR)
2.4. Flow Cytometry
2.5. RNA-seq Analysis and RNA-seq Data Processing
3. Statistical Analysis
4. Results
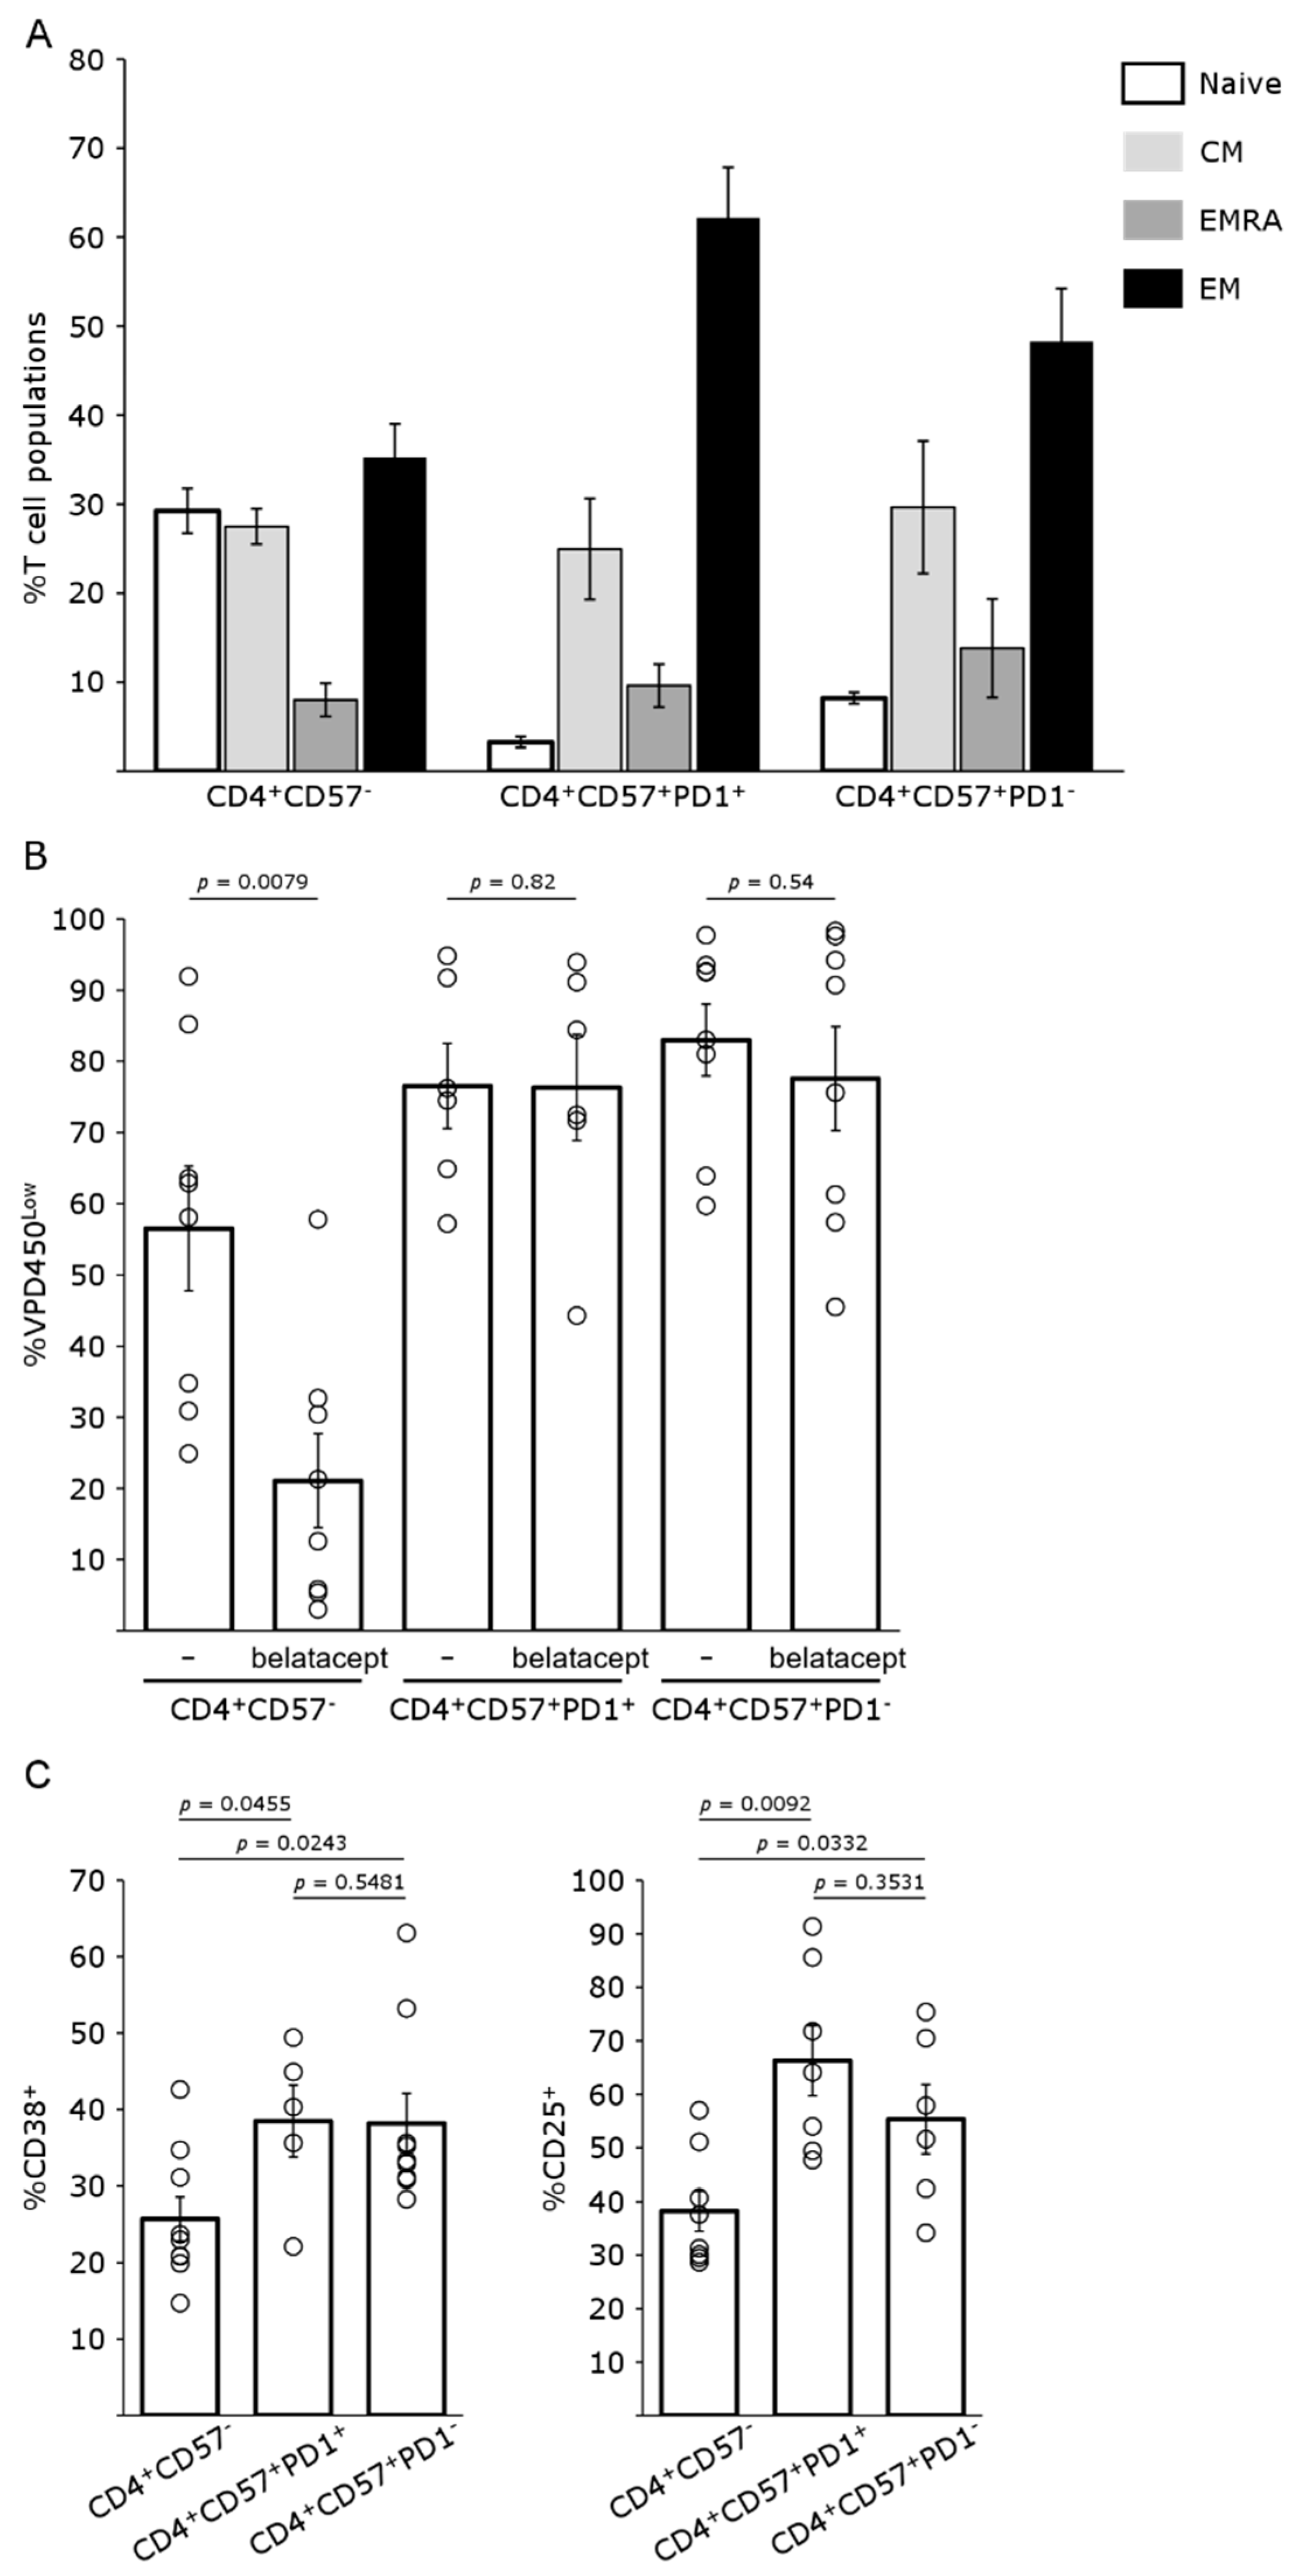
4.1. CD4+CD57+PD1− Cells Are Resistant to Belatacept
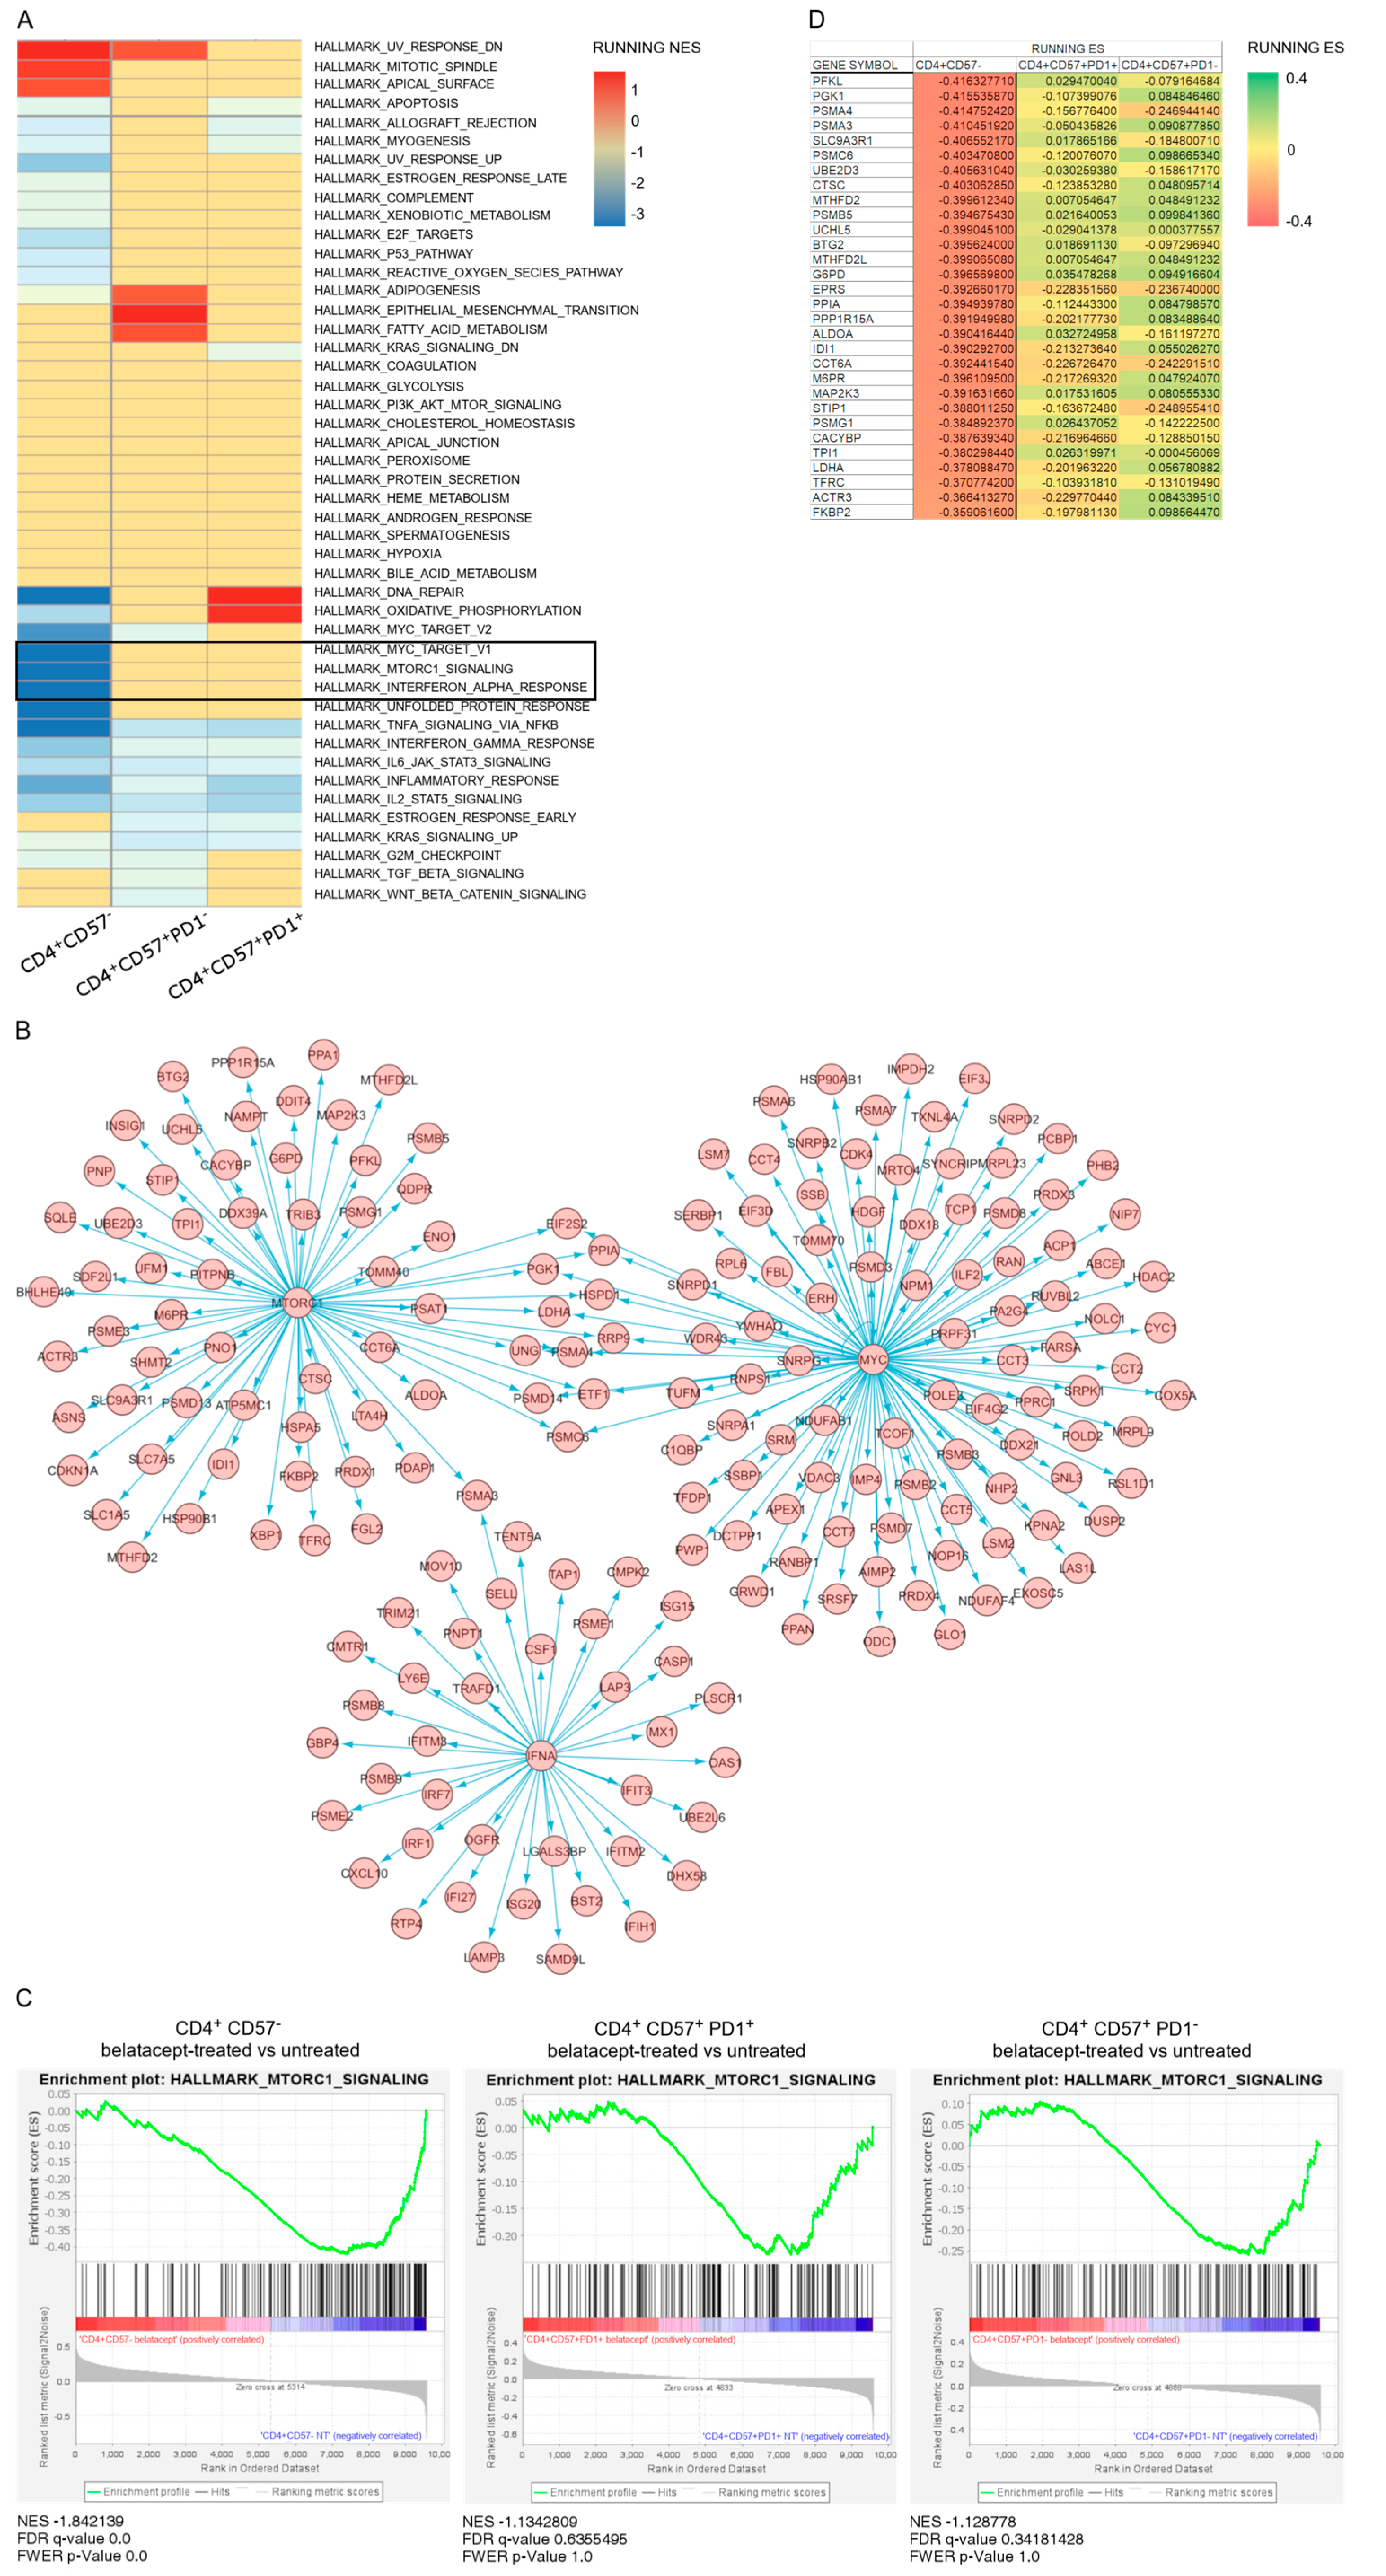
4.2. Pathways Differentially Regulated by Belatacept during Early Activation of CD4+CD57 Sub Populations
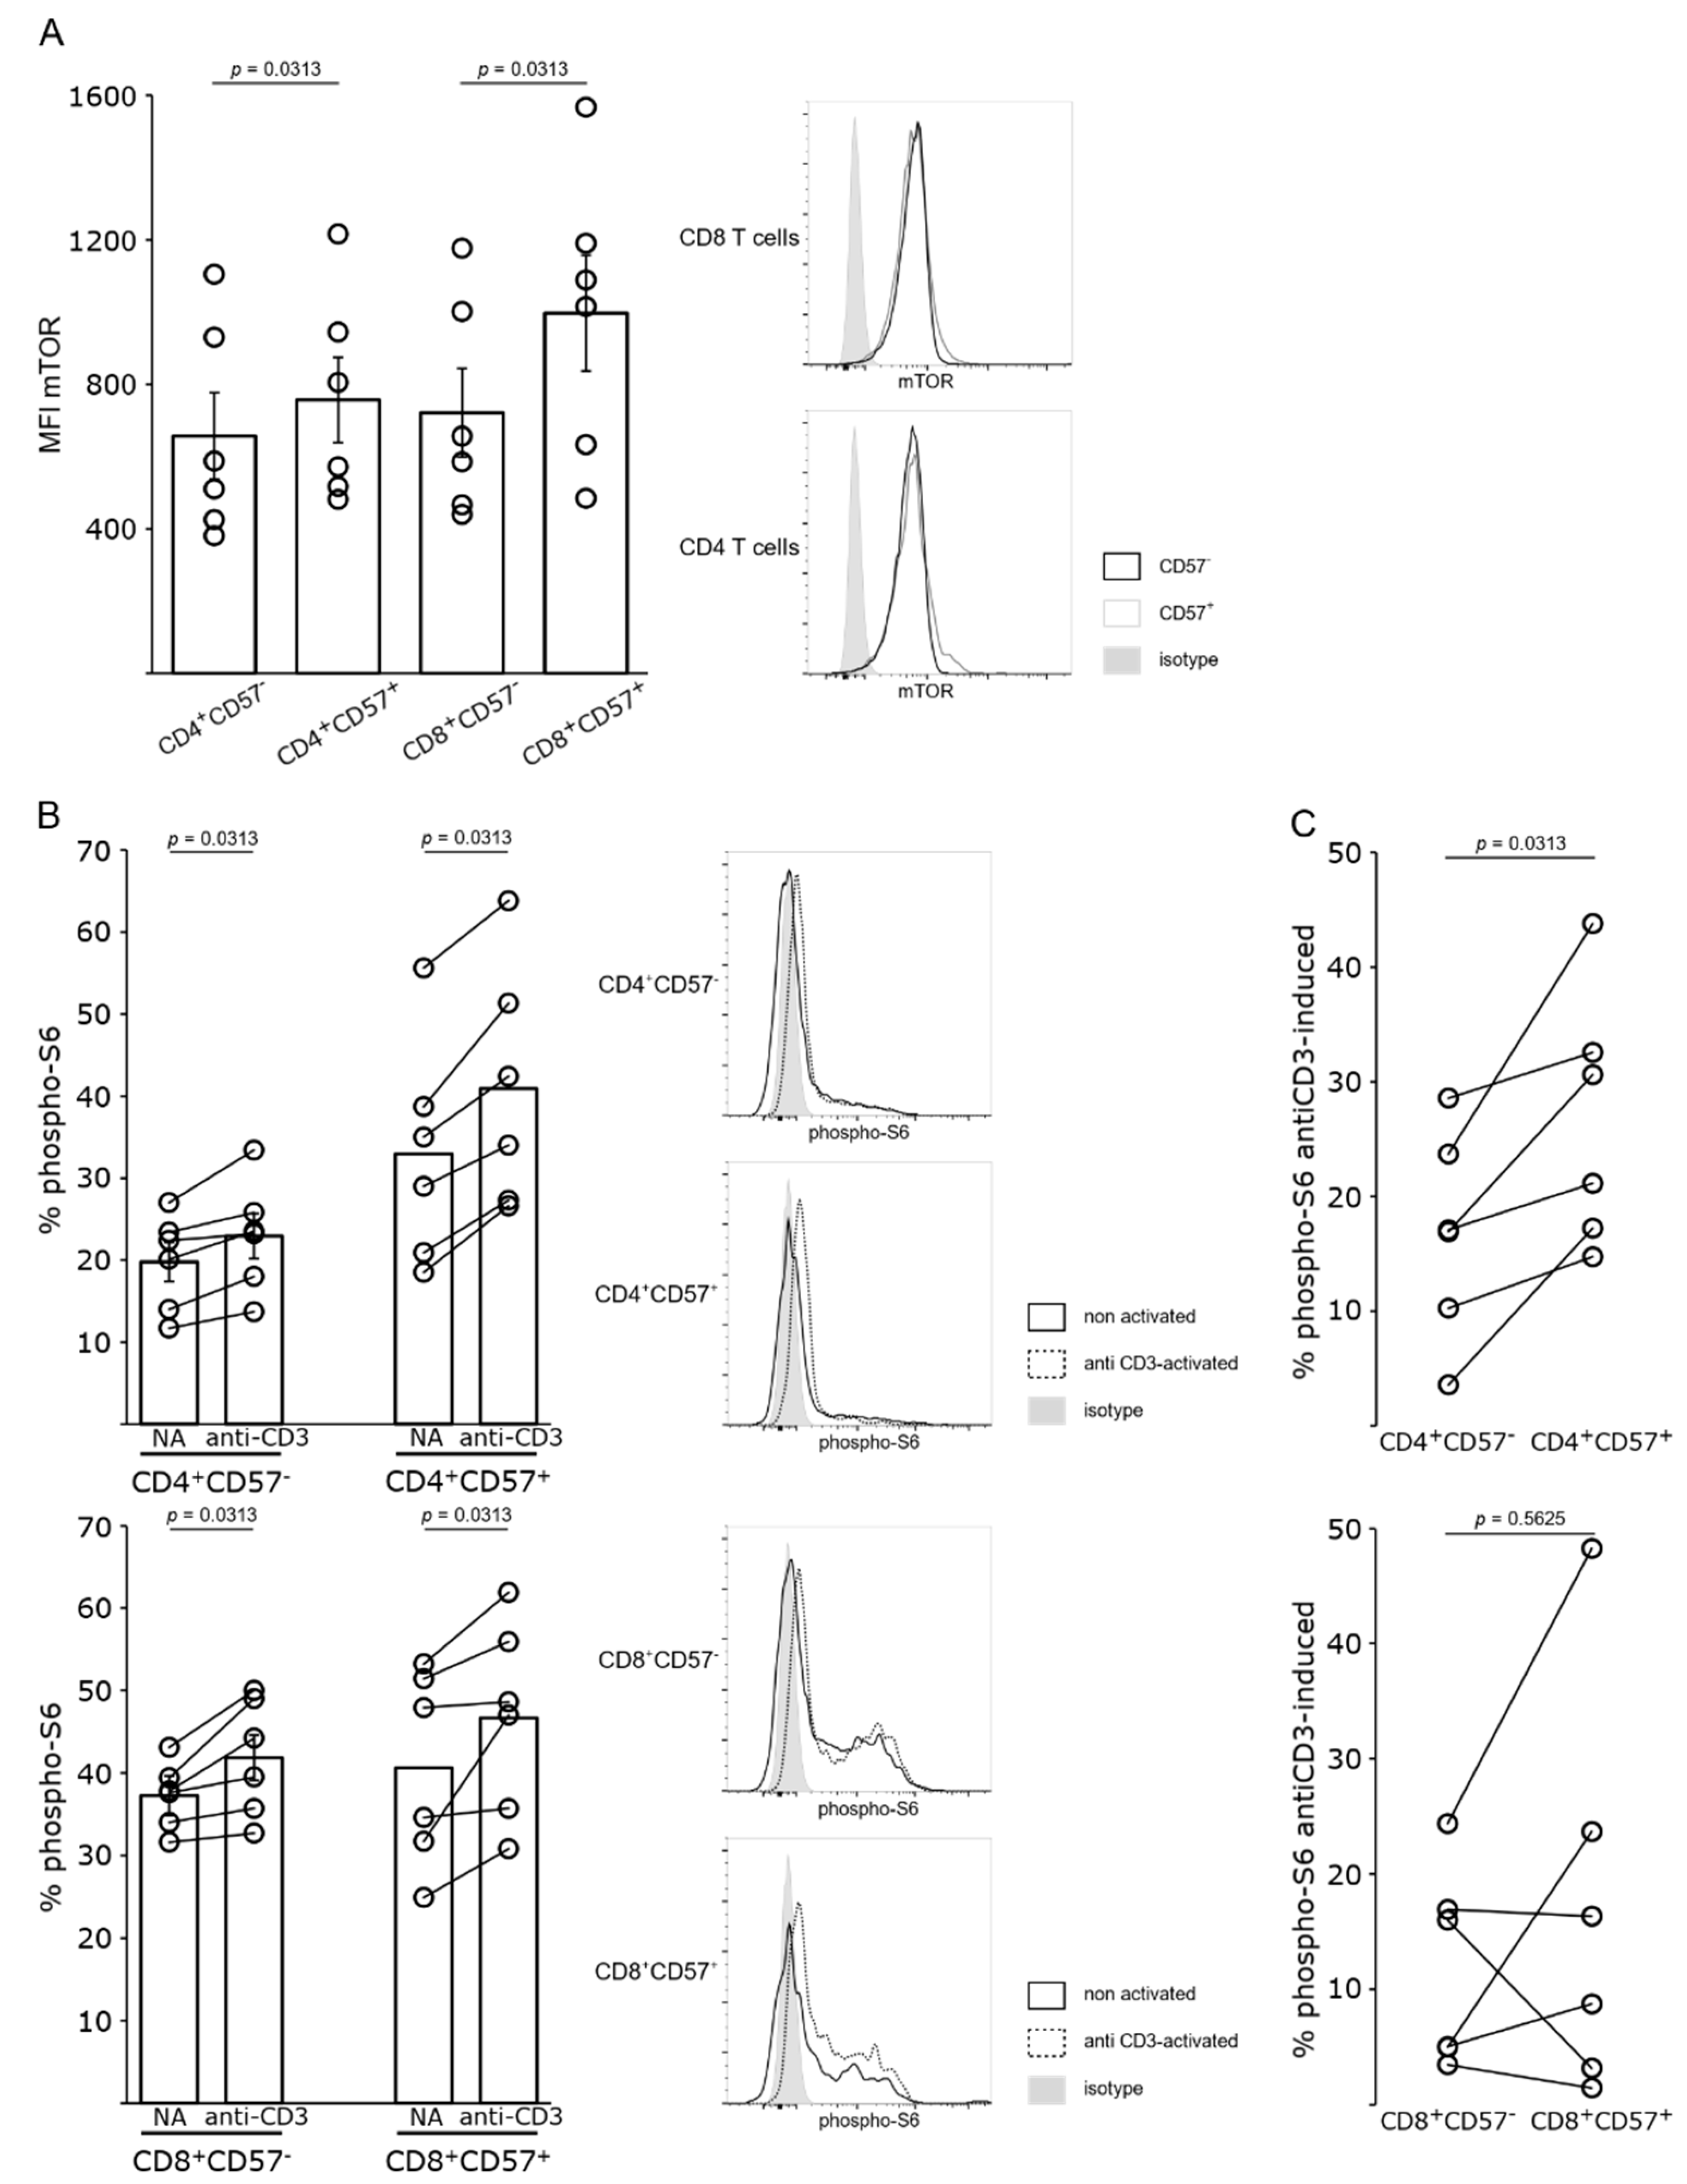
4.3. mTOR Pathway Is Activated in Belatacept-Resistant T Cells
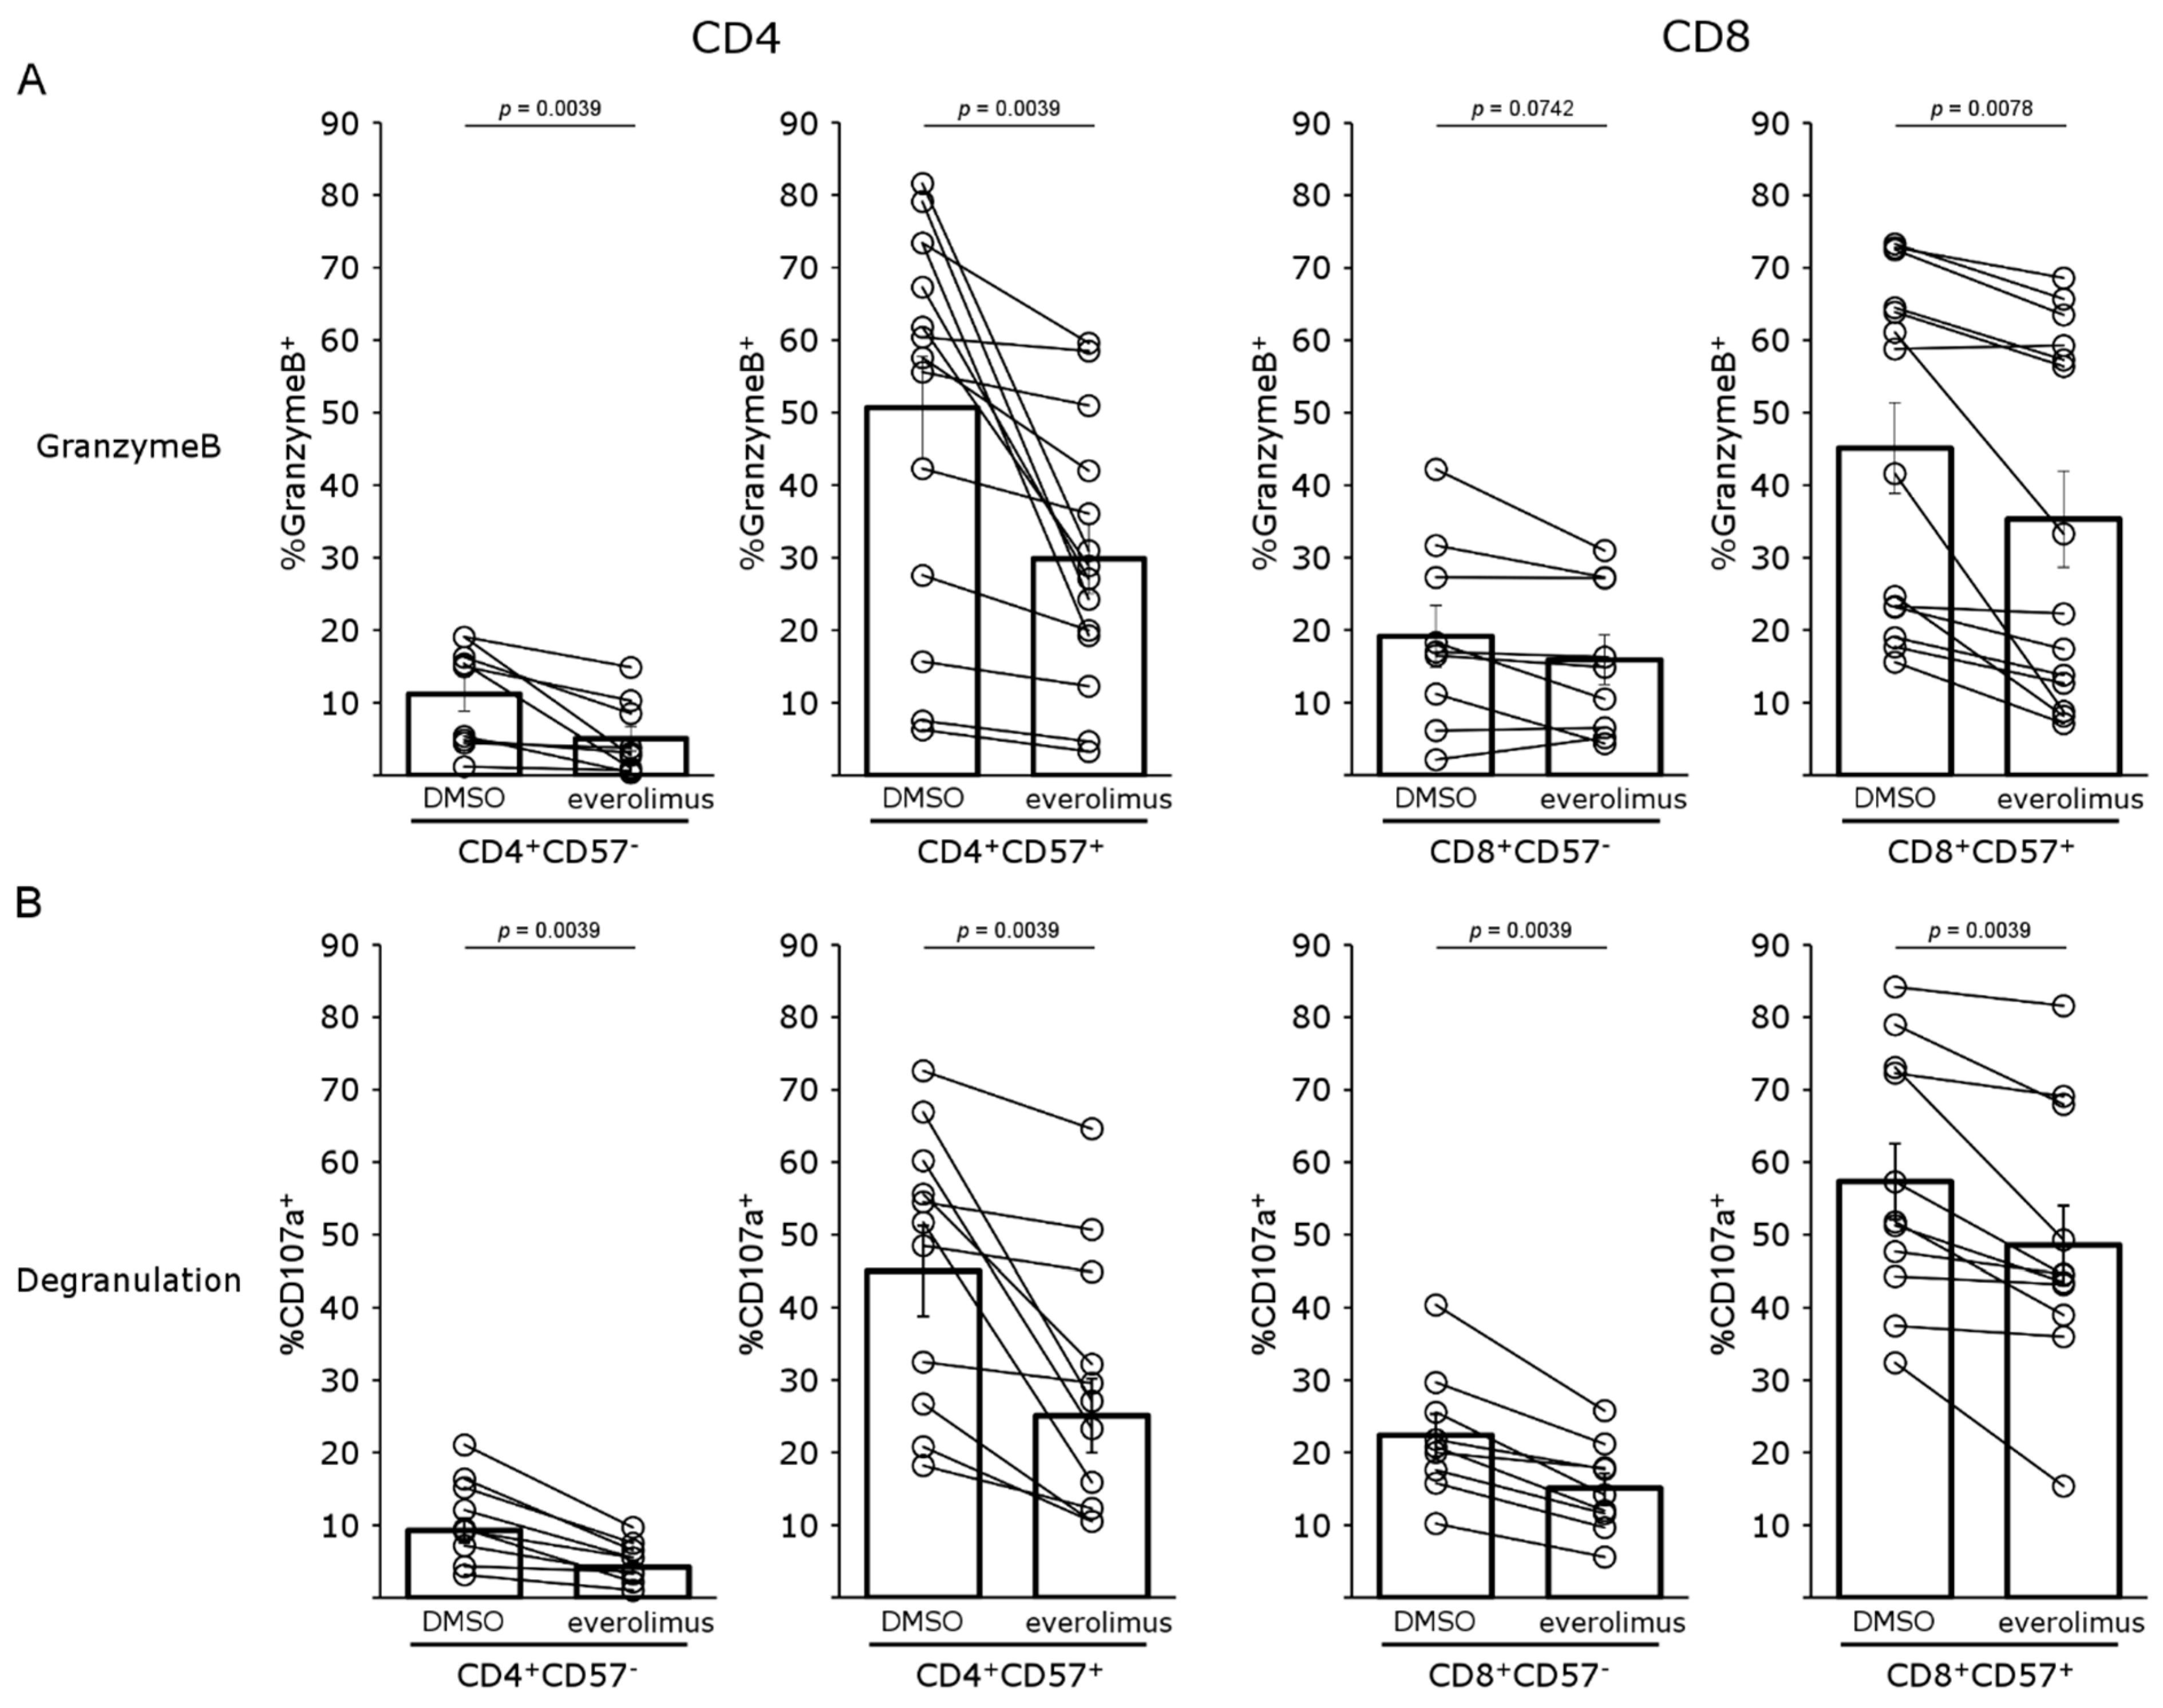
4.4. mTOR Inhibition Impairs T-Cell Proliferation and Activation of Both CD57− and CD57+ T Cells
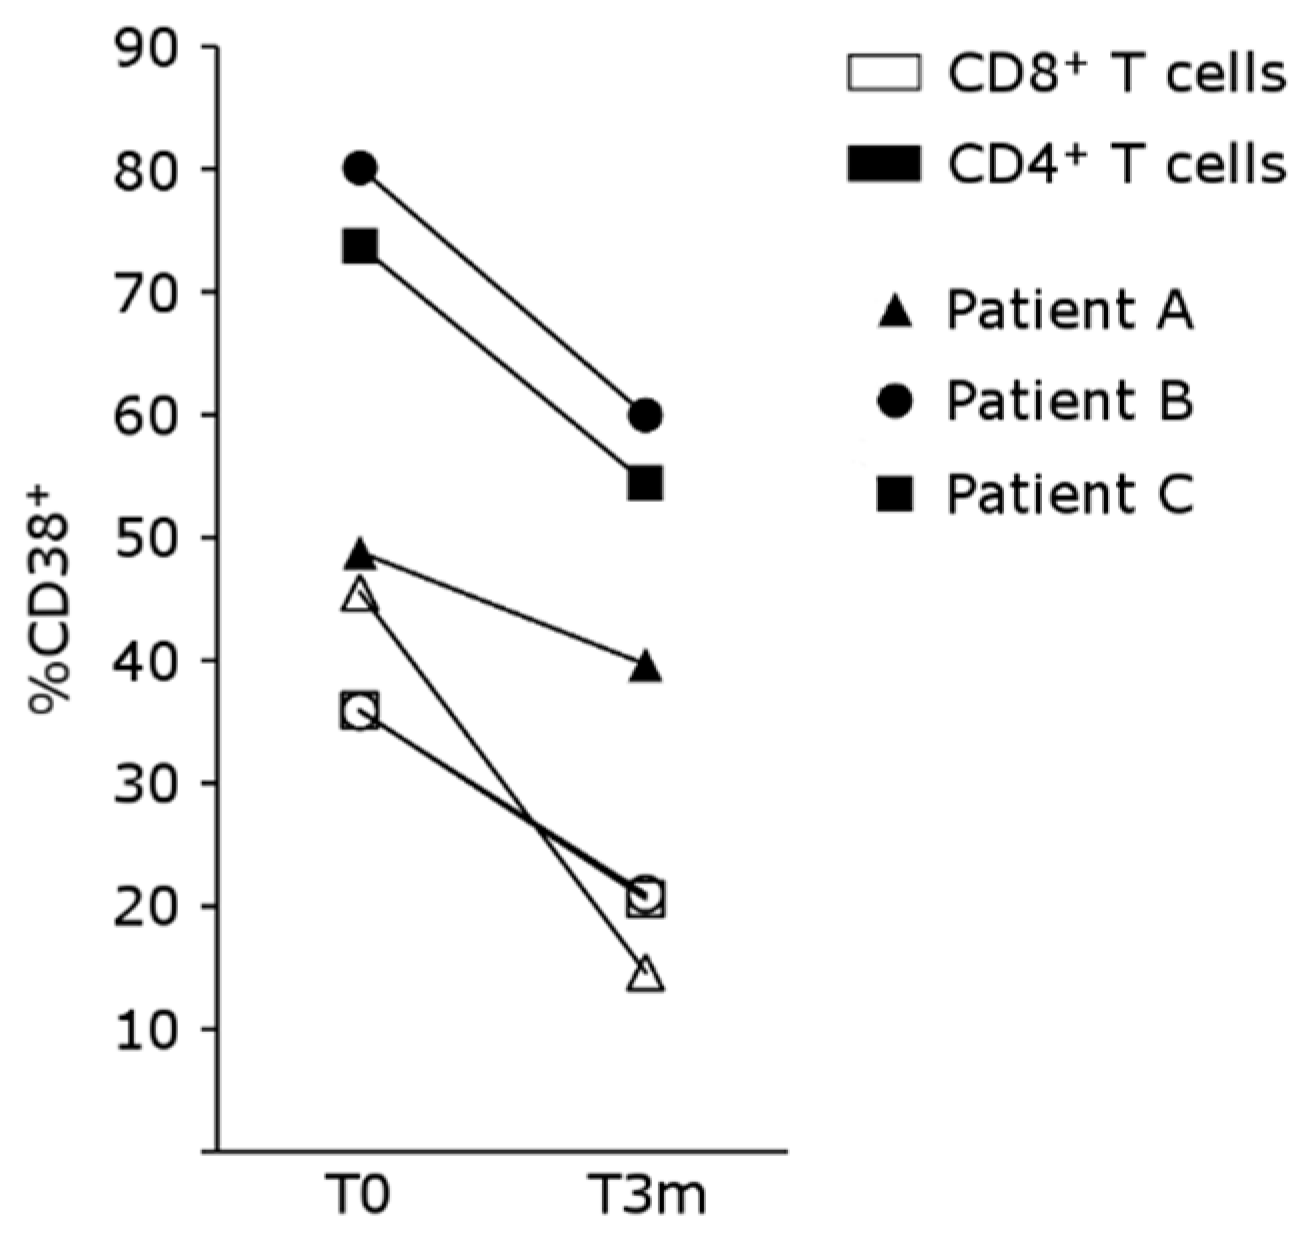
4.5. mTOR Inhibition Regulates T-Cell Activation in Patients Treated with Belatacept
5. Discussion
Supplementary Materials
Author Contributions
Funding
Institutional Review Board Statement
Informed Consent Statement
Data Availability Statement
Conflicts of Interest
References
- Lamb, K.E.; Lodhi, S.; Meier-Kriesche, H.-U. Long-Term Renal Allograft Survival in the United States: A Critical Reappraisal. Am. J. Transplant. 2011, 11, 450–462. [Google Scholar] [CrossRef] [PubMed]
- Vincenti, F.; Rostaing, L.; Grinyo, J.; Rice, K.; Steinberg, S.; Gaite, L.; Moal, M.-C.; Mondragon-Ramirez, G.A.; Kothari, J.; Polinsky, M.S.; et al. Belatacept and Long-Term Outcomes in Kidney Transplantation. N. Engl. J. Med. 2016, 374, 333–343. [Google Scholar] [CrossRef] [PubMed]
- Vincenti, F.; Larsen, C.P.; Alberu, J.; Bresnahan, B.; Garcia, V.D.; Kothari, J.; Lang, P.; Urrea, E.M.; Massari, P.; Mondragon-Ramirez, G.; et al. Three-Year Outcomes from BENEFIT, a Randomized, Active-Controlled, Parallel-Group Study in Adult Kidney Transplant Recipients. Am. J. Transplant. 2011, 12, 210–217. [Google Scholar] [CrossRef]
- Durrbach, A.; Pestana, J.M.; Florman, S.; Del Carmen Rial, M.; Rostaing, L.; Kuypers, D.; Matas, A.; Wekerle, T.; Polinsky, M.; Meier-Kriesche, H.U.; et al. Long-Term Outcomes in Belatacept- Versus Cyclosporine-Treated Recipients of Extended Criteria Donor Kidneys: Final Results From BENEFIT-EXT, a Phase III Randomized Study. Am. J. Transplant. 2016, 16, 3192–3201. [Google Scholar] [CrossRef] [PubMed]
- Durrbach, A.; Pestana, J.M.; Pearson, T.; Vincenti, F.; Garcia, V.D.; Campistol, J.; del Carmen Rial, M.; Florman, S.; Block, A.; Di Russo, G.; et al. A Phase III Study of Belatacept Versus Cyclosporine in Kidney Transplants from Extended Criteria Donors (BENEFIT-EXT Study). Am. J. Transplant. 2010, 10, 547–557. [Google Scholar] [CrossRef]
- Bray, R.A.; Gebel, H.M.; Townsend, R.; Roberts, M.E.; Polinsky, M.; Yang, L.; Meier-Kriesche, H.-U.; Larsen, C.P. De novo donor-specific antibodies in belatacept-treated vs cyclosporine-treated kidney-transplant recipients: Post hoc analyses of the randomized phase III BENEFIT and BENEFIT-EXT studies. Am. J. Transplant. 2018, 18, 1783–1789. [Google Scholar] [CrossRef] [PubMed]
- Cortes-Cerisuelo, M.; Laurie, S.J.; Mathews, D.V.; Winterberg, P.D.; Larsen, C.P.; Adams, A.B.; Ford, M.L. Increased Pretransplant Frequency of CD28+ CD4+ TEM Predicts Belatacept-Resistant Rejection in Human Renal Transplant Recipients. Am. J. Transplant. 2017, 17, 2350–2362. [Google Scholar] [CrossRef]
- Espinosa, J.; Herr, F.; Tharp, G.; Bosinger, S.; Song, M.; Farris, A., 3rd; George, R.; Cheeseman, J.; Stempora, L.; Townsend, R.; et al. CD57+CD4 T Cells Underlie Belatacept-Resistant Allograft Rejection. Am. J. Transplant. 2016, 16, 1102–1112. [Google Scholar] [CrossRef]
- Espinosa, J.R.; Samy, K.P.; Kirk, A.D. Memory T cells in organ transplantation: Progress and challenges. Nat. Rev. Nephrol. 2016, 12, 339–347. [Google Scholar] [CrossRef]
- Herr, F.; Desterke, C.; Bargiel, K.; Vernochet, A.; Vanhove, B.; Vadanici, R.; Ye, F.; Dekeyser, M.; Durrbach, A. The proliferation of belatacept-resistant T cells requires early IFNα pathway activation. Am. J. Transplant. 2022, 22, 489–503. [Google Scholar] [CrossRef]
- Vilchez, V.; Turcios, L.; Butterfield, D.A.; Mitov, M.I.; Coquillard, C.L.; Brandon, J.A.; Cornea, V.; Gedaly, R.; Marti, F. Evidence of the immunomodulatory role of dual PI3K/mTOR inhibitors in transplantation: An experimental study in mice. Transpl. Int. 2017, 30, 1061–1074. [Google Scholar] [CrossRef] [PubMed]
- Herrero-Sánchez, M.C.; Rodríguez-Serrano, C.; Almeida, J.; San Segundo, L.; Inogés, S.; Santos-Briz, Á.; García-Briñón, J.; Corchete, L.A.; San Miguel, J.F.; Del Cañizo, C.; et al. Targeting of PI3K/AKT/mTOR pathway to inhibit T cell activation and prevent graft-versus-host disease development. J. Hematol. Oncol. 2016, 9, 113. [Google Scholar] [CrossRef] [PubMed]
- Traitanon, O.; Mathew, J.M.; La Monica, G.; Xu, L.; Mas, V.; Gallon, L. Differential Effects of Tacrolimus versus Sirolimus on the Proliferation, Activation and Differentiation of Human B Cells. PLoS ONE 2015, 10, e0129658. [Google Scholar] [CrossRef] [PubMed]
- Gallon, L.; Traitanon, O.; Yu, Y.; Shi, B.; Leventhal, J.R.; Miller, J.; Mas, V.; Xu, L.; Mathew, J.M. Differential Effects of Calcineurin and Mammalian Target of Rapamycin Inhibitors on Alloreactive Th1, Th17, and Regulatory T Cells. Transplantation 2015, 99, 1774–1784. [Google Scholar] [CrossRef]
- Powell, J.D.; Lerner, C.G.; Schwartz, R.H. Inhibition of cell cycle progression by rapamycin induces T cell clonal anergy even in the presence of costimulation. J. Immunol. 1999, 162, 2775–2784. [Google Scholar] [CrossRef]
- Ferguson, R.; Grinyó, J.; Vincenti, F.; Kaufman, D.B.; Woodle, E.S.; Marder, B.A.; Citterio, F.; Marks, W.H.; Agarwal, M.; Wu, D.; et al. Immunosuppression with Belatacept-Based, Corticosteroid-Avoiding Regimens in De Novo Kidney Transplant Recipients. Am. J. Transplant. 2011, 11, 66–76. [Google Scholar] [CrossRef] [PubMed]
- Woodle, E.S.; Peddi, V.R.; Tomlanovich, S.; Mulgaonkar, S.; Kuo, P.C. A prospective, randomized, multicenter study evaluating early corticosteroid withdrawal with Thymoglobulin® in living-donor kidney transplantation. Clin. Transplant. 2010, 24, 73–83. [Google Scholar] [CrossRef] [PubMed]
- Kirk, A.D.; Adams, A.B.; Durrbach, A.; Ford, M.L.; Hildeman, D.A.; Larsen, C.P.; Vincenti, F.; Wojciechowski, D.; Woodle, E.S. Optimization of de novo belatacept-based immunosuppression administered to renal transplant recipients. Am. J. Transplant. 2020, 21, 1691–1698. [Google Scholar] [CrossRef] [PubMed]
- Subramanian, A.; Tamayo, P.; Mootha, V.K.; Mukherjee, S.; Ebert, B.L.; Gillette, M.A.; Paulovich, A.; Pomeroy, S.L.; Golub, T.R.; Lander, E.S.; et al. Gene set enrichment analysis: A knowledge-based approach for interpreting genome-wide expression profiles. Proc. Natl. Acad. Sci. USA 2005, 102, 15545–15550. [Google Scholar] [CrossRef] [PubMed]
- Mootha, V.K.; Lindgren, C.M.; Eriksson, K.-F.; Subramanian, A.; Sihag, S.; Lehar, J.; Puigserver, P.; Carlsson, E.; Ridderstråle, M.; Laurila, E.; et al. PGC-1α-responsive genes involved in oxidative phosphorylation are coordinately downregulated in human diabetes. Nat. Genet. 2003, 34, 267–273. [Google Scholar] [CrossRef]
- Vanrenterghem, Y.; Bresnahan, B.; Campistol, J.; Durrbach, A.; Grinyó, J.; Neumayer, H.-H.; Lang, P.; Larsen, C.P.; Mancilla-Urrea, E.; Pestana, J.M.; et al. Belatacept-Based Regimens Are Associated With Improved Cardiovascular and Metabolic Risk Factors Compared With Cyclosporine in Kidney Transplant Recipients (BENEFIT and BENEFIT-EXT Studies). Transplantation 2011, 91, 976–983. [Google Scholar] [CrossRef] [PubMed]
- van der Zwan, M.; Baan, C.C.; Colvin, R.B.; Smith, R.N.; White, R.A.; Ndishabandi, D.; Nigg, A.L.; van den Bosch, T.P.P.; de Graav, G.N.; Clahsen-van Groningen, M.C.; et al. Immunomics of Renal Allograft Acute T Cell-Mediated Rejection Biopsies of Tacrolimus- and Belatacept-Treated Patients. Transplant. Direct. 2019, 5, e418. [Google Scholar] [CrossRef] [PubMed]
- de Graav, G.N.; Hesselink, D.A.; Dieterich, M.; Kraaijeveld, R.; Weimar, W.; Baan, C.C. Down-Regulation of Surface CD28 under Belatacept Treatment: An Escape Mechanism for Antigen-Reactive T-Cells. PLoS ONE 2016, 11, e0148604. [Google Scholar] [CrossRef]
- Ahmed, R.; Miners, K.L.; Lahoz-Beneytez, J.; Jones, R.E.; Roger, L.; Baboonian, C.; Zhang, Y.; Wang, E.C.; Hellerstein, M.K.; McCune, J.M.; et al. CD57+ Memory T Cells Proliferate In Vivo. Cell Rep. 2020, 33, 108501. [Google Scholar] [CrossRef] [PubMed]
- Saxton, R.A.; Sabatini, D.M. mTOR Signaling in Growth, Metabolism, and Disease. Cell 2017, 168, 960–976. [Google Scholar] [CrossRef] [PubMed]
- Kim, J.; Guan, K.-L. mTOR as a central hub of nutrient signalling and cell growth. Nat. Cell Biol. 2019, 21, 63–71. [Google Scholar] [CrossRef] [PubMed]
- Mossmann, D.; Park, S.; Hall, M.N. mTOR signalling and cellular metabolism are mutual determinants in cancer. Nat. Rev. Cancer 2018, 18, 744–757. [Google Scholar] [CrossRef]
- Huang, H.; Long, L.; Zhou, P.; Chapman, N.M.; Chi, H. mTOR signaling at the crossroads of environmental signals and T-cell fate decisions. Immunol. Rev. 2020, 295, 15–38. [Google Scholar] [CrossRef]
- Castro-Rojas, C.M.; Godarova, A.; Shi, T.; Hummel, S.A.; Shields, A.; Tremblay, S.; Alloway, R.R.; Jordan, M.B.; Woodle, E.S.; Hildeman, D.A. mTOR Inhibitor Therapy Diminishes Circulating CD8+ CD28− Effector Memory T Cells and Improves Allograft Inflammation in Belatacept-refractory Renal Allograft Rejection. Transplantation 2020, 104, 1058–1069. [Google Scholar] [CrossRef]
- Wullschleger, S.; Loewith, R.; Hall, M.N. TOR Signaling in Growth and Metabolism. Cell 2006, 124, 471–484. [Google Scholar] [CrossRef]
- Sparks, C.A.; Guertin, D.A. Targeting mTOR: Prospects for mTOR complex 2 inhibitors in cancer therapy. Oncogene 2010, 29, 3733–3744. [Google Scholar] [CrossRef] [PubMed]
- Mannon, R.B.; Armstrong, B.; Stock, P.G.; Mehta, A.K.; Farris, A.B.; Watson, N.; Morrison, Y.; Sarwal, M.; Sigdel, T.; Bridges, N.; et al. Avoidance of CNI and steroids using belatacept—Results of the Clinical Trials in Organ Transplantation 16 trial. Am. J. Transplant. 2020, 20, 3599–3608. [Google Scholar] [CrossRef] [PubMed]


| A | B | C | |
|---|---|---|---|
| Age | 59 | 43 | 71 |
| Sex | M | F | M |
| Disease | Idiopathic pulmonary fibrosis | Sarcoidosis with pulmonary fibrosis | Nephroangiosclerosis |
| Type of Tx | Lung | Lung | Kidney |
| Age at Tx (years) | 58 | 43 | 70 |
| Transplantation rank | 1 | 2 | 1 |
| Induction therapy | rIL2 | Thymoglobulin | Thymoglobulin |
| Maintenance therapy | |||
| CNI | Cyclosporin | Cyclosporin | Tacrolimus |
| Anti-metabolites | MMF | MMF | MMF |
| Steroids | Yes | Yes | Yes |
| Rejection Y/N | N | N | N |
| Time to the switch to belatacept (months) | 2 | 2 | 3 |
| Reason for switch | TMA | TMA | TMA |
| eGFR at switch | 19 | 55 | 22 |
| eGFR after switch (3 months) | 59 | 84 | 34 |
| Maintenance therapy after switch to | |||
| belatacept | Yes | Yes | Yes |
| Anti-metabolites | MMF | Azathioprine | MMF |
| Steroids | Yes | Yes | Yes |
| Other treatments | PEx—soliris | PEx—oliris | PEx |
| DSA at switch | Neg | Pos (MFI 2000) | Neg |
| De novo DSA after switch | Neg | Neg | Neg |
| Number of rejection episodes since switch to belatacept | 1 | 2 | 1 |
| Treatment of rejection | Steroids 1 mg/kg, with a stepwise decrease | For the first episode, an increase in steroid dose. For the second episode, none, because of concomitant infection | Steroid boluses |
| Time to imTOR introduction (months) | 16 | 14 | 12 |
| Certican trough concentration (ng/mL) | 3.7 | 2 | 4.9 |
| A | B | C | ||||
|---|---|---|---|---|---|---|
| T0 | T3m | T0 | T3m | T0 | T3m | |
| CD3 in Ly45 (%) | 87.6 | 86.7 | 79.7 | 75.4 | 88.2 | 88.1 |
| CD4 in CD3 (%) | 23.4 | 15.3 | 20.6 | 35.3 | 28.1 | 34.7 |
| CD45RA−CCR7+ (CM) in CD4 (%) | 32.7 | 37.2 | 57.7 | 57.6 | 28.2 | 40.4 |
| CD45RA+CCR7+ (naive) in CD4 (%) | 41.7 | 42.5 | 15.2 | 21 | 2.9 | 4.3 |
| CD45RA−CCR7− (EM) in CD4 (%) | 23.2 | 17.1 | 26.9 | 20 | 50.2 | 40.6 |
| CD45RA+CCR7− (EMRA) in CD4 (%) | 2.1 | 3 | 0.1 | 0.6 | 18.4 | 14.5 |
| HLA-DR in CD4 (%) | 0.7 | 2 | 9.4 | 9 | 34.4 | 16.5 |
| CD57 in CD4 (%) | 3.8 | 10.7 | 9.3 | 9.7 | 39.4 | 29.8 |
| CD38 in CD4 (%) | 45.5 | 14.6 | 35.9 | 20.6 | 35.8 | 20.9 |
| CD8 in CD3 (%) | 72.9 | 80.9 | 52.4 | 44.6 | 65.5 | 59.4 |
| CD45RA−CCR7+ (CM) in CD8 (%) | 3.7 | 1.3 | 1.8 | 3.5 | 1.5 | 2.8 |
| CD45RA+CCR7+ (naive) in CD8 (%) | 7.5 | 5.6 | 7.2 | 16.7 | 0.8 | 1.2 |
| CD45RA−CCR7− (EM) in CD8 (%) | 41.3 | 27.2 | 53.5 | 27.7 | 18.8 | 30.3 |
| CD45RA+CCR7− (EMRA) in CD8 (%) | 47.2 | 65.8 | 37.4 | 52 | 78.7 | 65.5 |
| HLA-DR in CD4 (%) | 6.2 | 15.1 | 42 | 7 | 64 | 38.9 |
| CD57 in CD8 (%) | 71.1 | 82.7 | 43.4 | 49.5 | 63.7 | 54 |
| CD38 in CD8 (%) | 48.8 | 39.6 | 73.7 | 54.4 | 80.1 | 59.9 |
Disclaimer/Publisher’s Note: The statements, opinions and data contained in all publications are solely those of the individual author(s) and contributor(s) and not of MDPI and/or the editor(s). MDPI and/or the editor(s) disclaim responsibility for any injury to people or property resulting from any ideas, methods, instructions or products referred to in the content. |
© 2023 by the authors. Licensee MDPI, Basel, Switzerland. This article is an open access article distributed under the terms and conditions of the Creative Commons Attribution (CC BY) license (https://creativecommons.org/licenses/by/4.0/).
Share and Cite
Herr, F.; Dekeyser, M.; Le Pavec, J.; Desterke, C.; Chiron, A.-S.; Bargiel, K.; Mercier, O.; Vernochet, A.; Fadel, E.; Durrbach, A. mTOR Inhibition Impairs the Activation and Function of Belatacept-Resistant CD4+CD57+ T Cells In Vivo and In Vitro. Pharmaceutics 2023, 15, 1299. https://doi.org/10.3390/pharmaceutics15041299
Herr F, Dekeyser M, Le Pavec J, Desterke C, Chiron A-S, Bargiel K, Mercier O, Vernochet A, Fadel E, Durrbach A. mTOR Inhibition Impairs the Activation and Function of Belatacept-Resistant CD4+CD57+ T Cells In Vivo and In Vitro. Pharmaceutics. 2023; 15(4):1299. https://doi.org/10.3390/pharmaceutics15041299
Chicago/Turabian StyleHerr, Florence, Manon Dekeyser, Jerome Le Pavec, Christophe Desterke, Andrada-Silvana Chiron, Karen Bargiel, Olaf Mercier, Amelia Vernochet, Elie Fadel, and Antoine Durrbach. 2023. "mTOR Inhibition Impairs the Activation and Function of Belatacept-Resistant CD4+CD57+ T Cells In Vivo and In Vitro" Pharmaceutics 15, no. 4: 1299. https://doi.org/10.3390/pharmaceutics15041299