
Infant Exposure to Antituberculosis Drugs via Breast Milk and Assessment of Potential Adverse Effects in Breastfed Infants: Critical Review of Data
Abstract
:
1. Introduction
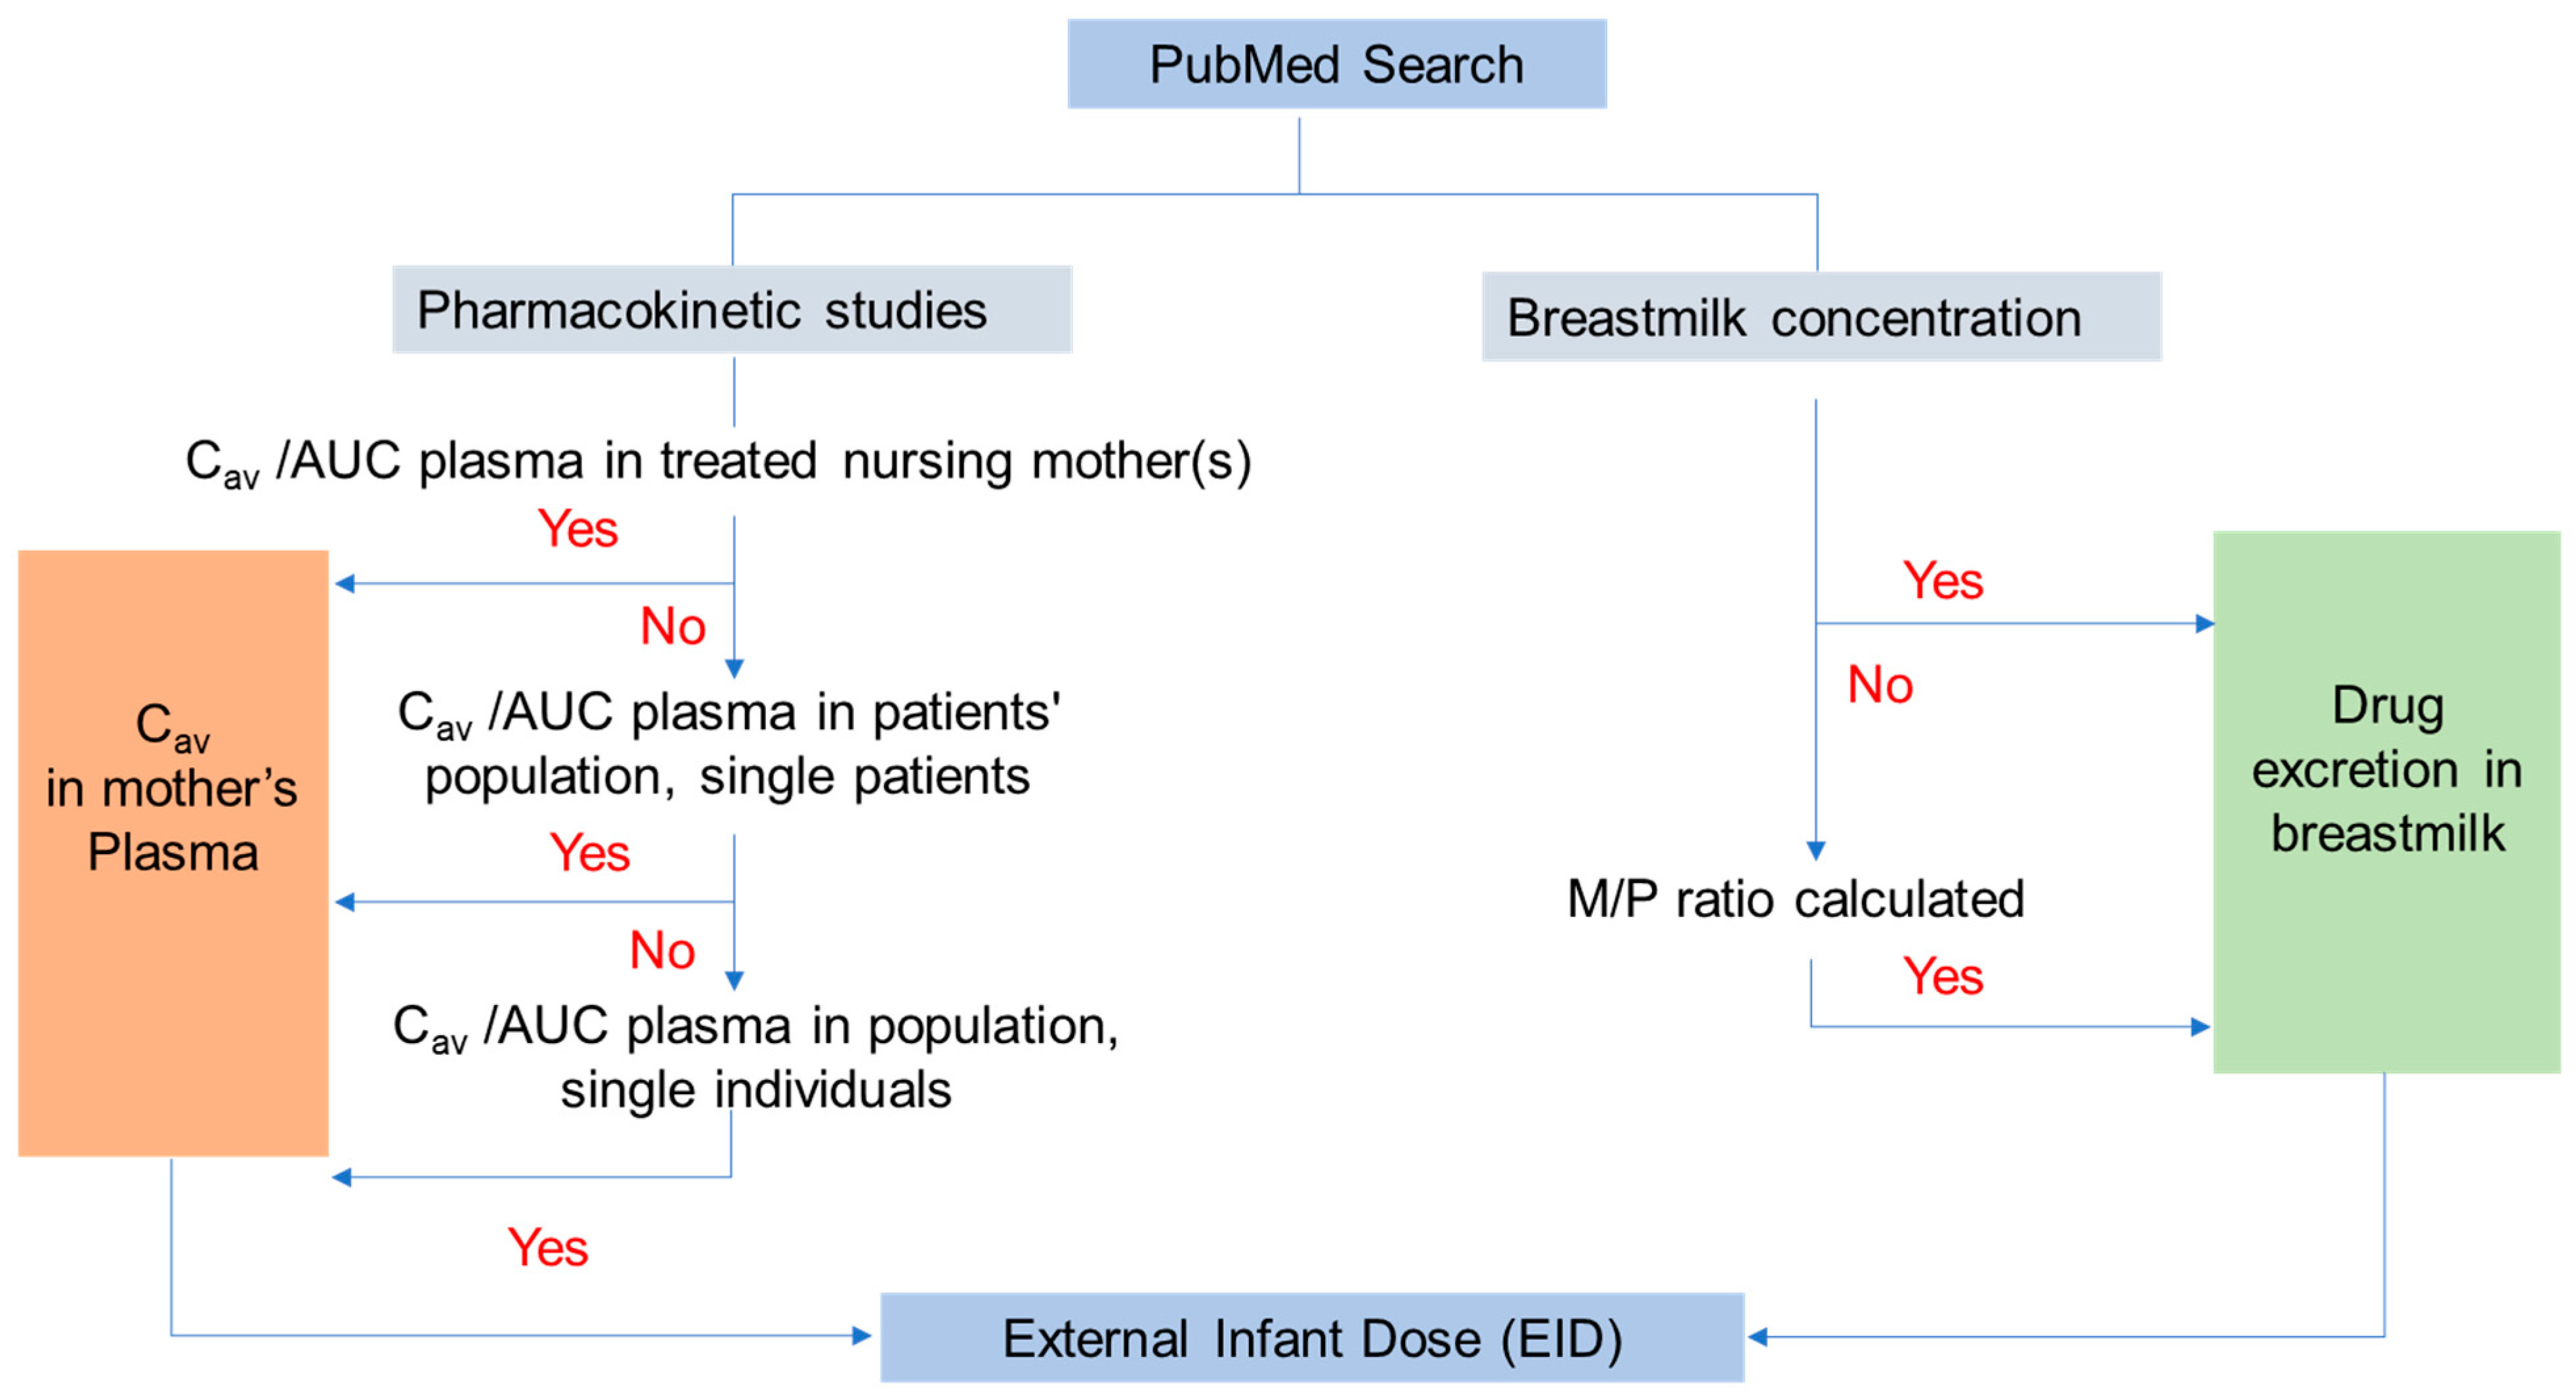
2. Methods
3. Results
3.1. Bedaquiline
3.1.1. Kinetics
3.1.2. M:P Ratio
3.1.3. Infant Dose
3.1.4. Adverse Effects
3.2. Clofazimine
3.2.1. Kinetics
3.2.2. M:P Ratio
3.2.3. Infant Dose
3.2.4. Adverse Effects
3.3. Cycloserine/Terizidone
3.3.1. Kinetics
3.3.2. M:P Ratio
3.3.3. Infant Dose
3.3.4. Adverse Effects
3.4. Levofloxacin
3.4.1. Kinetics
3.4.2. M:P Ratio:
3.4.3. Infant Dose
3.4.4. Adverse Effects
3.5. Linezolid
3.5.1. Kinetics
3.5.2. M:P Ratio
3.5.3. Infant Dose
3.5.4. Adverse Effects
3.6. Pretomanid
3.6.1. Kinetics
3.6.2. M:P Ratio
3.6.3. Infant Dose:
3.6.4. Adverse Effects
3.7. Pyrazinamide
3.7.1. Kinetics
3.7.2. M:P Ratio
3.7.3. Infant Dose
3.7.4. Adverse Effects
3.8. Streptomycin
3.8.1. Kinetics
3.8.2. M:P Ratio
3.8.3. Infant Dose
3.8.4. Adverse Effects
3.9. Ethambutol
3.9.1. Kinetics
3.9.2. M:P Ratio
3.9.3. Infant Dose
3.9.4. Adverse Effects
3.10. Rifampicin
3.10.1. Kinetics
3.10.2. M:P Ratio
3.10.3. Infant Dose
3.10.4. Adverse Effects
3.11. Isoniazid
3.11.1. Kinetics
3.11.2. M:P Ratio
3.11.3. Infant Dose
3.11.4. Adverse Effects
4. Discussion
5. Conclusions
6. Future Directions
Supplementary Materials
Author Contributions
Funding
Institutional Review Board Statement
Informed Consent Statement
Data Availability Statement
Conflicts of Interest
References
- WHO. Global Tuberculosis Report 2021; World Health Organization: Geneva, Switzerland, 2021. [Google Scholar]
- Bates, M.; Ahmed, Y.; Kapata, N.; Maeurer, M.; Mwaba, P.; Zumla, A. Perspectives on tuberculosis in pregnancy. Int. J. Infect. Dis. 2015, 32, 124–127. [Google Scholar] [CrossRef] [PubMed] [Green Version]
- Nordholm, A.C.; Suppli, C.H.; Norman, A.; Ekstrøm, C.T.; Ertberg, P.; Koch, A.; Lillebaek, T.; Andersen, A.B. Pregnancy and post-partum tuberculosis; a nationwide register-based case-control study, Denmark, 1990 to 2018. Euro Surveill 2022, 27, 2100949. [Google Scholar] [CrossRef] [PubMed]
- Pasipamire, M.; Broughton, E.; Mkhontfo, M.; Maphalala, G.; Simelane-Vilane, B.; Haumba, S. Detecting tuberculosis in pregnant and postpartum women in Eswatini. Afr. J. Lab. Med. 2020, 9, 837. [Google Scholar] [CrossRef]
- Nguenha, D.; Acacio, S.; Murias-Closas, A.; Ramanlal, N.; Saavedra, B.; Karajeanes, E.; Mudumane, B.; Mambuque, E.; Gomes, N.; Losada, I.; et al. Prevalence and clinical characteristics of pulmonary TB among pregnant and post-partum women. Int. J. Tuberc. Lung Dis. 2022, 26, 641–649. [Google Scholar] [CrossRef] [PubMed]
- Adjobimey, M.; Ade, S.; Wachinou, P.; Esse, M.; Yaha, L.; Bekou, W.; Campbell, J.R.; Toundoh, N.; Adjibode, O.; Attikpa, G.; et al. Prevalence, acceptability, and cost of routine screening for pulmonary tuberculosis among pregnant women in Cotonou, Benin. PLoS ONE 2022, 17, e0264206. [Google Scholar] [CrossRef] [PubMed]
- WHO. Health Topics. Malnutrition. Available online: https://www.who.int/health-topics/malnutrition#tab=tab_1 (accessed on 5 February 2023).
- WHO. WHO Consolidated Guidelines on Tuberculosis: Module 4: Treatment: Drug-Susceptible Tuberculosis Treatment; World Health Organization: Geneva, Switzerland, 2022. [Google Scholar]
- Loveday, M.; Hlangu, S.; Furin, J. Breastfeeding in women living with tuberculosis. Int. J. Tuberc. Lung Dis. 2020, 24, 880–891. [Google Scholar] [CrossRef]
- Lawrence, R.M.; Lawrence, R.A. Given the benefits of breastfeeding, what contraindications exist? Pediatr. Clin. N. Am. 2001, 48, 235–251. [Google Scholar] [CrossRef]
- Abduljalil, K.; Pan, X.; Pansari, A.; Jamei, M.; Johnson, T.N. A Preterm Physiologically Based Pharmacokinetic Model. Part I: Physiological Parameters and Model Building. Clin. Pharmacokinet. 2020, 59, 485–500. [Google Scholar] [CrossRef]
- Badée, J.; Fowler, S.; de Wildt, S.N.; Collier, A.C.; Schmidt, S.; Parrott, N. The Ontogeny of UDP-glucuronosyltransferase Enzymes, Recommendations for Future Profiling Studies and Application Through Physiologically Based Pharmacokinetic Modelling. Clin. Pharmacokinet. 2019, 58, 189–211. [Google Scholar] [CrossRef]
- Hale, T.W. Medications in breastfeeding mothers of preterm infants. Pediatr. Ann. 2003, 32, 337–347. [Google Scholar] [CrossRef]
- Rowe, H.; Baker, T.; Hale, T.W. Maternal medication, drug use, and breastfeeding. Pediatr. Clin. N. Am. 2013, 60, 275–294. [Google Scholar] [CrossRef] [PubMed]
- Garessus, E.D.G.; Mielke, H.; Gundert-Remy, U. Exposure of Infants to Isoniazid via Breast Milk After Maternal Drug Intake of Recommended Doses Is Clinically Insignificant Irrespective of Metaboliser Status. A Physiologically-Based Pharmacokinetic (PBPK) Modelling Approach to Estimate Drug Exposure of Infants via Breast-Feeding. Front. Pharmacol. 2019, 10, 5. [Google Scholar] [CrossRef] [PubMed]
- Partosch, F.; Mielke, H.; Stahlmann, R.; Gundert-Remy, U. Exposure of Nursed Infants to Maternal Treatment with Ethambutol and Rifampicin. Basic. Clin. Pharmacol. Toxicol. 2018, 123, 213–220. [Google Scholar] [CrossRef] [PubMed] [Green Version]
- Gafar, F.; Wasmann, R.E.; McIlleron, H.M.; Aarnoutse, R.E.; Schaaf, H.S.; Marais, B.J.; Agarwal, D.; Antwi, S.; Bang, N.D.; Bekker, A.; et al. Global estimates and determinants of antituberculosis drug pharmacokinetics in children and adolescents: A systematic review and individual patient data meta-analysis. Eur. Respir. J. 2022, 61, 2201596. [Google Scholar] [CrossRef] [PubMed]
- Abduljalil, K.; Pansari, A.; Ning, J.; Jamei, M. Prediction of drug concentrations in milk during breastfeeding, integrating predictive algorithms within a physiologically-based pharmacokinetic model. CPT Pharmacomet. Syst. Pharmacol. 2021, 10, 878–889. [Google Scholar] [CrossRef] [PubMed]
- EFSA Scientific Committee; Hardy, A.; Benford, D.; Halldorsson, T.; Jeger, M.J.; Knutsen, H.K.; More, S.; Naegeli, H.; Noteborn, H.; Ockleford, C. Guidance on the risk assessment of substances present in food intended for infants below 16 weeks of age. EFSA J. 2017, 15, e04849. [Google Scholar] [PubMed] [Green Version]
- WHO. WHO Operational Handbook on Tuberculosis. Module 5: Management of Tuberculosis in Children and Adolescents; World Health Organization: Geneva, Switzerland, 2022. [Google Scholar]
- Potter, J.; Capstick, T.; Ricketts, W.; Whitehead, N.; Kon, O. A UK-based resource to support the monitoring and safe use of anti-TB drugs and second-line treatment of multidrug-resistant TB. Thorax 2015, 70, 297–298. [Google Scholar] [CrossRef] [PubMed] [Green Version]
- Court, R.; Gausi, K.; Mkhize, B.; Wiesner, L.; Waitt, C.; McIlleron, H.; Maartens, G.; Denti, P.; Loveday, M. Bedaquiline exposure in pregnancy and breastfeeding in women with rifampicin-resistant tuberculosis. Br. J. Clin. Pharmacol. 2022, 88, 3548–3558. [Google Scholar] [CrossRef] [PubMed]
- Svensson, E.M.; Dosne, A.G.; Karlsson, M.O. Population Pharmacokinetics of Bedaquiline and Metabolite M2 in Patients With Drug-Resistant Tuberculosis: The Effect of Time-Varying Weight and Albumin. CPT Pharmacomet. Syst. Pharmacol. 2016, 5, 682–691. [Google Scholar] [CrossRef] [Green Version]
- McLeay, S.C.; Vis, P.; van Heeswijk, R.P.; Green, B. Population pharmacokinetics of bedaquiline (TMC207), a novel antituberculosis drug. Antimicrob. Agents Chemother. 2014, 58, 5315–5324. [Google Scholar] [CrossRef] [Green Version]
- Kurosawa, K.; Rossenu, S.; Biewenga, J.; Ouwerkerk-Mahadevan, S.; Willems, W.; Ernault, E.; Kambili, C. Population Pharmacokinetic Analysis of Bedaquiline-Clarithromycin for Dose Selection Against Pulmonary Nontuberculous Mycobacteria Based on a Phase 1, Randomized, Pharmacokinetic Study. J. Clin. Pharmacol. 2021, 61, 1344–1355. [Google Scholar] [CrossRef] [PubMed]
- Isralls, S.; Baisley, K.; Ngam, E.; Grant, A.D.; Millard, J. QT Interval Prolongation in People Treated With Bedaquiline for Drug-Resistant Tuberculosis Under Programmatic Conditions: A Retrospective Cohort Study. Open Forum Infect. Dis. 2021, 8, ofab413. [Google Scholar] [CrossRef] [PubMed]
- Darmayani, I.; Ascobat, P.; Instiaty, I.; Sugiri, Y.J.R.; Sawitri, N. Bedaquiline Effect on QT Interval of Drugs-Resistant Tuberculosis Patients: Real World Data. Acta Med. Indones. 2022, 54, 389–396. [Google Scholar] [PubMed]
- Venkatesan, K.; Mathur, A.; Girdhar, A.; Girdhar, B.K. Excretion of clofazimine in human milk in leprosy patients. Lepr. Rev. 1997, 68, 242–246. [Google Scholar] [CrossRef]
- Abdelwahab, M.T.; Court, R.; Everitt, D.; Diacon, A.H.; Dawson, R.; Svensson, E.M.; Maartens, G.; Denti, P. Effect of Clofazimine Concentration on QT Prolongation in Patients Treated for Tuberculosis. Antimicrob. Agents Chemother. 2021, 65, e0268720. [Google Scholar] [CrossRef]
- Tadolini, M.; Lingtsang, R.D.; Tiberi, S.; Enwerem, M.; D’Ambrosio, L.; Sadutshang, T.D.; Centis, R.; Migliori, G.B. Cardiac safety of extensively drug-resistant tuberculosis regimens including bedaquiline, delamanid and clofazimine. Eur. Respir. J. 2016, 48, 1527–1529. [Google Scholar] [CrossRef] [Green Version]
- Alghamdi, W.A.; Alsultan, A.; Al-Shaer, M.H.; An, G.; Ahmed, S.; Alkabab, Y.; Banu, S.; Barbakadze, K.; Houpt, E.; Kipiani, M.; et al. Cycloserine Population Pharmacokinetics and Pharmacodynamics in Patients with Tuberculosis. Antimicrob. Agents Chemother. 2019, 63, e00055-19. [Google Scholar] [CrossRef] [Green Version]
- van der Galiën, R.; Boveneind-Vrubleuskaya, N.V.; Peloquin, C.; Skrahina, A.; Touw, D.J.; Alffenaar, J.C. Pharmacokinetic Modeling, Simulation, and Development of a Limited Sampling Strategy of Cycloserine in Patients with Multidrug-/Extensively Drug-Resistant Tuberculosis. Clin. Pharmacokinet. 2020, 59, 899–910. [Google Scholar] [CrossRef]
- Park, S.I.; Oh, J.; Jang, K.; Yoon, J.; Moon, S.J.; Park, J.S.; Lee, J.H.; Song, J.; Jang, I.J.; Yu, K.S.; et al. Pharmacokinetics of Second-Line Antituberculosis Drugs after Multiple Administrations in Healthy Volunteers. Antimicrob. Agents Chemother. 2015, 59, 4429–4435. [Google Scholar] [CrossRef] [Green Version]
- Zhou, H.; Wu, G.; Hu, X.; Zhu, M.; Zhai, Y.; Liu, J.; Shentu, J.; Wu, L. Pharmacokinetic Properties and Tolerability of Cycloserine Following Oral Administration in Healthy Chinese Volunteers: A Randomized, Open-Label, Single- and Multiple-Dose 3-Way Crossover Study. Clin. Ther. 2015, 37, 1292–1300. [Google Scholar] [CrossRef]
- Zhu, M.; Nix, D.E.; Adam, R.D.; Childs, J.M.; Peloquin, C.A. Pharmacokinetics of cycloserine under fasting conditions and with high-fat meal, orange juice, and antacids. Pharmacotherapy 2001, 21, 891–897. [Google Scholar] [CrossRef] [PubMed]
- Tran, J.H.; Montakantikul, P. The safety of antituberculosis medications during breastfeeding. J. Hum. Lact. 1998, 14, 337–340. [Google Scholar] [CrossRef] [PubMed]
- Charles, E.; McKenna, M.H.; Morton, R.F. Studies on the absorption, diffusion, and excretion of cycloserine. Antibiot. Annu. 1955, 3, 169–172. [Google Scholar] [PubMed]
- Vorherr, H. Drug excretion in breast milk. Postgrad. Med. 1974, 56, 97–104. [Google Scholar] [CrossRef]
- Denti, P.; Garcia-Prats, A.J.; Draper, H.R.; Wiesner, L.; Winckler, J.; Thee, S.; Dooley, K.E.; Savic, R.M.; McIlleron, H.M.; Schaaf, H.S.; et al. Levofloxacin Population Pharmacokinetics in South African Children Treated for Multidrug-Resistant Tuberculosis. Antimicrob. Agents Chemother. 2018, 62, e01521-17. [Google Scholar] [CrossRef] [Green Version]
- Setiawan, E.; Abdul-Aziz, M.H.; Cotta, M.O.; Susaniwati, S.; Cahjono, H.; Sari, I.Y.; Wibowo, T.; Marpaung, F.R.; Roberts, J.A. Population pharmacokinetics and dose optimization of intravenous levofloxacin in hospitalized adult patients. Sci. Rep. 2022, 12, 8930. [Google Scholar] [CrossRef]
- Kiem, S.; Ryu, S.M.; Lee, Y.M.; Schentag, J.J.; Kim, Y.W.; Kim, H.K.; Jang, H.J.; Joo, Y.D.; Jin, K.; Shin, J.G.; et al. Population pharmacokinetics of levofloxacin in Korean patients. J. Chemother. 2016, 28, 308–313. [Google Scholar] [CrossRef]
- Roberts, J.A.; Cotta, M.O.; Cojutti, P.; Lugano, M.; Della Rocca, G.; Pea, F. Does Critical Illness Change Levofloxacin Pharmacokinetics? Antimicrob. Agents Chemother. 2015, 60, 1459–1463. [Google Scholar] [CrossRef] [Green Version]
- Cojutti, P.G.; Ramos-Martin, V.; Schiavon, I.; Rossi, P.; Baraldo, M.; Hope, W.; Pea, F. Population Pharmacokinetics and Pharmacodynamics of Levofloxacin in Acutely Hospitalized Older Patients with Various Degrees of Renal Function. Antimicrob. Agents Chemother. 2017, 61, e02134-16. [Google Scholar] [CrossRef] [Green Version]
- Preston, S.L.; Drusano, G.L.; Berman, A.L.; Fowler, C.L.; Chow, A.T.; Dornseif, B.; Reichl, V.; Natarajan, J.; Wong, F.A.; Corrado, M. Levofloxacin population pharmacokinetics and creation of a demographic model for prediction of individual drug clearance in patients with serious community-acquired infection. Antimicrob. Agents Chemother. 1998, 42, 1098–1104. [Google Scholar] [CrossRef] [Green Version]
- Zhang, Y.; Zhu, L.Q.; Wang, N.; Zhao, X.; Yang, W.; Ji, S.; Sun, L. Population pharmacokinetics of intravenous levofloxacin 500 mg/day dosage in infected patients. Pharmazie 2014, 69, 553–557. [Google Scholar] [PubMed]
- Zhang, J.; Xu, J.F.; Liu, Y.B.; Xiao, Z.K.; Huang, J.A.; Si, B.; Sun, S.H.; Xia, Q.M.; Wu, X.J.; Cao, G.Y.; et al. Population pharmacokinetics of oral levofloxacin 500 mg once-daily dosage in community-acquired lower respiratory tract infections: Results of a prospective multicenter study in China. J. Infect. Chemother. 2009, 15, 293–300. [Google Scholar] [CrossRef] [PubMed]
- Van’t Boveneind-Vrubleuskaya, N.; Seuruk, T.; van Hateren, K.; van der Laan, T.; Kosterink, J.G.W.; van der Werf, T.S.; van Soolingen, D.; van den Hof, S.; Skrahina, A.; Alffenaar, J.C. Pharmacokinetics of Levofloxacin in Multidrug- and Extensively Drug-Resistant Tuberculosis Patients. Antimicrob. Agents Chemother. 2017, 61, e00343-17. [Google Scholar] [CrossRef] [PubMed] [Green Version]
- Mohamed, S.; Mvungi, H.C.; Sariko, M.; Rao, P.; Mbelele, P.; Jongedijk, E.M.; van Winkel, C.A.J.; Touw, D.J.; Stroup, S.; Alffenaar, J.C.; et al. Levofloxacin pharmacokinetics in saliva as measured by a mobile microvolume UV spectrophotometer among people treated for rifampicin-resistant TB in Tanzania. J. Antimicrob. Chemother. 2021, 76, 1547–1552. [Google Scholar] [CrossRef] [PubMed]
- Chien, S.C.; Rogge, M.C.; Gisclon, L.G.; Curtin, C.; Wong, F.; Natarajan, J.; Williams, R.R.; Fowler, C.L.; Cheung, W.K.; Chow, A.T. Pharmacokinetic profile of levofloxacin following once-daily 500-milligram oral or intravenous doses. Antimicrob. Agents Chemother. 1997, 41, 2256–2260. [Google Scholar] [CrossRef] [PubMed] [Green Version]
- Chien, S.C.; Wong, F.A.; Fowler, C.L.; Callery-D’Amico, S.V.; Williams, R.R.; Nayak, R.; Chow, A.T. Double-blind evaluation of the safety and pharmacokinetics of multiple oral once-daily 750-milligram and 1-gram doses of levofloxacin in healthy volunteers. Antimicrob. Agents Chemother. 1998, 42, 885–888. [Google Scholar] [CrossRef] [PubMed] [Green Version]
- Lubasch, A.; Keller, I.; Borner, K.; Koeppe, P.; Lode, H. Comparative pharmacokinetics of ciprofloxacin, gatifloxacin, grepafloxacin, levofloxacin, trovafloxacin, and moxifloxacin after single oral administration in healthy volunteers. Antimicrob. Agents Chemother. 2000, 44, 2600–2603. [Google Scholar] [CrossRef] [PubMed] [Green Version]
- Cahill, J.B., Jr.; Bailey, E.M.; Chien, S.; Johnson, G.M. Levofloxacin secretion in breast milk: A case report. Pharmacotherapy 2005, 25, 116–118. [Google Scholar] [CrossRef] [PubMed]
- Bonaldo, G.; Andriani, L.A.; D’Annibali, O.; Motola, D.; Vaccheri, A. Cardiovascular safety of macrolide and fluoroquinolone antibiotics: An analysis of the WHO database of adverse drug reactions. Pharmacoepidemiol. Drug. Saf. 2019, 28, 1457–1463. [Google Scholar] [CrossRef] [PubMed]
- Famularo, G.; Pizzicannella, M.; Gasbarrone, L. Levofloxacin and seizures: What risk for elderly adults? J. Am. Geriatr. Soc. 2014, 62, 2018–2019. [Google Scholar] [CrossRef] [PubMed]
- Shu, Y.; Zhang, Q.; He, X.; Liu, Y.; Wu, P.; Chen, L. Fluoroquinolone-associated suspected tendonitis and tendon rupture: A pharmacovigilance analysis from 2016 to 2021 based on the FAERS database. Front. Pharmacol. 2022, 13, 990241. [Google Scholar] [CrossRef] [PubMed]
- Yang, M.; Zhao, L.; Wang, X.; Sun, C.; Gao, H.; Wang, X.; Qian, S. Population Pharmacokinetics and Dosage Optimization of Linezolid in Critically Ill Pediatric Patients. Antimicrob. Agents Chemother. 2021, 65, e02504-20. [Google Scholar] [CrossRef] [PubMed]
- Abe, S.; Chiba, K.; Cirincione, B.; Grasela, T.H.; Ito, K.; Suwa, T. Population pharmacokinetic analysis of linezolid in patients with infectious disease: Application to lower body weight and elderly patients. J. Clin. Pharmacol. 2009, 49, 1071–1078. [Google Scholar] [CrossRef] [PubMed]
- Plock, N.; Buerger, C.; Joukhadar, C.; Kljucar, S.; Kloft, C. Does linezolid inhibit its own metabolism? Population pharmacokinetics as a tool to explain the observed nonlinearity in both healthy volunteers and septic patients. Drug. Metab. Dispos. 2007, 35, 1816–1823. [Google Scholar] [CrossRef] [Green Version]
- Sakurai, N.; Kawaguchi, H.; Abe, J.; Kuwabara, G.; Imoto, W.; Shibata, W.; Yamada, K.; Yasui, H.; Nakamura, Y.; Kakeya, H. Population pharmacokinetics of linezolid and its major metabolites PNU-142300 and PNU-142586 in adult patients. Pharmacotherapy 2022, 42, 707–715. [Google Scholar] [CrossRef]
- Meagher, A.K.; Forrest, A.; Rayner, C.R.; Birmingham, M.C.; Schentag, J.J. Population pharmacokinetics of linezolid in patients treated in a compassionate-use program. Antimicrob. Agents Chemother. 2003, 47, 548–553. [Google Scholar] [CrossRef] [Green Version]
- Beringer, P.; Nguyen, M.; Hoem, N.; Louie, S.; Gill, M.; Gurevitch, M.; Wong-Beringer, A. Absolute bioavailability and pharmacokinetics of linezolid in hospitalized patients given enteral feedings. Antimicrob. Agents Chemother. 2005, 49, 3676–3681. [Google Scholar] [CrossRef] [Green Version]
- Whitehouse, T.; Cepeda, J.A.; Shulman, R.; Aarons, L.; Nalda-Molina, R.; Tobin, C.; MacGowan, A.; Shaw, S.; Kibbler, C.; Singer, M.; et al. Pharmacokinetic studies of linezolid and teicoplanin in the critically ill. J. Antimicrob. Chemother. 2005, 55, 333–340. [Google Scholar] [CrossRef]
- Sagirli, O.; Onal, A.; Toker, S.; Oztunç, A. Determination of linezolid in human breast milk by high-performance liquid chromatography with ultraviolet detection. J. AOAC Int. 2009, 92, 1658–1662. [Google Scholar]
- Lim, F.H.; Lovering, A.M.; Currie, A.; Jenkins, D.R. Linezolid and lactation: Measurement of drug levels in breast milk and the nursing infant. J. Antimicrob. Chemother. 2017, 72, 2677–2678. [Google Scholar] [CrossRef] [Green Version]
- Rowe, H.E.; Felkins, K.; Cooper, S.D.; Hale, T.W. Transfer of linezolid into breast milk. J. Hum. Lact. 2014, 30, 410–412. [Google Scholar] [CrossRef] [PubMed]
- Mao, Y.; Dai, D.; Jin, H.; Wang, Y. The risk factors of linezolid-induced lactic acidosis: A case report and review. Medicine 2018, 97, e12114. [Google Scholar] [CrossRef]
- Wang, Y.; Gu, E.M.; Du, X.; Xu, R.A.; Lin, G. A Novel UPLC-MS/MS Assay for the Measurement of Linezolid and its Metabolite PNU-142300 in Human Serum and its Application to Patients With Renal Insufficiency. Front. Pharmacol. 2021, 12, 641872. [Google Scholar] [CrossRef] [PubMed]
- Pea, F.; Viale, P.; Cojutti, P.; Del Pin, B.; Zamparini, E.; Furlanut, M. Therapeutic drug monitoring may improve safety outcomes of long-term treatment with linezolid in adult patients. J. Antimicrob. Chemother. 2012, 67, 2034–2042. [Google Scholar] [CrossRef] [PubMed]
- Matsumoto, K.; Shigemi, A.; Takeshita, A.; Watanabe, E.; Yokoyama, Y.; Ikawa, K.; Morikawa, N.; Takeda, Y. Analysis of thrombocytopenic effects and population pharmacokinetics of linezolid: A dosage strategy according to the trough concentration target and renal function in adult patients. Int. J. Antimicrob. Agents 2014, 44, 242–247. [Google Scholar] [CrossRef]
- Bai, A.D.; McKenna, S.; Wise, H.; Loeb, M.; Gill, S.S. Association of Linezolid With Risk of Serotonin Syndrome in Patients Receiving Antidepressants. JAMA Netw. Open. 2022, 5, e2247426. [Google Scholar] [CrossRef]
- Yuan, Y.; Li, J.; Chen, Y.; Cai, Q.; Xu, Y.; Lin, L.; Lang, Y.; Guo, S.; Zhang, R.; Cai, X. Mechanism underlying linezolid-induced peripheral neuropathy in multidrug-resistant tuberculosis. Front. Pharmacol. 2022, 13, 946058. [Google Scholar] [CrossRef]
- Salinger, D.H.; Subramoney, V.; Everitt, D.; Nedelman, J.R. Population Pharmacokinetics of the Antituberculosis Agent Pretomanid. Antimicrob. Agents Chemother. 2019, 63, e00907-19. [Google Scholar] [CrossRef] [Green Version]
- Li, H.; Salinger, D.H.; Everitt, D.; Li, M.; Del Parigi, A.; Mendel, C.; Nedelman, J.R. Long-term effects on QT prolongation of pretomanid alone and in combinations in patients with tuberculosis. Antimicrob. Agents Chemother. 2019, 63, e00445-19. [Google Scholar] [CrossRef] [Green Version]
- Magis-Escurra, C.; Later-Nijland, H.M.; Alffenaar, J.W.; Broeders, J.; Burger, D.M.; van Crevel, R.; Boeree, M.J.; Donders, A.R.; van Altena, R.; van der Werf, T.S.; et al. Population pharmacokinetics and limited sampling strategy for first-line tuberculosis drugs and moxifloxacin. Int. J. Antimicrob. Agents 2014, 44, 229–234. [Google Scholar] [CrossRef]
- Alsultan, A.; Savic, R.; Dooley, K.E.; Weiner, M.; Whitworth, W.; Mac Kenzie, W.R.; Peloquin, C.A. Population Pharmacokinetics of Pyrazinamide in Patients with Tuberculosis. Antimicrob. Agents Chemother. 2017, 6, e02625-16. [Google Scholar] [CrossRef] [PubMed] [Green Version]
- Holdiness, M.R. Antituberculosis drugs and breast-feeding. Arch. Intern. Med. 1984, 144, 1888. [Google Scholar] [CrossRef] [PubMed]
- Zuma, P.; Joubert, A.; van der Merwe, M.; Norman, J.; Waitt, C.; Court, R.; Loveday, M.; Castel, S.; Wiesner, L. Validation and application of a quantitative LC-MS/MS assay for the analysis of first-line anti-tuberculosis drugs, rifabutin and their metabolites in human breast milk. J. Chromatogr. B 2022, 1211, 123489. [Google Scholar] [CrossRef] [PubMed]
- Rovó, A.; Stüssi, G.; Meyer-Monard, S.; Favre, G.; Tsakiris, D.; Heim, D.; Halter, J.; Arber, C.; Passweg, J.; Gratwohl, A.; et al. Sideroblastic changes of the bone marrow can be predicted by the erythrogram of peripheral blood. Int. J. Lab. Hematol. 2010, 32, 329–335. [Google Scholar] [CrossRef] [PubMed] [Green Version]
- Imazu, P.; Santos, J.M.; Beraldi-Magalhães, F.; Fernandez-Llimos, F.; Tonin, F.S.; Pontarolo, R. Efficacy and safety of daily treatments for drug-susceptible pulmonary tuberculosis: A systematic review and network meta-analysis. J. Pharm. Pharmacol. 2022, 74, 905–917. [Google Scholar] [CrossRef] [PubMed]
- Hussain, Z.; Zhu, J.; Ma, X. Metabolism and Hepatotoxicity of Pyrazinamide, an Antituberculosis Drug. Drug. Metab. Dispos. 2021, 49, 679–682. [Google Scholar] [CrossRef]
- Drobac, P.C.; del Castillo, H.; Sweetland, A.; Anca, G.; Joseph, J.K.; Furin, J.; Shin, S. Treatment of multidrug-resistant tuberculosis during pregnancy: Long-term follow-up of 6 children with intrauterine exposure to second-line agents. Clin. Infect. Dis. 2005, 40, 1689–1692. [Google Scholar] [CrossRef]
- Keskin, N.; Yilmaz, S. Pregnancy and tuberculosis: To assess tuberculosis cases in pregnancy in a developing region retrospectively and two case reports. Arch. Gynecol. Obstet. 2008, 278, 451–455. [Google Scholar] [CrossRef]
- Zhu, M.; Burman, W.J.; Jaresko, G.S.; Berning, S.E.; Jelliffe, R.W.; Peloquin, C.A. Population pharmacokinetics of intravenous and intramuscular streptomycin in patients with tuberculosis. Pharmacotherapy 2001, 21, 1037–1045. [Google Scholar] [CrossRef]
- Rudneva, N.N. Effect of penicillin and streptomycin on lactation in parturients. Akusherstvo Ginekol. 1967, 43, 48–52. [Google Scholar]
- Fujimori, H.; Imai, S. Studies on dihydrostreptomycin administered to the pregnant and transferred to their fetuses. J. Jpn. Obstet. Gynceol Soc. 1957, 4, 133–149. [Google Scholar]
- Peloquin, C.A. Pharmacology of the antimycobacterial drugs. Med. Clin. N. Am. 1993, 77, 1253–1262. [Google Scholar] [CrossRef] [PubMed]
- Peloquin, C.A.; Bulpitt, A.E.; Jaresko, G.S.; Jelliffe, R.W.; Childs, J.M.; Nix, D.E. Pharmacokinetics of ethambutol under fasting conditions, with food, and with antacids. Antimicrob. Agents Chemother. 1999, 43, 568–572. [Google Scholar] [CrossRef] [PubMed] [Green Version]
- McIlleron, H.; Wash, P.; Burger, A.; Norman, J.; Folb, P.I.; Smith, P. Determinants of rifampin, isoniazid, pyrazinamide, and ethambutol pharmacokinetics in a cohort of tuberculosis patients. Antimicrob. Agents Chemother. 2006, 50, 1170–1177. [Google Scholar] [CrossRef] [PubMed] [Green Version]
- Snider, D.E., Jr.; Powell, K.E. Should women taking antituberculosis drugs breast-feed? Arch. Intern. Med. 1984, 144, 589–590. [Google Scholar] [CrossRef]
- Leibold, J.E. The ocular toxicity of ethambutol and its relation to dose. Ann. N. Y Acad. Sci. 1966, 135, 904–909. [Google Scholar] [CrossRef]
- Choi, S.Y.; Hwang, J.M. Optic neuropathy associated with ethambutol in Koreans. Korean J. Ophthalmol. 1997, 11, 106–110. [Google Scholar] [CrossRef]
- Chen, S.C.; Lin, M.C.; Sheu, S.J. Incidence and prognostic factor of ethambutol-related optic neuropathy: 10-year experience in southern Taiwan. Kaohsiung J. Med. Sci. 2015, 31, 358–362. [Google Scholar] [CrossRef] [Green Version]
- Lenzi, E.; Santuari, S. Preliminary observations on the use of a new semisynthetic rifamycin derivative in gynecology and obstetrics. Atti Accad Lancisiana Roma 1969, 13, 87–94. [Google Scholar]
- Chen, J.; Raymond, K. Roles of rifampicin in drug-drug interactions: Underlying molecular mechanisms involving the nuclear pregnane X receptor. Ann. Clin. Microbiol. Antimicrob. 2006, 5, 3. [Google Scholar] [CrossRef] [Green Version]
- Mohamed, M.F.; Jungerwirth, S.; Asatryan, A.; Jiang, P.; Othman, A.A. Assessment of effect of CYP3A inhibition, CYP induction, OATP1B inhibition, and high-fat meal on pharmacokinetics of the JAK1 inhibitor upadacitinib. Br. J. Clin. Pharmacol. 2017, 83, 2242–2248. [Google Scholar] [CrossRef] [PubMed] [Green Version]
- Yee, K.L.; Khalilieh, S.G.; Sanchez, R.I.; Liu, R.; Anderson, M.S.; Manthos, H.; Judge, T.; Brejda, J.; Butterton, J.R. The Effect of Single and Multiple Doses of Rifampin on the Pharmacokinetics of Doravirine in Healthy Subjects. Clin. Drug. Investig. 2017, 37, 659–667. [Google Scholar] [CrossRef] [PubMed]
- Lass, A.; Bünger, P. Untersuchungen über die Diffusion von Isoniazid in den fetalen Kreislauf, das Fruchtwasser und die Muttermilch. Klin. Wochenschr. 1953, 31, 606–608. [Google Scholar] [CrossRef] [PubMed]
- Ricci, G.; Copaitich, T. Elimination of orally administered isoniazid in human milk. Rass. Clin. Ter. 1954, 53, 209–214. [Google Scholar] [PubMed]
- Berlin, C.; Lee, C. Isoniazid and acetylisoniazid disposition in human milk, saliva and plasma. Fed. Proc. 1979, 38, 1044. [Google Scholar]
- Singh, N.; Golani, A.; Patel, Z.; Maitra, A. Transfer of isoniazid from circulation to breast milk in lactating women on chronic therapy for tuberculosis. Br. J. Clin. Pharmacol. 2008, 65, 418–422. [Google Scholar] [CrossRef] [Green Version]
- Vaghela, J.H.; Solanki, Y.; Lakhani, K.; Purohit, B. Isoniazid-Induced Systemic Lupus Erythematosus: A Case Report. Drug Saf. Case Rep. 2019, 6, 7. [Google Scholar] [CrossRef] [Green Version]
- Binns, C.; Lee, M.; Low, W.Y. The Long-Term Public Health Benefits of Breastfeeding. Asia Pac. J. Public. Health 2016, 28, 7–14. [Google Scholar] [CrossRef] [Green Version]
- Stocco, G.; Lucafò, M.; Decorti, G. Pharmacogenomics of Antibiotics. Int. J. Mol. Sci. 2020, 21, 5975. [Google Scholar] [CrossRef]
- Guan, M.X. Mitochondrial 12S rRNA mutations associated with aminoglycoside ototoxicity. Mitochondrion 2011, 11, 237–245. [Google Scholar] [CrossRef]
- Alvarez, A.I.; Pérez, M.; Prieto, J.G.; Molina, A.J.; Real, R.; Merino, G. Fluoroquinolone efflux mediated by ABC transporters. J. Pharm. Sci. 2008, 97, 3483–3493. [Google Scholar] [CrossRef] [PubMed]
- Gervasoni, C.; Cattaneo, D.; Falvella, F.S.; Vitiello, P.; Cheli, S.; Milazzo, L.; Clementi, E.; Riva, A. Levofloxacin-induced seizures in a patient without predisposing risk factors: The impact of pharmacogenetics. Eur. J. Clin. Pharmacol. 2013, 69, 1611–1613. [Google Scholar] [CrossRef] [PubMed]
- Naidoo, A.; Ramsuran, V.; Chirehwa, M.; Denti, P.; McIlleron, H.; Naidoo, K.; Yende-Zuma, N.; Singh, R.; Ngcapu, S.; Chaudhry, M.; et al. Effect of genetic variation in UGT1A and ABCB1 on moxifloxacin pharmacokinetics in South African patients with tuberculosis. Pharmacogenomics 2018, 19, 17–29. [Google Scholar] [CrossRef] [PubMed]
- Weiner, M.; Gelfond, J.; Johnson-Pais, T.L.; Engle, M.; Peloquin, C.A.; Johnson, J.L.; Sizemore, E.E.; Mac Kenzie, W.R. Elevated Plasma Moxifloxacin Concentrations and SLCO1B1 g.-11187G>A Polymorphism in Adults with Pulmonary Tuberculosis. Antimicrob. Agents Chemother. 2018, 62, e01802-17. [Google Scholar] [CrossRef] [Green Version]
- Allegra, S.; Di Paolo, A.; Cusato, J.; Fatiguso, G.; Arrigoni, E.; Danesi, R.; Corcione, S.; D’Avolio, A. A Common mdr1 Gene Polymorphism is Associated With Changes in Linezolid Clearance. Ther. Drug. Monit. 2018, 40, 602–609. [Google Scholar] [CrossRef]
- American Academy of Pediatrics Committee on Drugs. Transfer of drugs and other chemicals into human milk. Pediatrics 2001, 108, 776–789. [Google Scholar] [CrossRef] [PubMed] [Green Version]
- Hildebrandt, R.; Gundert-Remy, U. Lack of pharmacological active saliva levels of caffeine in breast-fed infants. Pediatr. Pharmacol. 1983, 3, 237–244. [Google Scholar]
- Calafat, A.M.; Weuve, J.; Ye, X.; Jia, L.T.; Hu, H.; Ringer, S.; Huttner, K.; Hauser, R. Exposure to bisphenol A and other phenols in neonatal intensive care unit premature infants. Environ. Health Perspect. 2009, 117, 639–644. [Google Scholar] [CrossRef] [Green Version]
- Atherton, J.C. Acid-base balance: maintenance of plasma pH. Anaesth. Intensiv. Care Med. 2003, 4, 419–422. [Google Scholar] [CrossRef]
- Bobiński R, Bobińska, J. Fatty acids of human milk—A review. Int. J. Vitam. Nutr. Res. 2022, 92, 280–291. [Google Scholar] [CrossRef]
- Filatava, E.J.; Shelly, C.E.; Overton, N.E.; Gregas, M.; Glynn, R.; Gregory, K.E. Human milk pH is associated with fortification, postpartum day, and maternal dietary intake in preterm mother-infant dyads. J. Perinatol. 2022, 43, 60–67. [Google Scholar] [CrossRef] [PubMed]
- Meier, P.P.; Engstrom, J.L.; Zuleger, J.L.; Motykowski, J.E.; Vasan, U.; Meier, W.A.; Hartmann, P.E.; Williams, T.M. Accuracy of a user-friendly centrifuge for measuring creamatocrits on mothers' milk in the clinical setting. Breastfeed Med. 2006, 1, 79–87. [Google Scholar] [CrossRef] [PubMed] [Green Version]


| Anti-TB Drug | Retrieved Articles | ||||||||
|---|---|---|---|---|---|---|---|---|---|
| Data on Plasma Concentration | Data on Milk Concentration | Data on Plasma Concentration in Breastfed Infant | |||||||
| A | B | C | A | B | C | A | B | C | |
| PK studies, including population kinetics | |||||||||
| Bedaquiline | 7 | 3 | 1 | 1 | 1 | 1 | 1 | 1 | 1 |
| Clofazimine | 1 | 0 | 0 | 1 | 0 | 0 | 0 | 0 | 0 |
| Cycloserine /Terizidone | 17 | 9 | 5 | 0 indirect information, no access to the original publication | 0 indirect information, no access to the original publication | 0 indirect information, no access to the original publication | 0 | 0 | 0 |
| Levofloxacin | 31 | 12 | 6 | 2 | 1 | 1 | 6 | 0 | 0 |
| Linezolid | 53 | 7 | 3 | 6 | 3 | 3 | 11 | 3 | 3 |
| Pretomanid | 14 | 4 | 1 | 0 | 0 | 0 | 0 | 0 | 0 |
| Pyrazinamide | 110 | 7 | 5 | 3 | 2 | 0 | 19 | 0 | 0 |
| Streptomycin | 332 1 | 5 | 2 | 2 (Japanese language, Russian language) | 8 | 0 | 0 | ||
| PK studies, modelling approaches | |||||||||
| Ethambutol | 2 2 | 0 | 0 | 1 | 1 | 1 | 6 | 1 3 | n.a. |
| INH | 22 2 | 2 | 0 | No new data after 2017 | 9 | 1 4 | n.a. | ||
| Rifampicin | 141 2 | 3 | 0 | 7 | 1 | 1 | 14 | 1 3 | n.a. |
| Anti-TB Agent | PK Studies | Breast Milk Concentration Data | Plasma Concentration Data in Breastfed Infants | Comment on Adverse Effects | |
|---|---|---|---|---|---|
| PK studies, including population kinetics | |||||
| Nursing women | patients/general population | ||||
| Bedaquiline | Yes | Limited | Limited | Yes 1 | Some concern 3 |
| Clofazimine | Yes | Not satisfactory | Satisfactory | No data | No concern |
| Cycloserine /Terizidone | No | Satisfactory | Not satisfactory | No data | Concerns could not be ruled out |
| Levofloxacin | No | Satisfactory | Not satisfactory | No data | No concern |
| Linezolid | Yes | Satisfactory | Satisfactory | Yes 2 | Concerns could not be ruled out |
| Pretomanid | No | Satisfactory | Satisfactory | No data | No concern based on the 3000-fold difference between the standard adult and external infant dose |
| Pyrazinamide | No | Satisfactory | Not satisfactory | No data | Concerns could not be ruled out |
| Streptomycin | Limited (Russian language, dose unclear) | Satisfactory | Not satisfactory (secondary sources, primary sources in Russian and Japanese) | No data | No concern as streptomycin is orally not bioavailable |
| PK studies, modelling approaches | |||||
| Ethambutol 4 | No | Satisfactory | Not satisfactory | Simulated | No concern |
| Rifampicin 4 | No | Satisfactory | Not satisfactory | Simulated | No concern |
| Isoniazid 5 | No | Satisfactory | Not satisfactory | Simulated | No concern |
Disclaimer/Publisher’s Note: The statements, opinions and data contained in all publications are solely those of the individual author(s) and contributor(s) and not of MDPI and/or the editor(s). MDPI and/or the editor(s) disclaim responsibility for any injury to people or property resulting from any ideas, methods, instructions or products referred to in the content. |
© 2023 by the authors. Licensee MDPI, Basel, Switzerland. This article is an open access article distributed under the terms and conditions of the Creative Commons Attribution (CC BY) license (https://creativecommons.org/licenses/by/4.0/).
Share and Cite
Algharably, E.A.; Kreutz, R.; Gundert-Remy, U. Infant Exposure to Antituberculosis Drugs via Breast Milk and Assessment of Potential Adverse Effects in Breastfed Infants: Critical Review of Data. Pharmaceutics 2023, 15, 1228. https://doi.org/10.3390/pharmaceutics15041228
Algharably EA, Kreutz R, Gundert-Remy U. Infant Exposure to Antituberculosis Drugs via Breast Milk and Assessment of Potential Adverse Effects in Breastfed Infants: Critical Review of Data. Pharmaceutics. 2023; 15(4):1228. https://doi.org/10.3390/pharmaceutics15041228
Chicago/Turabian StyleAlgharably, Engi Abdelhady, Reinhold Kreutz, and Ursula Gundert-Remy. 2023. "Infant Exposure to Antituberculosis Drugs via Breast Milk and Assessment of Potential Adverse Effects in Breastfed Infants: Critical Review of Data" Pharmaceutics 15, no. 4: 1228. https://doi.org/10.3390/pharmaceutics15041228