

Comprehensive Two-Dimensional Gas Chromatography as a Bioanalytical Platform for Drug Discovery and Analysis


Abstract
:1. Introduction
2. Multidimensional Gas Chromatography
3. Comprehensive Two-Dimensional Gas Chromatography
3.1. Technical Implementations
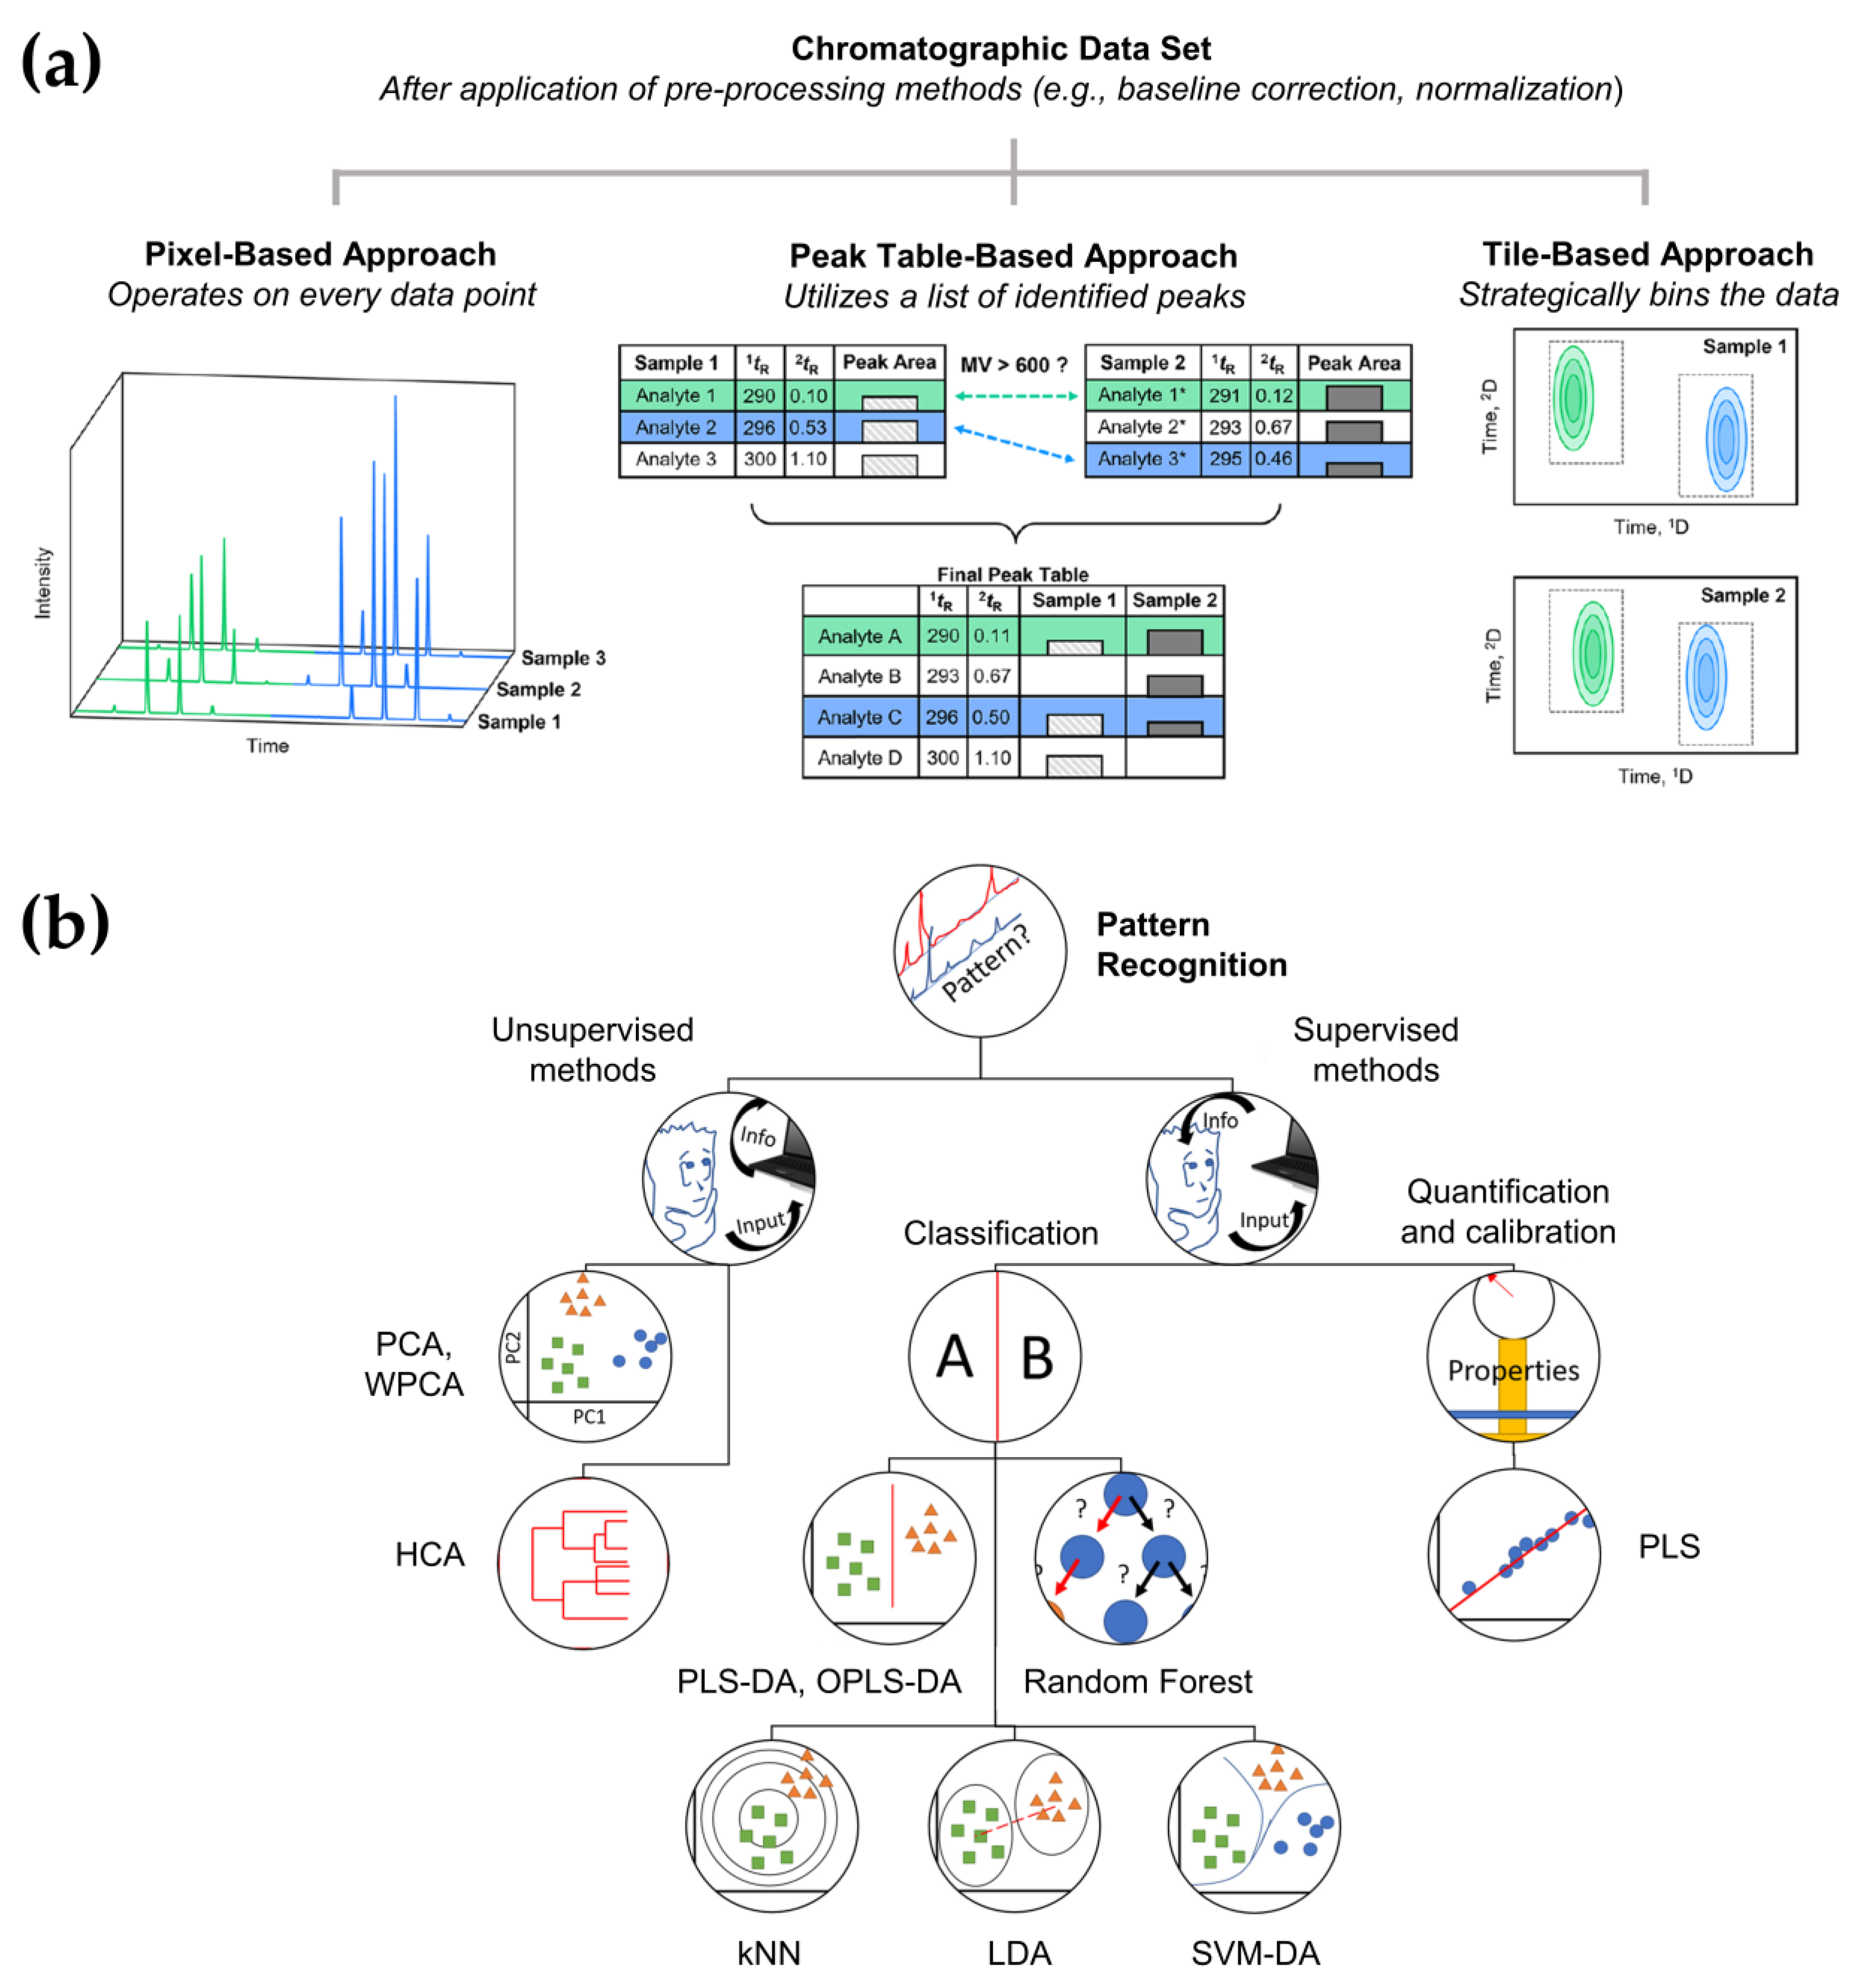
3.2. Data Acquisition and Analysis
4. Applications of GC×GC in Drug Discovery and Analysis
4.1. Tuberculosis
4.2. Cancer
4.3. Coronavirus Disease (COVID-19)
4.4. Psychiatric Disorder
5. Challenges of GC×GC in Moving toward Personalized Medicine
6. Concluding Remarks
Author Contributions
Funding
Institutional Review Board Statement
Informed Consent Statement
Data Availability Statement
Acknowledgments
Conflicts of Interest
References
- Blakemore, D.C.; Castro, L.; Churcher, I.; Rees, D.C.; Thomas, A.W.; Wilson, D.M.; Wood, A. Organic synthesis provides opportunities to transform drug discovery. Nat. Chem. 2018, 10, 383–394. [Google Scholar] [CrossRef] [PubMed]
- Field, M.C.; Horn, D.; Fairlamb, A.H.; Ferguson, M.A.J.; Gray, D.W.; Read, K.D.; De Rycker, M.; Torrie, L.S.; Wyatt, P.G.; Wyllie, S.; et al. Anti-trypanosomatid drug discovery: An ongoing challenge and a continuing need. Nat. Rev. Microbiol. 2017, 15, 217–231. [Google Scholar] [CrossRef] [PubMed] [Green Version]
- Puchades-Carrasco, L.; Pineda-Lucena, A. Metabolomics in pharmaceutical research and development. Curr. Opin. Biotechnol. 2015, 35, 73–77. [Google Scholar] [CrossRef] [PubMed]
- Mohs, R.C.; Greig, N.H. Drug discovery and development: Role of basic biological research. Alzheimer’s Dement. Transl. Res. Clin. Interv. 2017, 3, 651–657. [Google Scholar] [CrossRef] [PubMed]
- Gorityala, S.; Roos, D.; Dong, M. Bioanalysis of small-molecule drugs and metabolites in physiological samples by LC–MS, Part 1: Overview. LCGC Europe 2021, 34, 249–255. [Google Scholar]
- Thakur, A.; Tan, Z.; Kameyama, T.; El-Khateeb, E.; Nagpal, S.; Malone, S.; Jamwal, R.; Nwabufo, C.K. Bioanalytical strategies in drug discovery and development. Drug Metab. Rev. 2021, 53, 434–458. [Google Scholar] [CrossRef]
- Ingle, R.G.; Zeng, S.; Jiang, H.; Fang, W.J. Current developments of bioanalytical sample preparation techniques in pharmaceuticals. J. Pharm. Anal. 2022, 12, 517–529. [Google Scholar] [CrossRef]
- Niu, Z.; Zhang, W.; Yu, C.; Zhang, J.; Wen, Y. Recent advances in biological sample preparation methods coupled with chromatography, spectrometry and electrochemistry analysis techniques. TrAC-Trends Anal. Chem. 2018, 102, 123–146. [Google Scholar] [CrossRef]
- Moein, M.M.; El Beqqali, A.; Abdel-Rehim, M. Bioanalytical method development and validation: Critical concepts and strategies. J. Chromatogr. B Anal. Technol. Biomed. Life Sci. 2017, 1043, 3–11. [Google Scholar] [CrossRef]
- Sankar, P.R.; Geethika, A.S.; Rachana, G.; Babu, P.S.; Bhargavi, J. Bioanalytical method validation: A comprehensive review. Int. J. Pharm. Sci. Rev. Res. 2019, 9, 50–58. [Google Scholar]
- Greco, V.; Locatelli, M.; Savini, F.; de Grazia, U.; Montanaro, O.; Rosato, E.; Perrucci, M.; Ciriolo, L.; Kabir, A.; Ulusoy, H.I.; et al. New challenges in (bio)analytical sample treatment procedures for clinical applications. Separations 2023, 10, 62. [Google Scholar] [CrossRef]
- Reddy, K.T.K.; Gandla, K.; Babu, P.V.; Chakravarthy, M.V.K.; Chandrasekhar, P.; Sagapola, R. A critical review on bioanalytical method development and validation of few oncology drugs by using LC-MS-MS. J. Pharm. Negat. Results 2022, 13, 16–27. [Google Scholar] [CrossRef]
- Xue, Y.J.; Gao, H.; Ji, Q.C.; Lam, Z.; Fang, X.; Lin, Z.; Hoffman, M.; Schulz-Jander, D.; Weng, N. Bioanalysis of drug in tissue: Current status and challenges. Bioanalysis 2012, 4, 2637–2653. [Google Scholar] [CrossRef]
- D’Adamo, G.L.; Widdop, J.T.; Giles, E.M. The future is now? Clinical and translational aspects of “Omics” technologies. Immunol. Cell Biol. 2021, 99, 168–176. [Google Scholar] [CrossRef]
- Patel, S.; Ahmed, S. Emerging field of metabolomics: Big promise for cancer biomarker identification and drug discovery. J. Pharm. Biomed. 2015, 107, 63–74. [Google Scholar] [CrossRef]
- Wishart, D.S. Applications of metabolomics in drug discovery and development. Drugs R D 2008, 9, 307–322. [Google Scholar] [CrossRef]
- Schmidt, C. Metabolomics takes its place as latest up-and-coming “Omic” science. J. Natl. Cancer Inst. 2004, 96, 732–734. [Google Scholar] [CrossRef] [Green Version]
- Schmidt, C.W. Metabolomics: What’s happening downstream of DNA. Environ. Health Perspect. 2004, 112, 411–415. [Google Scholar] [CrossRef] [Green Version]
- Wishart, D.S.; Guo, A.C.; Oler, E.; Wang, F.; Anjum, A.; Peters, H.; Dizon, R.; Sayeeda, Z.; Tian, S.; Lee, B.L.; et al. HMDB 5.0: The human metabolome database for 2022. Nucleic Acids Res. 2022, 50, D622–D631. [Google Scholar] [CrossRef]
- Lucena, R.; Cruz-Vera, M.; Cáárdenas, S.; Valcáárcel, M. Liquid-phase microextraction in bioanalytical sample preparation. Bioanalysis 2009, 1, 135–149. [Google Scholar] [CrossRef]
- Booth, B.P. Welcome to bioanalysis. Bioanalysis 2009, 1, 1–2. [Google Scholar] [CrossRef] [Green Version]
- D’Atri, V.; Fekete, S.; Clarke, A.; Veuthey, J.L.; Guillarme, D. Recent advances in chromatography for pharmaceutical analysis. Anal. Chem. 2019, 91, 210–239. [Google Scholar] [CrossRef] [PubMed] [Green Version]
- Regalado, E.L.; Haidar Ahmad, I.A.; Bennett, R.; D’Atri, V.; Makarov, A.A.; Humphrey, G.R.; Mangion, I.; Guillarme, D. The emergence of universal chromatographic methods in the research and development of new drug substances. Acc. Chem. Res. 2019, 52, 1990–2002. [Google Scholar] [CrossRef] [PubMed]
- Beale, D.J.; Pinu, F.R.; Kouremenos, K.A.; Poojary, M.M.; Narayana, V.K.; Boughton, B.A.; Kanojia, K.; Dayalan, S.; Jones, O.A.H.; Dias, D.A. Review of recent developments in GC–MS approaches to metabolomics-based research. Metabolomics 2018, 14, 152. [Google Scholar] [CrossRef]
- De Zeeuw, J.; Luong, J. Developments in stationary phase technology for gas chromatography. TrAC-Trends Anal. Chem. 2002, 21, 594–607. [Google Scholar] [CrossRef]
- He, J.; Ran, J.; Yao, J.; Zhang, L.; Wang, S.; Wang, Y.; Dong, N. Separation performance of capillary gas chromatography based on monohydroxycucurbit[7]uril incorporated into sol–gels as the stationary phase. Front. Chem. 2020, 8, 31. [Google Scholar] [CrossRef]
- Fakayode, S.O.; Mitchell, B.S.; Pollard, D.A. Determination of boiling point of petrochemicals by gas chromatography-mass spectrometry and multivariate regression analysis of structural activity relationship. Talanta 2014, 126, 151–156. [Google Scholar] [CrossRef]
- Zhao, B.; Zhang, S.; Zhou, Y.; He, D.; Li, Y.; Ren, M.; Xu, Z.; Fang, J. Characterization and quantification of PAH atmospheric pollution from a large petrochemical complex in Guangzhou: GC–MS/MS analysis. Microchem. J. 2015, 119, 140–144. [Google Scholar] [CrossRef]
- Tankiewicz, M.; Morrison, C.; Biziuk, M. Application and optimization of headspace solid-phase microextraction (HS-SPME) coupled with gas chromatography-flame-ionization detector (GC–FID) to determine products of the petroleum industry in aqueous samples. Microchem. J. 2013, 108, 117–123. [Google Scholar] [CrossRef]
- Shi, J.; Nian, Y.; Da, D.; Xu, X.; Zhou, G.; Zhao, D.; Li, C. Characterization of flavor volatile compounds in sauce spareribs by gas chromatography–mass spectrometry and electronic nose. LWT 2020, 124, 109182. [Google Scholar] [CrossRef]
- Wang, F.; Gao, Y.; Wang, H.; Xi, B.; He, X.; Yang, X.; Li, W. Analysis of volatile compounds and flavor fingerprint in Jingyuan lamb of different ages using gas chromatography–ion mobility spectrometry (GC–IMS). Meat Sci. 2021, 175, 108449. [Google Scholar] [CrossRef]
- Ge, S.; Chen, Y.; Ding, S.; Zhou, H.; Jiang, L.; Yi, Y.; Deng, F.; Wang, R. Changes in volatile flavor compounds of peppers during hot air drying process based on headspace-gas chromatography-ion mobility spectrometry (HS–GC–IMS). J. Sci. Food Agric. 2020, 100, 3087–3098. [Google Scholar] [CrossRef]
- Tran-Lam, T.T.; Dao, Y.H.; Nguyen, L.K.T.; Ma, H.K.; Tran, H.N.; Le, G.T. Simultaneous determination of 18 polycyclic aromatic hydrocarbons in daily foods (Hanoi metropolitan area) by gas chromatography–tandem mass spectrometry. Foods 2018, 7, 201. [Google Scholar] [CrossRef] [Green Version]
- Socas-Rodríguez, B.; González-Sálamo, J.; Herrera-Herrera, A.V.; Santana-Mayor, Á.; Hernández-Borges, J. Determination of phthalic acid esters in different baby food samples by gas chromatography tandem mass spectrometry. Anal. Bioanal. Chem. 2018, 410, 5617–5628. [Google Scholar] [CrossRef]
- Nasrollahi, S.; Ghoreishi, S.M.; Ebrahimabadi, A.H.; Khoobi, A. Gas chromatography-mass spectrometry analysis and antimicrobial, antioxidant and anti-cancer activities of essential oils and extracts of Stachys schtschegleevii plant as biological macromolecules. Int. J. Biol. Macromol. 2019, 128, 718–723. [Google Scholar] [CrossRef]
- Zaid, A.; Haw, X.R.; Alkatib, H.H.; Sasidharan, S.; Marriott, P.J.; Wong, Y.F. Phytochemical constituents and antiproliferative activities of essential oils from four varieties of Malaysian Zingiber officinale Roscoe against human cervical cancer cell line. Plants 2022, 11, 1280. [Google Scholar] [CrossRef]
- Rao, M.R.K.; Anisha, G.; Prabhu, K.; Shil, S.; Vijayalakshmi, N. Preliminary phytochemical and gas chromatography-mass spectrometry study of one medicinal plant Carissa carandas. Drug Invent. Today 2019, 12, 1629–1630. [Google Scholar]
- Al Othman, H.I.; Alkatib, H.H.; Zaid, A.; Sasidharan, S.; Rahiman, S.S.F.; Lee, T.P.; Dimitrovski, G.; Althakafy, J.T.; Wong, Y.F. Phytochemical composition, antioxidant and antiproliferative activities of Citrus hystrix, Citrus limon, Citrus pyriformis, and Citrus microcarpa leaf essential oils against human cervical cancer cell line. Plants 2023, 12, 134. [Google Scholar] [CrossRef]
- Grabowska-Polanowska, B.; Faber, J.; Skowron, M.; Miarka, P.; Pietrzycka, A.; Śliwka, I.; Amann, A. Detection of potential chronic kidney disease markers in breath using gas chromatography with mass-spectral detection coupled with thermal desorption method. J. Chromatogr. A 2013, 1301, 179–189. [Google Scholar] [CrossRef]
- Mokhtar, S.U.; Chin, S.T.; Kee, C.L.; Low, M.Y.; Drummer, O.H.; Marriott, P.J. Rapid determination of sildenafil and its analogues in dietary supplements using gas chromatography-triple quadrupole mass spectrometry. J. Pharm. Biomed. Anal. 2016, 121, 188–196. [Google Scholar] [CrossRef] [Green Version]
- Molnár, B.; Fodor, B.; Csámpai, A.; Hidvégi, E.; Molnár-Perl, I. Structure-related related new approach in the gas chromatography/mass spectrometry analysis of cathinone type synthetic drugs. J. Chromatogr. A 2016, 1477, 70–75. [Google Scholar] [CrossRef] [PubMed]
- Zhou, J.; Chen, J.; Hu, C.; Xie, Z.; Li, H.; Wei, S.; Wang, D.; Wen, C.; Xu, G. Exploration of the serum metabolite signature in patients with rheumatoid arthritis using gas chromatography–mass spectrometry. J. Pharm. Biomed. Anal. 2016, 127, 60–67. [Google Scholar] [CrossRef] [PubMed]
- Azzouz, A.; Rascón, A.J.; Ballesteros, E. Simultaneous determination of parabens, alkylphenols, phenylphenols, bisphenol A and triclosan in human urine, blood and breast milk by continuous solid-phase extraction and gas chromatography-mass spectrometry. J. Pharm. Biomed. Anal. 2016, 119, 16–26. [Google Scholar] [CrossRef] [PubMed]
- Ruszkiewicz, D.M.; Sanders, D.; O’Brien, R.; Hempel, F.; Reed, M.J.; Riepe, A.C.; Bailie, K.; Brodrick, E.; Darnley, K.; Ellerkmann, R.; et al. Diagnosis of COVID-19 by analysis of breath with gas chromatography-ion mobility spectrometry—A feasibility study. EClinicalMedicine 2020, 29–30, 100609. [Google Scholar] [CrossRef] [PubMed]
- Rontani, J.F. Use of gas chromatography-mass spectrometry techniques (GC–MS, GC–MS/MS and GC–QTOF) for the characterization of photooxidation and autoxidation products of lipids of autotrophic organisms in environmental samples. Molecules 2022, 27, 1629. [Google Scholar] [CrossRef]
- Shi, L.; Bucknall, M.P.; Young, T.L.; Zhang, M.; Hu, L.; Bing, J.; Lee, D.S.; Kim, J.; Wu, T.; Takamure, N. Gas chromatography–mass spectrometry analyses of encapsulated stable perovskite solar cells. Science 2020, 368, eaba2412. [Google Scholar] [CrossRef]
- Łozowicka, B.; Jankowska, M.; Rutkowska, E.; Hrynko, I.; Kaczyński, P.; Miciński, J. The evaluation of a fast and simple pesticide multiresidue method in various herbs by gas chromatography. J. Nat. Med. 2014, 68, 95–111. [Google Scholar] [CrossRef] [Green Version]
- Hor, J.Y.; Hassan, N.H.; Zulkarnain, M.; Latip, R.A.; Nidzam, M.S.; Wong, Y.F. Simultaneous determination of benzo (a) pyrene, benzo (a) anthracene, benzo (b) fluoranthene, and chrysene in tocotrienol concentrates using dual solid-phase extraction and gas chromatography-mass spectrometry. Curr. Anal. Chem. 2022, 18, 930–937. [Google Scholar]
- Marriott, P.J. Addressing the challenges to identification in gas chromatography by increased resolution and enhanced detection modalities. Chem. Asian J. 2018, 13, 1849–1856. [Google Scholar] [CrossRef]
- Kulsing, C.; Nolvachai, Y.; Marriott, P.J. Concepts, selectivity options and experimental design approaches in multidimensional and comprehensive two-dimensional gas chromatography. TrAC-Trends Anal. Chem. 2020, 130, 115995. [Google Scholar] [CrossRef]
- Chin, S.T.; Marriott, P.J. Multidimensional gas chromatography beyond simple volatiles separation. Chem. Commun. 2014, 50, 8819–8833. [Google Scholar] [CrossRef]
- Simmons, M.C.; Snyder, L.R. Two-stage gas-liquid chromatography. Anal. Chem. 1958, 30, 32–35. [Google Scholar] [CrossRef]
- Deans, D.R. A new technique for heart cutting in gas chromatography[1]. Chromatographia 1968, 1, 18–22. [Google Scholar] [CrossRef]
- Sharif, K.M.; Chin, S.T.; Kulsing, C.; Marriott, P.J. The microfluidic Deans switch: 50 years of progress, innovation and application. TrAC-Trends Anal. Chem. 2016, 82, 35–54. [Google Scholar] [CrossRef]
- Marriott, P.; Kinghorn, R. Cryogenic solute manipulation in gas chromatography—The longitudinal modulation approach. TrAC-Trends Anal. Chem. 1999, 18, 114–125. [Google Scholar] [CrossRef]
- Fenimore, D.C.; Freeman, R.R.; Loy, P.R. Determination of Δ9-tetrahydrocannabinol in blood by electron capture gas chromatography. Anal. Chem. 1973, 45, 2331–2335. [Google Scholar] [CrossRef]
- Giddings, J.C. Two-dimensional separations: Concept and promise. Anal. Chem. 1984, 56, 1258A–1270A. [Google Scholar] [CrossRef]
- Ramos, L. Comprehensive Two Dimensional Gas Chromatography; Elsevier: Amsterdam, The Netherlands, 2009; Volume 55, ISBN 9780444532374. [Google Scholar]
- Tranchida, P.Q.; Franchina, F.A.; Dugo, P.; Mondello, L. A flow-modulated comprehensive gas chromatography-mass spectrometry method for the analysis of fatty acid profiles in marine and biological samples. J. Chromatogr. A 2012, 1255, 171–176. [Google Scholar] [CrossRef]
- Marriott, P.J.; Chin, S.T.; Maikhunthod, B.; Schmarr, H.G.; Bieri, S. Multidimensional gas chromatography. TrAC-Trends Anal. Chem. 2012, 34, 1–21. [Google Scholar] [CrossRef]
- Lebanov, L.; Tedone, L.; Kaykhaii, M.; Linford, M.R.; Paull, B. Multidimensional gas chromatography in essential oil analysis. Part 1: Technical developments. Chromatographia 2018, 82, 377–398. [Google Scholar] [CrossRef]
- Seeley, J.V.; Seeley, S.K. Multidimensional gas chromatography: Fundamental advances and new applications. Anal. Chem. 2013, 85, 557–578. [Google Scholar] [CrossRef] [PubMed]
- Lebanov, L.; Tedone, L.; Kaykhaii, M.; Linford, M.R.; Paull, B. Multidimensional gas chromatography in essential oil analysis. Part 2: Application to characterisation and identification. Chromatographia 2019, 82, 399–414. [Google Scholar] [CrossRef]
- Liu, Z.; Phillips, J.B. Comprehensive two-dimensional gas chromatography using an on-column thermal modulator interface. J. Chromatogr. Sci. 1991, 29, 227–231. [Google Scholar] [CrossRef]
- Waktola, H.D.; Zeng, A.X.; Chin, S.T.; Marriott, P.J. Advanced gas chromatography and mass spectrometry technologies for fatty acids and triacylglycerols analysis. TrAC-Trends Anal. Chem. 2020, 129, 115957. [Google Scholar] [CrossRef]
- Wong, Y.F.; Hartmann, C.; Marriott, P.J. Multidimensional gas chromatography methods for bioanalytical research. Bioanalysis 2014, 6, 2461–2479. [Google Scholar] [CrossRef]
- Zaid, A.; Khan, M.S.; Yan, D.; Marriott, P.J.; Wong, Y.F. Comprehensive two-dimensional gas chromatography with mass spectrometry: An advanced bioanalytical technique for clinical metabolomics studies. Analyst 2022, 147, 3974–3992. [Google Scholar] [CrossRef]
- Amaral, M.S.S.; Marriott, P.J. The blossoming of technology for the analysis of complex aroma bouquets—A review on flavour and odorant multidimensional and comprehensive gas chromatography applications. Molecules 2019, 24, 2080. [Google Scholar] [CrossRef] [Green Version]
- Nolvachai, Y.; Amaral, M.S.S.; Marriott, P.J. Foods and contaminants analysis using multidimensional gas chromatography: An update of recent studies, technology, and applications. Anal. Chem. 2023, 95, 238–263. [Google Scholar] [CrossRef]
- Elbashir, A.A.; Aboul-Enein, H.Y. Multidimensional gas chromatography for chiral analysis. Crit. Rev. Anal. Chem. 2018, 48, 416–427. [Google Scholar] [CrossRef]
- Nolvachai, Y.; Kulsing, C.; Marriott, P.J. Multidimensional gas chromatography in food analysis. TrAC-Trends Anal. Chem. 2017, 96, 124–137. [Google Scholar] [CrossRef]
- Górecki, T.; Panić, O.; Oldridge, N. Recent advances in comprehensive two-dimensional gas chromatography (GC×GC). J. Liq. Chromatogr. Relat. Technol. 2006, 29, 1077–1104. [Google Scholar] [CrossRef]
- Abdulhussain, N.; Nawada, S.; Schoenmakers, P. Latest trends on the future of three-dimensional separations in chromatography. Chem. Rev. 2021, 121, 12016–12034. [Google Scholar] [CrossRef]
- Bahaghighat, H.D.; Freye, C.E.; Synovec, R.E. Recent advances in modulator technology for comprehensive two dimensional gas chromatography. TrAC-Trends Anal. Chem. 2019, 113, 379–391. [Google Scholar] [CrossRef]
- Tranchida, P.Q. Comprehensive two-dimensional gas chromatography: A perspective on processes of modulation. J. Chromatogr. A 2018, 1536, 2–5. [Google Scholar] [CrossRef]
- Luong, J.; Guan, X.; Xu, S.; Gras, R.; Shellie, R.A. Thermal independent modulator for comprehensive two-dimensional gas chromatography. Anal. Chem. 2016, 88, 8428–8432. [Google Scholar] [CrossRef]
- Boswell, H.; Carrillo, K.T.; Górecki, T. Evaluation of the performance of cryogen-free thermal modulation-based comprehensive two-dimensional gas chromatography-time-of-flight mass spectrometry (GC×GC–TOFMS) for the qualitative analysis of a complex bitumen sample. Separations 2020, 7, 13. [Google Scholar] [CrossRef] [Green Version]
- Panić, O.; Górecki, T.; McNeish, C.; Goldstein, A.H.; Williams, B.J.; Worton, D.R.; Hering, S.V.; Kreisberg, N.M. Development of a new consumable-free thermal modulator for comprehensive two-dimensional gas chromatography. J. Chromatogr. A 2011, 1218, 3070–3079. [Google Scholar] [CrossRef]
- Muscalu, A.M.; Edwards, M.; Górecki, T.; Reiner, E.J. Evaluation of a single-stage consumable-free modulator for comprehensive two-dimensional gas chromatography: Analysis of polychlorinated biphenyls, organochlorine pesticides and chlorobenzenes. J. Chromatogr. A 2015, 1391, 93–101. [Google Scholar] [CrossRef]
- Edwards, M.; Górecki, T. Inlet backflushing device for the improvement of comprehensive two dimensional gas chromatographic separations. J. Chromatogr. A 2015, 1402, 110–123. [Google Scholar] [CrossRef]
- Ntlhokwe, G.; Tredoux, A.G.J.; Górecki, T.; Edwards, M.; Vestner, J.; Muller, M.; Erasmus, L.; Joubert, E.; Christel Cronje, J.; de Villiers, A. Analysis of honeybush tea (Cyclopia spp.) volatiles by comprehensive two-dimensional gas chromatography using a single-stage thermal modulator. Anal. Bioanal. Chem. 2017, 409, 4127–4138. [Google Scholar] [CrossRef]
- Mucédola, V.; Vieira, L.C.S.; Pierone, D.; Gobbi, A.L.; Poppi, R.J.; Hantao, L.W. Thermal desorption modulation for comprehensive two-dimensional gas chromatography using a simple and inexpensive segmented-loop fluidic interface. Talanta 2017, 164, 470–476. [Google Scholar] [CrossRef] [PubMed]
- Collin, W.R.; Nuñovero, N.; Paul, D.; Kurabayashi, K.; Zellers, E.T. Comprehensive two-dimensional gas chromatographic separations with a temperature programmed microfabricated thermal modulator. J. Chromatogr. A 2016, 1444, 114–122. [Google Scholar] [CrossRef] [PubMed] [Green Version]
- Kim, S.J.; Kurabayashi, K. Uniform-temperature, microscale thermal modulator with area-adjusted air-gap isolation for comprehensive two-dimensional gas chromatography. Sens. Actuators B Chem. 2013, 181, 518–522. [Google Scholar] [CrossRef]
- Seeley, J.V. Recent advances in flow-controlled multidimensional gas chromatography. J. Chromatogr. A 2012, 1255, 24–37. [Google Scholar] [CrossRef] [PubMed]
- Tranchida, P.Q.; Purcaro, G.; Dugo, P.; Mondello, L. Modulators for comprehensive two-dimensional gas chromatography. TrAC-Trends Anal. Chem. 2011, 30, 1437–1461. [Google Scholar] [CrossRef]
- Yu, M.; Yang, P.; Song, H.; Guan, X. Research progress in comprehensive two-dimensional gas chromatography-mass spectrometry and its combination with olfactometry systems in the flavor analysis field. J. Food Compos. Anal. 2022, 114, 104790. [Google Scholar] [CrossRef]
- Khummueng, W.; Harynuk, J.; Marriott, P.J. Modulation ratio in comprehensive two-dimensional gas chromatography. Anal. Chem. 2006, 78, 4578–4587. [Google Scholar] [CrossRef]
- Marriott, P.J.; von Mühlen, C. The modulation ratio in comprehensive two-dimensional gas chromatography: A review of fundamental and practical considerations. Sci. Chromatogr. 2016, 8, 7–23. [Google Scholar] [CrossRef]
- Abraham, M.H.; Ibrahim, A.; Zissimos, A.M. Determination of sets of solute descriptors from chromatographic measurements. J. Chromatogr. A 2004, 1037, 29–47. [Google Scholar] [CrossRef]
- Atapattu, S.N.; Poole, C.F. Solute descriptors for characterizing retention properties of open-tubular columns of different selectivity in gas chromatography at intermediate temperatures. J. Chromatogr. A 2008, 1195, 136–145. [Google Scholar] [CrossRef]
- Poole, C.F.; Atapattu, S.N.; Poole, S.K.; Bell, A.K. Determination of solute descriptors by chromatographic methods. Anal. Chim. Acta 2009, 652, 32–53. [Google Scholar] [CrossRef]
- Talebi, M.; Patil, R.A.; Armstrong, D.W. Gas chromatography columns using ionic liquids as stationary phase. In Commercial Applications of Ionic Liquids. Green Chemistry and Sustainable Technology; Shiflett, M.B., Ed.; Springer International Publishing: Cham, Switzerland, 2020; pp. 131–165. ISBN 978-3-030-35245-5. [Google Scholar]
- Semard, G.; Peulon-Agasse, V.; Bruchet, A.; Bouillon, J.P.; Cardinaël, P. Convex hull: A new method to determine the separation space used and to optimize operating conditions for comprehensive two-dimensional gas chromatography. J. Chromatogr. A 2010, 1217, 5449–5454. [Google Scholar] [CrossRef]
- Mani-Varnosfaderani, A.; Ghaemmaghami, M. Assessment of the orthogonality in two-dimensional separation systems using criteria defined by the maximal information coefficient. J. Chromatogr. A 2015, 1415, 108–114. [Google Scholar] [CrossRef]
- Mommers, J.; van der Wal, S. Two metrics for measuring orthogonality for two-dimensional chromatography. J. Chromatogr. A 2019, 1586, 101–105. [Google Scholar] [CrossRef]
- Camenzuli, M.; Schoenmakers, P.J. A new measure of orthogonality for multi-dimensional chromatography. Anal. Chim. Acta 2014, 838, 93–101. [Google Scholar] [CrossRef]
- Camenzuli, M. The role of surface coverage and orthogonality metrics in two-dimensional chromatography. LCGC Eur. 2017, 30, 346–351. [Google Scholar]
- Zeng, Z.D.; Hugel, H.M.; Marriott, P.J. A modeling approach for orthogonality of comprehensive two-dimensional separations. Anal. Chem. 2013, 85, 6356–6363. [Google Scholar] [CrossRef]
- Mommers, J.; van der Wal, S. Column selection and optimization for comprehensive two-dimensional gas chromatography: A review. Crit. Rev. Anal. Chem. 2021, 51, 183–202. [Google Scholar] [CrossRef]
- Nan, H.; Anderson, J.L. Ionic liquid stationary phases for multidimensional gas chromatography. TrAC-Trends Anal. Chem. 2018, 105, 367–379. [Google Scholar] [CrossRef]
- Mostafa, A.; Edwards, M.; Górecki, T. Optimization aspects of comprehensive two-dimensional gas chromatography. J. Chromatogr. A 2012, 1255, 38–55. [Google Scholar] [CrossRef]
- Kueh, A.J.; Marriott, P.J.; Wynne, P.M.; Vine, J.H. Application of comprehensive two-dimensional gas chromatography to drugs analysis in doping control. J. Chromatogr. A 2003, 1000, 109–124. [Google Scholar] [CrossRef] [PubMed]
- Song, S.M.; Marriott, P.; Wynne, P. Comprehensive two-dimensional gas chromatography–quadrupole mass spectrometric analysis of drugs. J. Chromatogr. A 2004, 1058, 223–232. [Google Scholar] [CrossRef] [PubMed]
- Fushimi, A.; Hashimoto, S.; Ieda, T.; Ochiai, N.; Takazawa, Y.; Fujitani, Y.; Tanabe, K. Thermal desorption–comprehensive two-dimensional gas chromatography coupled with tandem mass spectrometry for determination of trace polycyclic aromatic hydrocarbons and their derivatives. J. Chromatogr. A 2012, 1252, 164–170. [Google Scholar] [CrossRef] [PubMed]
- Hashimoto, S.; Takazawa, Y.; Fushimi, A.; Tanabe, K.; Shibata, Y.; Ieda, T.; Ochiai, N.; Kanda, H.; Ohura, T.; Tao, Q.; et al. Global and selective detection of organohalogens in environmental samples by comprehensive two-dimensional gas chromatography-tandem mass spectrometry and high-resolution time-of-flight mass spectrometry. J. Chromatogr. A 2011, 1218, 3799–3810. [Google Scholar] [CrossRef] [PubMed]
- Tranchida, P.Q.; Franchina, F.A.; Zoccali, M.; Pantò, S.; Sciarrone, D.; Dugo, P.; Mondello, L. Untargeted and targeted comprehensive two-dimensional GC analysis using a novel unified high-speed triple quadrupole mass spectrometer. J. Chromatogr. A 2013, 1278, 153–159. [Google Scholar] [CrossRef]
- Mondello, L.; Tranchida, P.Q.; Dugo, P.; Dugo, G. Comprehensive two-dimensional gas chromatography-mass spectrometry: A review. Mass Spectrom. Rev. 2008, 27, 101–124. [Google Scholar] [CrossRef]
- Gas Chromatographs: Time-of-flight instruments for mass spectrometry. Available online: https://www.leco.com/separation-science (accessed on 23 March 2023).
- Higgins Keppler, E.A.; Jenkins, C.L.; Davis, T.J.; Bean, H.D. Advances in the application of comprehensive two-dimensional gas chromatography in metabolomics. TrAC-Trends Anal. Chem. 2018, 109, 275–286. [Google Scholar] [CrossRef]
- Prodhan, M.A.I.; McClain, C.; Zhang, X. Comprehensive two-dimensional gas chromatography mass spectrometry-based metabolomics. In Cancer Metabolomics: Methods and Applications; Hu, S., Ed.; Springer Nature Switzerland AG: Cham, Switzerland, 2021; Volume 1280, pp. 57–67. ISBN 9783030516529. [Google Scholar]
- Polet, M.; Van Gansbeke, W.; Van Eenoo, P. Development and validation of an open screening method for doping substances in urine by gas chromatography quadrupole time-of-flight mass spectrometry. Anal. Chim. Acta 2018, 1042, 52–59. [Google Scholar] [CrossRef]
- Kioussi, M.K.; Lyris, E.M.; Angelis, Y.S.; Tsivou, M.; Koupparis, M.A.; Georgakopoulos, C.G. A generic screening methodology for horse doping control by LC–TOF–MS, GC–HRMS and GC–MS. J. Chromatogr. B Anal. Technol. Biomed. Life Sci. 2013, 941, 69–80. [Google Scholar] [CrossRef]
- Shevyrin, V.; Melkozerov, V.; Nevero, A.; Eltsov, O.; Baranovsky, A.; Shafran, Y. Synthetic cannabinoids as designer drugs: New representatives of indol-3-carboxylates series and indazole-3-carboxylates as novel group of cannabinoids. Identification and analytical data. Forensic Sci. Int. 2014, 244, 263–275. [Google Scholar] [CrossRef]
- Pan, M.; Xiang, P.; Yu, Z.; Zhao, Y.; Yan, H. Development of a high-throughput screening analysis for 288 drugs and poisons in human blood using Orbitrap technology with gas chromatography-high resolution accurate mass spectrometry. J. Chromatogr. A 2019, 1587, 209–226. [Google Scholar] [CrossRef]
- Abushareeda, W.; Tienstra, M.; Lommen, A.; Blokland, M.; Sterk, S.; Kraiem, S.; Horvatovich, P.; Nielen, M.; Al-Maadheed, M.; Georgakopoulos, C. Comparison of gas chromatography/quadrupole time-of-flight and quadrupole Orbitrap mass spectrometry in anti-doping analysis: I. Detection of anabolic-androgenic steroids. Rapid Commun. Mass Spectrom. 2018, 32, 2055–2064. [Google Scholar] [CrossRef]
- Abushareeda, W.; Lyris, E.; Kraiem, S.; Al Wahaibi, A.; Alyazidi, S.; Dbes, N.; Lommen, A.; Nielen, M.; Horvatovich, P.L.; Alsayrafi, M.; et al. Gas chromatographic quadrupole time-of-flight full scan high resolution mass spectrometric screening of human urine in antidoping analysis. J. Chromatogr. B 2017, 1063, 74–83. [Google Scholar] [CrossRef]
- Ghaste, M.; Mistrik, R.; Shulaev, V. Applications of fourier transform ion cyclotron resonance (FT-ICR) and orbitrap based high resolution mass spectrometry in metabolomics and lipidomics. Int. J. Mol. Sci. 2016, 17, 816. [Google Scholar] [CrossRef] [Green Version]
- Andra, S.S.; Austin, C.; Patel, D.; Dolios, G.; Awawda, M.; Arora, M. Trends in the application of high-resolution mass spectrometry for human biomonitoring: An analytical primer to studying the environmental chemical space of the human exposome. Environ. Int. 2017, 100, 32–61. [Google Scholar] [CrossRef] [Green Version]
- Stefanuto, P.H.; Smolinska, A.; Focant, J.F. Advanced chemometric and data handling tools for GC×GC–TOF–MS: Application of chemometrics and related advanced data handling in chemical separations. TrAC-Trends Anal. Chem. 2021, 139, 116251. [Google Scholar] [CrossRef]
- Matero, S.; Van Den Berg, F.; Poutiainen, S.; Rantanen, J.; Pajander, J. Towards better process understanding: Chemometrics and multivariate measurements in manufacturing of solid dosage forms. J. Pharm. Sci. 2013, 102, 1385–1403. [Google Scholar] [CrossRef]
- Berrier, K.L.; Prebihalo, S.E.; Synovec, R.E. Advanced data handling in comprehensive two-dimensional gas chromatography. In Basic Multidimensional Gas Chromatography; Snow, N.H., Ed.; Academic Press: London, UK, 2020; Volume 12, pp. 229–268. ISBN 9780128137451. [Google Scholar]
- Trinklein, T.J.; Cain, C.N.; Ochoa, G.S.; Schöneich, S.; Mikaliunaite, L.; Synovec, R.E. Recent advances in GC×GC and chemometrics to address emerging challenges in nontargeted analysis. Anal. Chem. 2023, 95, 264–286. [Google Scholar] [CrossRef]
- Mishra, P.; Biancolillo, A.; Roger, J.M.; Marini, F.; Rutledge, D.N. New data preprocessing trends based on ensemble of multiple preprocessing techniques. TrAC-Trends Anal. Chem. 2020, 132, 116045. [Google Scholar] [CrossRef]
- Do, K.T.; Wahl, S.; Raffler, J.; Molnos, S.; Laimighofer, M.; Adamski, J.; Suhre, K.; Strauch, K.; Peters, A.; Gieger, C.; et al. Characterization of missing values in untargeted MS-based metabolomics data and evaluation of missing data handling strategies. Metabolomics 2018, 14, 128. [Google Scholar] [CrossRef] [Green Version]
- Faquih, T.; van Smeden, M.; Luo, J.; Le Cessie, S.; Kastenmüller, G.; Krumsiek, J.; Noordam, R.; van Heemst, D.; Rosendaal, F.R.; van Hylckama Vlieg, A.; et al. A workflow for missing values imputation of untargeted metabolomics data. Metabolites 2020, 10, 486. [Google Scholar] [CrossRef] [PubMed]
- Davis, T.J.; Firzli, T.R.; Higgins Keppler, E.A.; Richardson, M.; Bean, H.D. Addressing missing data in GC×GC metabolomics: Identifying missingness type and evaluating the impact of imputation methods on experimental replication. Anal. Chem. 2022, 94, 10912–10920. [Google Scholar] [CrossRef]
- Ayres, L.B.; Gomez, F.J.V.; Linton, J.R.; Silva, M.F.; Garcia, C.D. Taking the leap between analytical chemistry and artificial intelligence: A tutorial review. Anal. Chim. Acta 2021, 1161, 338403. [Google Scholar] [CrossRef] [PubMed]
- Chan, H.C.S.; Shan, H.; Dahoun, T.; Vogel, H.; Yuan, S. Advancing drug discovery via artificial intelligence. Trends Pharmacol. Sci. 2019, 40, 592–604. [Google Scholar] [CrossRef] [PubMed]
- Prebihalo, S.E.; Berrier, K.L.; Freye, C.E.; Bahaghighat, H.D.; Moore, N.R.; Pinkerton, D.K.; Synovec, R.E. Multidimensional gas chromatography: Advances in instrumentation, chemometrics, and applications. Anal. Chem. 2018, 90, 505–532. [Google Scholar] [CrossRef]
- Pollo, B.J.; Teixeira, C.A.; Belinato, J.R.; Furlan, M.F.; de Matos Cunha, I.C.; Vaz, C.R.; Volpato, G.V.; Augusto, F. Chemometrics, comprehensive two-dimensional gas chromatography and “omics” sciences: Basic tools and recent applications. TrAC-Trends Anal. Chem. 2021, 134, 116111. [Google Scholar] [CrossRef]
- Stilo, F.; Bicchi, C.; Jimenez-Carvelo, A.M.; Cuadros-Rodriguez, L.; Reichenbach, S.E.; Cordero, C. Chromatographic fingerprinting by comprehensive two-dimensional chromatography: Fundamentals and tools. TrAC-Trends Anal. Chem. 2021, 134, 116133. [Google Scholar] [CrossRef]
- Sudol, P.E.; Pierce, K.M.; Prebihalo, S.E.; Skogerboe, K.J.; Wright, B.W.; Synovec, R.E. Development of gas chromatographic pattern recognition and classification tools for compliance and forensic analyses of fuels: A review. Anal. Chim. Acta 2020, 1132, 157–186. [Google Scholar] [CrossRef]
- Leenders, J.; Frédérich, M.; De Tullio, P. Nuclear magnetic resonance: A key metabolomics platform in the drug discovery process. Drug Discov. Today Technol. 2015, 13, 39–46. [Google Scholar] [CrossRef]
- Sun, D.; Gao, W.; Hu, H.; Zhou, S. Why 90% of clinical drug development fails and how to improve it? Acta Pharm. Sin. B 2022, 12, 3049–3062. [Google Scholar] [CrossRef]
- Wishart, D.S. Emerging applications of metabolomics in drug discovery and precision medicine. Nat. Rev. Drug Discov. 2016, 15, 473–484. [Google Scholar] [CrossRef]
- Aderemi, A.V.; Ayeleso, A.O.; Oyedapo, O.O.; Mukwevho, E. Metabolomics: A scoping review of its role as a tool for disease biomarker discovery in selected non-communicable diseases. Metabolites 2021, 11, 418. [Google Scholar] [CrossRef]
- Loots, D.T. An altered Mycobacterium tuberculosis metabolome induced by katG mutations resulting in isoniazid resistance. Antimicrob. Agents Chemother. 2014, 58, 2144–2149. [Google Scholar] [CrossRef] [Green Version]
- Luier, L.; Loots, D.T. Tuberculosis metabolomics reveals adaptations of man and microbe in order to outcompete and survive. Metabolomics 2016, 12, 40. [Google Scholar] [CrossRef]
- Luies, L.; Mienie, J.; Motshwane, C.; Ronacher, K.; Walzl, G.; Loots, D.T. Urinary metabolite markers characterizing tuberculosis treatment failure. Metabolomics 2017, 13, 124. [Google Scholar] [CrossRef]
- Luies, L.; Van Reenen, M.; Ronacher, K.; Walzl, G.; Loots, D.T. Predicting tuberculosis treatment outcome using metabolomics. Biomark. Med. 2017, 11, 1057–1067. [Google Scholar] [CrossRef]
- Koen, N.; van Breda, S.V.; Loots, D.T. Elucidating the antimicrobial mechanisms of colistin sulfate on Mycobacterium tuberculosis using metabolomics. Tuberculosis 2018, 111, 14–19. [Google Scholar] [CrossRef]
- Knoll, K.E.; Lindeque, Z.; Adeniji, A.A.; Oosthuizen, C.B.; Lall, N.; Loots, D.T. Elucidating the antimycobacterial mechanism of action of ciprofloxacin using metabolomics. Microorganisms 2021, 9, 1158. [Google Scholar] [CrossRef]
- Knoll, K.E.; Lindeque, Z.; Adeniji, A.A.; Oosthuizen, C.B.; Lall, N.; Loots, D.T. Elucidating the antimycobacterial mechanism of action of decoquinate derivative RMB041 using metabolomics. Antibiotics 2021, 10, 693. [Google Scholar] [CrossRef]
- Vermeersch, K.A.; Wang, L.; McDonald, J.F.; Styczynski, M.P. Distinct metabolic responses of an ovarian cancer stem cell line. BMC Syst. Biol. 2014, 8, 134. [Google Scholar] [CrossRef] [Green Version]
- Vermeersch, K.A.; Wang, L.; Mezencev, R.; McDonald, J.F.; Styczynski, M.P. OVCAR-3 spheroid-derived cells display distinct metabolic profiles. PLoS ONE 2015, 10, e0118262. [Google Scholar] [CrossRef] [PubMed] [Green Version]
- Dhakshinamoorthy, S.; Dinh, N.T.; Skolnick, J.; Styczynski, M.P. Metabolomics identifies the intersection of phosphoethanolamine with menaquinone-triggered apoptosis in an in vitro model of leukemia. Mol. Biosyst. 2015, 11, 2406–2416. [Google Scholar] [CrossRef] [PubMed] [Green Version]
- Lamani, X.; Horst, S.; Zimmermann, T.; Schmidt, T.C. Determination of aromatic amines in human urine using comprehensive multi-dimensional gas chromatography mass spectrometry (GC×GC–qMS). Anal. Bioanal. Chem. 2015, 407, 241–252. [Google Scholar] [CrossRef] [PubMed] [Green Version]
- Barberis, E.; Timo, S.; Amede, E.; Vanella, V.V.; Puricelli, C.; Cappellano, G.; Raineri, D.; Cittone, M.G.; Rizzi, E.; Pedrinelli, A.R.; et al. Large-scale plasma analysis revealed new mechanisms and molecules associated with the host response to SARS-CoV-2. Int. J. Mol. Sci. 2020, 21, 8623. [Google Scholar] [CrossRef]
- Berna, A.Z.; Akaho, E.H.; Harris, R.M.; Congdon, M.; Korn, E.; Neher, S.; M’Farrej, M.; Burns, J.; Odom John, A.R. Reproducible breath metabolite changes in children with SARS-CoV-2 infection. ACS Infect. Dis. 2021, 7, 2596–2603. [Google Scholar] [CrossRef]
- Barberis, E.; Amede, E.; Khoso, S.; Castello, L.; Sainaghi, P.P.; Bellan, M.; Balbo, P.E.; Patti, G.; Brustia, D.; Giordano, M.; et al. Metabolomics diagnosis of COVID-19 from exhaled breath condensate. Metabolites 2021, 11, 847. [Google Scholar] [CrossRef]
- Barberis, E.; Amede, E.; Tavecchia, M.; Marengo, E.; Cittone, M.G.; Rizzi, E.; Pedrinelli, A.R.; Tonello, S.; Minisini, R.; Pirisi, M.; et al. Understanding protection from SARS-CoV-2 using metabolomics. Sci. Rep. 2021, 11, 13796. [Google Scholar] [CrossRef]
- Ramaker, R.C.; Bowling, K.M.; Lasseigne, B.N.; Hagenauer, M.H.; Hardigan, A.A.; Davis, N.S.; Gertz, J.; Cartagena, P.M.; Walsh, D.M.; Vawter, M.P.; et al. Post-mortem molecular profiling of three psychiatric disorders. Genome Med. 2017, 9, 72. [Google Scholar] [CrossRef] [Green Version]
- Schmidt, R.H.; Jokinen, J.D.; Massey, V.L.; Cameron Falkner, K.; Shi, X.; Yin, X.; Zhang, X.; Beier, J.I.; Arteel, G.E. Olanzapine activates hepatic mammalian target of rapamycin: New mechanistic insight into metabolic dysregulation with atypical antipsychotic drugs. J. Pharmacol. Exp. Ther. 2013, 347, 126–135. [Google Scholar] [CrossRef] [Green Version]
- Eshima, J.; Davis, T.J.; Bean, H.D.; Fricks, J.; Smith, B.S. A metabolomic approach for predicting diurnal changes in cortisol. Metabolites 2020, 10, 194. [Google Scholar] [CrossRef]
- Luies, L.; du Preez, I. The echo of pulmonary tuberculosis: Mechanisms of clinical symptoms and other disease-induced systemic complications. Clin. Microbiol. Rev. 2020, 33, e00036-20. [Google Scholar] [CrossRef]
- World Health Organisation. Global Tuberculosis Report 2022; World Health Organisation: Geneva, Switzerland, 2022. [Google Scholar]
- Ball, P. Ciprofloxacin: An overview of adverse experiences. J. Antimicrob. Chemother. 1986, 18, 187–193. [Google Scholar] [CrossRef]
- Aminimanizani, A.; Beringer, P.; Jelliffe, R. Comparative pharmacokinetics and pharmacodynamics of the newer fluoroquinolone antibacterials. Clin. Pharmacokinet. 2001, 40, 169–187. [Google Scholar] [CrossRef]
- Tanner, L.; Haynes, R.K.; Wiesner, L. An in vitro ADME and in vivo pharmacokinetic study of novel TB-Active decoquinate derivatives. Front. Pharmacol. 2019, 10, 120. [Google Scholar] [CrossRef]
- Huang, R.; Rofstad, E.K. Cancer stem cells (CSCs), cervical CSCs and targeted therapies. Oncotarget 2017, 8, 35351–35367. [Google Scholar] [CrossRef] [Green Version]
- Katsumata, N. Docetaxel: An alternative taxane in ovarian cancer. Br. J. Cancer 2003, 89, S9–S15. [Google Scholar] [CrossRef] [Green Version]
- Sanli, O.; Dobruch, J.; Knowles, M.A.; Burger, M.; Alemozaffar, M.; Nielsen, M.E.; Lotan, Y. Bladder cancer. Nat. Rev. Dis. Prim. 2017, 3, 17022. [Google Scholar] [CrossRef] [Green Version]
- Boffetta, P. Tobacco smoking and risk of bladder cancer. Scand. J. Urol. Nephrol. 2008, 42, 45–54. [Google Scholar] [CrossRef]
- Talaska, G. Aromatic amines and human urinary bladder cancer: Exposure sources and epidemiology. J. Environ. Sci. Heal.-Part C Environ. Carcinog. Ecotoxicol. Rev. 2003, 21, 29–43. [Google Scholar] [CrossRef]
- Yuki, K.; Fujiogi, M.; Koutsogiannaki, S. COVID-19 pathophysiology: A review. Clin. Immunol. 2020, 215, 108427. [Google Scholar] [CrossRef]
- Hasan, M.R.; Suleiman, M.; Pérez-López, A. Metabolomics in the diagnosis and prognosis of COVID-19. Front. Genet. 2021, 12, 721556. [Google Scholar] [CrossRef] [PubMed]
- Yesudhas, D.; Srivastava, A.; Gromiha, M.M. COVID-19 outbreak: History, mechanism, transmission, structural studies and therapeutics. Infection 2021, 49, 199–213. [Google Scholar] [CrossRef] [PubMed]
- Cui, Y.; Dong, J.; Yang, Y.; Yu, H.; Li, W.; Liu, Y.; Si, J.; Xie, S.; Sui, J.; Lv, L.; et al. White matter microstructural differences across major depressive disorder, bipolar disorder and schizophrenia: A tract-based spatial statistics study. J. Affect. Disord. 2020, 260, 281–286. [Google Scholar] [CrossRef] [PubMed]
- Citrome, L.; Holt, R.I.G.; Walker, D.J.; Hoffmann, V.P. Weight gain and changes in metabolic variables following olanzapine treatment in schizophrenia and bipolar disorder. Clin. Drug Investig. 2011, 31, 455–482. [Google Scholar] [CrossRef]
- Clayton, T.A.; Lindon, J.C.; Cloarec, O.; Antti, H.; Charuel, C.; Hanton, G.; Provost, J.P.; Le Net, J.L.; Baker, D.; Walley, R.J.; et al. Pharmaco-metabonomic phenotyping and personalized drug treatment. Nature 2006, 440, 1073–1077. [Google Scholar] [CrossRef]
- Alseekh, S.; Aharoni, A.; Brotman, Y.; Contrepois, K.; D’Auria, J.; Ewald, J.; Ewald, J.C.; Fraser, P.D.; Giavalisco, P.; Hall, R.D.; et al. Mass spectrometry-based metabolomics: A guide for annotation, quantification and best reporting practices. Nat. Methods 2021, 18, 747–756. [Google Scholar] [CrossRef]
- Kirwan, J.A.; Gika, H.; Beger, R.D.; Bearden, D.; Dunn, W.B.; Goodacre, R.; Theodoridis, G.; Witting, M.; Yu, L.R.; Wilson, I.D. Quality assurance and quality control reporting in untargeted metabolic phenotyping: mQACC recommendations for analytical quality management. Metabolomics 2022, 18, 70. [Google Scholar] [CrossRef]
- Sumner, L.W.; Amberg, A.; Barrett, D.; Beale, M.H.; Beger, R.; Daykin, C.A.; Fan, T.W.M.; Fiehn, O.; Goodacre, R.; Griffin, J.L.; et al. Proposed minimum reporting standards for chemical analysis: Chemical analysis working group (CAWG) metabolomics standards initiative (MSI). Metabolomics 2007, 3, 211–221. [Google Scholar] [CrossRef] [Green Version]
- Fiehn, O.; Robertson, D.; Griffin, J.; vab der Werf, M.; Nikolau, B.; Morrison, N.; Sumner, L.W.; Goodacre, R.; Hardy, N.W.; Taylor, C.; et al. The metabolomics standards initiative (MSI). Metabolomics 2007, 3, 175–178. [Google Scholar] [CrossRef] [Green Version]
- Da Silva, R.R.; Dorrestein, P.C.; Quinn, R.A. Illuminating the dark matter in metabolomics. Proc. Natl. Acad. Sci. USA 2015, 112, 12549–12550. [Google Scholar] [CrossRef] [Green Version]
- Peisl, B.Y.L.; Schymanski, E.L.; Wilmes, P. Dark matter in host-microbiome metabolomics: Tackling the unknowns—A review. Anal. Chim. Acta 2018, 1037, 13–27. [Google Scholar] [CrossRef]
- Jones, O.A.H. Illuminating the dark metabolome to advance the molecular characterisation of biological systems. Metabolomics 2018, 14, 101. [Google Scholar] [CrossRef]
- Gil de la Fuente, A.; Grace Armitage, E.; Otero, A.; Barbas, C.; Godzien, J. Differentiating signals to make biological sense—A guide through databases for MS-based non-targeted metabolomics. Electrophoresis 2017, 38, 2242–2256. [Google Scholar] [CrossRef] [Green Version]
- Dorrestein, P.C.; Mazmanian, S.K.; Knight, R. Finding the missing links among metabolites, microbes, and the host. Immunity 2014, 40, 824–832. [Google Scholar] [CrossRef] [Green Version]
- Nguyen, D.H.; Nguyen, C.H.; Mamitsuka, H. Recent advances and prospects of computational methods for metabolite identification: A review with emphasis on machine learning approaches. Brief. Bioinform. 2019, 20, 2028–2043. [Google Scholar] [CrossRef]
- Tsugawa, H. Advances in computational metabolomics and databases deepen the understanding of metabolisms. Curr. Opin. Biotechnol. 2018, 54, 10–17. [Google Scholar] [CrossRef]
- Liebal, U.W.; Phan, A.N.T.; Sudhakar, M.; Raman, K.; Blank, L.M. Machine learning applications for mass spectrometry-based metabolomics. Metabolites 2020, 10, 243. [Google Scholar] [CrossRef]


| Disease | Target/Study | Matrix | Sample Preparation and Derivatization | Stationary-Phase Combination | Modulator | Detector | Ref. |
|---|---|---|---|---|---|---|---|
| Tuberculosis | Isoniazid resistance in Mycobacterium tuberculosis | M. tuberculosis strain | Liquid extraction with CHCl3/MeOH/water (1:3:1) followed by derivatization with MXHCl in pyridine and BSTFA with 1% TMCS. | 1D: Rxi-5Sil MS (30 m × 0.25 mm ID × 0.25 μm df) 2D: Rxi-17 MS (1.0 m × 0.10 mm ID × 0.10 μm df) | Dual-stage cryogenic modulator a | TOFMS | [138] |
| Metabolomic profiling of Tb and non-Tb patients | Urine | Liquid extraction with ethyl acetate, followed by diethyl ether. Sample was derivatized with BSTFA, TMCS, and pyridine. | 1D: Rxi-5Sil MS (30 m × 0.25 mm ID × 0.25 μm df) 2D: Rxi-17Sil MS (0.9 m × 0.10 mm ID × 0.10 μm df) | Cryogenic modulator a | TOFMS | [139] | |
| Characterization of successful and failed Tb treatment outcomes | Urine | Liquid extraction with ethyl acetate, followed by diethyl ether. Sample was derivatized with BSTFA, TMCS, and pyridine. | 1D: Rxi-5Sil MS (30 m × 0.25 mm ID × 0.25 μm df) 2D: Rxi-17 MS (0.9 m × 0.10 mm ID × 0.10 μm df) | Cryogenic modulator a | TOFMS | [140] | |
| Prediction of Tb treatment failure at the time of diagnosis | Urine | Liquid extraction with ethyl acetate, followed by diethyl ether. Sample was derivatized with BSTFA, TMCS, and pyridine. | 1D: Rxi-5Sil MS (30 m × 0.25 mm ID × 0.25 μm df) 2D: Rxi-17 MS (0.9 m × 0.10 mm ID × 0.10 μm df) | Cryogenic modulator a | TOFMS | [141] | |
| Antimicrobial mechanisms of colistin sulfate on M. tuberculosis | M. tuberculosis strain | Liquid extraction with CHCl3/MeOH/water (1:3:1) followed by sample derivatization with MSTFA and 1% TMCS. | 1D: Rxi-5Sil MS (30 m × 0.25 mm ID × 0.25 μm df) 2D: Rxi-17 MS (1.2 m × 0.25 mm ID × 0.25 μm df) | NA b | TOFMS | [142] | |
| Metabolic profiling of M. tuberculosis in the presence and absence of ciprofloxacin | M. tuberculosis strain | Liquid extraction with CHCl3/MeOH/water (1:3:1) followed by derivatization with MXHCl in pyridine and BSTFA with 1% TMCS. | 1D: Rxi-5Sil MS (28.8 m × 0.25 mm ID × 0.25 μm df) 2D: Rxi-17 MS (1.2 m × 0.25 mm ID × 0.25 μm df) | NA b | TOFMS | [143] | |
| Antimycobacterial mechanism of decoquinate derivative RMB041 | M. tuberculosis strain | Liquid extraction with CHCl3/MeOH/water (1:3:1) followed by derivatization with MXHCl in pyridine and BSTFA with 1% TMCS. | 1D: Rxi-5Sil MS (28.8 m × 0.25 mm ID × 0.25 μm df) 2D: Rxi-17 MS (1.2 m × 0.25 mm ID × 0.25 μm df) | NA b | TOFMS | [144] | |
| Cancer | Effect of docetaxel treatment on ovarian cancer cells and stem cells | OVCAR-3 ovarian cancer cell and isogenic ovarian cancer stem cell | Extracts were dried using vacuum concentrator and derivatization with OMXHCl in pyridine, MSTFA, and 1% TMCS. | 1D: HP-5 (30 m × 0.32 mm ID × 0.25 μm df) 2D: Rtx-200 (2 m × 0.25 mm ID × 0.25 μm df) | NA b | TOFMS | [145] |
| Metabolic differences between ovarian cancer cells and their stem cells | OVCAR-3 ovarian cancer cell and isogenic ovarian cancer stem cell | Extracts were dried using vacuum concentrator and derivatized with OMXHCl in pyridine, MSTFA, and 1% TMCS. | 1D: HP-5 (30 m × 0.32 mm ID × 0.25 μm df) 2D: Rtx-200 (2 m × 0.25 mm ID × 0.25 μm df) | NA b | TOFMS | [146] | |
| Antiproliferative role of menaquinone (vitamin K2) on the leukemic Jurkat cell line | Jurkat and lymphoblast cells | Extracts were dried using vacuum concentrator and derivatized with OMXHCl in pyridine, MSTFA, and 1% TMCS. | 1D: HP-5 (30 m × 0.320 mm ID × 0.25 μm df) 2D: Rtx-200 (2 m × 0.25 mm ID × 0.25 μm df) | NA b | TOFMS | [147] | |
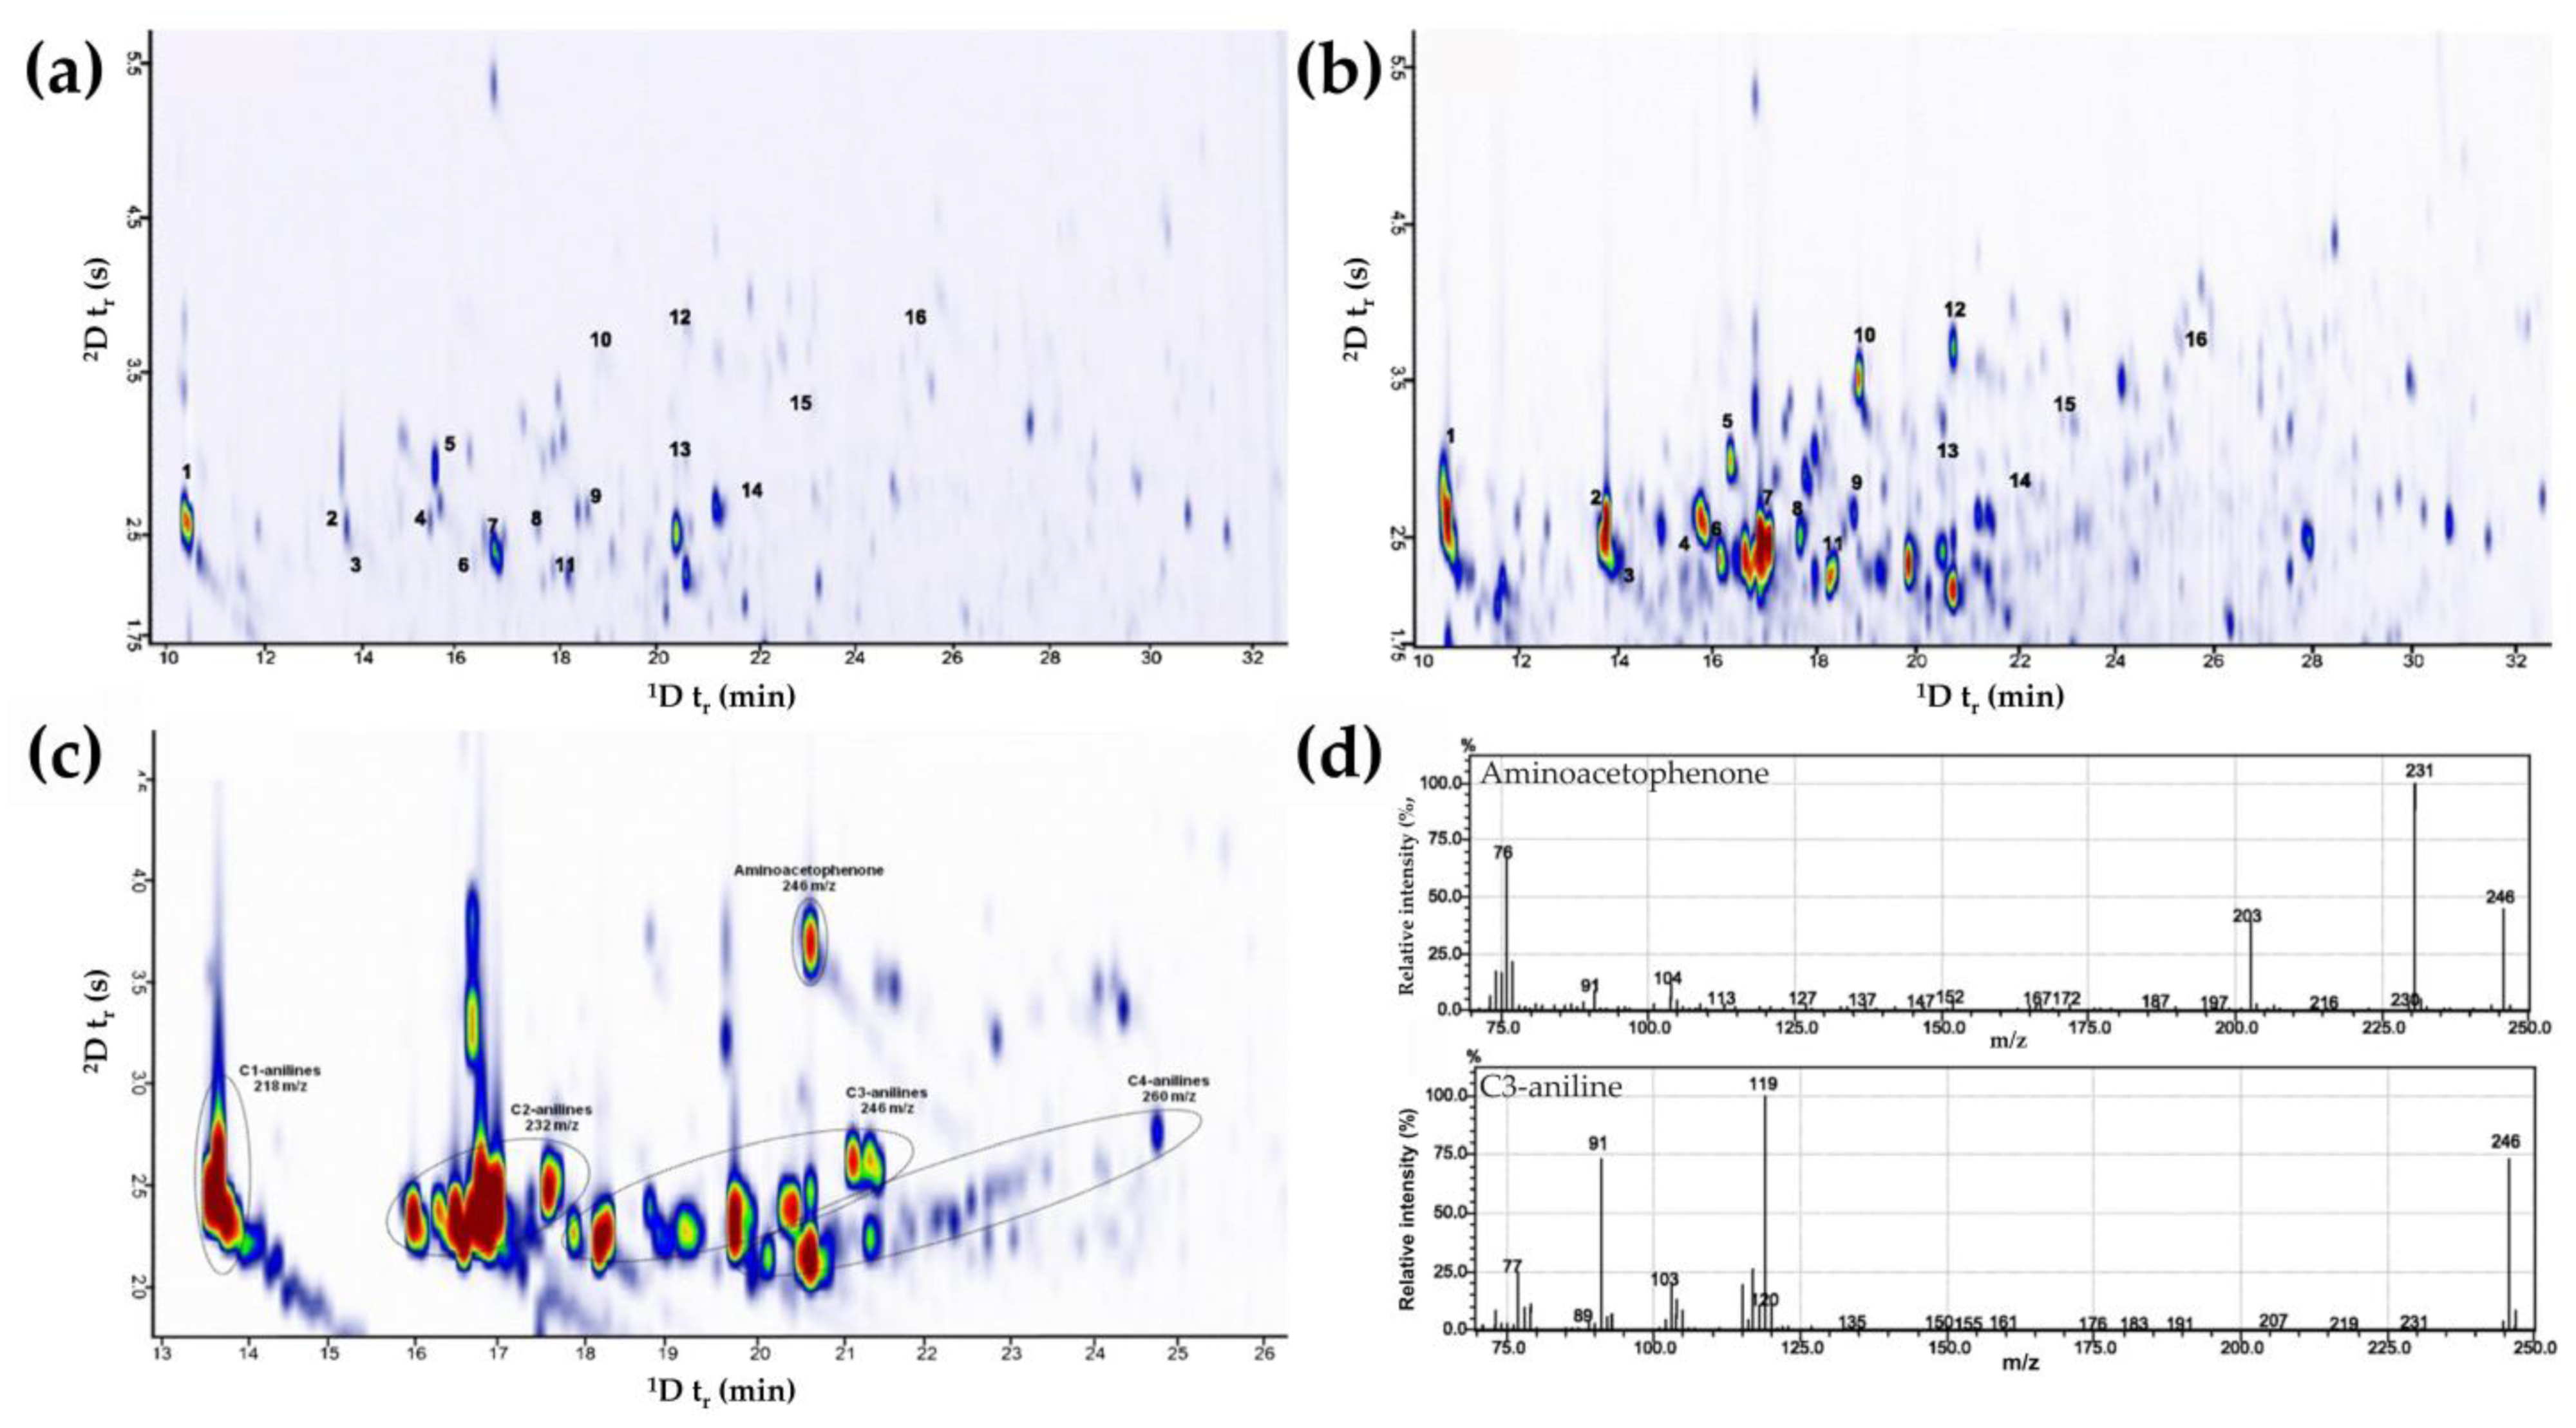
| Aromatic amines in smokers’ urine | Urine volatiles | Liquid extraction with diethyl ether followed by back extraction with concentrated hydrochloric acid (37 %). Samples were derivatized through diazotization and iodination. Derivatized analytes were extracted by HS-SPME method with PDMS/DVB fiber. | 1D: DB-5 (30 m × 0.25 mm ID × 0.25 μm df) 2D: BPX50 (2.7 m × 0.15 mm ID × 0.15 μm df) | Cryogenic modulator a | TOFMS | [148] | |
| Coronavirus disease | Large-scale metabolomic profiling | Plasma | Liquid extraction with ACN/IPA/water (3:3:2) solution. Sample was derivatized with MOX and BSTFA. | 1D: Rxi-5Sil MS (30 m × 0.25 mm ID × 0.25 μm df) 2D: Rxi-17Sil MS (2 m× 0.25 mm ID × 0.25 μm df) | LECO QuadJet thermal modulator | TOFMS | [149] |
| Targeted metabolite changes in children with SARS-CoV-2 infection | Breath samples | Collection of breath samples into SamplePro FlexFilm sample bag, then transferred into thermal desorption sorbent tubes. | 1D: Stabilwax (30 m × 0.25 mm ID × 0.25 μm df) 2D: Rtx-200 MS (5 m × 0.25 mm ID × 0.10 μm df) | Flow modulatora | TOFMS | [150] | |
| Untargeted metabolomic profiling of COVID-19 and non-COVID-19 patients | Exhaled breath condensate | Liquid extraction with ACN/IPA/water (3:3:2) solution. Sample was derivatized with MOX and BSTFA. | 1D: Rxi-5Sil MS (30 m × 0.25 mm ID × 0.25 μm df) 2D: Rxi-17Sil MS (2 m× 0.25 mm ID × 0.25 μm df) | LECO QuadJet thermal modulator | TOFMS | [151] | |
| Untargeted metabolomics profiling to predict protection against infection | Serum | Liquid extraction with ACN/IPA/water (3:3:2) solution. Sample was derivatized with MOX and BSTFA. | 1D: Rxi-5Sil MS (30 m × 0.25 mm ID × 0.25 μm df) 2D: Rxi-17Sil MS (2 m × 0.25 mm ID × 0.25 μm df) | LECO QuadJet thermal modulator | TOFMS | [152] | |
| Psychiatric disorder | Post-mortem molecular profiling of three psychiatric disorders | Brain tissue | Frozen brain tissue was homogenized in 50% MeOH and dried using vacuum concentrator. Derivatization was carried out with OMX in pyridine and MSTFA. | 1D: Rtx-5MS (20 m × 0.25 mm × 0.5 μm df) 2D: Rtx-200MS (2.5 m × 0.18 mm × 0.2 μm df) | Cryogenic modulator a | TOFMS | [153] |
| Olanzapine side effects on hepatic metabolism | Mice liver and plasma | Liquid extraction with ice-cold MeOH followed by drying with centrifugal evaporator and dissolved in ACN. Sample derivatization was carried out with MTBSTFA and 1% TBDMSCI. | 1D: DB-5MS (60 m× 0.25 mm ID × 0.25 μm df) 2D: DB-17MS (1 m × 0.25 mm ID × 0.25 μm df) | LECO QuadJet thermal modulator | TOFMS | [154] | |
| Dysregulation of cortisol secretion | Urine volatiles | Urine volatiles were extracted by HS-SPME method with DVB/CAR/PDMS-coated fiber. | 1D: Rxi-624 Sil MS (60 m × 0.25 mm × 1.4 µm df) 2D: Stabilwax (1 m × 0.25 mm × 0.5 µm df) | QuadJet cryogenic modulator a | TOFMS | [155] |
Disclaimer/Publisher’s Note: The statements, opinions and data contained in all publications are solely those of the individual author(s) and contributor(s) and not of MDPI and/or the editor(s). MDPI and/or the editor(s) disclaim responsibility for any injury to people or property resulting from any ideas, methods, instructions or products referred to in the content. |
© 2023 by the authors. Licensee MDPI, Basel, Switzerland. This article is an open access article distributed under the terms and conditions of the Creative Commons Attribution (CC BY) license (https://creativecommons.org/licenses/by/4.0/).
Share and Cite
Zaid, A.; Hassan, N.H.; Marriott, P.J.; Wong, Y.F. Comprehensive Two-Dimensional Gas Chromatography as a Bioanalytical Platform for Drug Discovery and Analysis. Pharmaceutics 2023, 15, 1121. https://doi.org/10.3390/pharmaceutics15041121
Zaid A, Hassan NH, Marriott PJ, Wong YF. Comprehensive Two-Dimensional Gas Chromatography as a Bioanalytical Platform for Drug Discovery and Analysis. Pharmaceutics. 2023; 15(4):1121. https://doi.org/10.3390/pharmaceutics15041121
Chicago/Turabian StyleZaid, Atiqah, Norfarizah Hanim Hassan, Philip J. Marriott, and Yong Foo Wong. 2023. "Comprehensive Two-Dimensional Gas Chromatography as a Bioanalytical Platform for Drug Discovery and Analysis" Pharmaceutics 15, no. 4: 1121. https://doi.org/10.3390/pharmaceutics15041121