


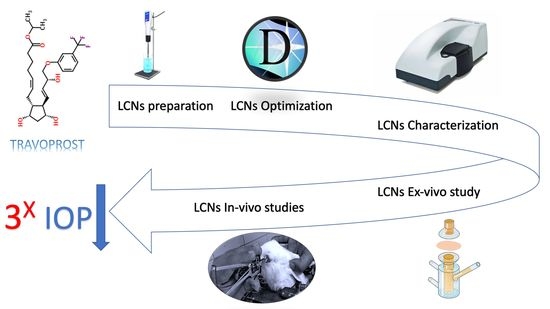
Travoprost Liquid Nanocrystals: An Innovative Armamentarium for Effective Glaucoma Therapy
 and
and
Abstract
:
1. Introduction
2. Materials and Methods
2.1. Materials
2.2. Preparation of Plain and TRAVO-Loaded LCNs
2.3. Experimental Design
2.4. Quantitative Analysis of TRAVO Using High-Performance Liquid Chromatography (HPLC)
2.5. Characterization of the Fabricated Travoprost Loaded LCNs
2.5.1. Particle Size (PS), Polydispersity Index (PDI), and Zeta Potential (ZP)
2.5.2. Determination of TRAVO Entrapment Efficiency (EE%)
2.5.3. LCNs Morphology Investigation Using High-Performance Transmission Electron Microscopy (TEM)
2.5.4. Crystallinity Study Using X-ray Powder Diffraction (XRPD)
2.6. Ex Vivo Study for Corneal Permeation of TRAVO-Loaded LCNs
2.7. Stability Study of the Selected TRAVO-Loaded LCNs
2.8. Sterilization of TRAVO Loaded LCNs by Gamma Irradiation
2.9. In Vivo Ocular Evaluation of the Selected TRAVO-Loaded LCNs
2.9.1. Pharmacodynamic Study in Rabbits Using Steroid-Induced Ocular Hypertension Model
2.9.2. Pharmacokinetic Study in Rabbits
Quantitative Determination of TRAVO Using LC-MS/MS
2.9.3. Ocular Tolerability
2.9.4. Histopathological Examinations
2.10. Statistical Analysis
3. Results and Discussion
3.1. Experimental Design
3.1.1. Data Analysis
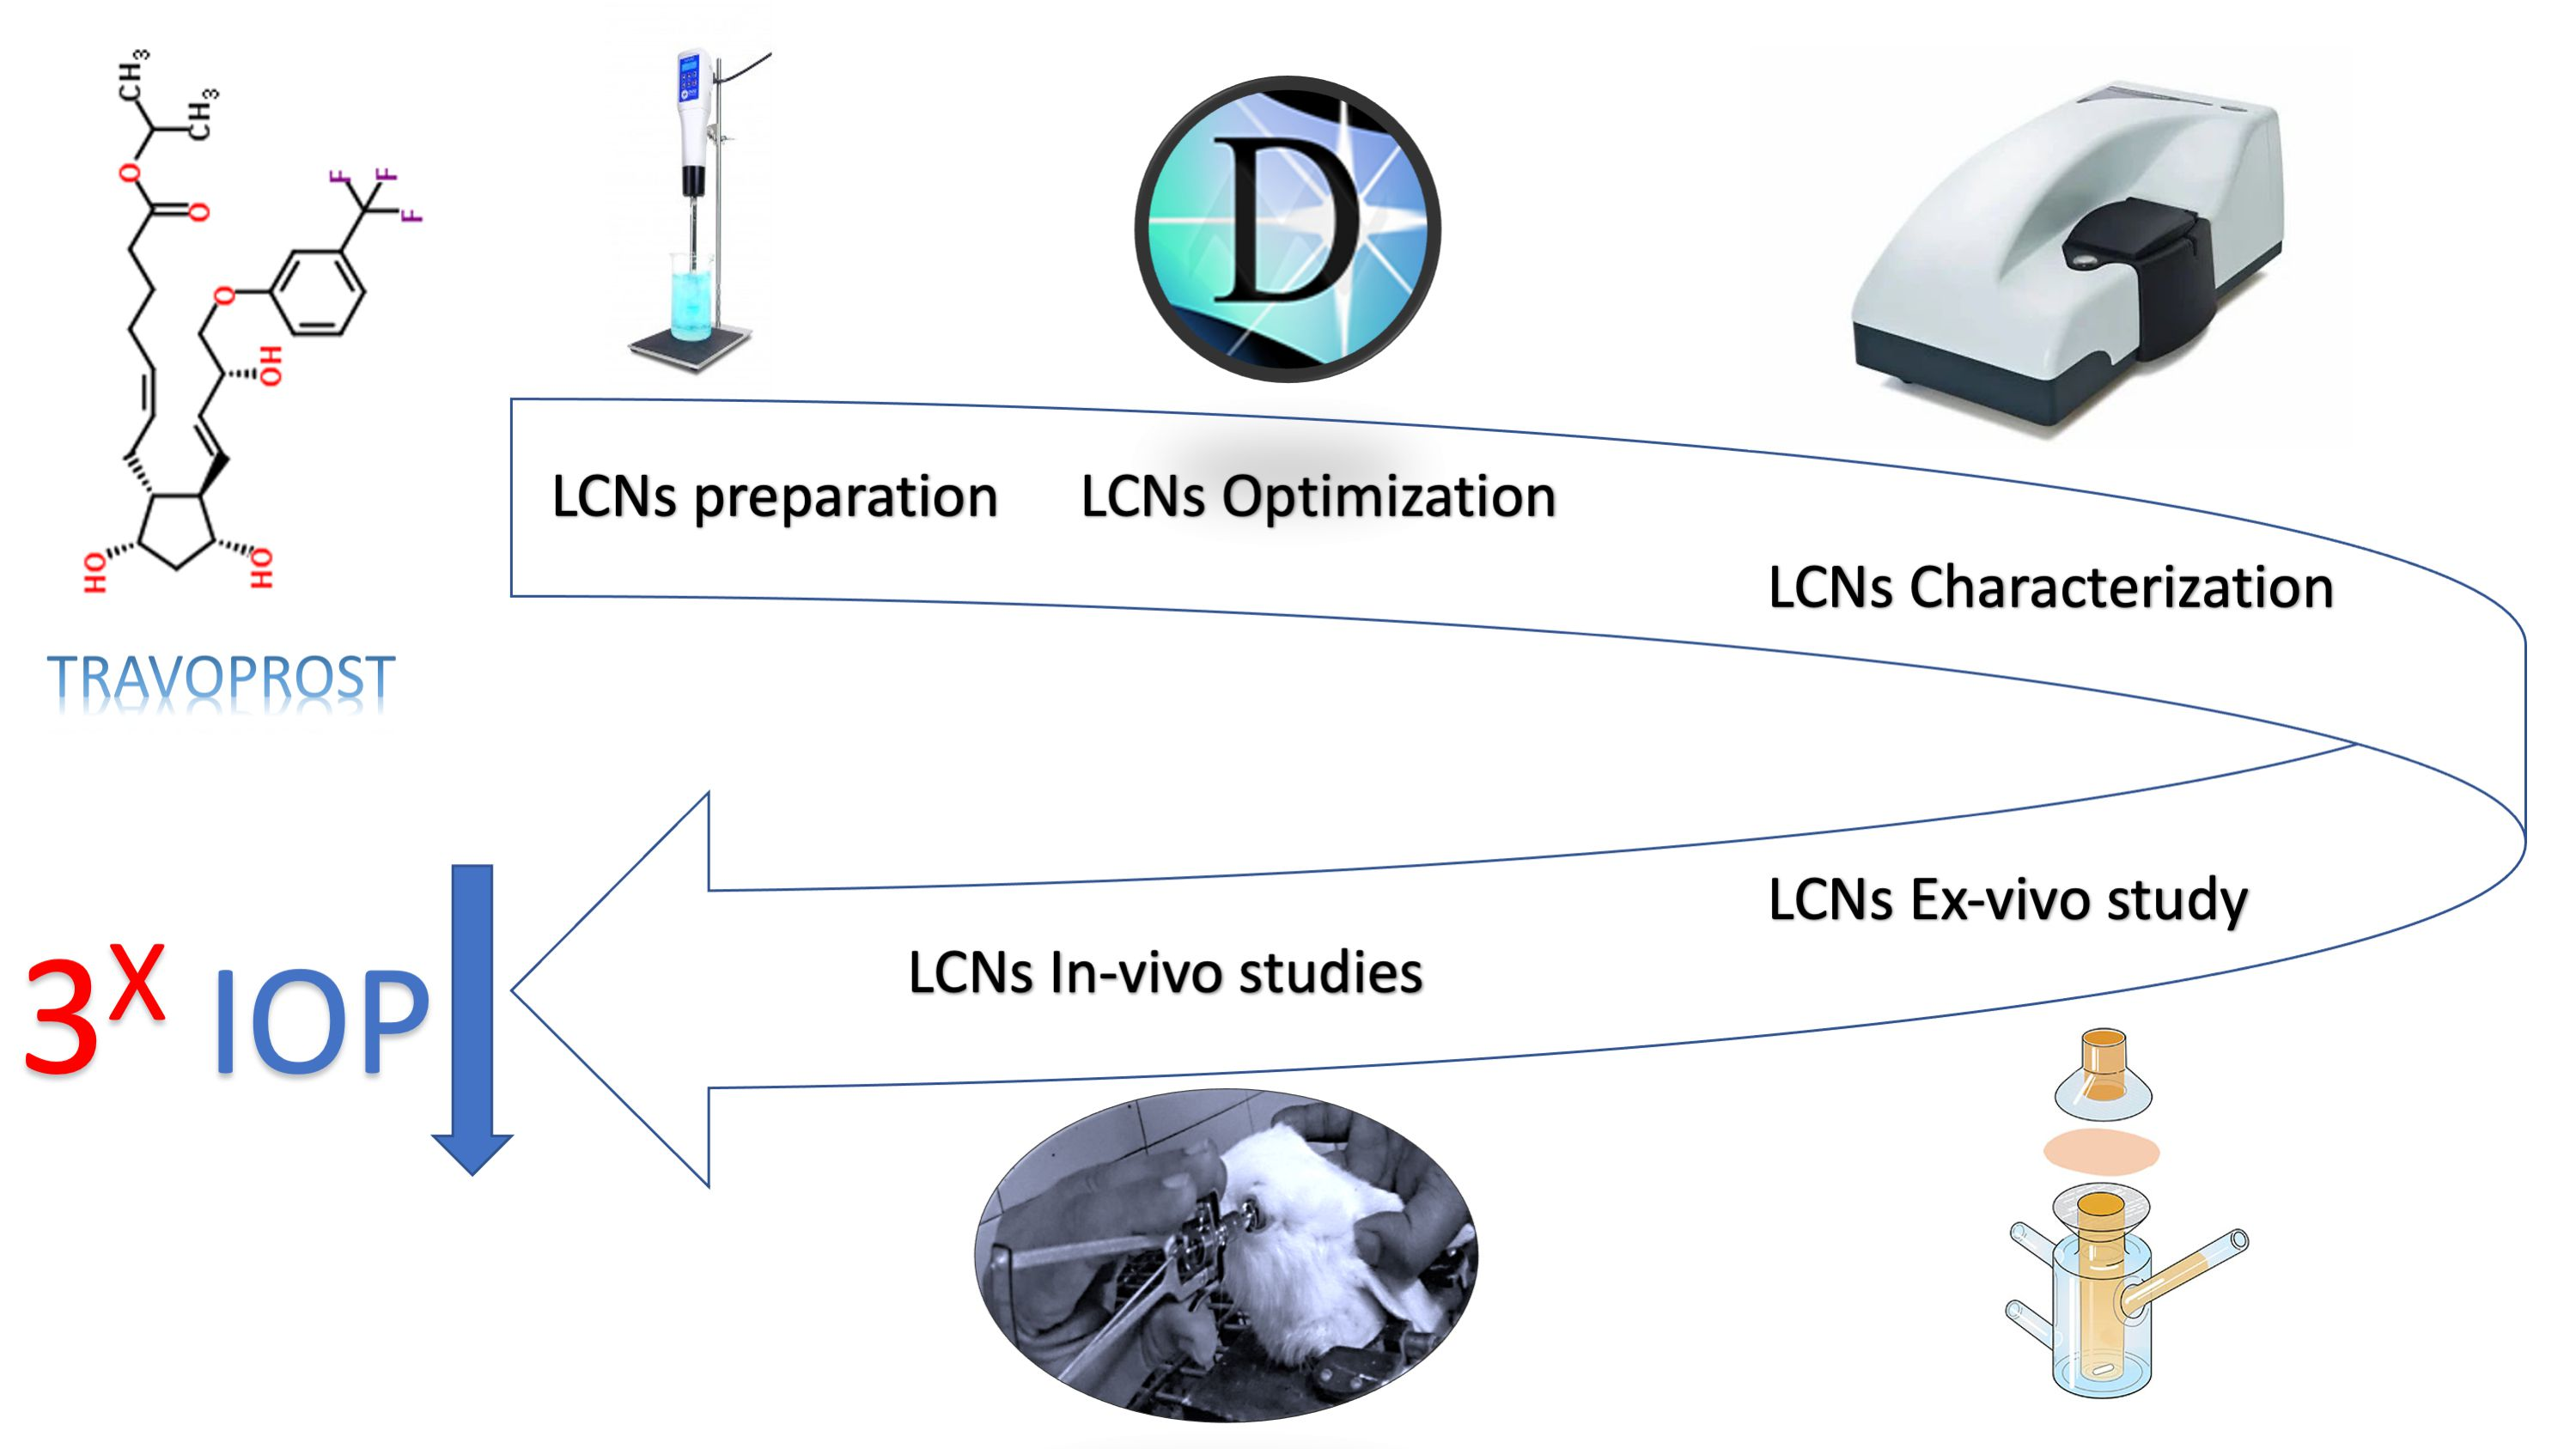
PS Response
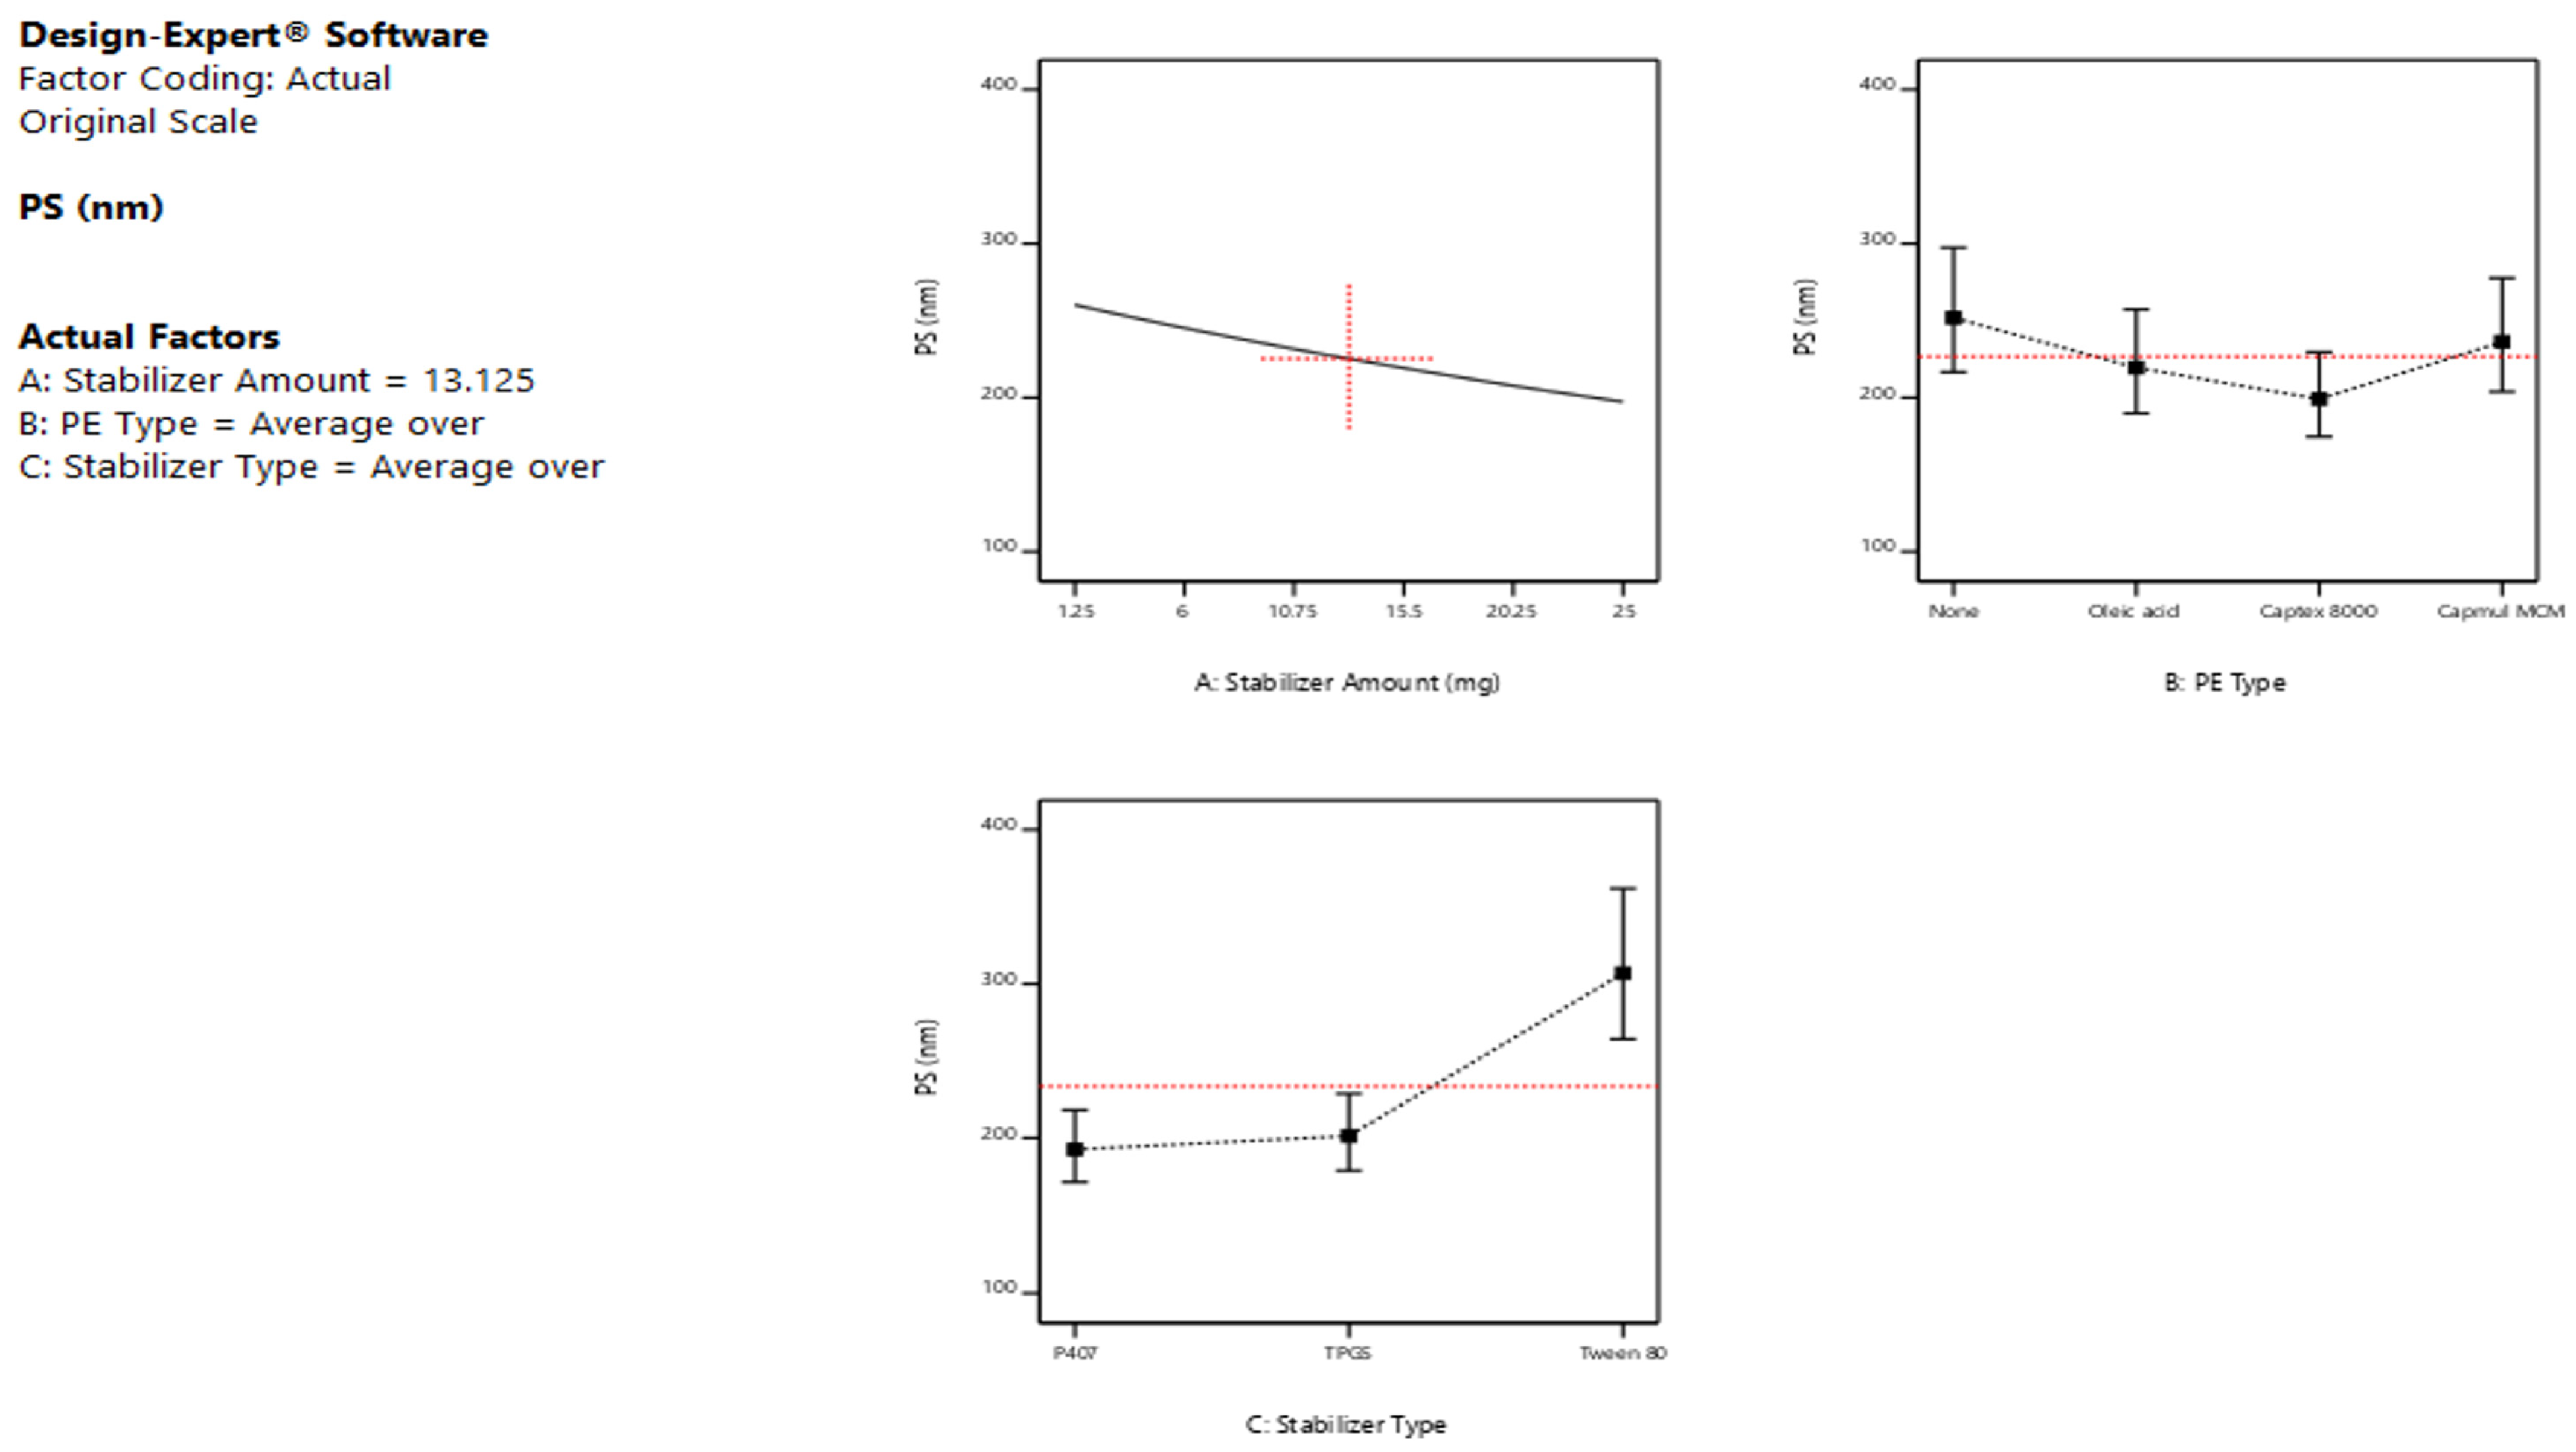
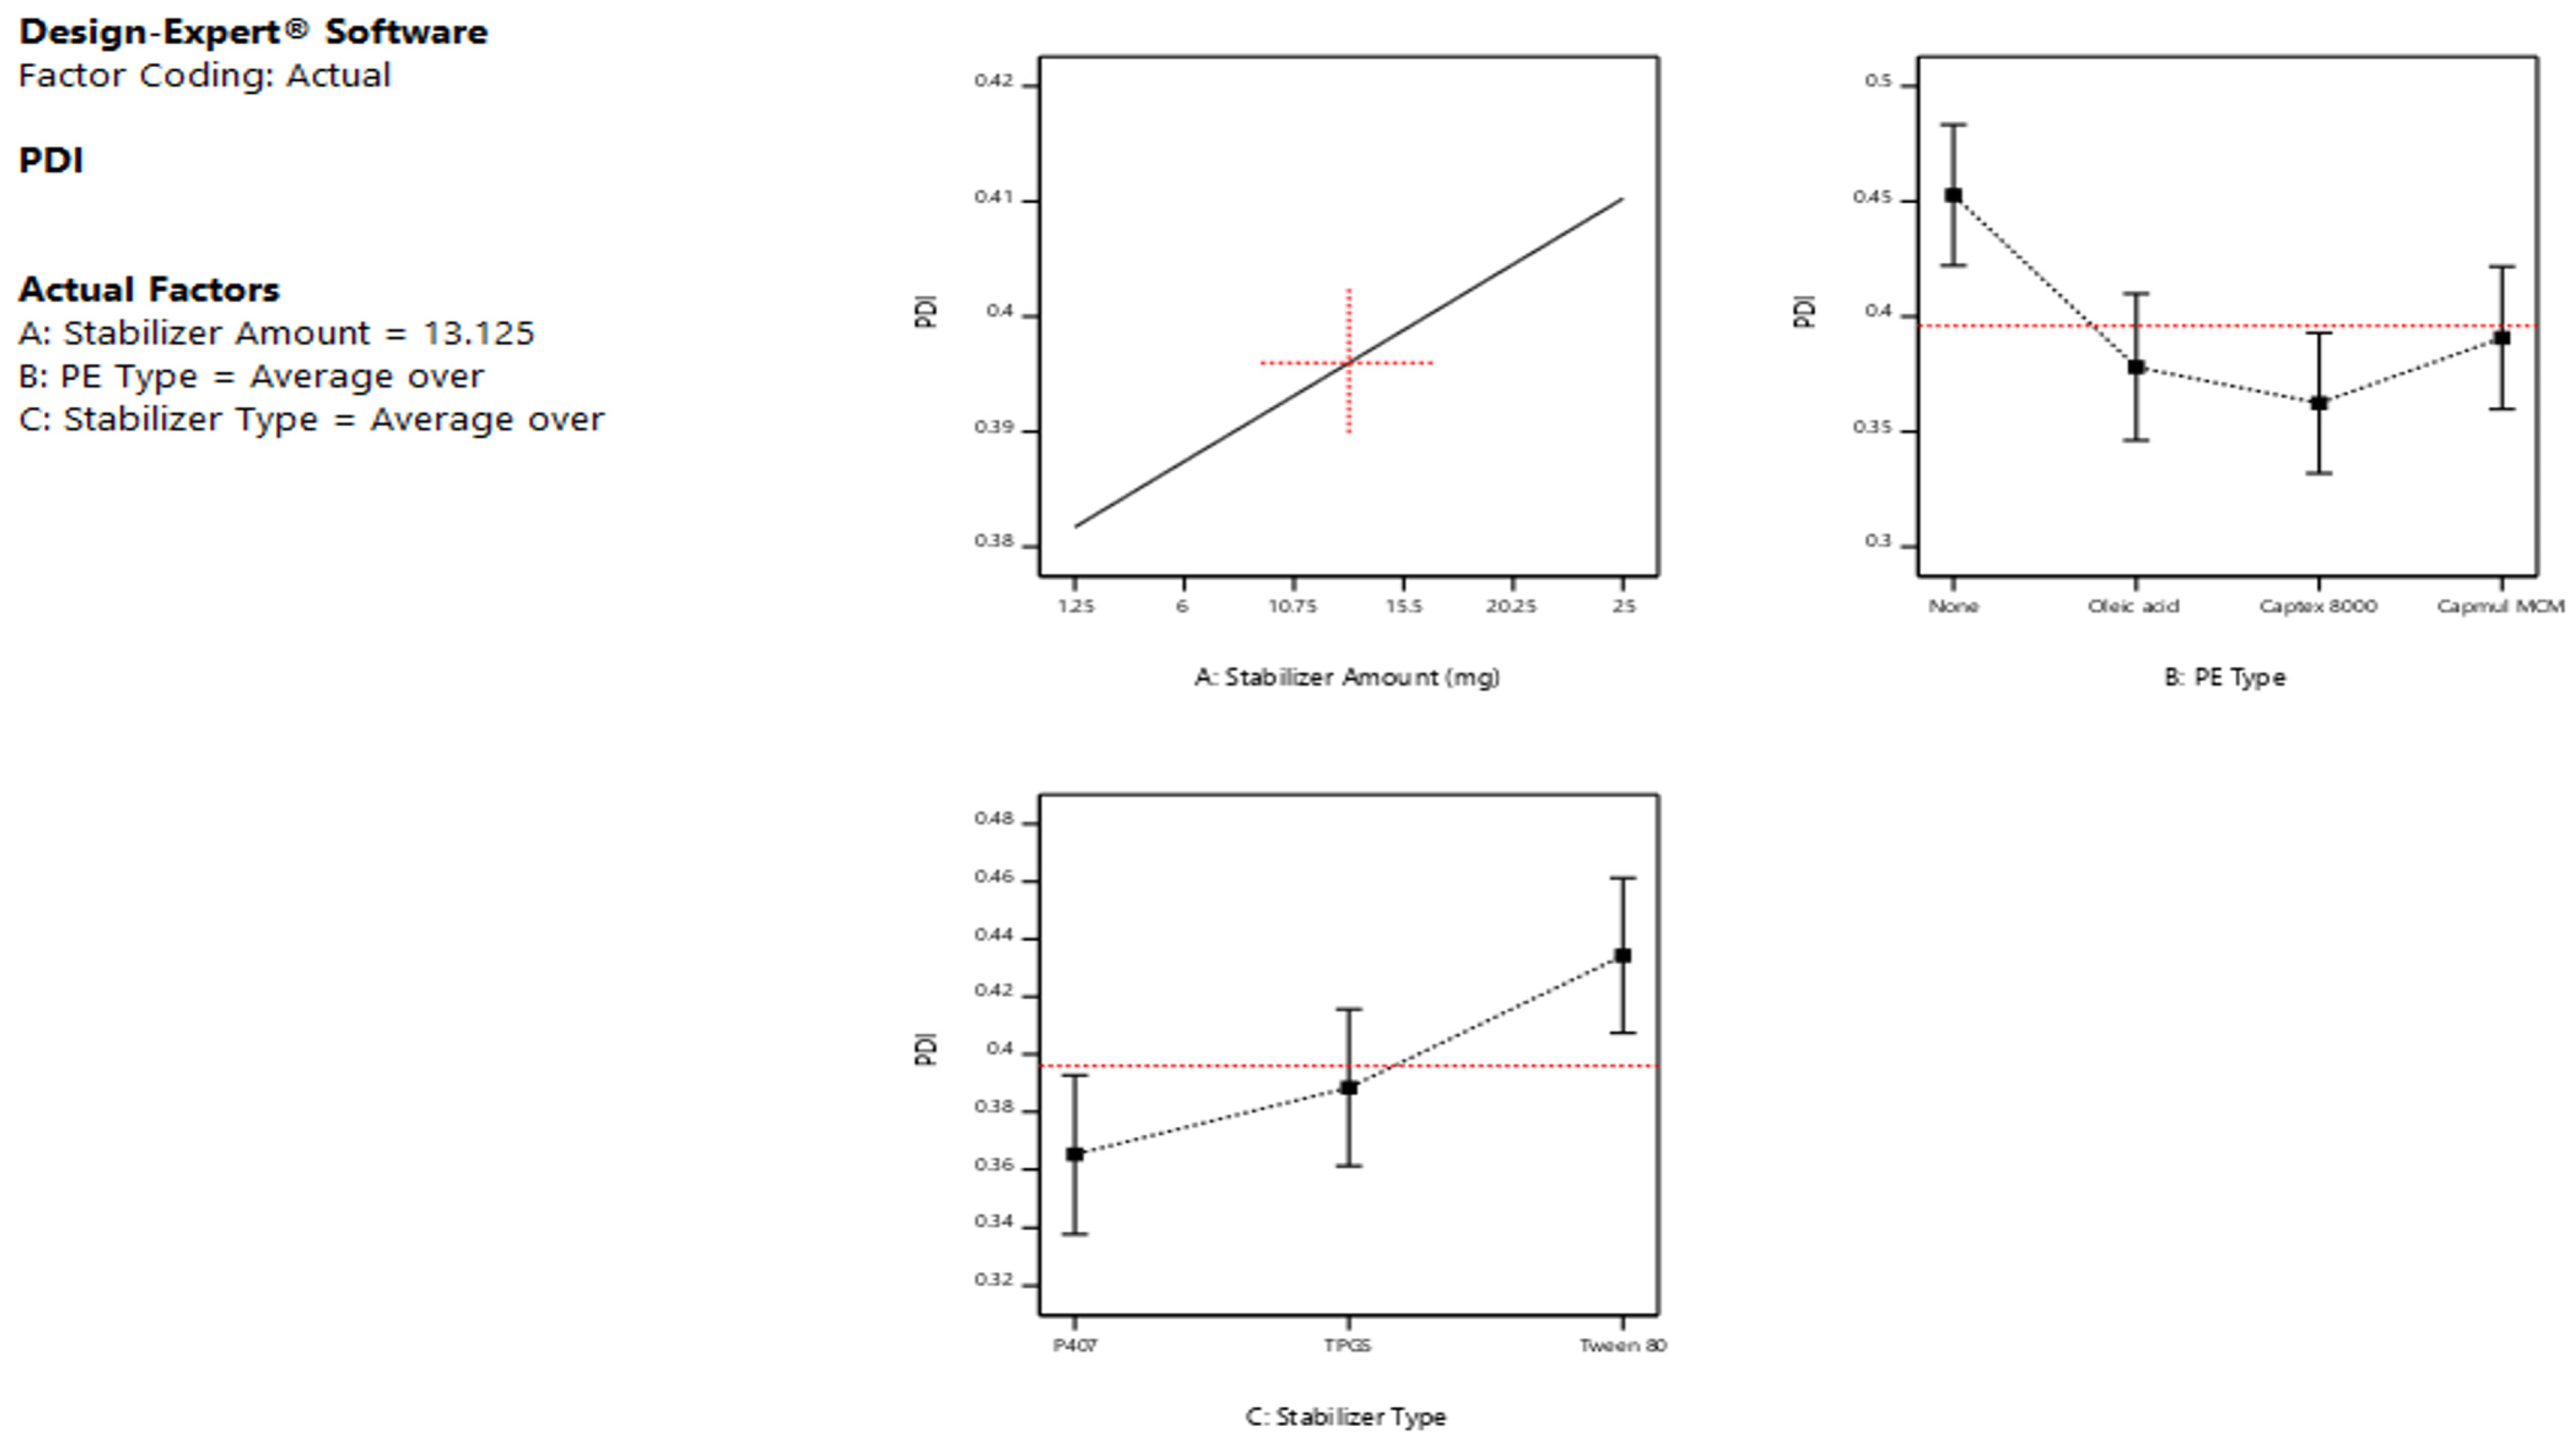
PDI Response
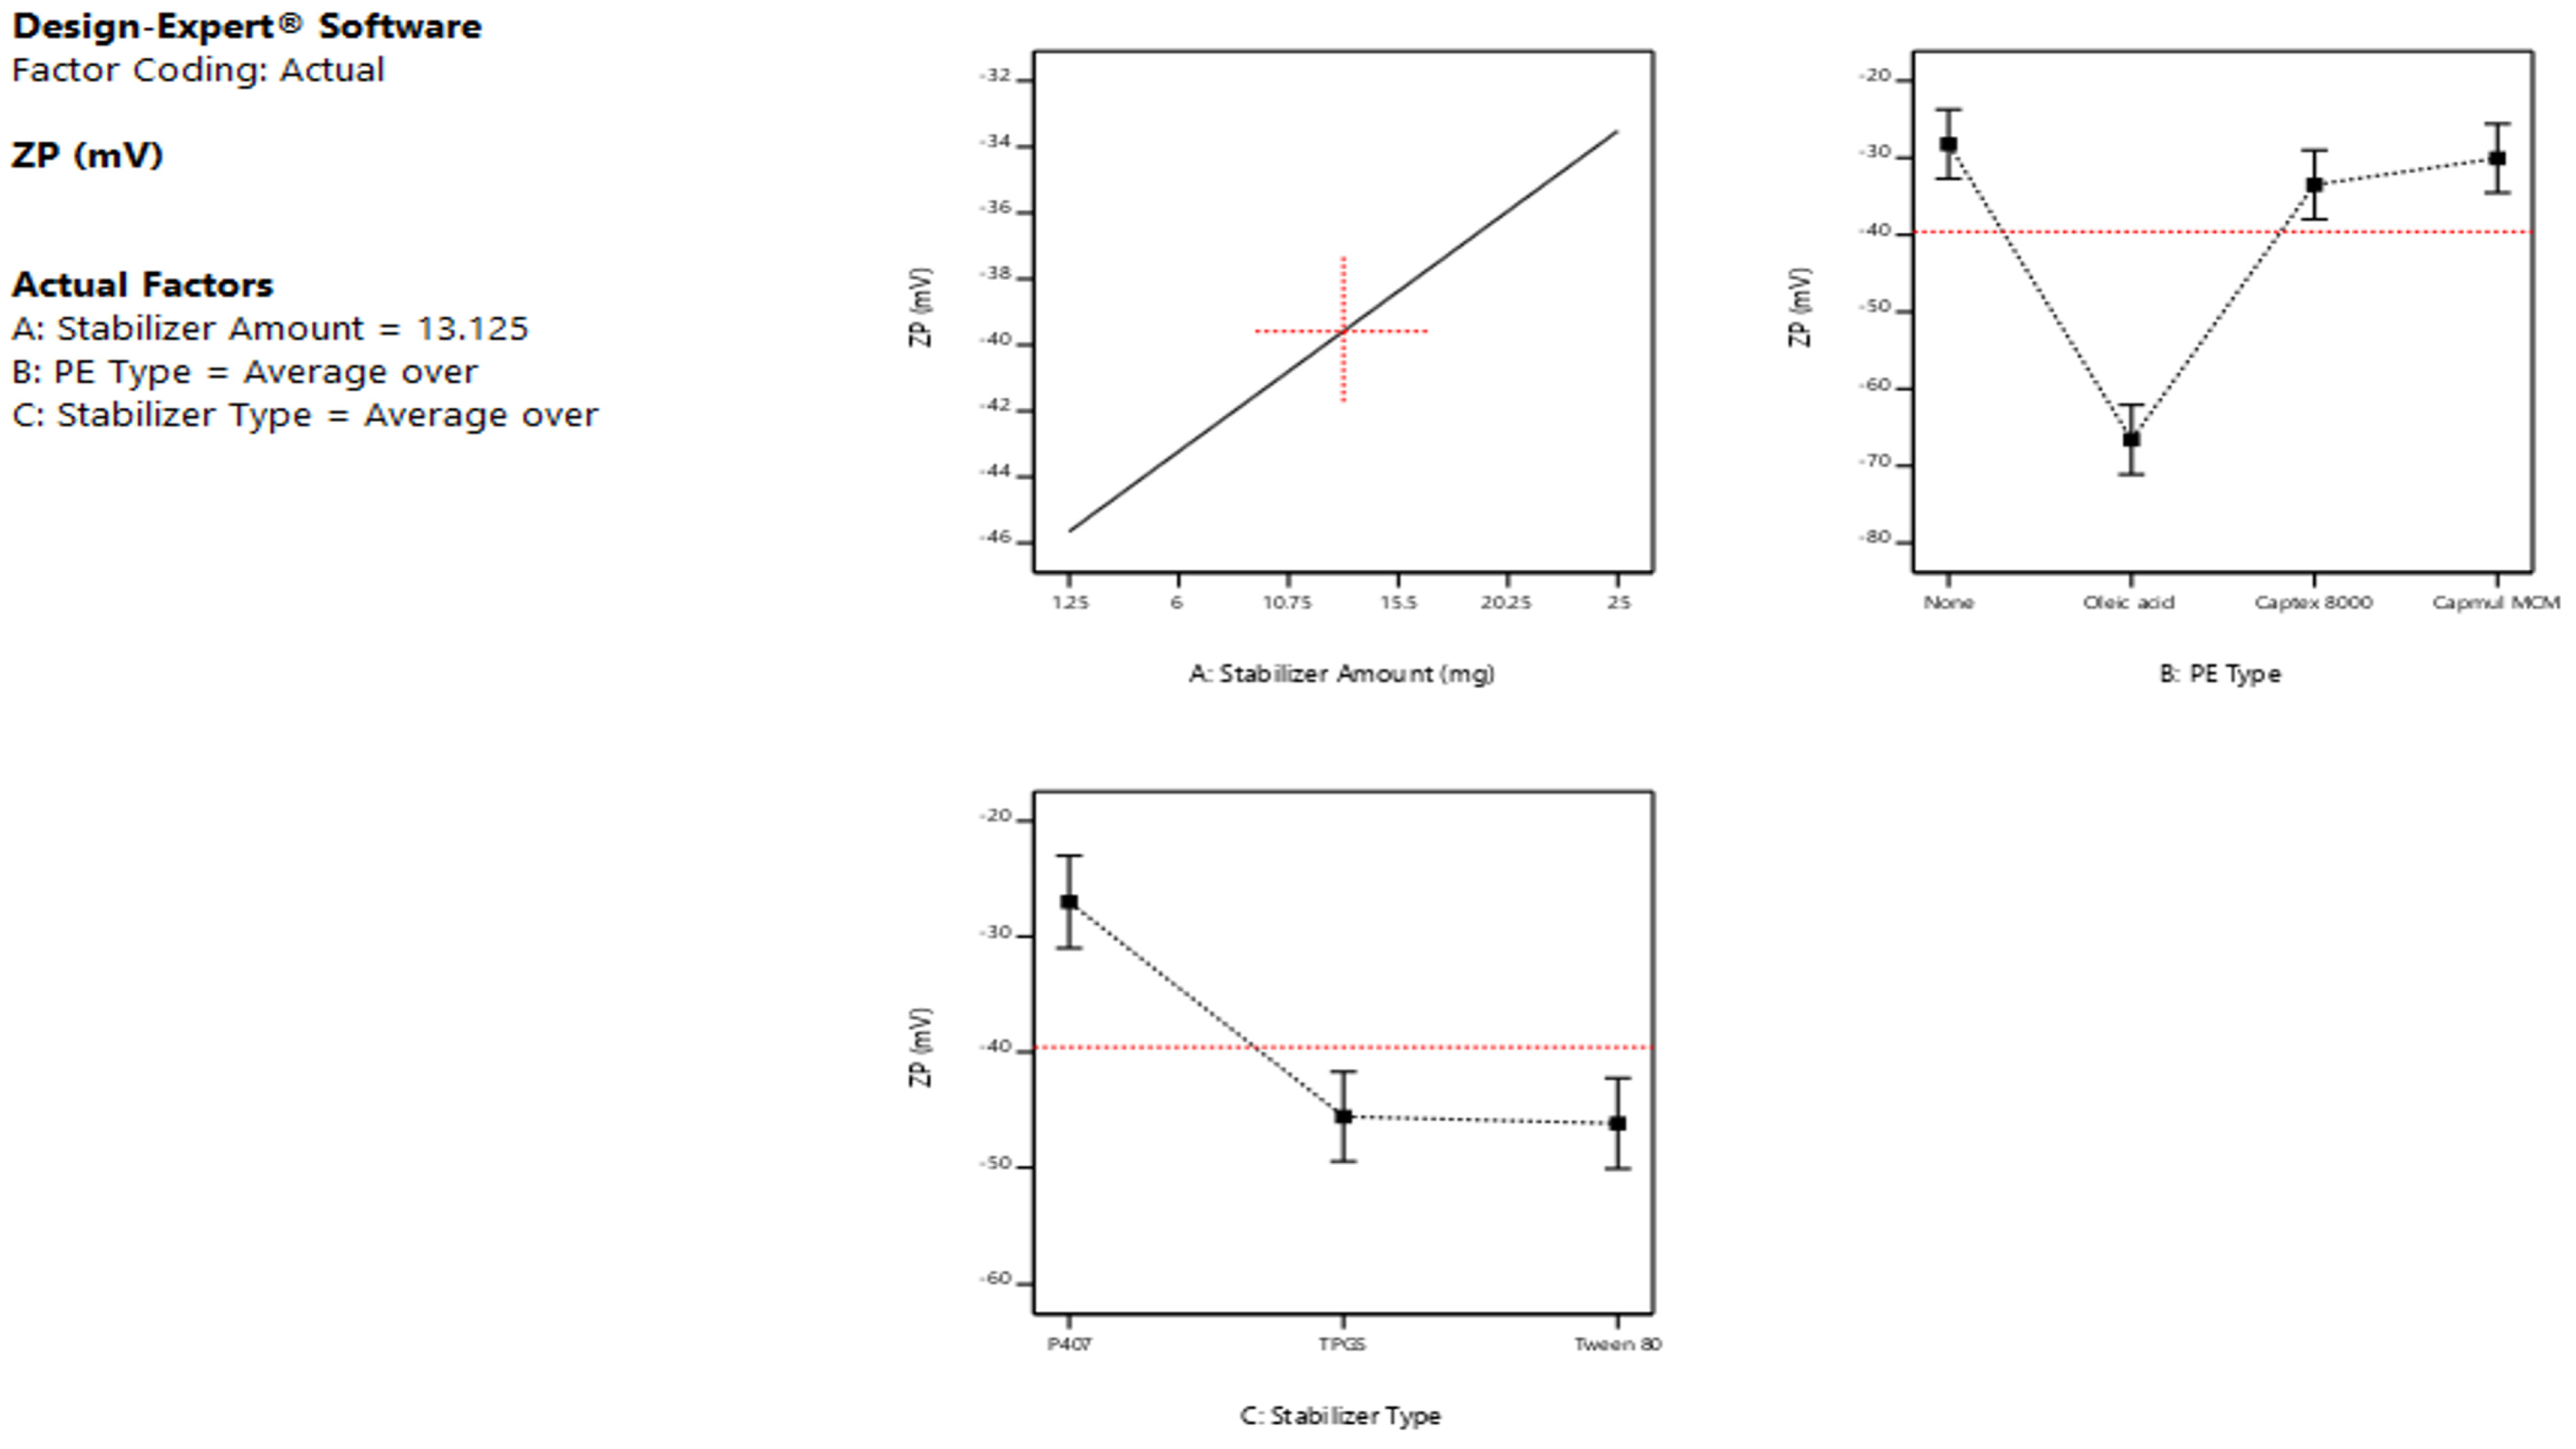
Zeta Potential Response
3.1.2. Model Validation and Optimization
3.2. Preparation of TRAVO-Loaded LCNs
3.3. Characterization of TRAVO-Loaded LCNs
3.3.1. PS, PDI, and ZP
3.3.2. Entrapment Efficiency %
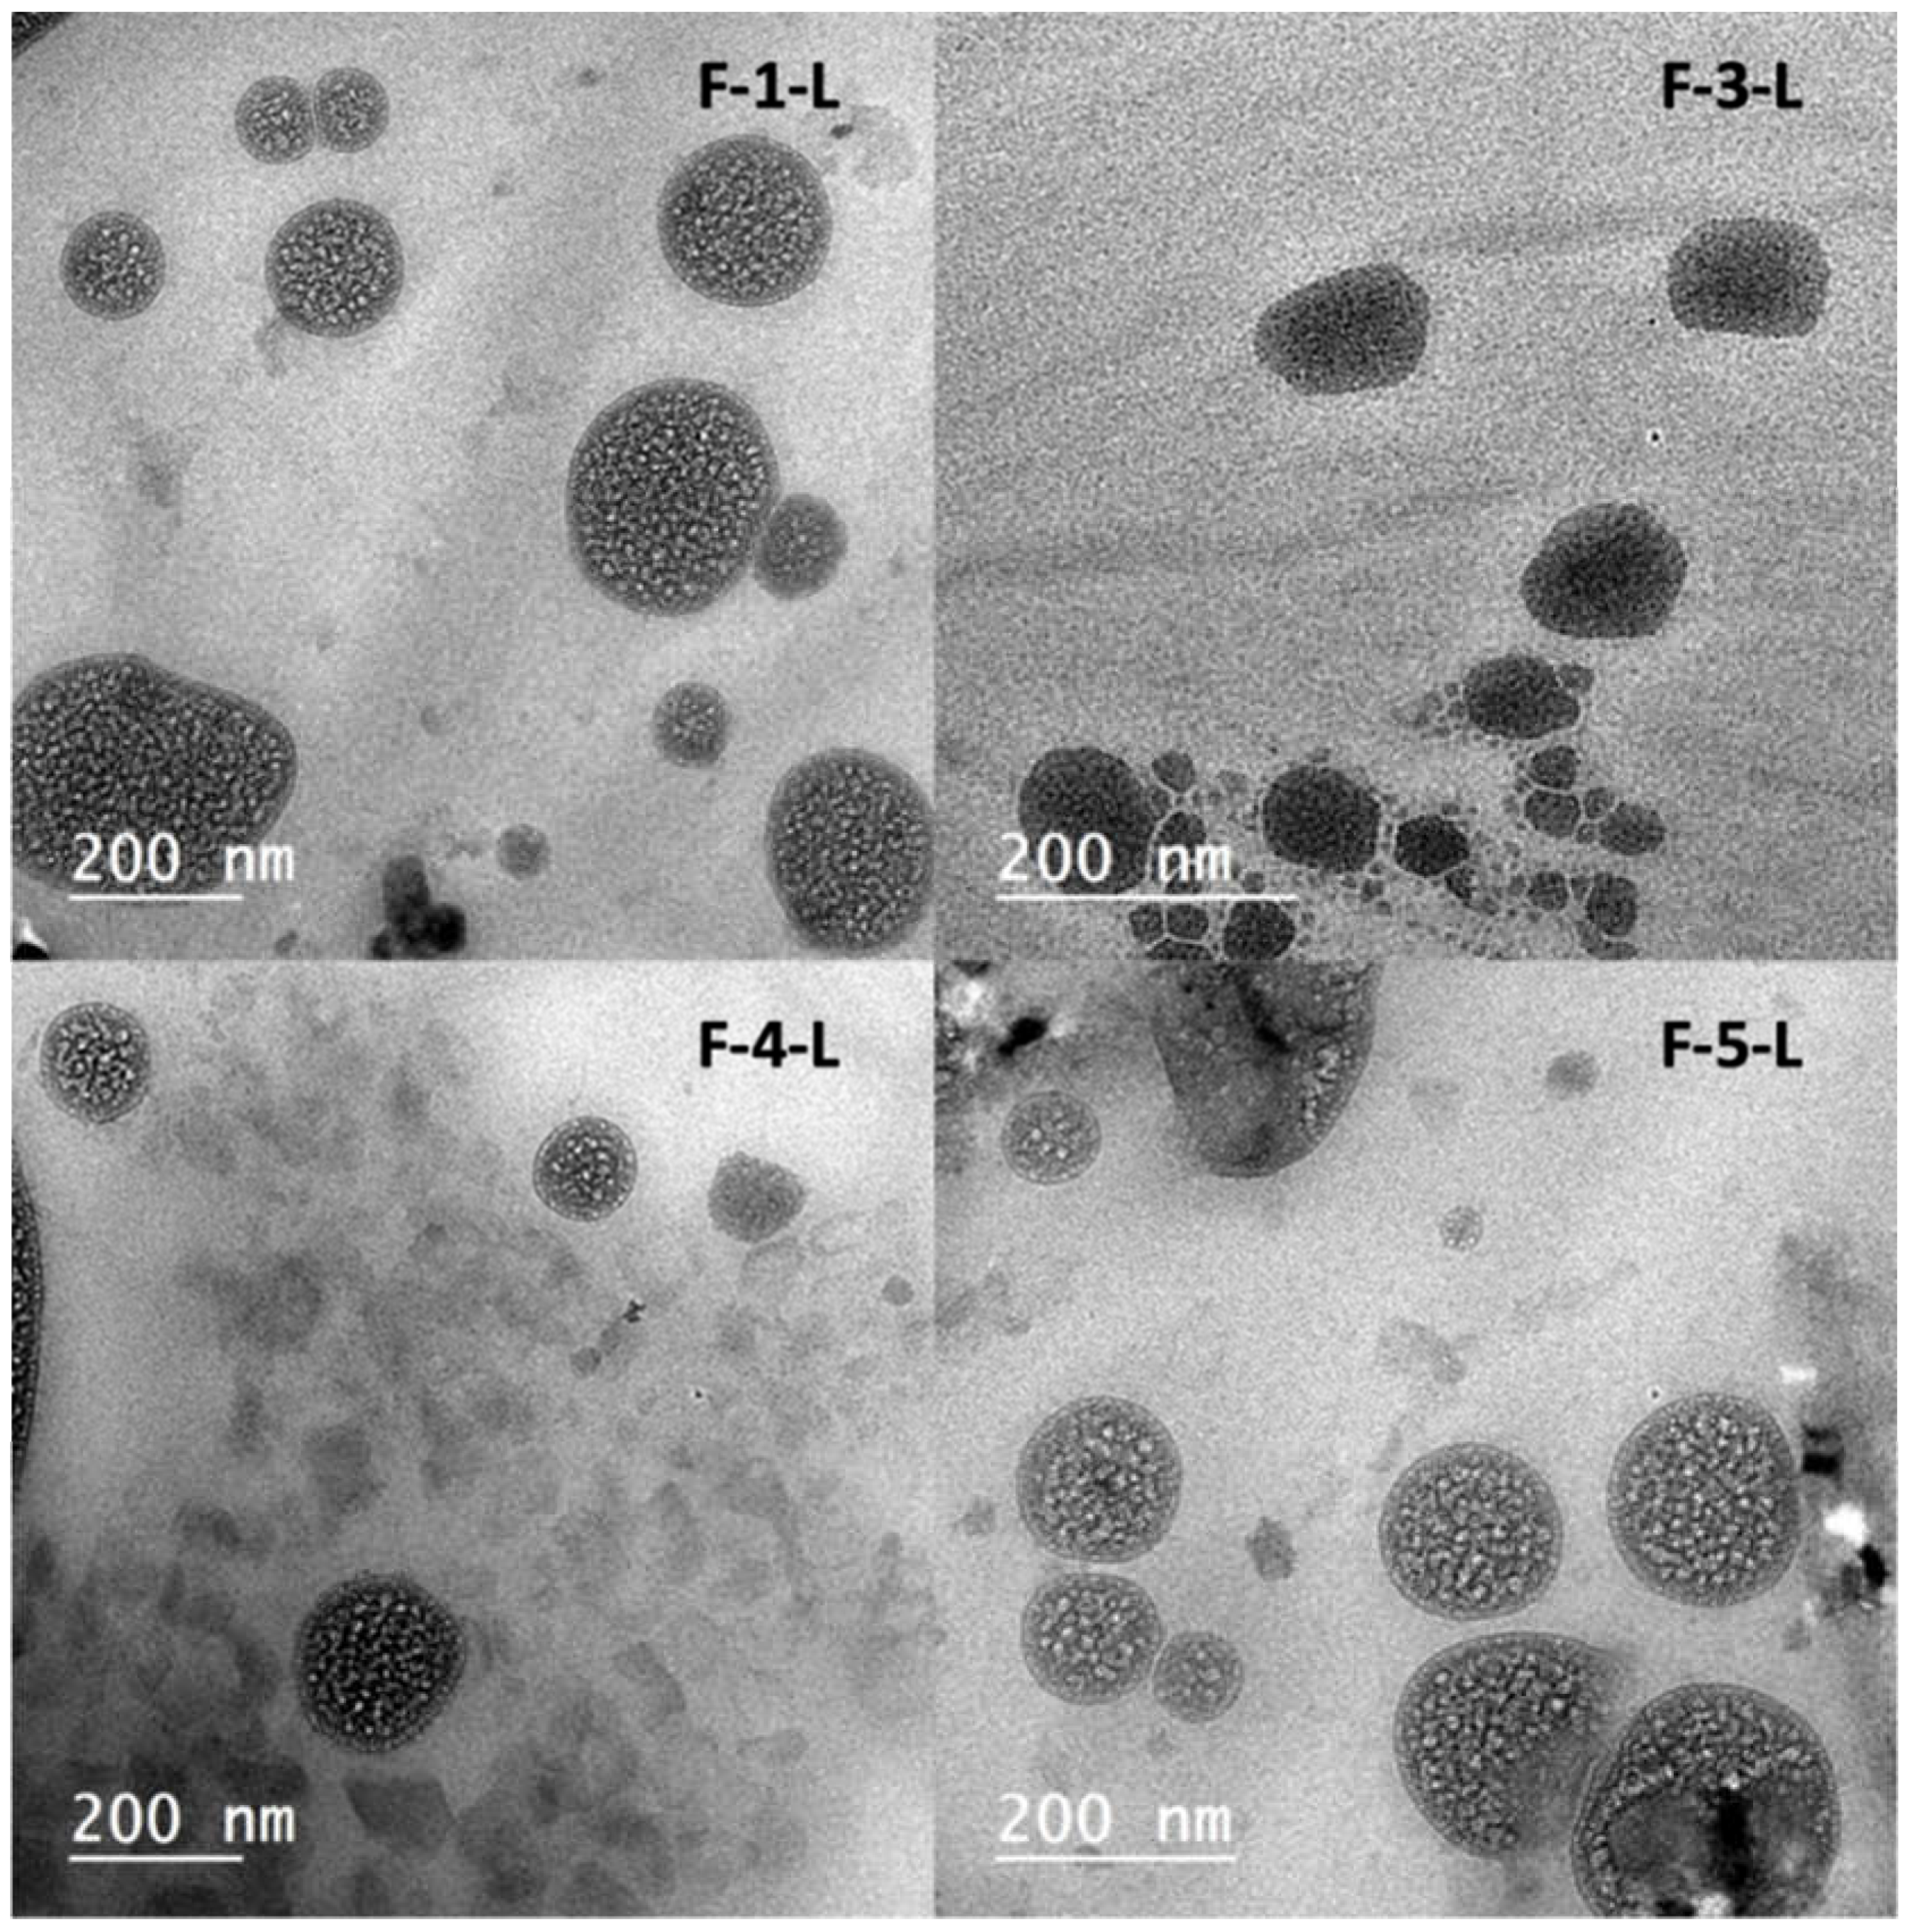
3.3.3. LCNs Morphology Examination Using TEM
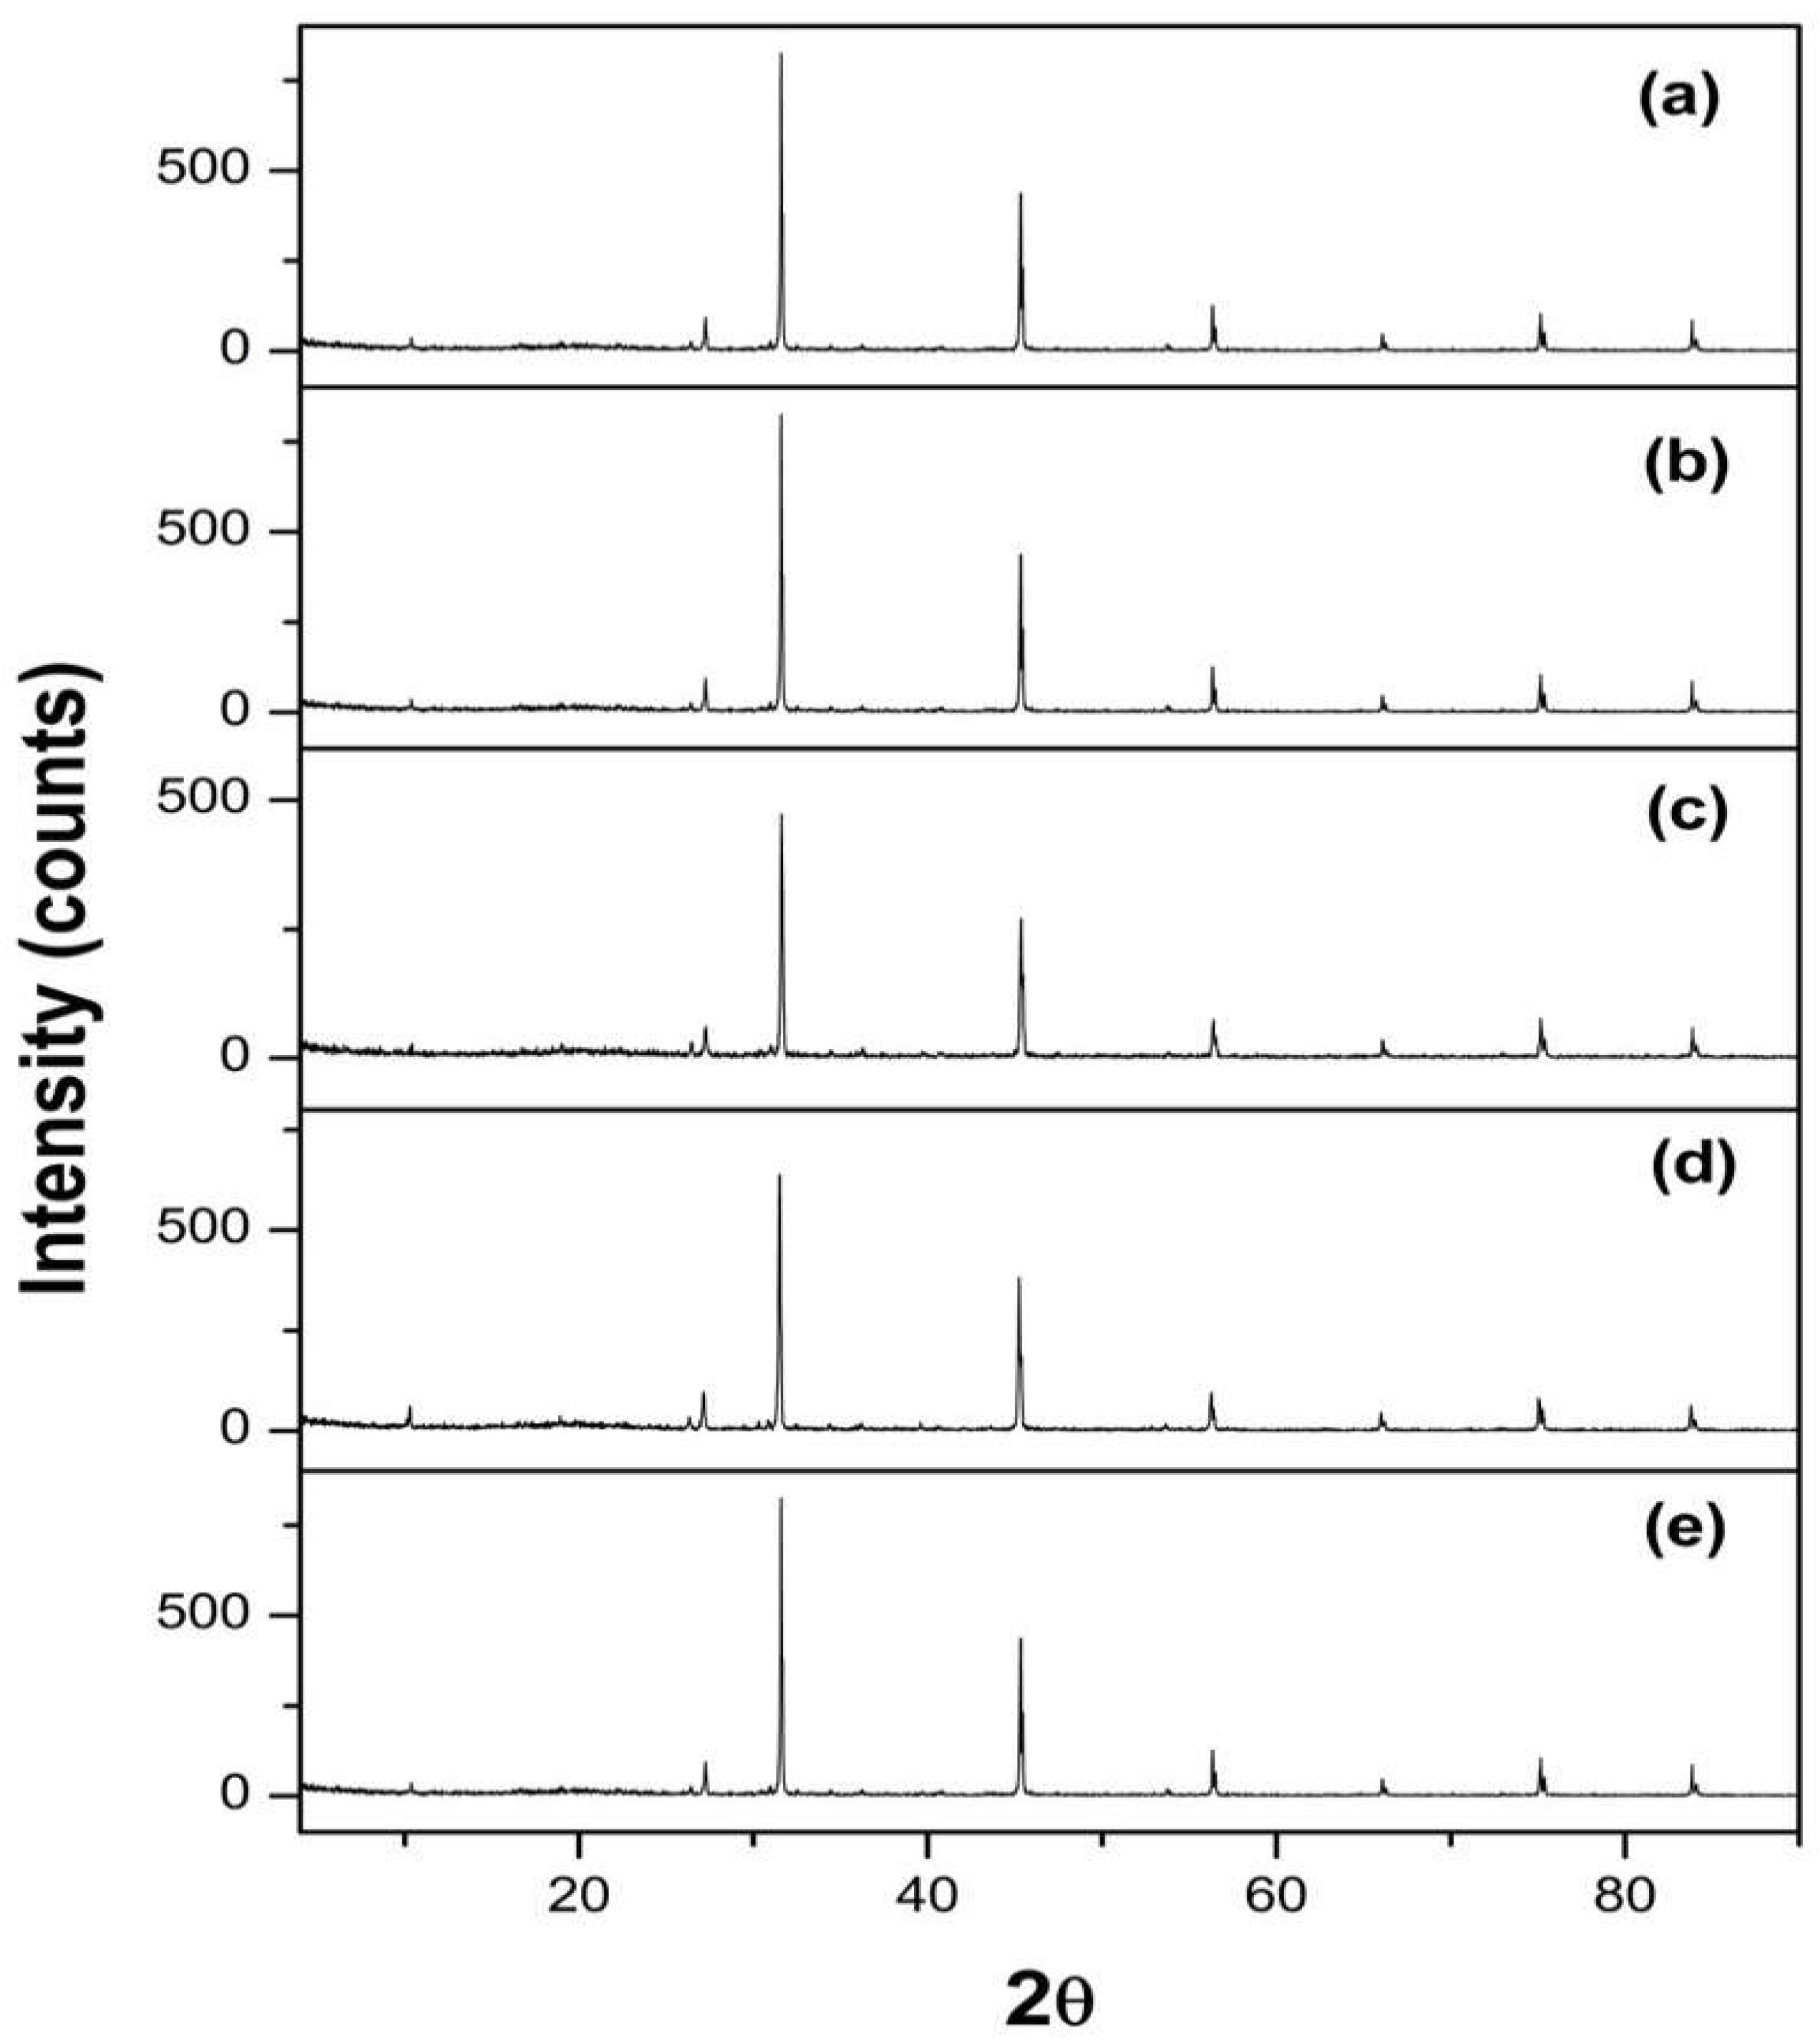
3.3.4. Crystallinity Study Using X-ray Powder Diffraction (XRPD)
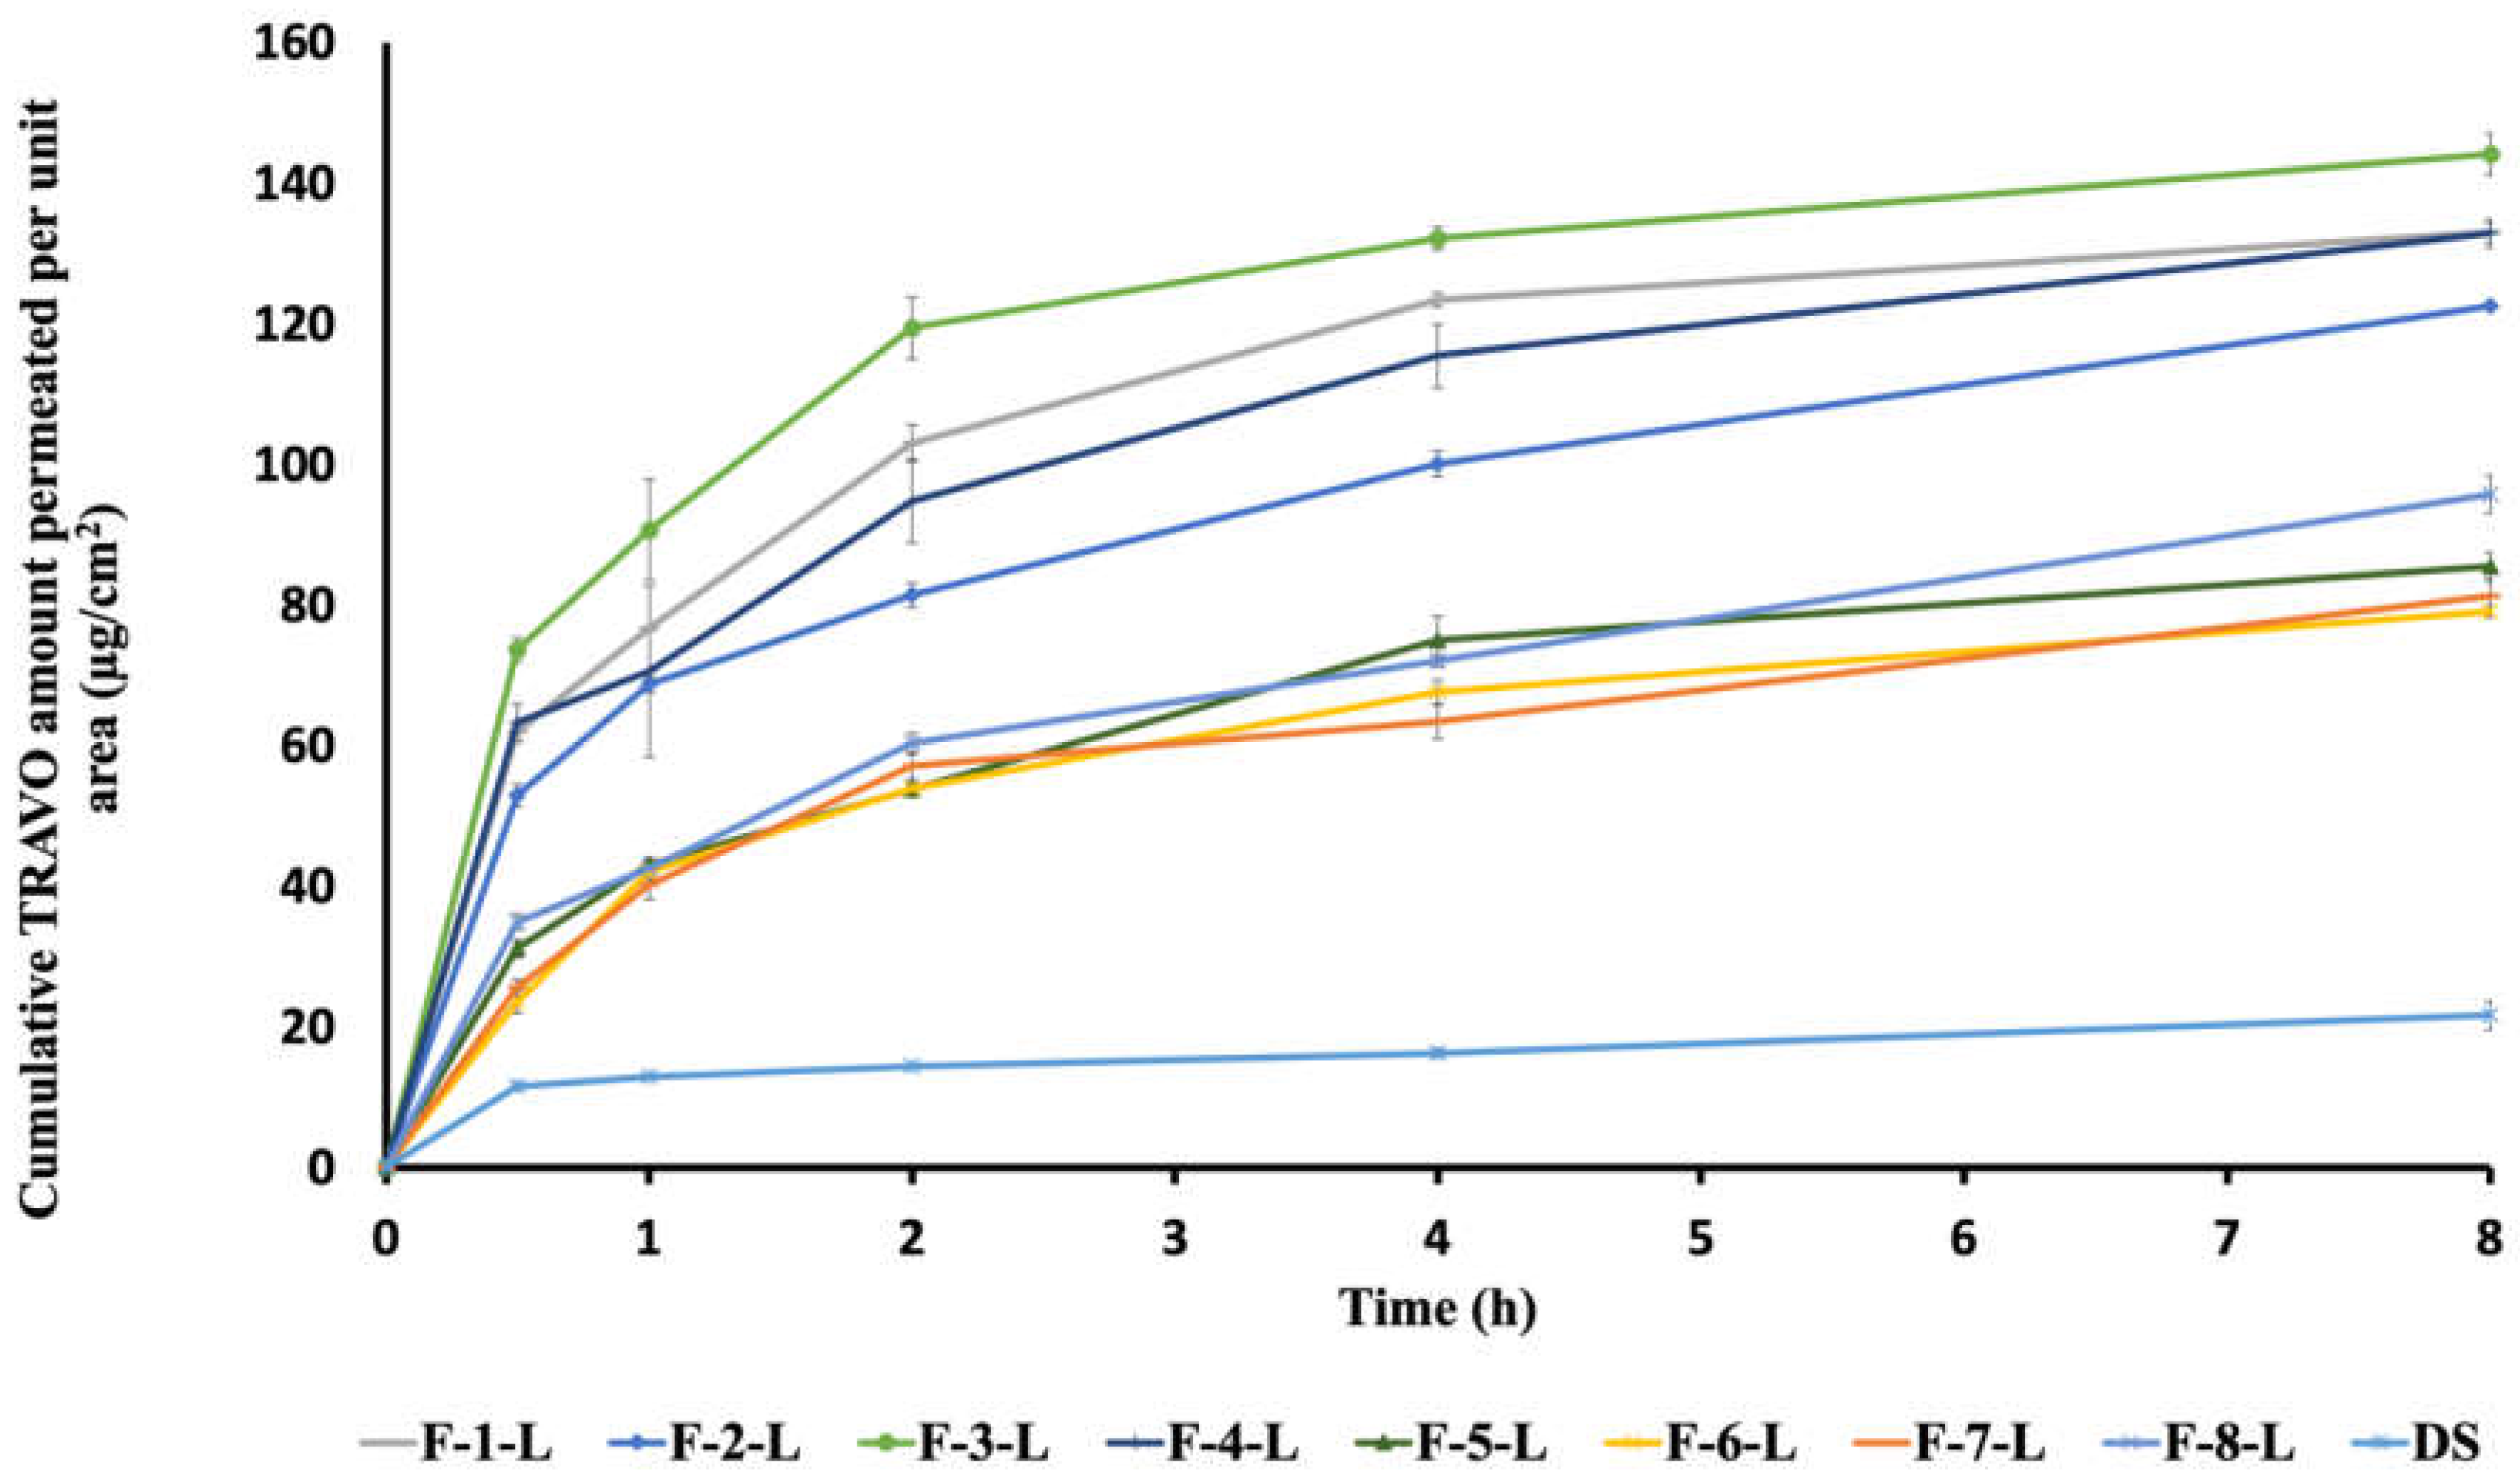
3.4. Ex Vivo Study for Corneal Permeation of TRAVO-Loaded LCNs
3.5. Physical Stability of the Selected TRAVO-Loaded LCNs
3.6. Sterilization of TRAVO-Loaded LCNs by Gamma Irradiation
3.7. In Vivo Ocular Evaluation of the Selected TRAVO-Loaded LCNs
3.7.1. Pharmacodynamic Study in Rabbits Using Steroid-Induced Ocular Hypertension Model
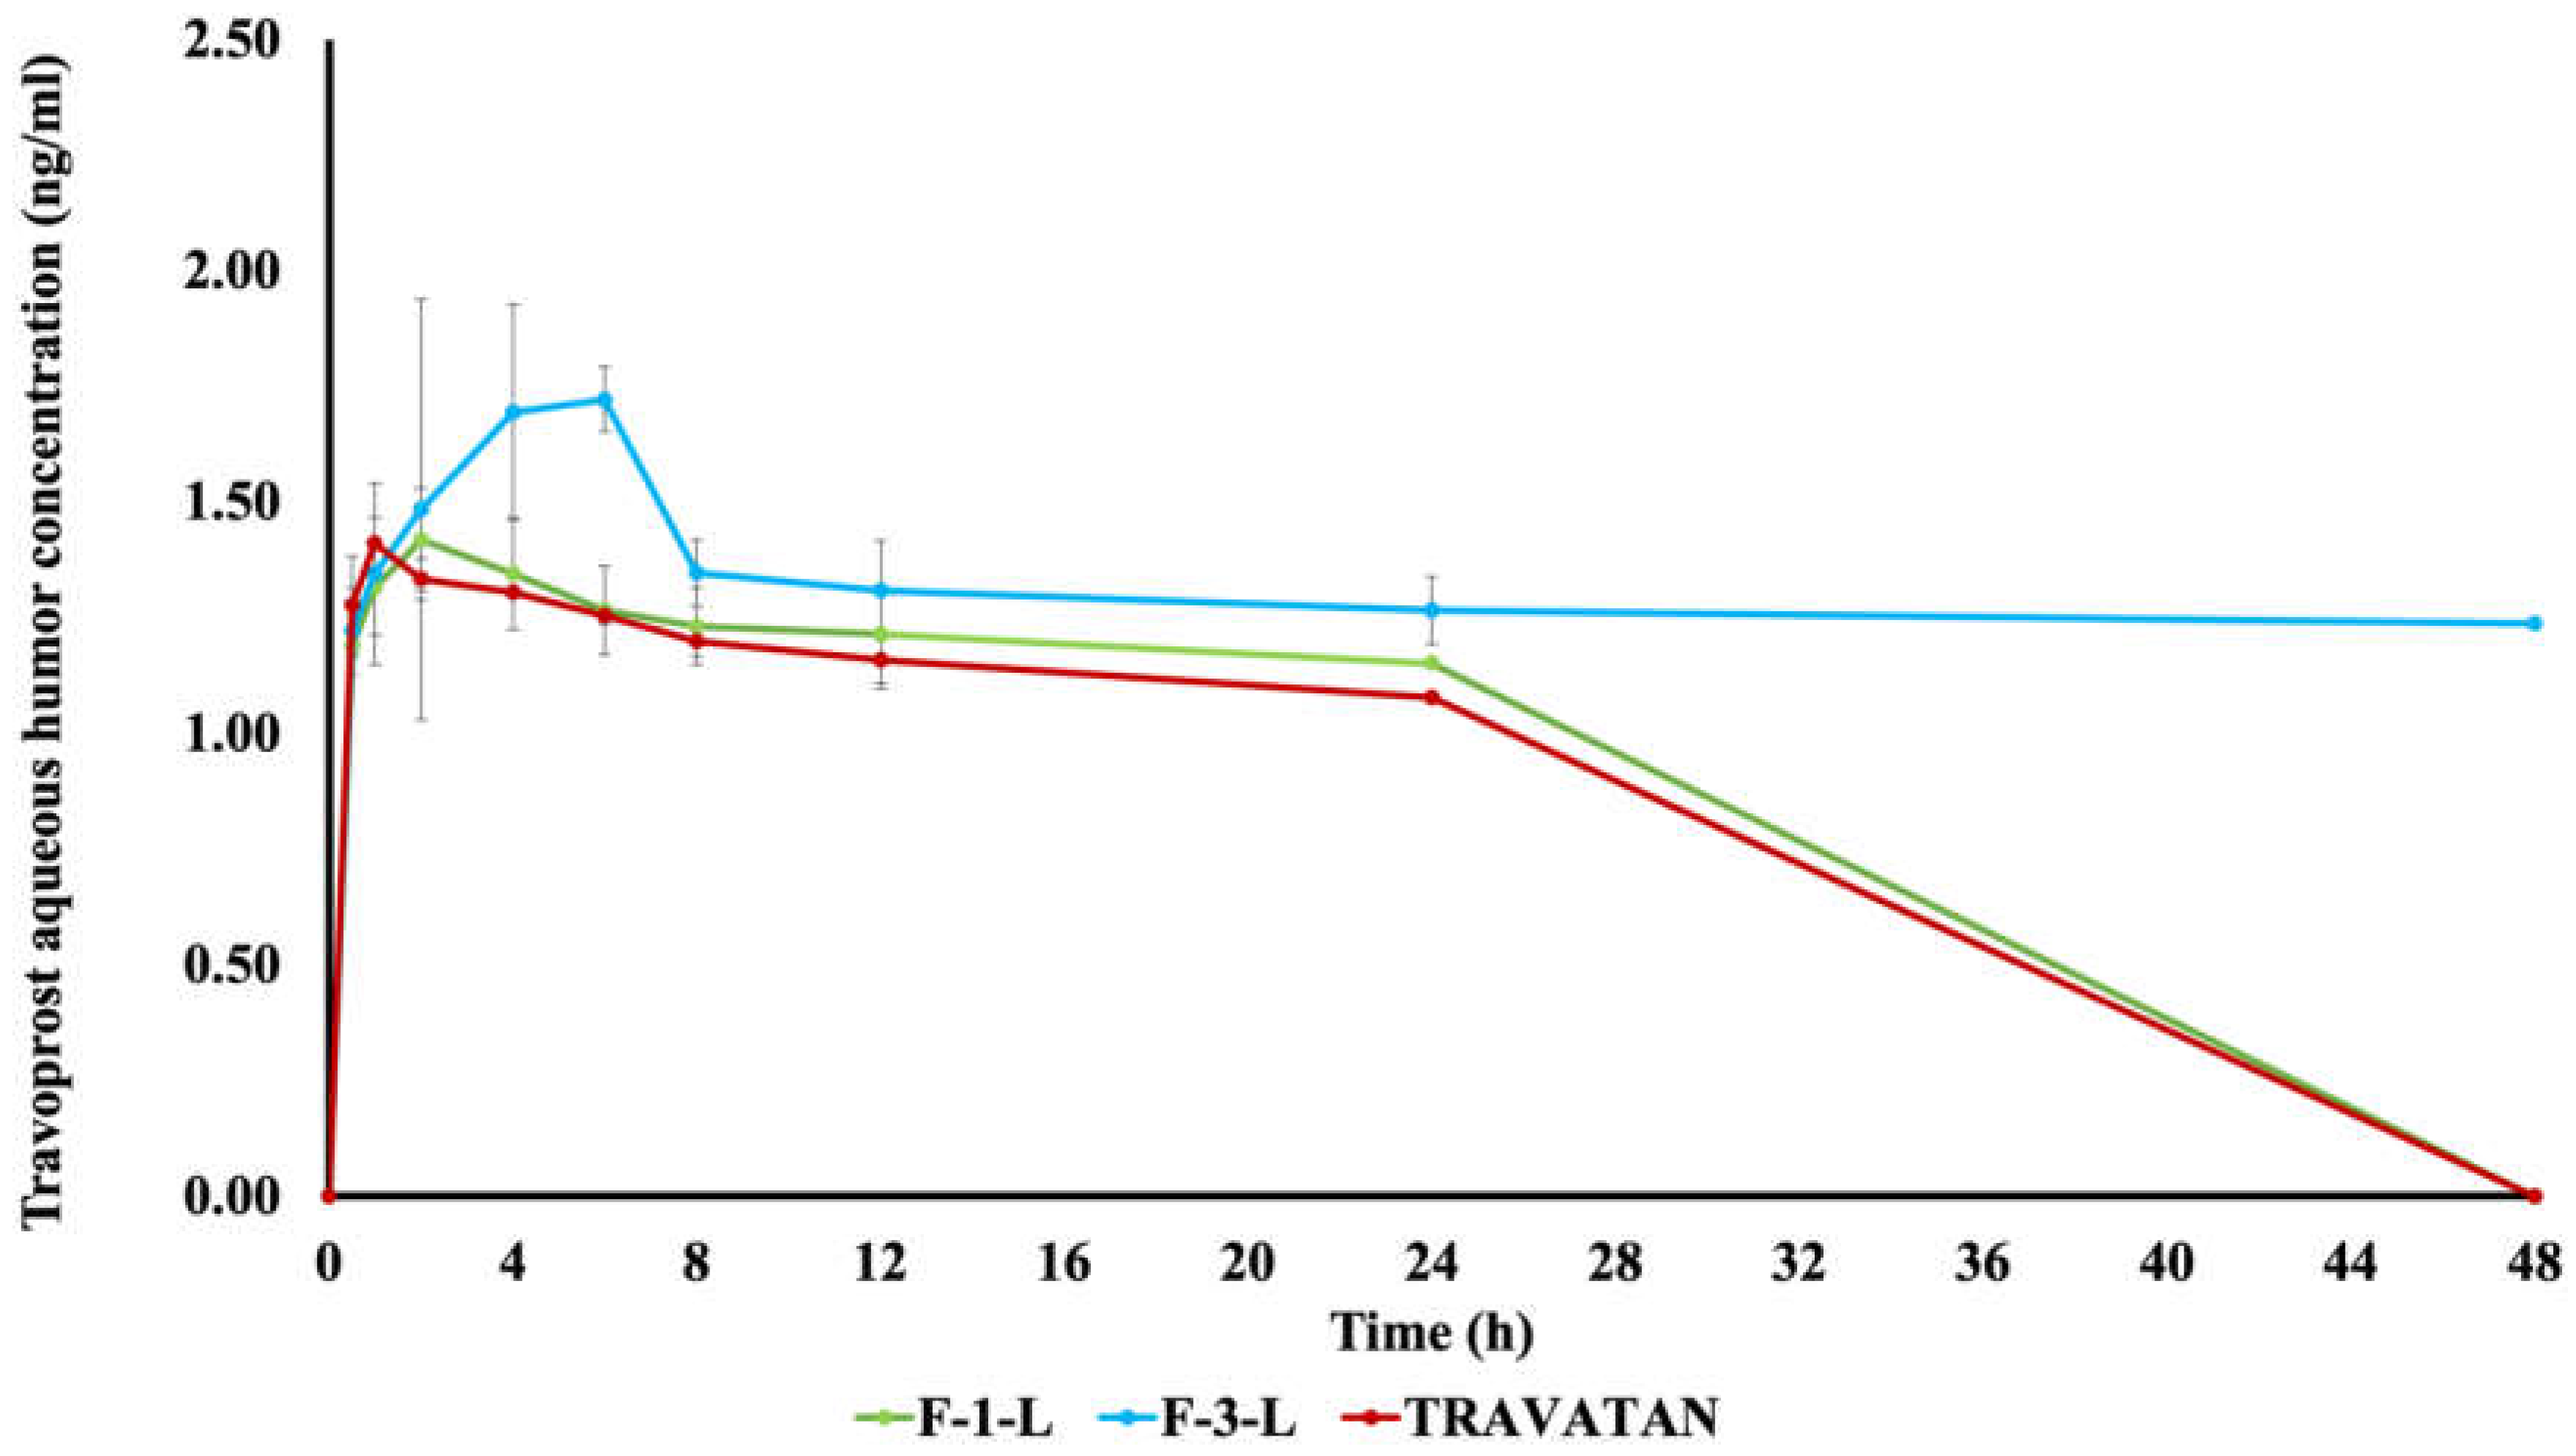
3.7.2. Pharmacokinetic Study
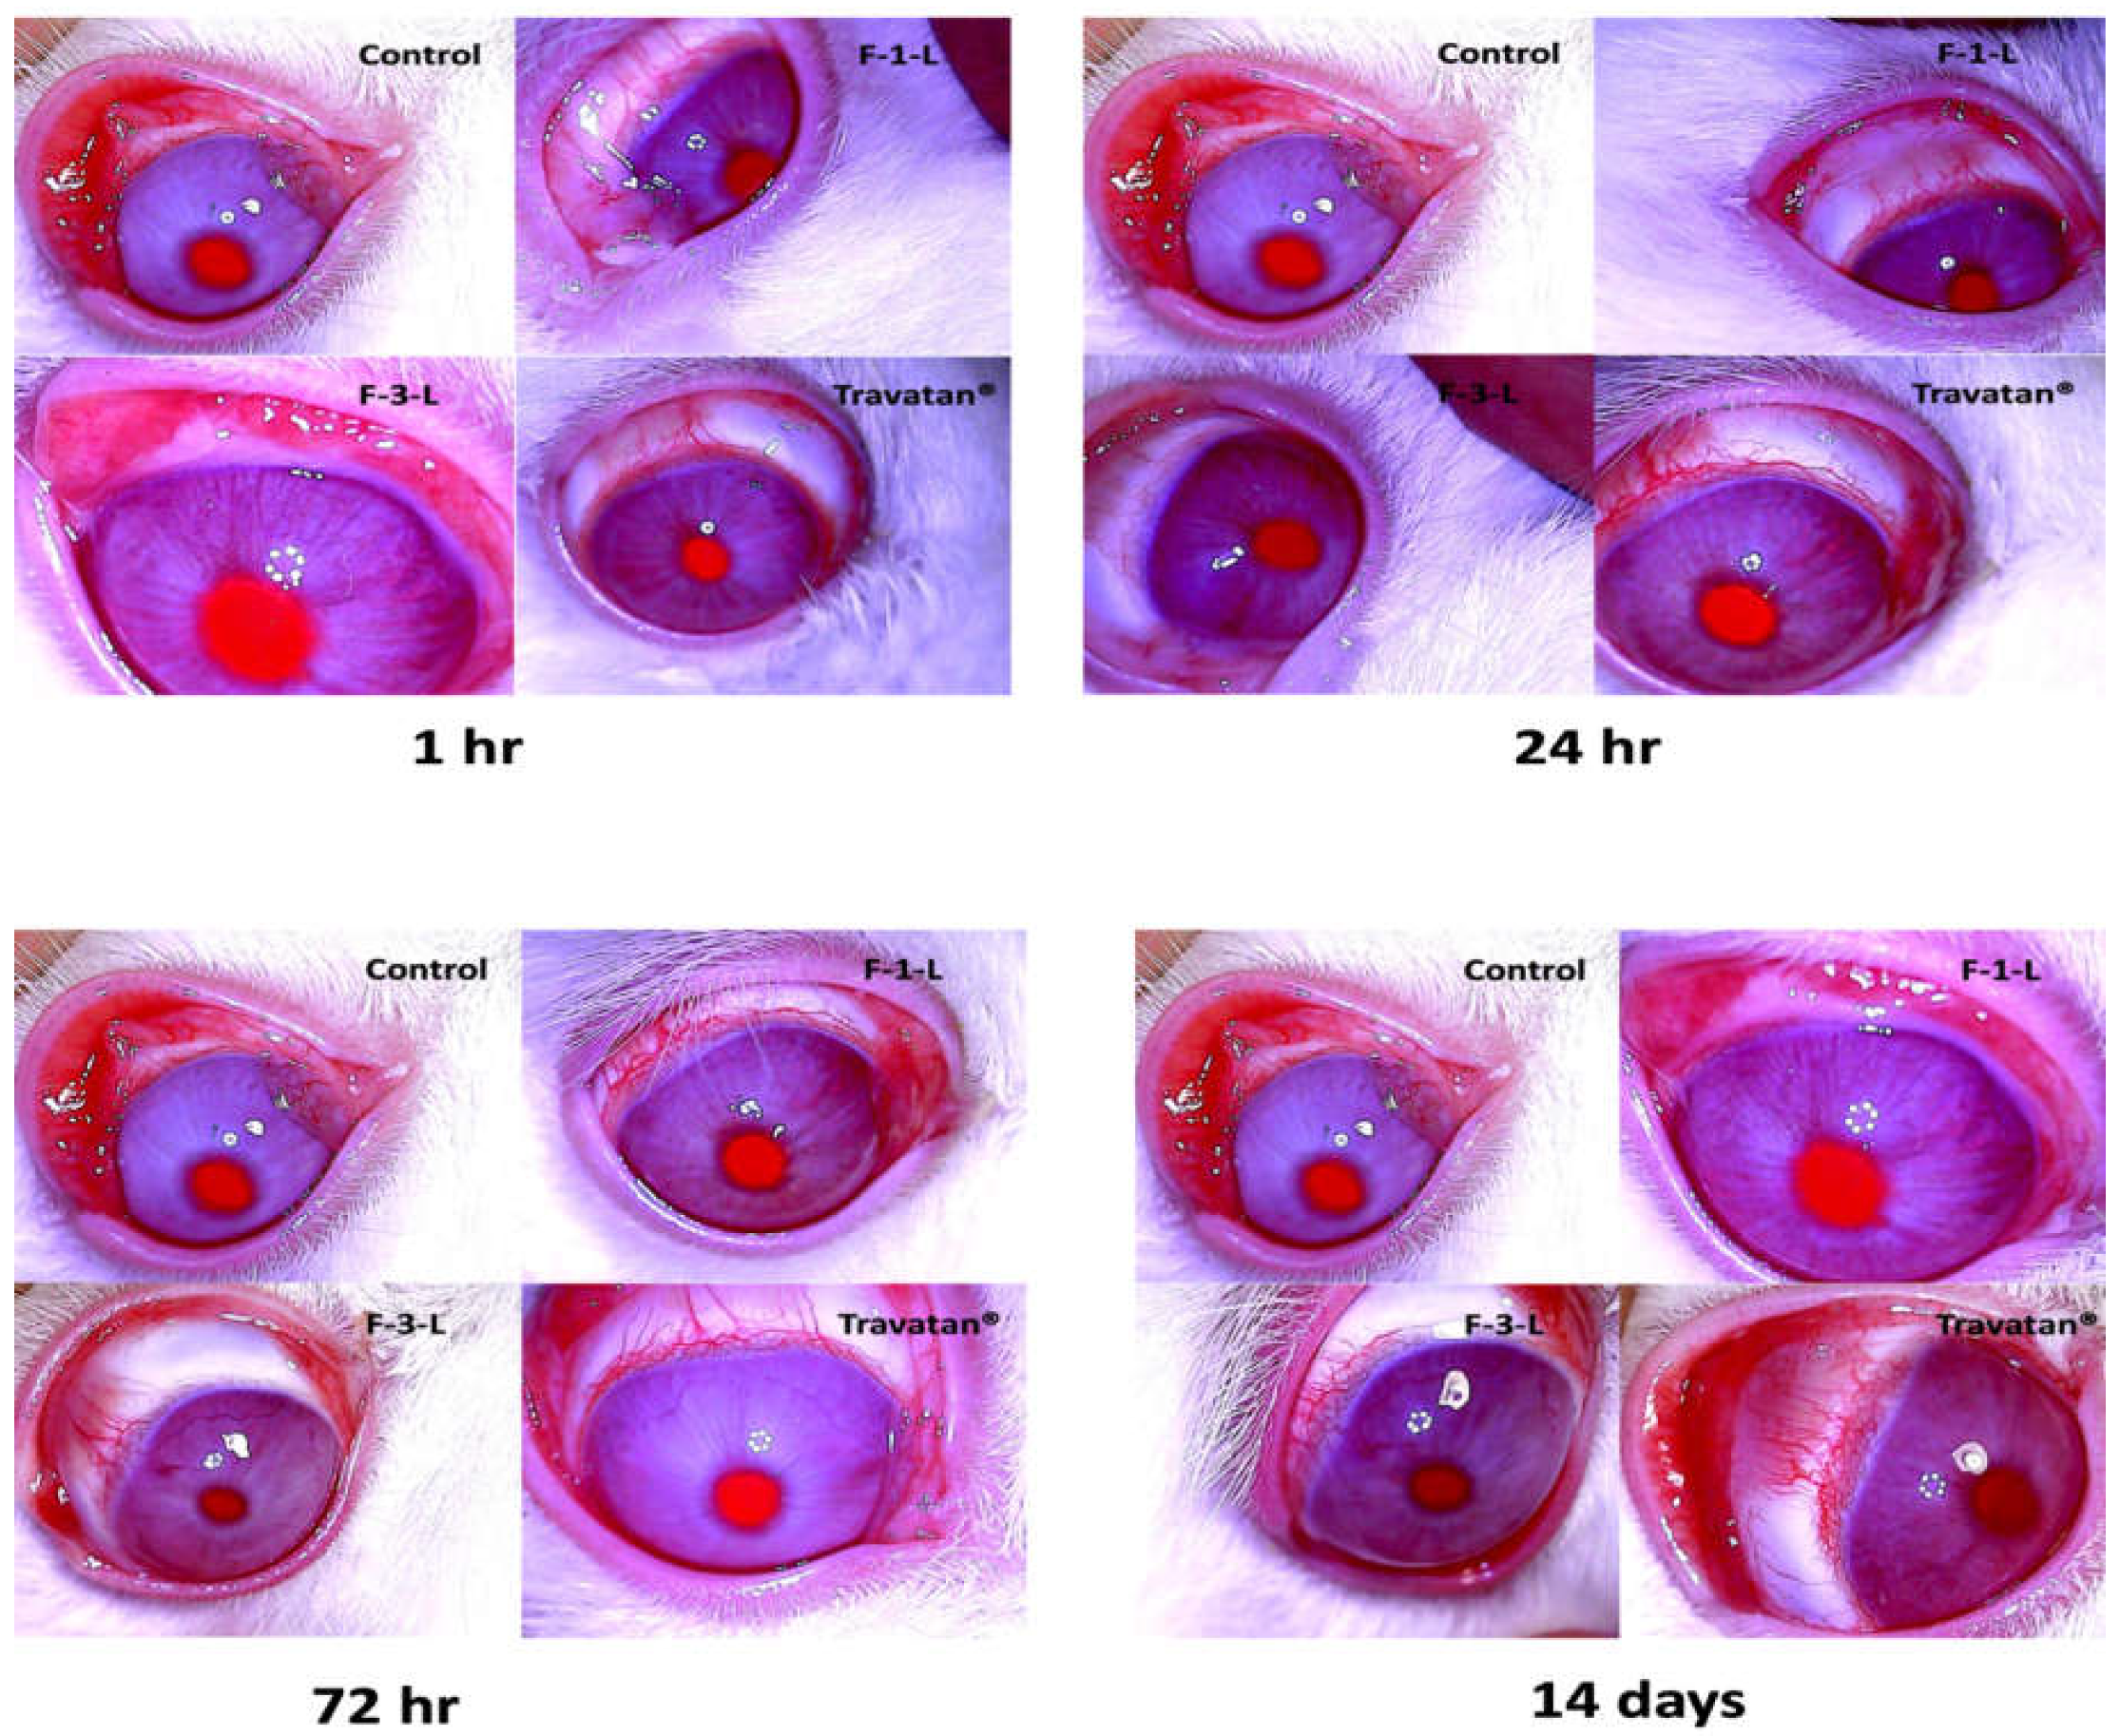
3.7.3. Ocular Tolerability
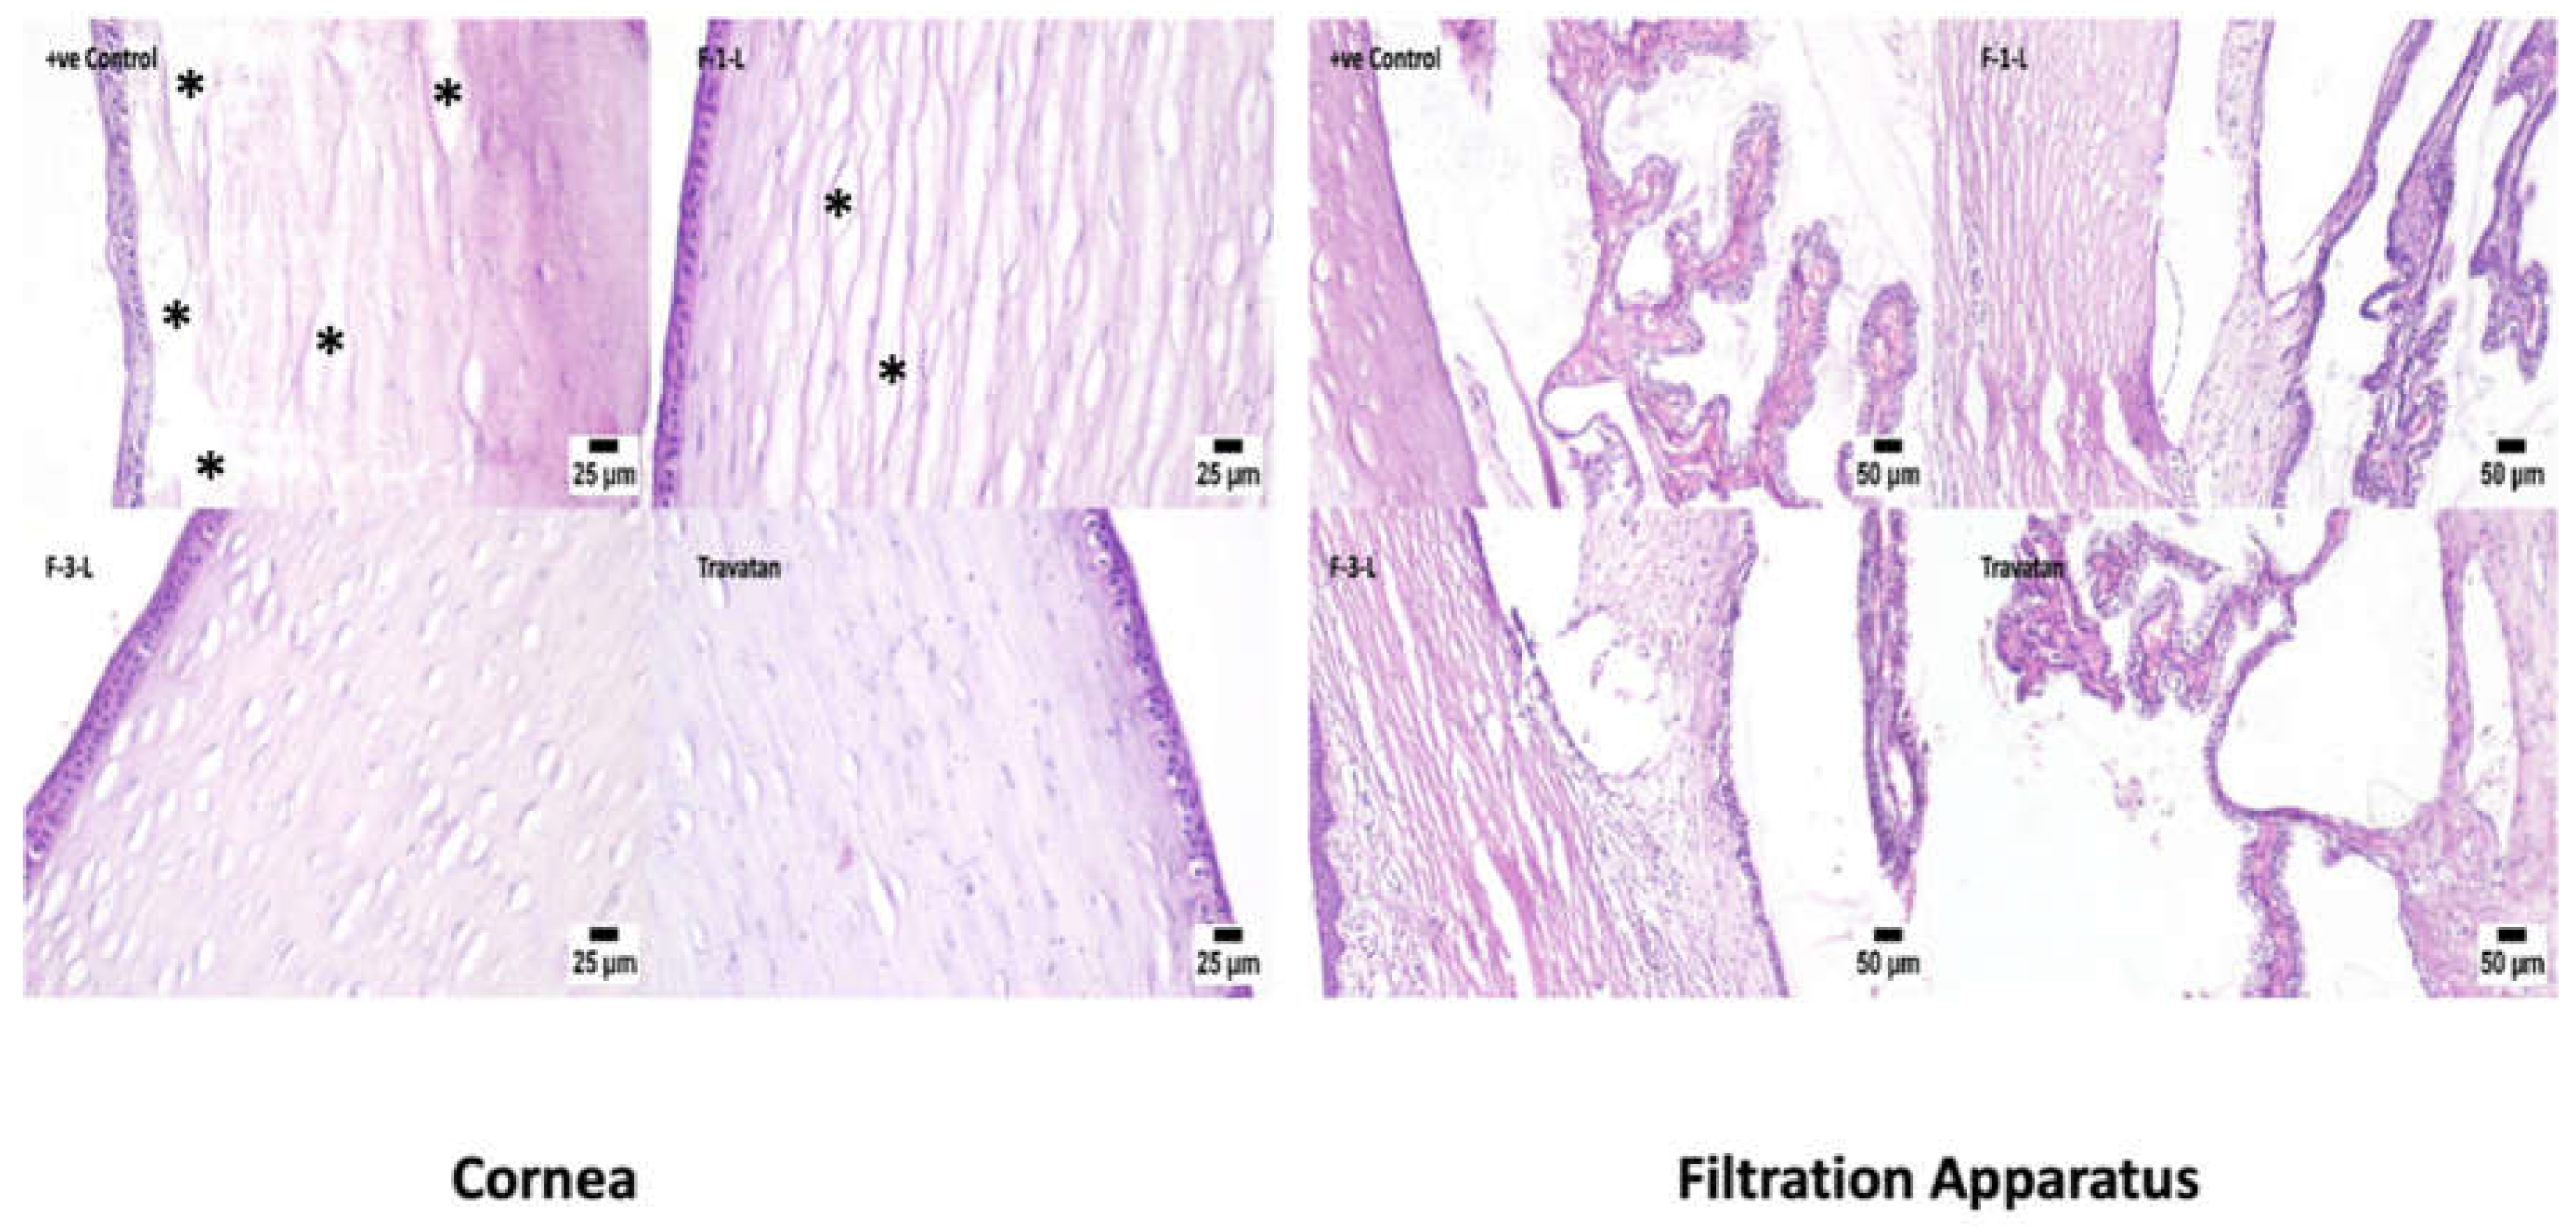
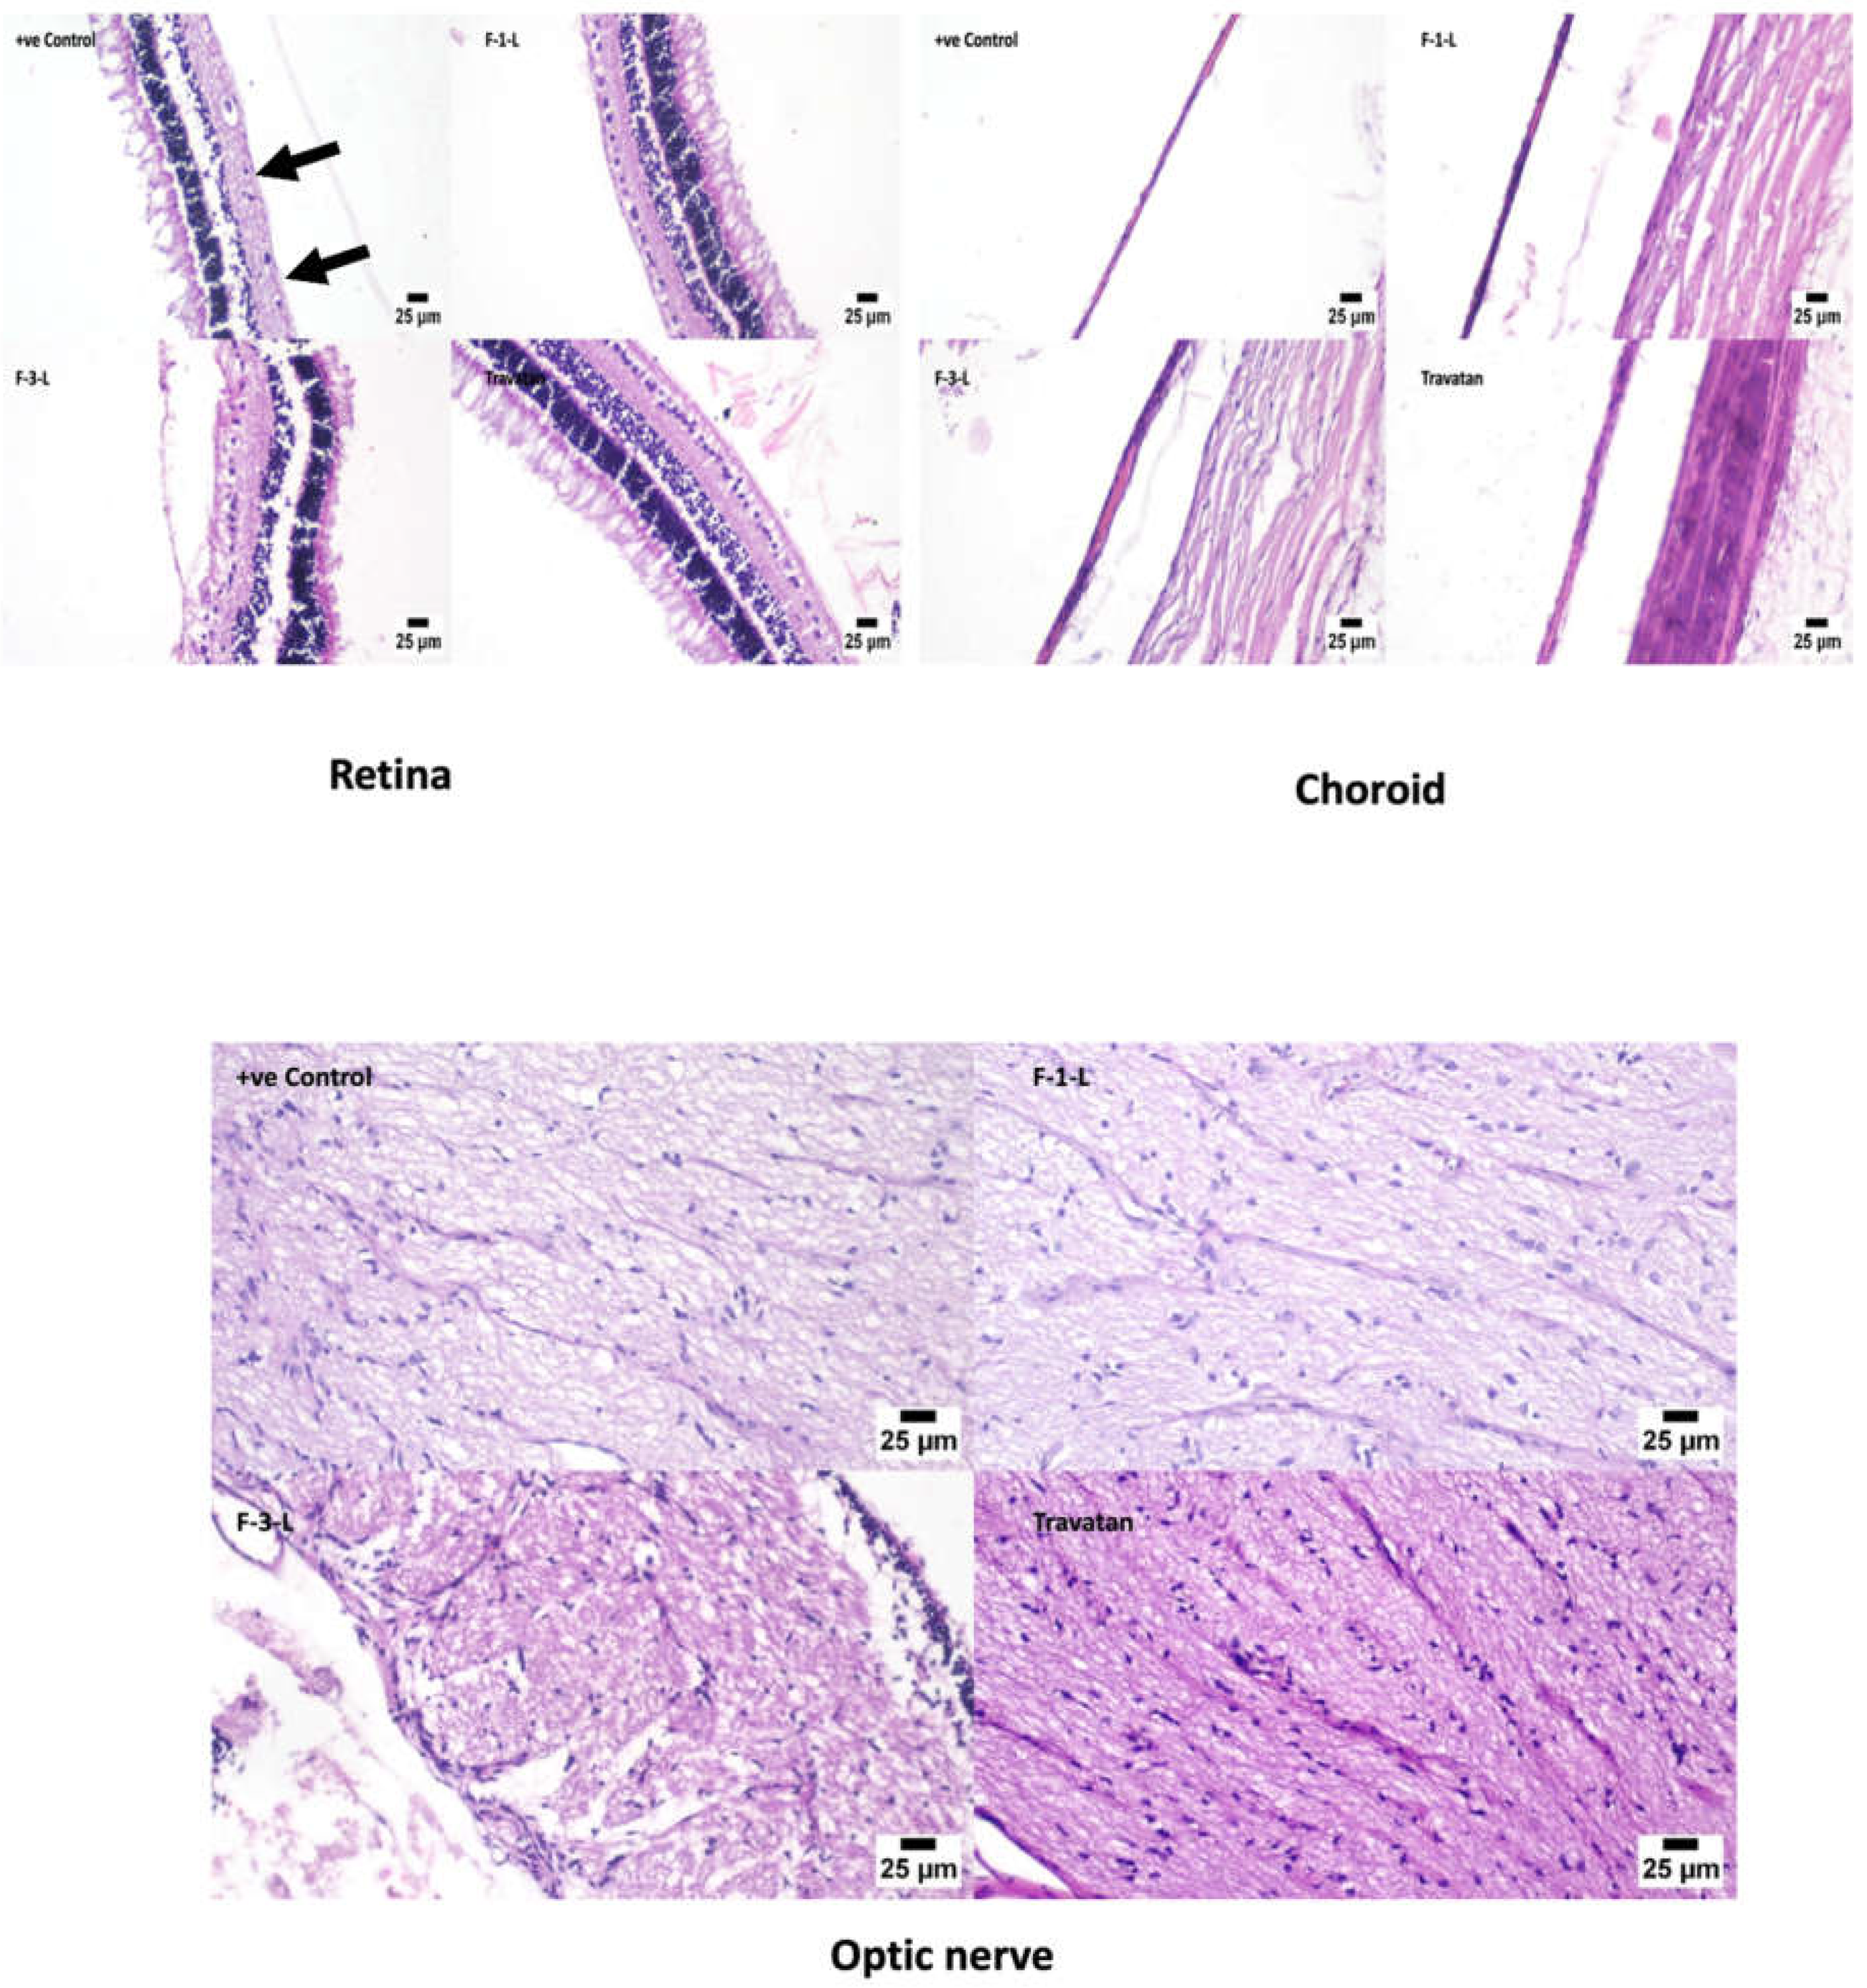
3.7.4. Histopathology Examinations
4. Conclusions
Supplementary Materials
Author Contributions
Funding
Institutional Review Board Statement
Data Availability Statement
Conflicts of Interest
Abbreviations
References
- Tran, N.; Mulet, X.; Hawley, M.; Hinton, M.; Mudie, T.; Muir, W.; Giakoumatos, C.; Waddington, J.; Kirby, M.; Drummond, J.C. Nanostructure and Cytotoxicity of Self-Assembled Monoolein–Capric Acid Lyotropic Liquid Crystalline Nanoparticles. RSC Adv. 2015, 5, 26785–26795. [Google Scholar] [CrossRef]
- Elfaky, M.A.; Sirwi, A.; Tolba, H.H.; Shaik, R.A.; Selmi, N.M.; Alattas, A.H.; Albreki, R.S.; Alshreef, N.M.; Gad, H.A. Development, Optimization, and Antifungal Assessment of Ocular Gel Loaded With Ketoconazole Cubic Liquid Crystalline Nanoparticles. J. Pharm. Sci. 2021, 110, 2210–2220. [Google Scholar] [CrossRef] [PubMed]
- Ismail, A.; Nasr, M.; Sammour, O. Nanoemulsion as a Feasible and Biocompatible Carrier for Ocular Delivery of Travoprost: Improved Pharmacokinetic/Pharmacodynamic Properties. Int. J. Pharm. 2020, 583, 119402. [Google Scholar] [CrossRef]
- Nasr, M.; Teiama, M.; Ismail, A.; Ebada, A.; Saber, S. In Vitro and in Vivo Evaluation of Cubosomal Nanoparticles as an Ocular Delivery System for Fluconazole in Treatment of Keratomycosis. Drug Deliv. Transl. Res. 2020, 10, 1841–1852. [Google Scholar] [CrossRef]
- Silva, R.O.; da Costa, B.L.; da Silva, F.R.; da Silva, C.N.; de Paiva, M.B.; Dourado, L.F.N.; Malachias, Â.; de Souza Araújo, A.A.; Nunes, P.S.; Silva-Cunha, A. Treatment for Chemical Burning Using Liquid Crystalline Nanoparticles as an Ophthalmic Delivery System for Pirfenidone. Int. J. Pharm. 2019, 568, 118466. [Google Scholar] [CrossRef]
- Younes, N.F.; Abdel-Halim, S.A.; Elassasy, A.I. Corneal Targeted Sertaconazole Nitrate Loaded Cubosomes: Preparation, Statistical Optimization, in Vitro Characterization, Ex Vivo Permeation and in Vivo Studies. Int. J. Pharm. 2018, 553, 386–397. [Google Scholar] [CrossRef]
- Huang, J.; Peng, T.; Li, Y.; Zhan, Z.; Zeng, Y.; Huang, Y.; Pan, X.; Wu, C.Y.; Wu, C. Ocular Cubosome Drug Delivery System for Timolol Maleate: Preparation, Characterization, Cytotoxicity, Ex Vivo, and In Vivo Evaluation. AAPS PharmSciTech 2017, 18, 2919–2926. [Google Scholar] [CrossRef]
- Ban, J.; Zhang, Y.; Huang, X.; Deng, G.; Hou, D.; Chen, Y.; Lu, Z. Corneal Permeation Properties of a Charged Lipid Nanoparticle Carrier Containing Dexamethasone. Int. J. Nanomed. 2017, 12, 1329. [Google Scholar] [CrossRef] [Green Version]
- Liu, R.; Wang, S.; Fang, S.; Wang, J.; Chen, J.; Huang, X.; He, X.; Liu, C. Liquid Crystalline Nanoparticles as an Ophthalmic Delivery System for Tetrandrine: Development, Characterization, and In Vitro and In Vivo Evaluation. Nanoscale Res. Lett. 2016, 11, 254. [Google Scholar] [CrossRef] [PubMed] [Green Version]
- Verma, P.; Ahuja, M. Cubic Liquid Crystalline Nanoparticles: Optimization and Evaluation for Ocular Delivery of Tropicamide. Drug Deliv. 2016, 23, 3043–3054. [Google Scholar] [CrossRef]
- Achouri, D.; Sergent, M.; Tonetto, A.; Piccerelle, P.; Andrieu, V.; Hornebecq, V. Self-Assembled Liquid Crystalline Nanoparticles as an Ophthalmic Drug Delivery System. Part II: Optimization of Formulation Variables Using Experimental Design. Drug Dev. Ind. Pharm. 2015, 41, 493–501. [Google Scholar] [CrossRef]
- Wu, W.; Li, J.; Wu, L.; Wang, B.; Wang, Z.; Xu, Q.; Xin, H. Ophthalmic Delivery of Brinzolamide by Liquid Crystalline Nanoparticles: In Vitro and in Vivo Evaluation. AAPS PharmSciTech 2013, 14, 1063–1071. [Google Scholar] [CrossRef] [Green Version]
- Li, J.; Wu, L.; Wu, W.; Wang, B.; Wang, Z.; Xin, H.; Xu, Q. A Potential Carrier Based on Liquid Crystal Nanoparticles for Ophthalmic Delivery of Pilocarpine Nitrate. Int. J. Pharm. 2013, 455, 75–84. [Google Scholar] [CrossRef] [PubMed]
- Han, S.; Shen, J.Q.; Gan, Y.; Geng, H.M.; Zhang, X.X.; Zhu, C.L.; Gan, L. Novel Vehicle Based on Cubosomes for Ophthalmic Delivery of Flurbiprofen with Low Irritancy and High Bioavailability. Acta Pharmacol. Sin. 2010, 31, 990–998. [Google Scholar] [CrossRef] [PubMed]
- Gan, L.; Han, S.; Shen, J.; Zhu, J.; Zhu, C.; Zhang, X.; Gan, Y. Self-Assembled Liquid Crystalline Nanoparticles as a Novel Ophthalmic Delivery System for Dexamethasone: Improving Preocular Retention and Ocular Bioavailability. Int. J. Pharm. 2010, 396, 179–187. [Google Scholar] [CrossRef] [PubMed]
- Razak, A.; Iman Mohd Hamdi, N.; Azeera Mohd Ali, N. The Association of Cigarette Smoking on Intraocular Pressure Among Young Adult Male: A Preliminary Study. Malays. J. Med. Health Sci. 2021, 17 (Suppl. 3), 2636–9346. [Google Scholar]
- Diaconita, V.; Quinn, M.; Jamal, D.; Dishan, B.; Malvankar-Mehta, M.S.; Hutnik, C. Washout Duration of Prostaglandin Analogues: A Systematic Review and Meta-Analysis. J. Ophthalmol. 2018, 2018, 3190684. [Google Scholar] [CrossRef] [Green Version]
- Aihara, M. Prostanoid Receptor Agonists for Glaucoma Treatment. Jpn. J. Ophthalmol. 2021, 65, 581–590. [Google Scholar] [CrossRef]
- Shukr, M.H.; Ismail, S.; El-Hossary, G.G.; El-Shazly, A.H. Spanlastics Nanovesicular Ocular Insert as a Novel Ocular Delivery of Travoprost: Optimization Using Box–Behnken Design and in Vivo Evaluation. J. Liposome Res. 2022. [Google Scholar] [CrossRef]
- Schnichels, S.; Hurst, J.; de Vries, J.W.; Ullah, S.; Gruszka, A.; Kwak, M.; Löscher, M.; Dammeier, S.; Bartz-Schmidt, K.U.; Spitzer, M.S.; et al. Self-Assembled DNA Nanoparticles Loaded with Travoprost for Glaucoma-Treatment. Nanomedicine 2020, 29, 102260. [Google Scholar] [CrossRef]
- Lambert, W.S.; Carlson, B.J.; van der Ende, A.E.; Shih, G.; Dobish, J.N.; Calkins, D.J.; Harth, E. Nanosponge-Mediated Drug Delivery Lowers Intraocular Pressure. Transl. Vis. Sci. Technol. 2015, 4, 1–16. [Google Scholar] [CrossRef] [Green Version]
- Salah, S.; Mahmoud, A.A.; Kamel, A.O. Etodolac Transdermal Cubosomes for the Treatment of Rheumatoid Arthritis: Ex Vivo Permeation and in Vivo Pharmacokinetic Studies. Drug Deliv. 2017, 24, 846–856. [Google Scholar] [CrossRef] [Green Version]
- Hashad, R.A.; Ishak, R.A.H.; Geneidi, A.S.; Mansour, S. Surface Functionalization of Methotrexate-Loaded Chitosan Nanoparticles with Hyaluronic Acid/Human Serum Albumin: Comparative Characterization and in Vitro Cytotoxicity. Int. J. Pharm. 2017, 522, 128–136. [Google Scholar] [CrossRef]
- Salimi, A.; Panahi-Bazaz, M.R.; Panahi-Bazaz, E. A Novel Microemulsion System for Ocular Delivery of Azithromycin: Design, Characterization and Ex-Vivo Rabbit Corneal Permeability. Jundishapur J. Nat. Pharm. Prod. 2017, 12, e13938. [Google Scholar] [CrossRef]
- Asasutjarit, R.; Theerachayanan, T.; Kewsuwan, P.; Veeranondha, S.; Fuongfuchat, A.; Ritthidej, G.C. Gamma Sterilization of Diclofenac Sodium Loaded- N-Trimethyl Chitosan Nanoparticles for Ophthalmic Use. Carbohydr. Polym. 2017, 157, 603–612. [Google Scholar] [CrossRef] [PubMed]
- Elmowafy, E.; Gad, H.; Biondo, F.; Casettari, L.; Soliman, M.E. Exploring Optimized Methoxy Poly(Ethylene Glycol)-Block-Poly(ε-Caprolactone) Crystalline Cored Micelles in Anti-Glaucoma Pharmacotherapy. Int. J. Pharm. 2019, 566, 573–584. [Google Scholar] [CrossRef] [PubMed]
- Ramadan, A.A.; Eladawy, S.A.; El-Enin, A.S.M.A.; Hussein, Z.M. Development and Investigation of Timolol Maleate Niosomal Formulations for the Treatment of Glaucoma. J. Pharm. Investig. 2020, 50, 59–70. [Google Scholar] [CrossRef]
- Ammar, H.O.; Salama, H.A.; Ghorab, M.; Mahmoud, A.A. Nanoemulsion as a Potential Ophthalmic Delivery System for Dorzolamide Hydrochloride. AAPS PharmSciTech 2009, 10, 808–819. [Google Scholar] [CrossRef] [PubMed] [Green Version]
- Fatouh, A.M.; Elshafeey, A.H.; Abdelbary, A. Agomelatine-Based in Situ Gels for Brain Targeting via the Nasal Route: Statistical Optimization, in Vitro, and in Vivo Evaluation. Drug Deliv. 2017, 24, 1077–1085. [Google Scholar] [CrossRef] [Green Version]
- Emad Eldeeb, A.; Salah, S.; Ghorab, M. Proniosomal Gel-Derived Niosomes: An Approach to Sustain and Improve the Ocular Delivery of Brimonidine Tartrate; Formulation, in-Vitro Characterization, and in-Vivo Pharmacodynamic Study. Drug Deliv. 2019, 26, 509–521. [Google Scholar] [CrossRef] [Green Version]
- Luechtefeld, T.; Maertens, A.; Russo, D.P.; Rovida, C.; Zhu, H.; Hartung, T. Analysis of Draize Eye Irritation Testing and Its Prediction by Mining Publicly Available 2008-2014 REACH Data. ALTEX 2016, 33, 123–134. [Google Scholar] [CrossRef] [Green Version]
- Tokuda, K.; Baron, B.; Kuramitsu, Y.; Kitagawa, T.; Tokuda, N.; Morishige, N.; Kobayashi, M.; Kimura, K.; Nakamura, K.; Sonoda, K.H. Optimization of Fixative Solution for Retinal Morphology: A Comparison with Davidson’s Fixative and Other Fixation Solutions. Jpn. J. Ophthalmol. 2018, 62, 481–490. [Google Scholar] [CrossRef]
- Bancroft, J.; Gamble, M. Theory and Practice of Histological Techniques, 6th ed.; ScienceDirect: Amsterdam, The Netherlands, 2008. [Google Scholar]
- Kulkarni, S.A.; Feng, S.S. Effects of Surface Modification on Delivery Efficiency of Biodegradable Nanoparticles across the Blood-Brain Barrier. Nanomedicine 2011, 6, 377–394. [Google Scholar] [CrossRef]
- Yagublu, V.; Karimova, A.; Hajibabazadeh, J.; Reissfelder, C.; Muradov, M.; Bellucci, S.; Allahverdiyev, A. Overview of Physicochemical Properties of Nanoparticles as Drug Carriers for Targeted Cancer Therapy. J. Funct. Biomater. 2022, 13, 196. [Google Scholar] [CrossRef] [PubMed]
- Alkholief, M.; Albasit, H.; Alhowyan, A.; Alshehri, S.; Raish, M.; Abul Kalam, M.; Alshamsan, A. Employing a PLGA-TPGS Based Nanoparticle to Improve the Ocular Delivery of Acyclovir. Saudi Pharm. J. 2019, 27, 293–302. [Google Scholar] [CrossRef] [PubMed]
- Das, S.; Bandyopadhyay, K.; Ghosh, M.M. Effect of Stabilizer Concentration on the Size of Silver Nanoparticles Synthesized through Chemical Route. Inorg. Chem. Commun. 2021, 123, 108319. [Google Scholar] [CrossRef]
- Ishak, R.A.H.; Mostafa, N.M.; Kamel, A.O. Stealth Lipid Polymer Hybrid Nanoparticles Loaded with Rutin for Effective Brain Delivery—Comparative Study with the Gold Standard (Tween 80): Optimization, Characterization and Biodistribution. Drug Deliv. 2017, 24, 1874–1890. [Google Scholar] [CrossRef] [Green Version]
- Mansour, M.; Kamel, A.O.; Mansour, S.; Mortada, N.D. Novel Polyglycerol-Dioleate Based Cubosomal Dispersion with Tailored Physical Characteristics for Controlled Delivery of Ondansetron. Colloids Surf. B Biointerfaces 2017, 156, 44–54. [Google Scholar] [CrossRef] [PubMed]
- Nakano, M.; Sugita, A.; Matsuoka, H.; Handa, T. Small-Angle X-Ray Scattering and 13C NMR Investigation on the Internal Structure of “Cubosomes”. Langmuir 2001, 17, 3917–3922. [Google Scholar] [CrossRef]
- Lamer, V.K.; Dinegar, R.H. Theory, Production and Mechanism of Formation of Monodispersed Hydrosols. J. Am. Chem.Soc. 1950, 72, 4847–4854. [Google Scholar] [CrossRef]
- Dibaei, M.; Rouini, M.R.; Sheikholeslami, B.; Gholami, M.; Dinarvand, R. The Effect of Surface Treatment on the Brain Delivery of Curcumin Nanosuspension: In Vitro and in Vivo Studies. Int. J. Nanomed. 2019, 14, 5477–5490. [Google Scholar] [CrossRef] [Green Version]
- Cao, G.; Du, T.; Bai, Y.; Yang, T.; Zuo, J. Effects of Surfactant Molecular Structure on the Stability of Water in Oil Emulsion. J. Pet. Sci. Eng. 2021, 196, 107695. [Google Scholar] [CrossRef]
- Wen, S.N.; Chu, C.H.; Wang, Y.C.; Huang, H.Y.; Wang, Y.J.; Lin, J.Y.; Lu, H.T.; Wang, S.J.; Yang, C.S. Polymer-Stabilized Micelles Reduce the Drug Rapid Clearance in Vivo. J. Nanomater. 2018, 2018, 5818592. [Google Scholar] [CrossRef] [Green Version]
- Patil, R.P.; Pawara, D.D.; Gudewar, C.S.; Tekade, A.R. Nanostructured Cubosomes in an in Situ Nasal Gel System: An Alternative Approach for the Controlled Delivery of Donepezil HCl to Brain. J. Liposome Res. 2019, 29, 264–273. [Google Scholar] [CrossRef]
- Jacobs, C.; Kayser, O.; Müller, R.H. Nanosuspensions as a New Approach for the Formulation for the Poorly Soluble Drug Tarazepide. Int. J. Pharm. 2000, 196, 161–164. [Google Scholar] [CrossRef]
- Sun, W.; Xie, C.; Wang, H.; Hu, Y. Specific Role of Polysorbate 80 Coating on the Targeting of Nanoparticles to the Brain. Biomaterials 2004, 25, 3065–3071. [Google Scholar] [CrossRef] [PubMed]
- Tuomela, A.; Hirvonen, J.; Peltonen, L. Stabilizing Agents for Drug Nanocrystals: Effect on Bioavailability. Pharmaceutics 2016, 8, 16. [Google Scholar] [CrossRef] [Green Version]
- Wu, S.; Wang, G.; Lu, Z.; Li, Y.; Zhou, X.; Chen, L.; Cao, J.; Zhang, L. Effects of Glycerol Monostearate and Tween 80 on the Physical Properties and Stability of Recombined Low-Fat Dairy Cream. Dairy Sci. Technol. 2016, 96, 377–390. [Google Scholar] [CrossRef] [Green Version]
- El-Naggar, N.E.A.; Saber, W.E.I.A.; Zweil, A.M.; Bashir, S.I. An Innovative Green Synthesis Approach of Chitosan Nanoparticles and Their Inhibitory Activity against Phytopathogenic Botrytis Cinerea on Strawberry Leaves. Sci. Rep. 2022, 12, 3515. [Google Scholar] [CrossRef]
- Amar-Yuli, I.; Libster, D.; Aserin, A.; Garti, N. Solubilization of Food Bioactives within Lyotropic Liquid Crystalline Mesophases. Curr. Opin. Colloid Interface Sci. 2009, 14, 21–32. [Google Scholar] [CrossRef]
- Wang, H.; Zetterlund, P.B.; Boyer, C.; Spicer, P.T. Polymerization of Cubosome and Hexosome Templates to Produce Complex Microparticle Shapes. J. Colloid Interface Sci. 2019, 546, 240–250. [Google Scholar] [CrossRef]
- Bei, D.; Zhang, T.; Murowchick, J.B.; Youan, B.-B.C. Formulation of Dacarbazine-Loaded Cubosomes. Part III. Physicochemical Characterization. AAPS PharmSciTech 2010, 11, 1243–1249. [Google Scholar] [CrossRef] [PubMed] [Green Version]
- Chen, Y.; Ma, P.; Gui, S. Cubic and Hexagonal Liquid Crystals as Drug Delivery Systems. Biomed. Res. Int. 2014, 2014, 815981. [Google Scholar] [CrossRef] [Green Version]
- Gaballa, S.A.; el Garhy, O.H.; Moharram, H.; Abdelkader, H. Preparation and Evaluation of Cubosomes/Cubosomal Gels for Ocular Delivery of Beclomethasone Dipropionate for Management of Uveitis. Pharm. Res. 2020, 37, 198. [Google Scholar] [CrossRef]
- Sukmawati, A.; Utami, W.; Yuliani, R.; Da’I, M.; Nafarin, A. Effect of Tween 80 on Nanoparticle Preparation of Modified Chitosan for Targeted Delivery of Combination Doxorubicin and Curcumin Analogue. IOP Conf. Ser. Mater. Sci. Eng. 2018, 311, 012024. [Google Scholar] [CrossRef]
- Youshia, J.; Kamel, A.O.; el Shamy, A.; Mansour, S. Gamma Sterilization and in Vivo Evaluation of Cationic Nanostructured Lipid Carriers as Potential Ocular Delivery Systems for Antiglaucoma Drugs. Eur. J. Pharm. Sci. 2021, 163, 105887. [Google Scholar] [CrossRef] [PubMed]
- Lim, D.G.; Jeong, W.W.; Kim, N.A.; Lim, J.Y.; Lee, S.H.; Shim, W.S.; Kang, N.G.; Jeong, S.H. Effect of the Glyceryl Monooleate-Based Lyotropic Phases on Skin Permeation Using in Vitro Diffusion and Skin Imaging. Asian J. Pharm. Sci. 2014, 9, 324–329. [Google Scholar] [CrossRef] [Green Version]
- Haq, A.; Michniak-Kohn, B. Effects of Solvents and Penetration Enhancers on Transdermal Delivery of Thymoquinone: Permeability and Skin Deposition Study. Drug Deliv. 2018, 25, 1943. [Google Scholar] [CrossRef] [PubMed] [Green Version]
- Ajmeera, D.; Manda, S.; Janapareddi, K.; Kolluri, S. Development of Nanoemulsion to Improve the Ocular Bioavailability and Patient Compliance in Postoperative Treatment Using Indomethacin. Int. J. Appl. Pharm. 2020, 12, 99–107. [Google Scholar] [CrossRef]
- Wilhelmus, K.R. The Draize Eye Test. Surv. Ophthalmol. 2001, 45, 493–515. [Google Scholar] [CrossRef]
- Peng, X.; Zhou, Y.; Han, K.; Qin, L.; Dian, L.; Li, G.; Pan, X.; Wu, C. Characterization of Cubosomes as a Targeted and Sustained Transdermal Delivery System for Capsaicin. Drug Des. Devel. Ther. 2015, 9, 4209–4218. [Google Scholar] [CrossRef] [PubMed] [Green Version]
- Shi, X.; Peng, T.; Huang, Y.; Mei, L.; Gu, Y.; Huang, J.; Han, K.; Li, G.; Hu, C.; Pan, X.; et al. Comparative Studies on Glycerol Monooleate- and Phytantriol-Based Cubosomes Containing Oridonin in Vitro and in Vivo. Pharm. Dev. Technol. 2017, 22, 322–329. [Google Scholar] [CrossRef]
- Hong, L.; Dong, Y.-D.; Boyd, B.J. Preparation of Nanostructured Lipid Drug Delivery Particles Using Microfluidic Mixing. Pharm. Nanotechnol. 2019, 7, 484–495. [Google Scholar] [CrossRef]
- Elmowafy, M.; Samy, A.; Raslan, M.A.; Salama, A.; Said, R.A.; Abdelaziz, A.E.; El-Eraky, W.; el Awdan, S.; Viitala, T. Enhancement of Bioavailability and Pharmacodynamic Effects of Thymoquinone Via Nanostructured Lipid Carrier (NLC) Formulation. AAPS PharmSciTech 2016, 17, 663–672. [Google Scholar] [CrossRef]
- Kassem, M.G.A.; Ahmed, A.M.M.; Abdel-Rahman, H.H.; Moustafa, A.H.E. Use of Span 80 and Tween 80 for Blending Gasoline and Alcohol in Spark Ignition Engines. Energy Rep. 2019, 5, 221–230. [Google Scholar] [CrossRef]
- Kumar, G.P.; Rajeshwarrao, P. Nonionic Surfactant Vesicular Systems for Effective Drug Delivery—An Overview. Acta Pharm. Sin. B 2011, 1, 208–219. [Google Scholar] [CrossRef] [Green Version]
- Young, T.J.; Johnston, K.P.; Pace, G.W.; Mishra, A.K. Phospholipid-Stabilized Nanoparticles of Cyclosporine a by Rapid Expansion from Supercritical to Aqueous Solution. AAPS PharmSciTech 2004, 5, 70–85. [Google Scholar] [CrossRef] [PubMed] [Green Version]
- Helgason, T.; Awad, T.S.; Kristbergsson, K.; McClements, D.J.; Weiss, J. Effect of Surfactant Surface Coverage on Formation of Solid Lipid Nanoparticles (SLN). J. Colloid Interface Sci. 2009, 334, 75–81. [Google Scholar] [CrossRef]
- Kulkarni, S.A.; Feng, S.S. Effects of Particle Size and Surface Modification on Cellular Uptake and Biodistribution of Polymeric Nanoparticles for Drug Delivery. Pharm. Res. 2013, 30, 2512–2522. [Google Scholar] [CrossRef]
- Yegin, Y.; Oh, J.K.; Akbulut, M.; Taylor, T. Cetylpyridinium Chloride Produces Increased Zeta-Potential on Salmonella Typhimurium Cells, a Mechanism of the Pathogen’s Inactivation. NPJ Sci. Food 2019, 3, 1–7. [Google Scholar] [CrossRef] [Green Version]
- Tlijani, M.; Lassoued, M.A.; Bahloul, B.; Sfar, S. Development of a BCS Class II Drug Microemulsion for Oral Delivery: Design, Optimization, and Evaluation. J. Nanomater. 2021, 2021. [Google Scholar] [CrossRef]
- Spicer, P.T.; Hayden, K.L.; Lynch, M.L.; Ofori-Boateng, A.; Burns, J.L. Novel Process for Producing Cubic Liquid Crystalline Nanoparticles (Cubosomes). Langmuir 2001, 17, 5748–5756. [Google Scholar] [CrossRef]
- Choulis, N.H. Miscellaneous Drugs, Materials, Medical Devices, and Techniques. Side Eff. Drugs Annu. 2011, 33, 1009–1029. [Google Scholar] [CrossRef]
- Prajapati, H.N.; Dalrymple, D.M.; Serajuddin, A.T.M. A Comparative Evaluation of Mono-, Di- and Triglyceride of Medium Chain Fatty Acids by Lipid/Surfactant/Water Phase Diagram, Solubility Determination and Dispersion Testing for Application in Pharmaceutical Dosage Form Development. Pharm. Res. 2012, 29, 285–305. [Google Scholar] [CrossRef] [Green Version]
- McClements, D.J. Crystals and Crystallization in Oil-in-Water Emulsions: Implications for Emulsion-Based Delivery Systems. Adv. Colloid Interface Sci. 2012, 174, 1–30. [Google Scholar] [CrossRef] [PubMed]


| Formula Code | Factor A | Factor B | Factor C | Responses * ± SD | ||
|---|---|---|---|---|---|---|
| Stabilizer Amount (mg) | PE Type | Stabilizer Type | Y1: PS (nm) | Y2: PDI | Y3: ZP (mV) | |
| F1 | 1.25 | Capmul® MCM | TPGS | 346.45 ± 30.05 | 0.40 ± 0.04 | −40.80 ± 5.05 |
| F2 | 1.25 | None | Tween 80 | 666.35 ± 60.83 | 0.50 ± 0.05 | −41.15 ± 2.34 |
| F3 | 21.4375 | Captex® 8000 | Tween 80 | 182.53 ± 24.43 | 0.43 ± 0.09 | −36.58 ± 1.13 |
| F4 | 25 | Oleic acid | TPGS | 232.55 ± 38.41 | 0.46 ± 0.01 | −74.75 ± 7.34 |
| F5 | 25 | None | Tween 80 | 260.80 ± 57.46 | 0.42 ± 0.08 | −31.50 ± 0.42 |
| F6 | 11.9375 | Captex® 8000 | TPGS | 205.05 ± 9.57 | 0.38 ± 0.02 | −36.98 ± 1.50 |
| F7 | 4.8125 | Captex® 8000 | P407 | 160.38 ± 5.05 | 0.15 ± 0.04 | −20.58 ± 0.46 |
| F8 | 25 | None | TPGS | 109.08 ± 6.53 | 0.36 ± 0.06 | −26.20 ± 2.51 |
| F9 | 20.25 | Capmul® MCM | P407 | 150.70 ± 7.51 | 0.32 ± 0.07 | −17.85 ± 1.16 |
| F10 | 1.25 | Oleic acid | P407 | 160.63 ± 10.95 | 0.32 ± 0.04 | −66.65 ± 5.72 |
| F11 | 1.25 | Captex® 8000 | Tween 80 | 561.25 ± 66.22 | 0.57 ± 0.05 | −52.78 ± 9.94 |
| F12 | 1.25 | Oleic acid | Tween 80 | 176.03 ± 5.91 | 0.37 ± 016 | −72.70 ± 6.88 |
| F13 | 17.875 | None | P407 | 307.35 ± 36.12 | 0.61 ± 0.07 | −19.28 ± 1.84 |
| F14 | 4.8125 | Oleic acid | TPGS | 226.80 ± 22.52 | 0.42 ± 0.04 | −81.03 ± 7.71 |
| F15 | 21.675 | Oleic acid | P407 | 333.83 ± 51.39 | 0.47 ± 0.03 | −37.18 ± 2.88 |
| F16 | 4.21875 | Capmul® MCM | Tween 80 | 579.53 ± 229.65 | 0.58 ± 0.17 | −41.53 ± 3.81 |
| F17 | 25 | Captex® 8000 | P407 | 147.78 ± 11.14 | 0.32 ± 0.05 | −15.18 ± 0.95 |
| F18 | 25 | Capmul® MCM | Tween 80 | 418.25 ± 117.58 | 0.39 ± 0.07 | −26.40 ± 1.27 |
| F19 | 8.375 | None | TPGS | 180.75 ± 29.95 | 0.33 ± 0.05 | −29.48 ± 1.91 |
| F20 | 21.4375 | Capmul® MCM | TPGS | 195.28 ± 17.76 | 0.41 ± 0.04 | −32.93 ± 1.54 |
| Terms | Responses | |||||
|---|---|---|---|---|---|---|
| PS | PDI | ZP | ||||
| F-Value | p-Value | F-Value | p-Value | F-Value | p-Value | |
| Model | 24.88 * | 0.0393 | 30.8 * | 0.0319 | 27.57 * | <0.0001 |
| A | 35.36 * | 0.0271 | 0.0143 NS | 0.9156 | 11.32 * | 0.0051 |
| B | 7.19 NS | 0.1245 | 10.81 NS | 0.0859 | 36.7 * | <0.0001 |
| C | 58.43 * | 0.0168 | 51.71 * | 0.019 | 16.79 * | 0.0002 |
| AB | 15.64 NS | 0.0607 | 2.67 NS | 0.2846 | - | - |
| AC | 16.62 NS | 0.0567 | 46.22 * | 0.0212 | - | - |
| BC | 16.1 NS | 0.0596 | 42.95 * | 0.0229 | - | - |
| Formula Code | A: Stabilizer Amount (mg) | B: PE Type | C: Stabilizer Type | Experimental Results * ± SD | Predicted Results | Prediction Error (%) | ||||||
|---|---|---|---|---|---|---|---|---|---|---|---|---|
| PS (nm) | PDI | ZP (mV) | PS (nm) | PDI | ZP (mV) | PS | PDI | ZP | ||||
| F-1-O | 25 | Oleic acid | Tween 80 | 238.11 ± 17.21 | 0.26 ± 0.01 | −67.30 ± 2.81 | 207.32 | 0.22 | −67.11 | 14.85 | 19.09 | 0.28 |
| F-2-O | 1.25 | Oleic acid | P407 | 160.63 ± 8.80 | 0.32 ± 0.02 | −66.65 ± 6.91 | 155.98 | 0.31 | −60.07 | 2.98 | 1.29 | 10.96 |
| F-3-O | 25 | Captex® 8000 | Tween 80 | 159.10 ± 10.98 | 0.39 ± 0.01 | −32.40 ± 5.17 | 167.59 | 0.41 | −34.02 | 5.07 | 3.67 | 4.75 |
| F-4-O | 25 | Captex® 8000 | TPGS | 143.05 ± 12.67 | 0.47 ± 0.04 | −26.89 ± 2.10 | 119.54 | 0.40 | −33.42 | 19.62 | 17.20 | 19.54 |
| F-5-O | 4.252 | Captex® 8000 | P407 | 176.10 ± 9.74 | 0.17 ± 0.02 | −21.30 ± 3.29 | 167.75 | 0.15 | −25.44 | 4.98 | 18.49 | 16.27 |
| F-6-O | 1.25 | Captex® 8000 | P407 | 205.50 ± 13.45 | 0.14 ± 0.03 | −24.20 ± 2.12 | 171.77 | 0.12 | −26.97 | 19.63 | 14.75 | 10.28 |
| F-7-O | 1.25 | Capmul® MCM | TPGS | 346.45 ± 18.21 | 0.40 ± 0.02 | −40.80 ± 1.17 | 336.90 | 0.41 | −42.12 | 2.84 | 1.59 | 3.13 |
| F-8-O | 25 | Capmul® MCM | TPGS | 167.03 ± 10.90 | 0.33 ± 0.04 | −29.10 ± 3.22 | 187.60 | 0.40 | −29.98 | 10.97 | 17.66 | 2.93 |
| Formula Code | A: Stabilizer Amount (mg) | B: PE Type | C: Stabilizer Type | Data * ± SD | |||
|---|---|---|---|---|---|---|---|
| PS (nm) | PDI | ZP (mV) | EE% | ||||
| F-1-L | 25 | Oleic acid | Tween 80 | 216.20 ± 6.12 | 0.27 ± 0.03 | −72.93 ± 1.97 | 85.30 ± 4.29 |
| F-2-L | 1.25 | Oleic acid | P407 | 167.45 ± 8.54 | 0.33 ± 0.03 | −62.65 ± 3.12 | 73.36 ± 15.54 |
| F-3-L | 25 | Captex® 8000 | Tween 80 | 129.40 ± 11.73 | 0.34 ± 0.03 | −17.55 ± 2.10 | 82.54 ± 7.65 |
| F-4-L | 25 | Captex® 8000 | TPGS | 245.85 ± 3.45 | 0.44 ± 0.05 | −13.10 ± 1.27 | 71.29 ± 8.87 |
| F-5-L | 4.252 | Captex® 8000 | P407 | 178.08 ± 11.59 | 0.18 ± 0.02 | −19.45 ± 4.38 | 80.71 ± 3.68 |
| F-6-L | 1.25 | Captex® 8000 | P407 | 231.35 ± 12.99 | 0.36 ± 0.01 | −27.80 ± 1.27 | 75.16 ± 6.10 |
| F-7-L | 1.25 | Capmul® MCM | TPGS | 361.57 ± 29.21 | 0.42 ± 0.04 | −43.21 ± 7.22 | 84.31 ± 5.09 |
| F-8-L | 25 | Capmul® MCM | TPGS | 212.85 ± 16.65 | 0.43 ± 0.02 | −36.60 ± 3.45 | 77.20 ± 5.43 |
| Formula Code | Data * ± SD | |
|---|---|---|
| Jss (µg/cm2/h) | Kp (cm/h) | |
| F-1-L | 25.96 ± 2.05 | 0.64 ± 0.04 |
| F-2-L | 11.92 ± 3.07 | 0.29 ± 0.09 |
| F-3-L | 27.11 ± 3.25 | 0.67 ± 0.06 |
| F-4-L | 12.26 ± 1.54 | 0.30 ± 0.03 |
| F-5-L | 6.85 ± 0.57 | 0.17 ± 0.01 |
| F-6-L | 6.85 ± 0.57 | 0.14 ± 0.00 |
| F-7-L | 8.40 ± 1.05 | 0.21 ± 0.03 |
| F-8-L | 9.85 ± 0.97 | 0.24 ± 0.04 |
| DS | 1.53 ± 0.02 | 0.03 ± 0.00 |
| Time (h) | Mean % IOP Reduction * ± SD | ||
|---|---|---|---|
| G-I: F-1-L | G-II: F-3-L | G-III: TRAVATAN® | |
| 0.5 | 0.00 ± 0.00 | 7.53 ± 0.00 | 14.52 ± 0.00 |
| 1 | 20.79 ± 6.18 | 14.52 ± 0.00 | 26.88 ± 0.00 |
| 2 | 37.90 ± 0.00 | 30.56 ± 6.36 | 37.90 ± 0.00 |
| 4 | 41.04 ± 5.43 | 42.65 ± 4.70 | 55.65 ± 0.00 |
| 6 | 58.06 ± 4.19 | 52.87 ± 4.81 | 59.41 ± 0.00 |
| 8 | 52.87 ± 4.81 | 51.52 ± 4.17 | 60.48 ± 4.19 |
| 10 | 52.87 ± 4.81 | 55.56 ± 3.90 | 59.41 ± 0.00 |
| 12 | 54.30 ± 2.33 | 58.06 ± 4.19 | 52.96 ± 2.33 |
| 24 | 51.52 ± 4.17 | 62.63 ± 6.05 | 39.52 ± 2.79 |
| 36 | 52.87 ± 4.81 | 54.30 ± 2.33 | 34.62 ± 2.88 |
| 48 | 39.34 ± 5.90 | 50.09 ± 4.81 | 29.11 ± 3.83 |
| 60 | 20.79 ± 6.18 | 48.57 ± 6.54 | 14.52 ± 0.00 |
| 72 | 2.51 ± 4.35 | 32.62 ± 2.44 | 0.00 ± 0.00 |
| PK Parameters | Mean Data * ± SD | ||
|---|---|---|---|
| F-1-L | F-3-L | Travatan® | |
| Tmax (h) | 2.00 | 6.00 | 1.00 |
| Cmax (ng/mL) | 1.46 ± 0.06 | 1.80 ± 0.15 | 1.42 ± 0.09 |
| AUC0-48 (ng.h/mL) | 43.02 ± 2.97 | 62.77 ± 2.73 | 41.03 ± 1.63 |
| AUCinf (ng.h/mL) | 133.63 ± 11.54 | 406.69 ± 17.12 | 125.98 ± 8.54 |
| MRT (h) | 11.73 ± 0.22 | 23.18 ± 0.57 | 11.58 ± 0.23 |
| %F | 106.10 | 322.82 | - |
Disclaimer/Publisher’s Note: The statements, opinions and data contained in all publications are solely those of the individual author(s) and contributor(s) and not of MDPI and/or the editor(s). MDPI and/or the editor(s) disclaim responsibility for any injury to people or property resulting from any ideas, methods, instructions or products referred to in the content. |
© 2023 by the authors. Licensee MDPI, Basel, Switzerland. This article is an open access article distributed under the terms and conditions of the Creative Commons Attribution (CC BY) license (https://creativecommons.org/licenses/by/4.0/).
Share and Cite
El-Gendy, M.A.; Mansour, M.; El-Assal, M.I.A.; Ishak, R.A.H.; Mortada, N.D. Travoprost Liquid Nanocrystals: An Innovative Armamentarium for Effective Glaucoma Therapy. Pharmaceutics 2023, 15, 954. https://doi.org/10.3390/pharmaceutics15030954
El-Gendy MA, Mansour M, El-Assal MIA, Ishak RAH, Mortada ND. Travoprost Liquid Nanocrystals: An Innovative Armamentarium for Effective Glaucoma Therapy. Pharmaceutics. 2023; 15(3):954. https://doi.org/10.3390/pharmaceutics15030954
Chicago/Turabian StyleEl-Gendy, Mohamed A., Mai Mansour, Mona I. A. El-Assal, Rania A. H. Ishak, and Nahed D. Mortada. 2023. "Travoprost Liquid Nanocrystals: An Innovative Armamentarium for Effective Glaucoma Therapy" Pharmaceutics 15, no. 3: 954. https://doi.org/10.3390/pharmaceutics15030954