
A Novel Fibromodulin Antagonist Peptide RP4 Exerts Antitumor Effects on Colorectal Cancer
 , and
, and 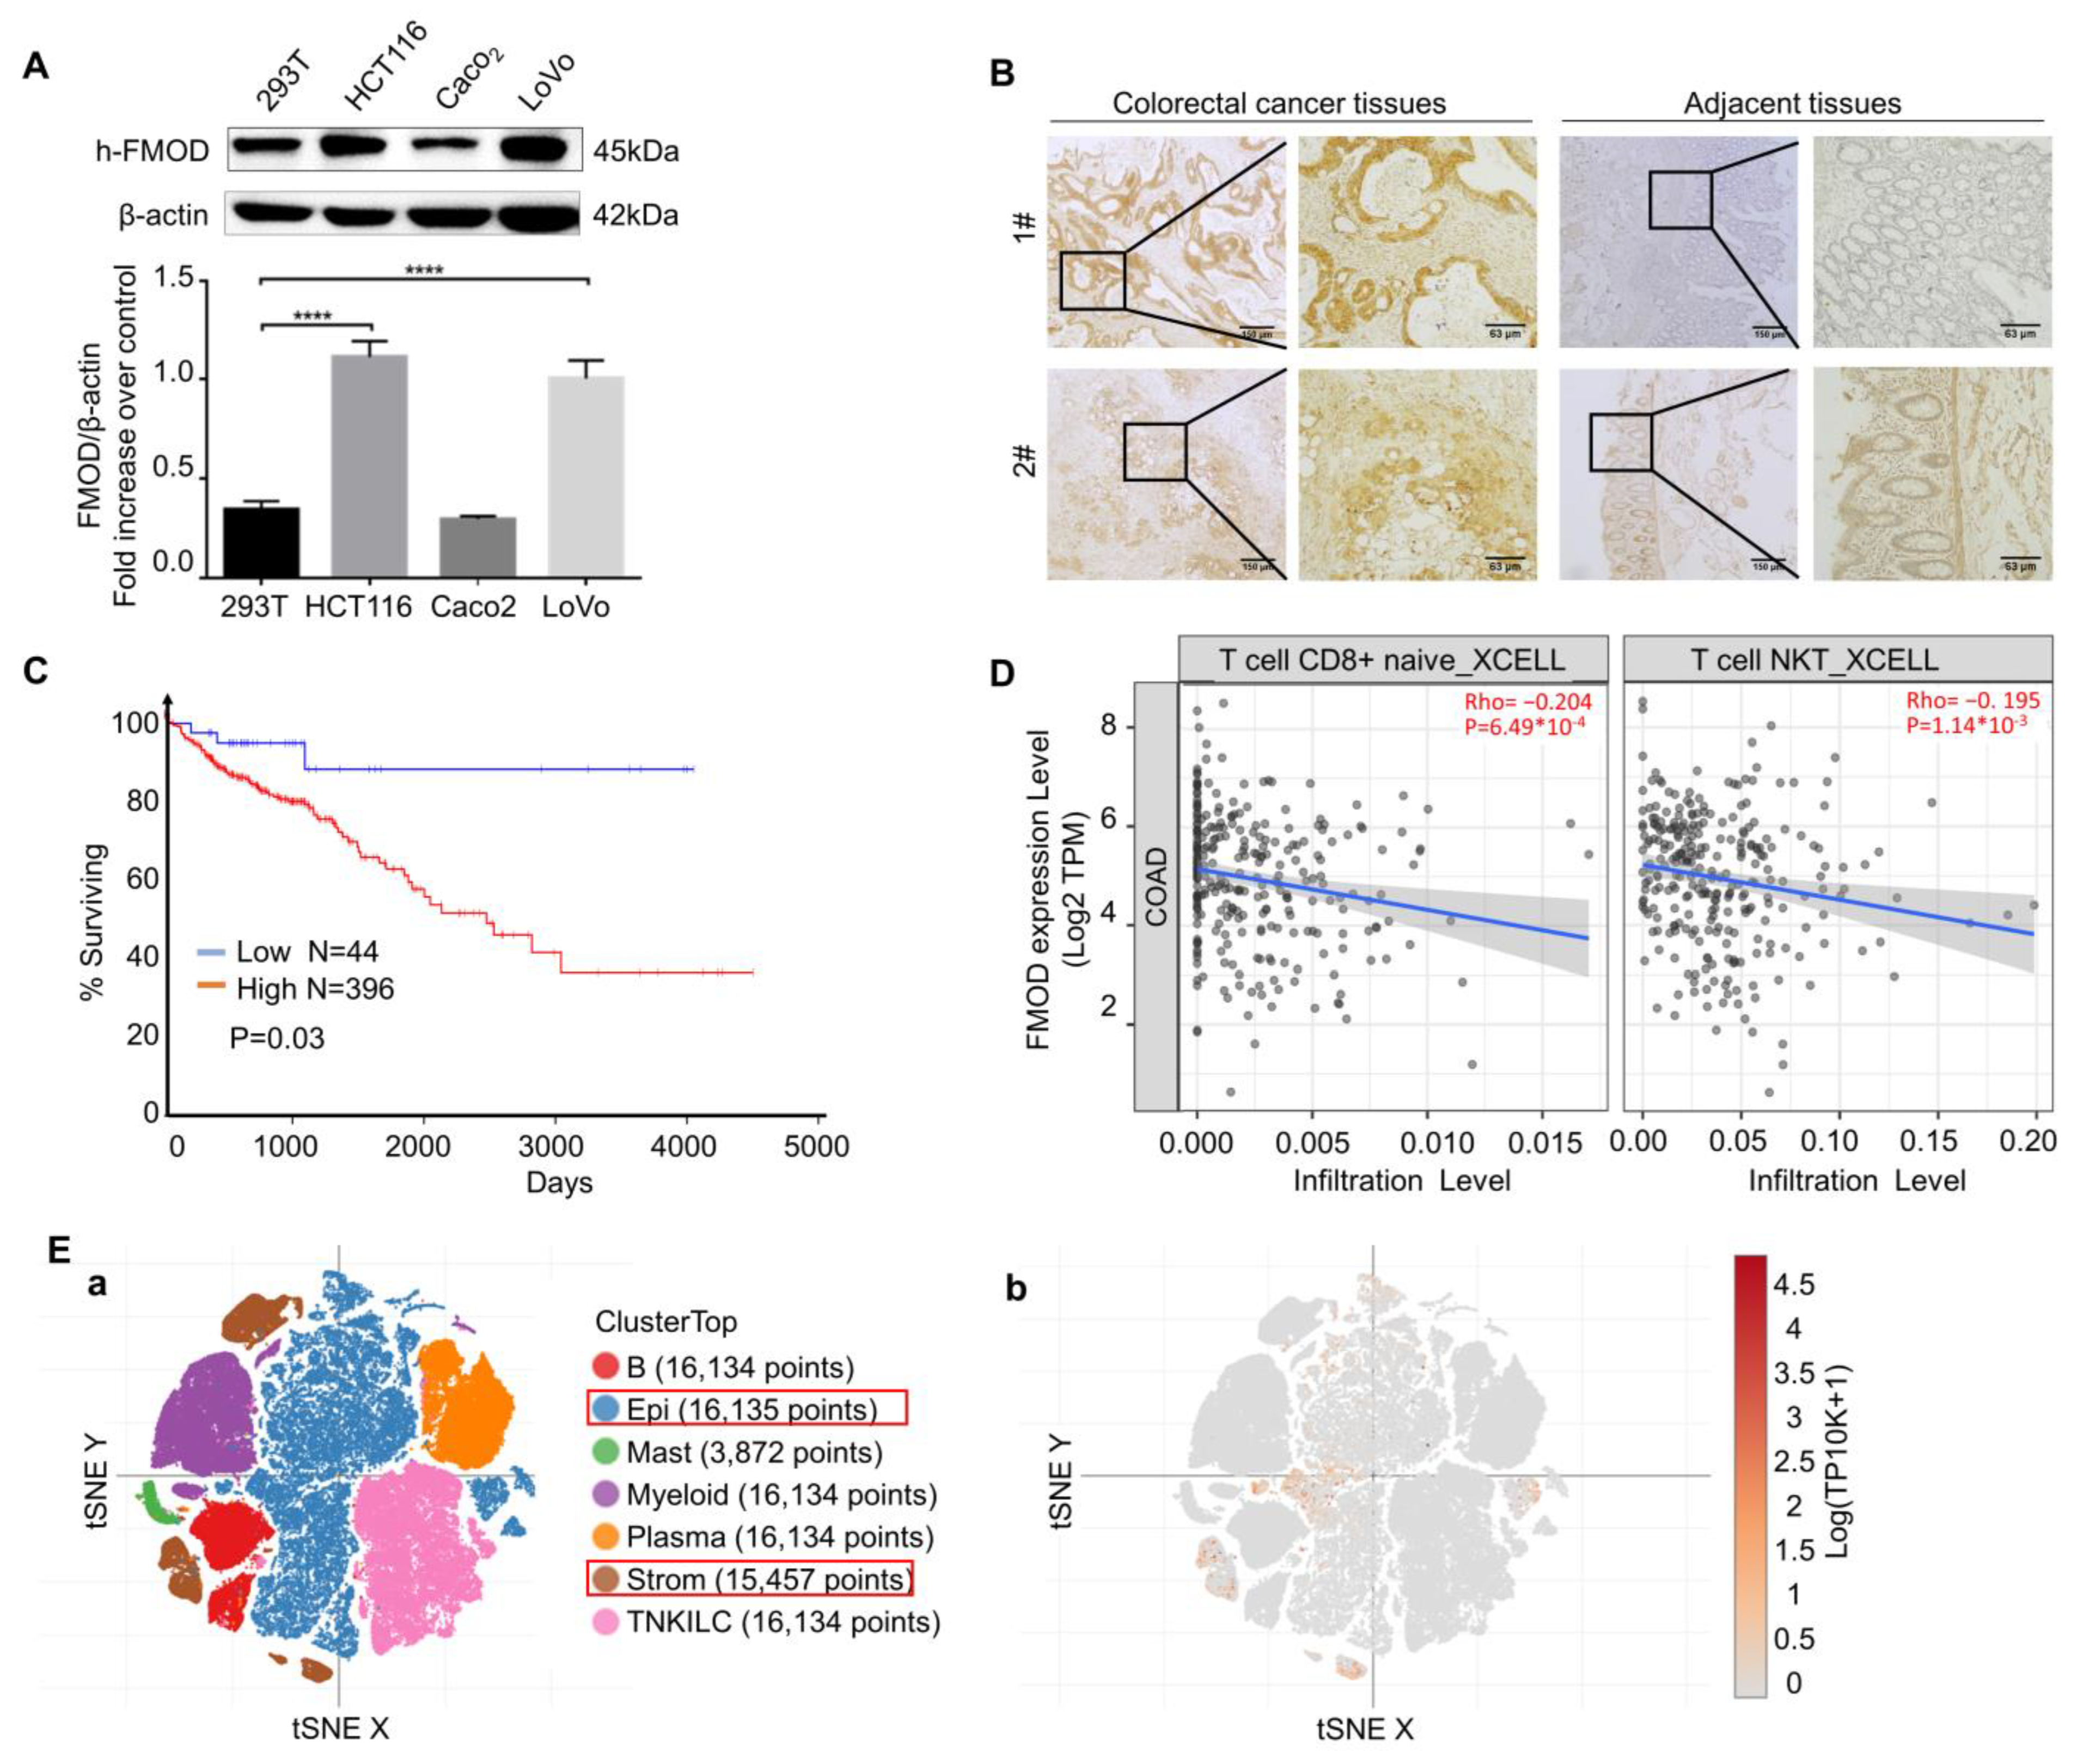
Abstract
:1. Introduction
2. Materials and Methods
2.1. Cell Culture and Cell Lines
2.2. Cell Viability Assay
2.3. Phage Display Peptide Library Biopanning
2.4. Molecular Docking Studies
2.5. Peptide Synthesis
2.6. HPLC and MS Analysis
2.7. Immunofluorescence
2.8. Cell Apoptosis Analysis
2.9. Western Blot
2.10. Cell Migration and Invasion
2.11. Angiogenesis Assay
2.12. Animal Model
2.13. HE and IHC
2.14. In Vivo Biodistribution
2.15. Flow Cytometric Analysis
2.16. Toxicology Assays
2.17. Statistical Analysis
2.18. Data Availability
3. Results
3.1. Expression Status of FMOD Is Related to CRC Progress
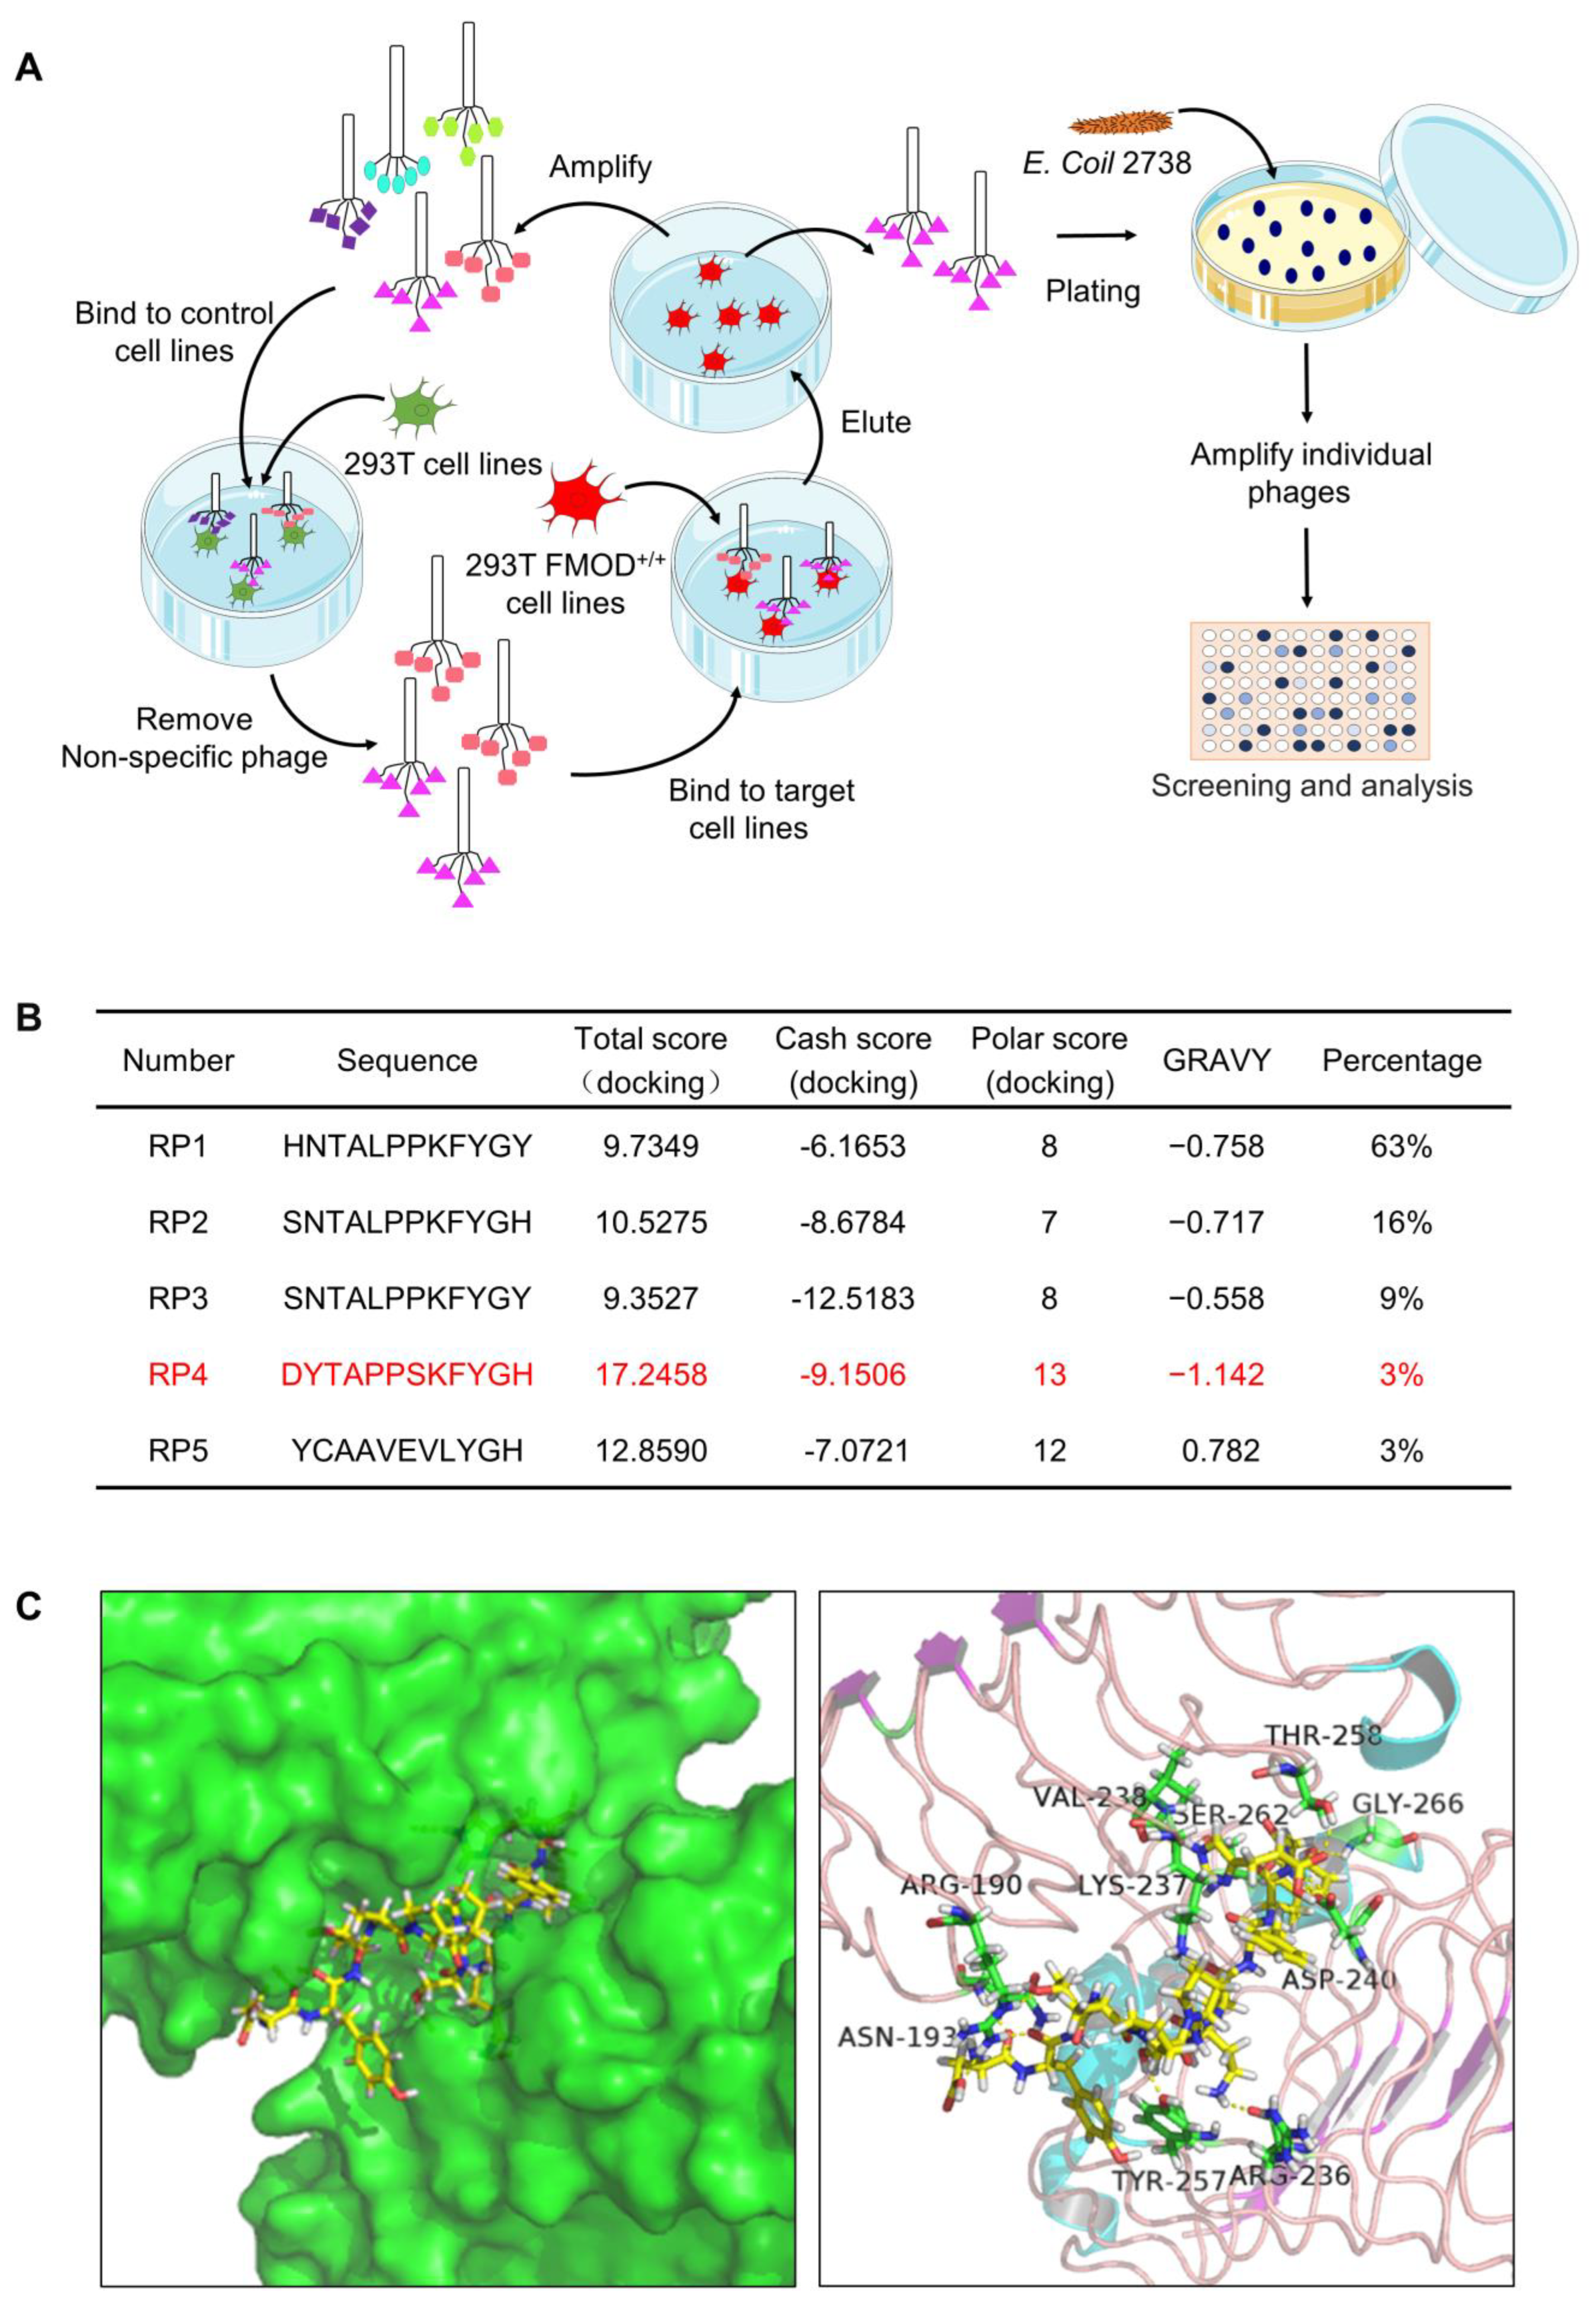
3.2. Biopanning of FMOD Antagonist Peptides
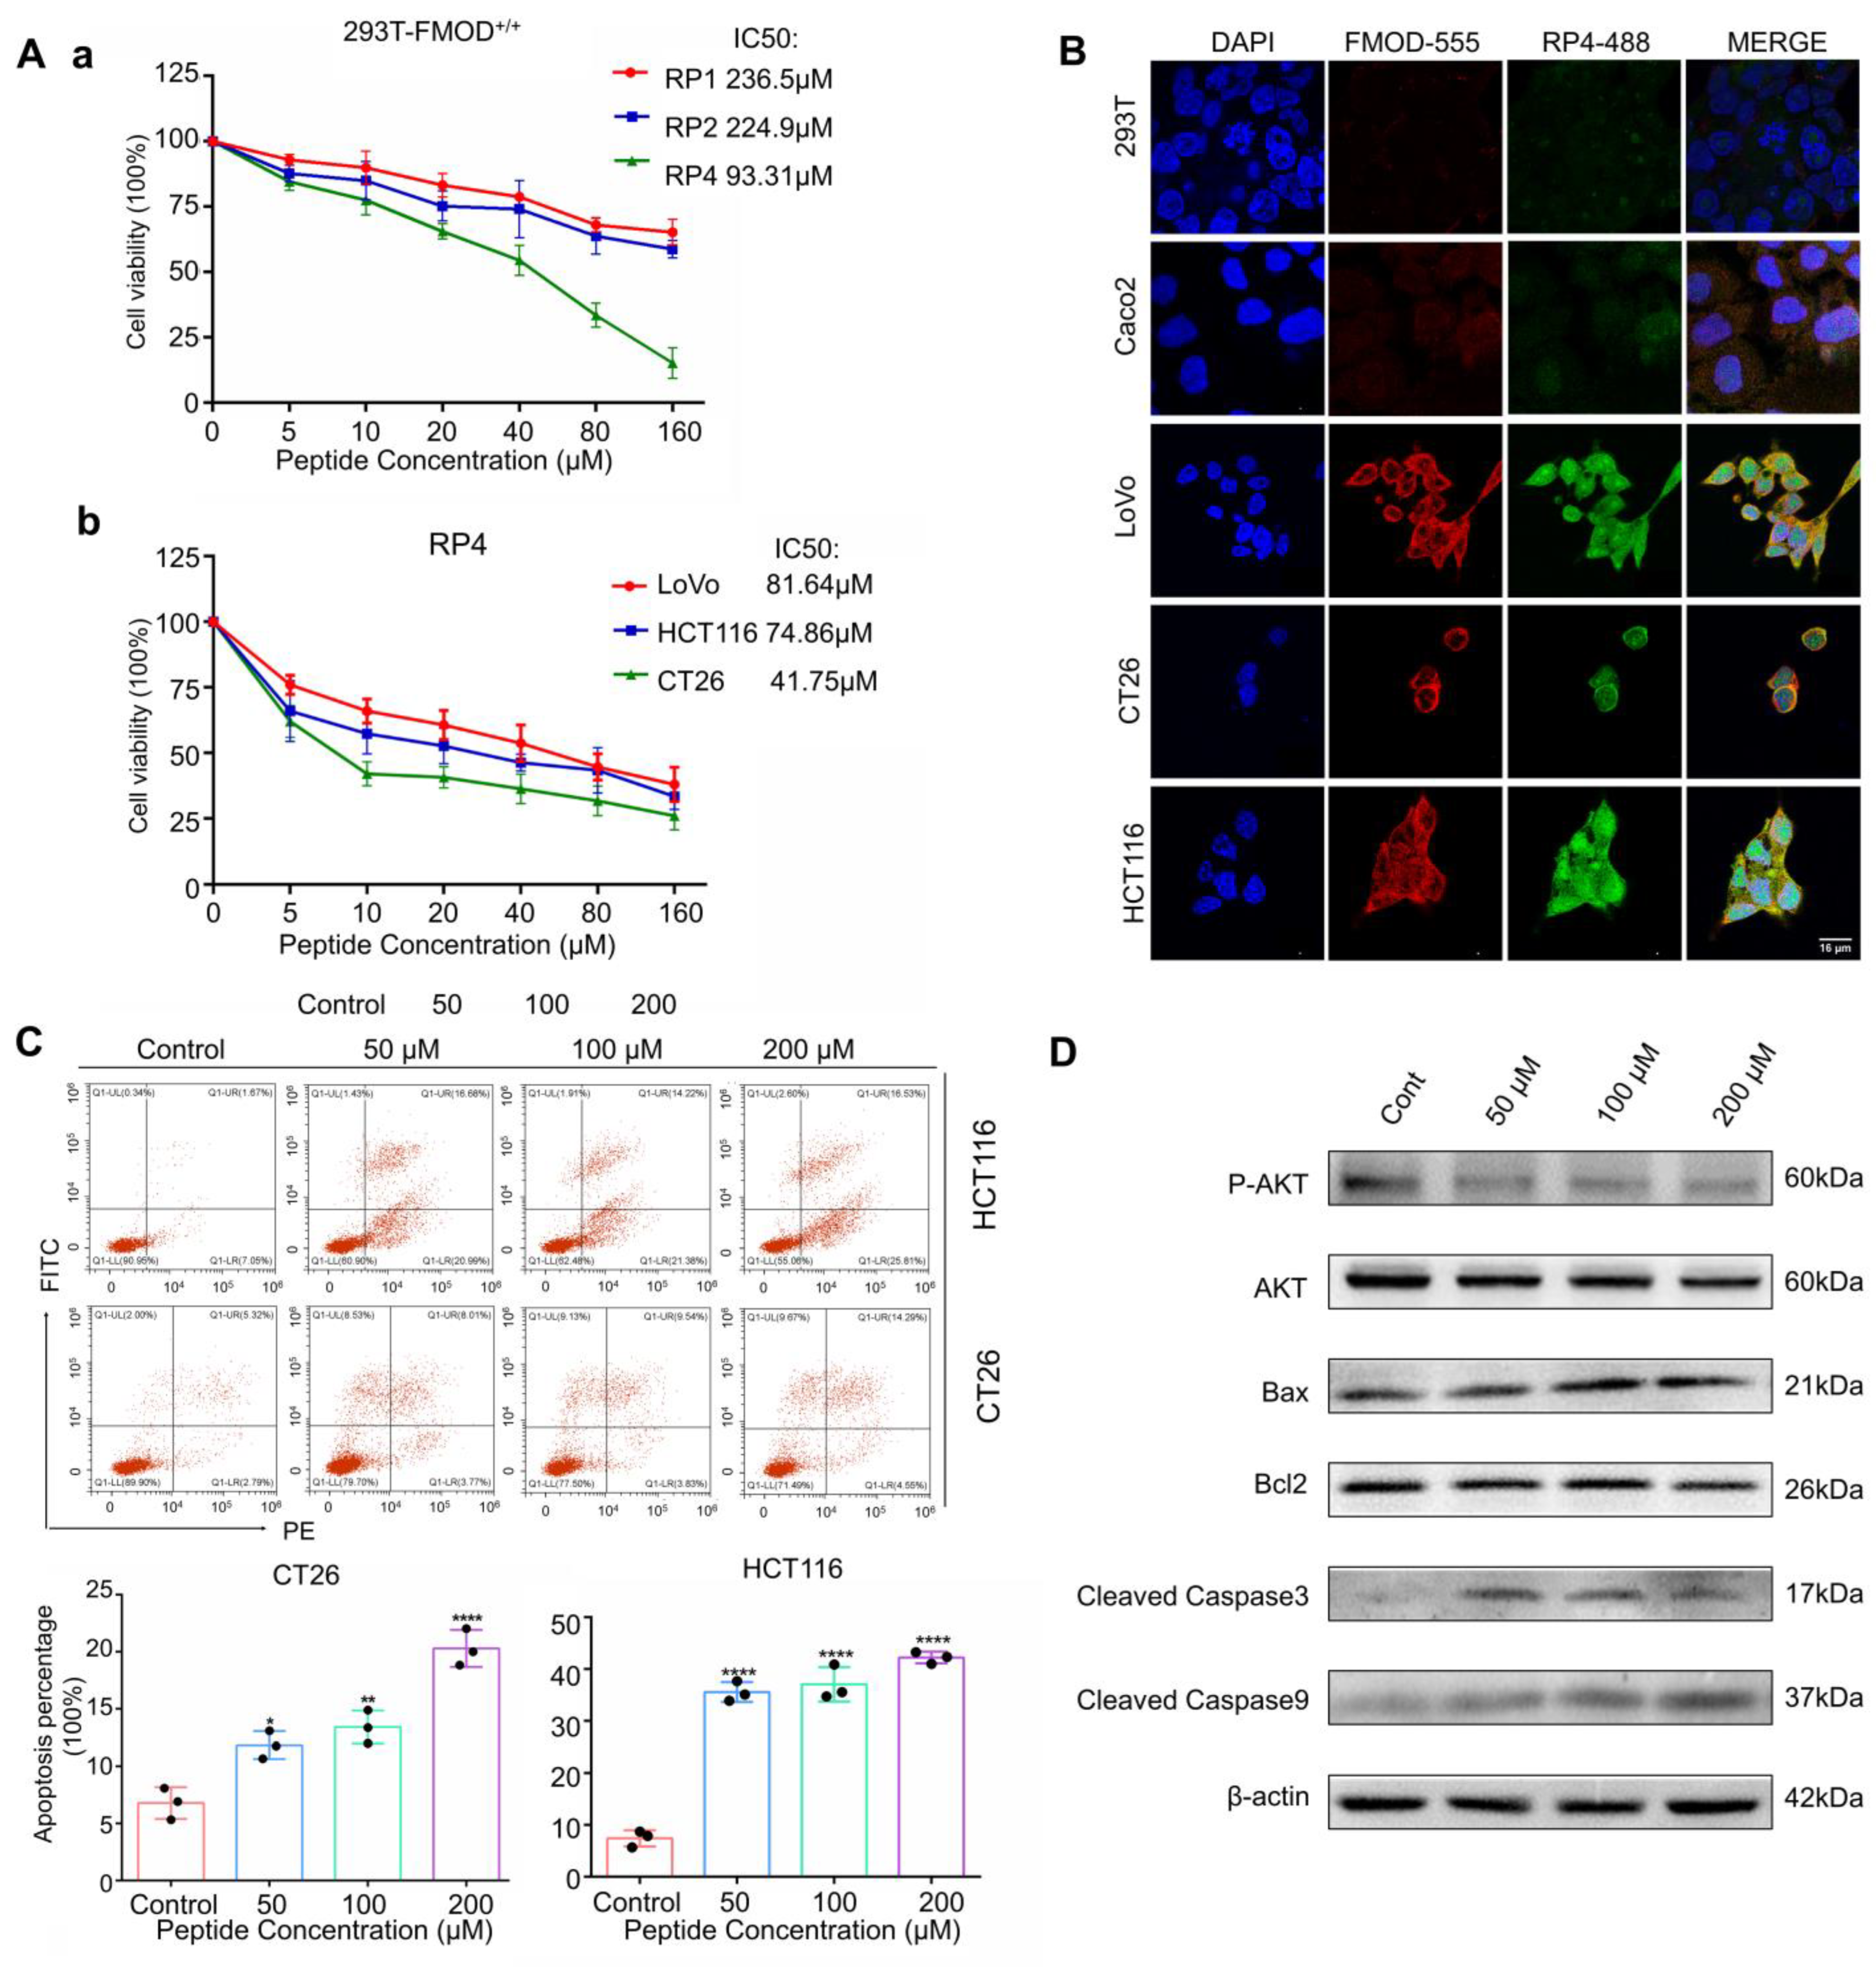
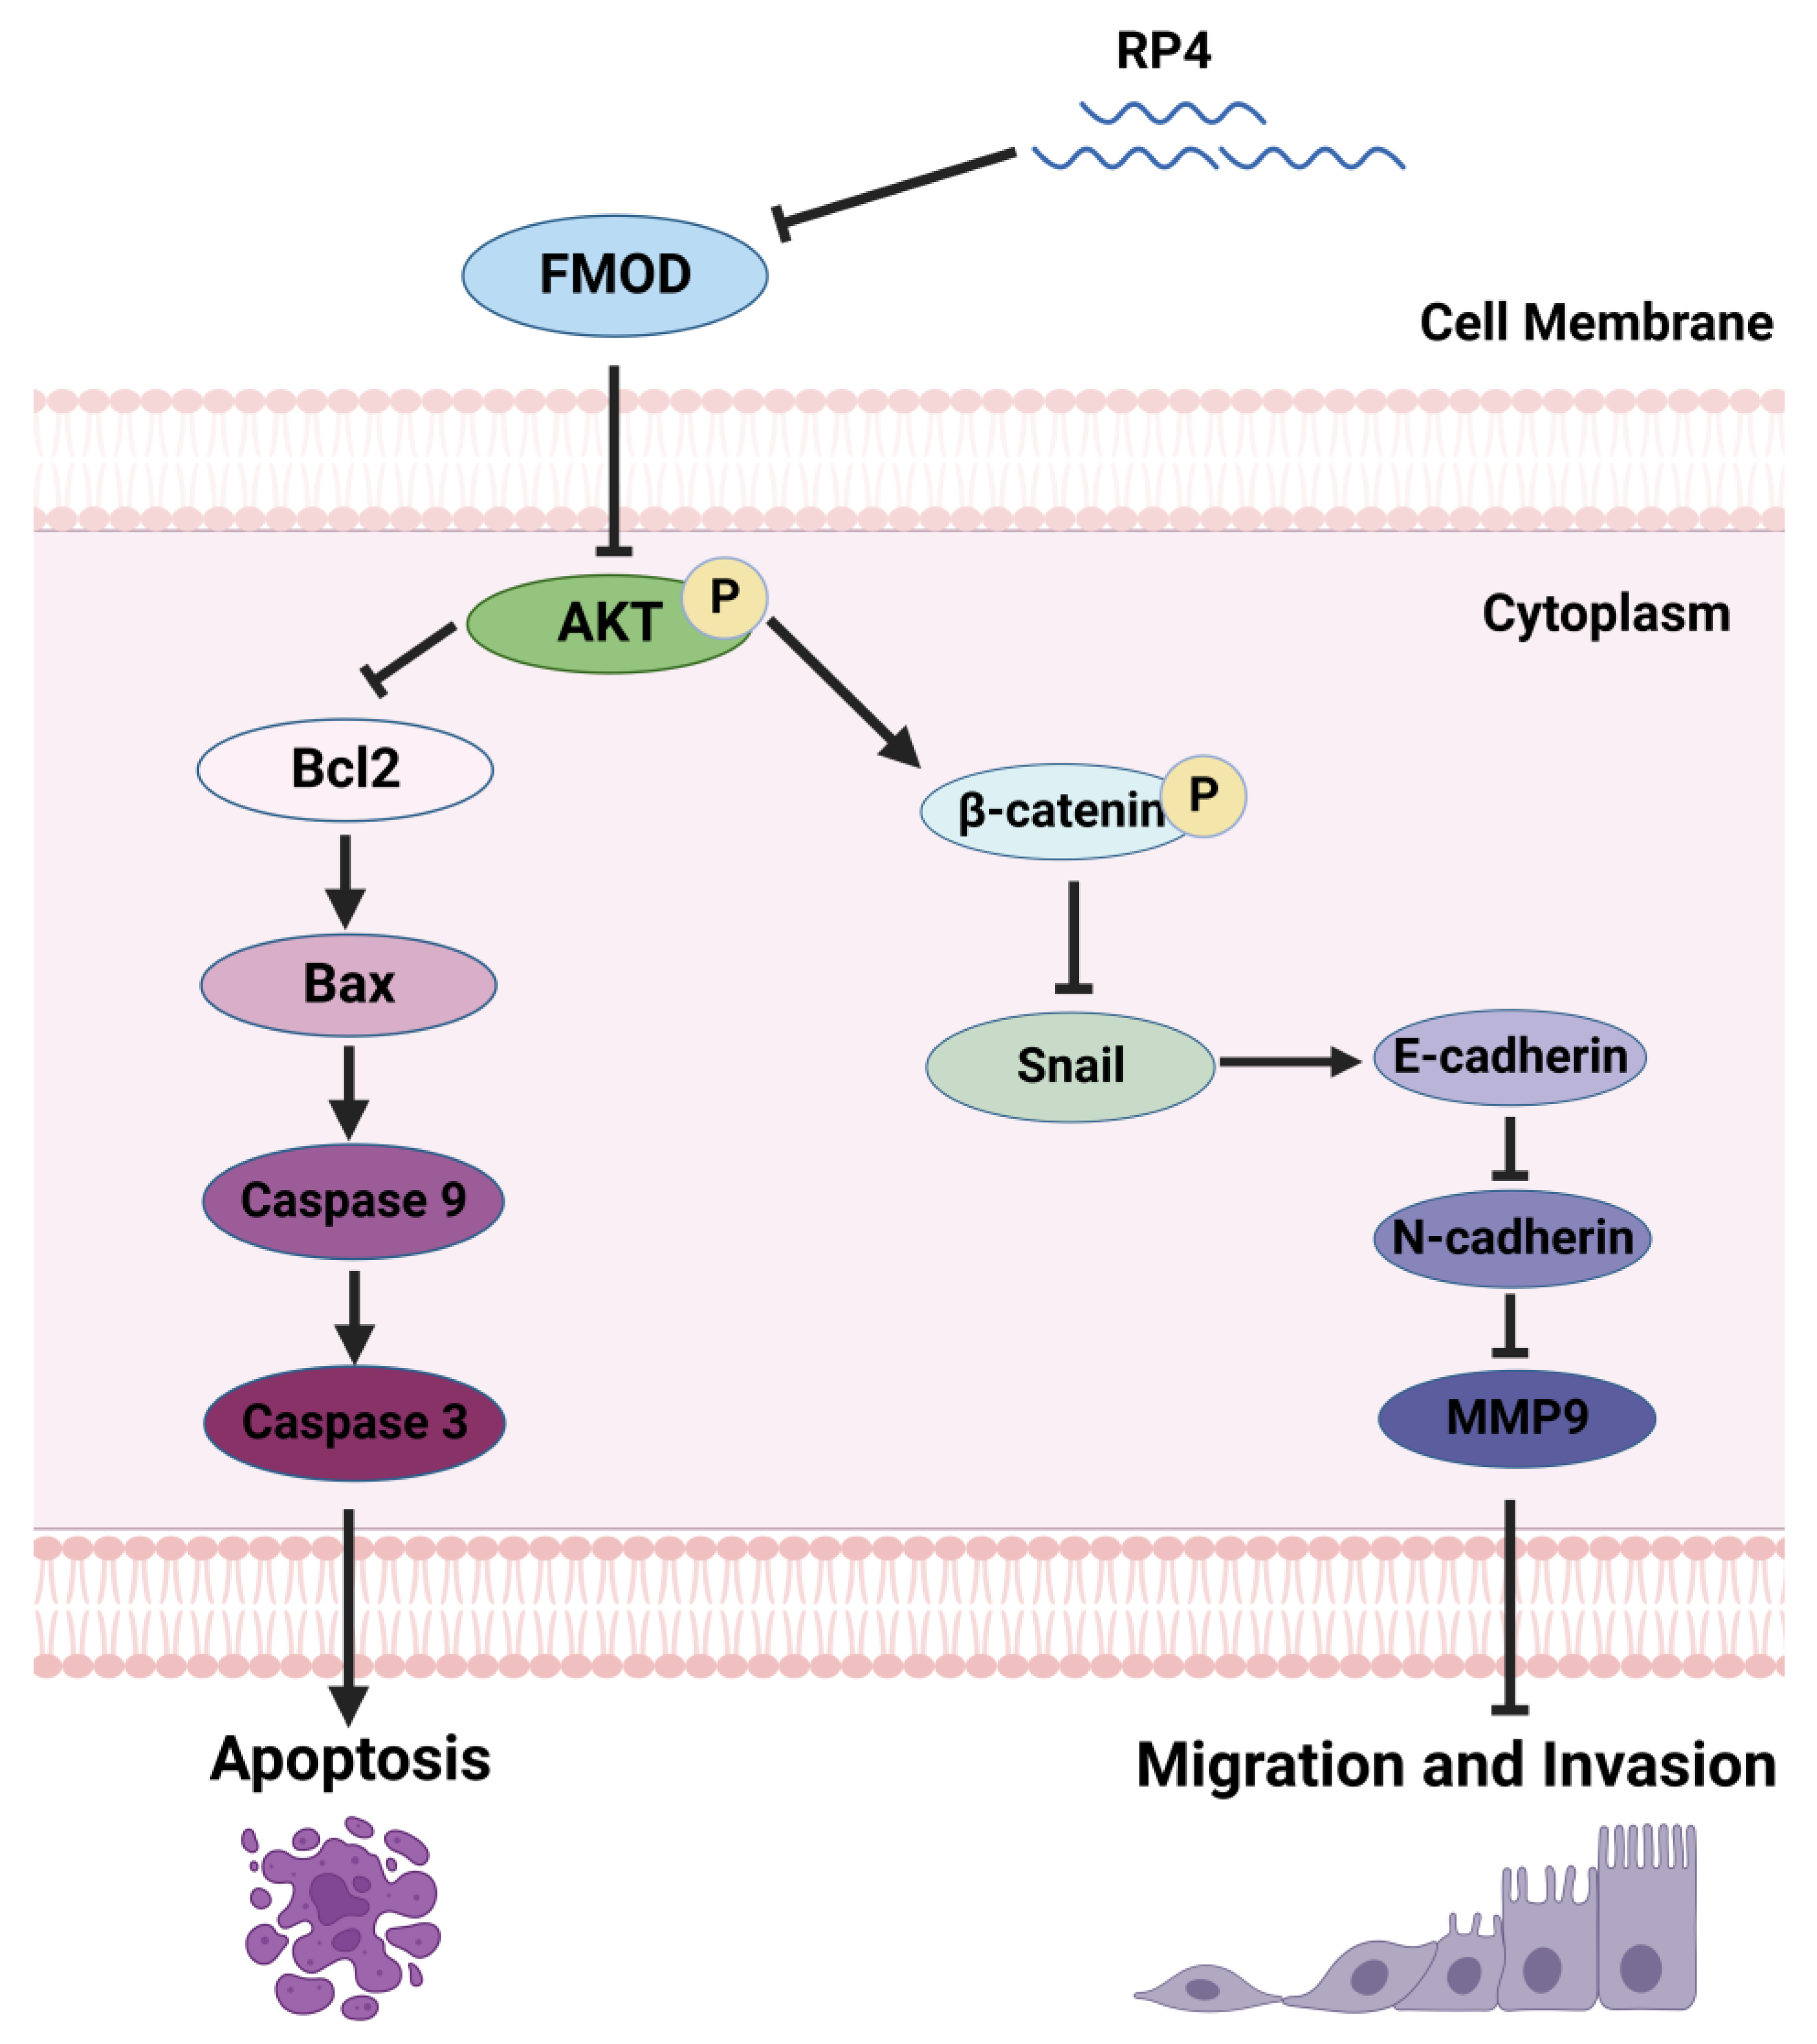
3.3. RP4 Binds to FMOD and Inhibits the Growth of Colorectal Cancer Cells
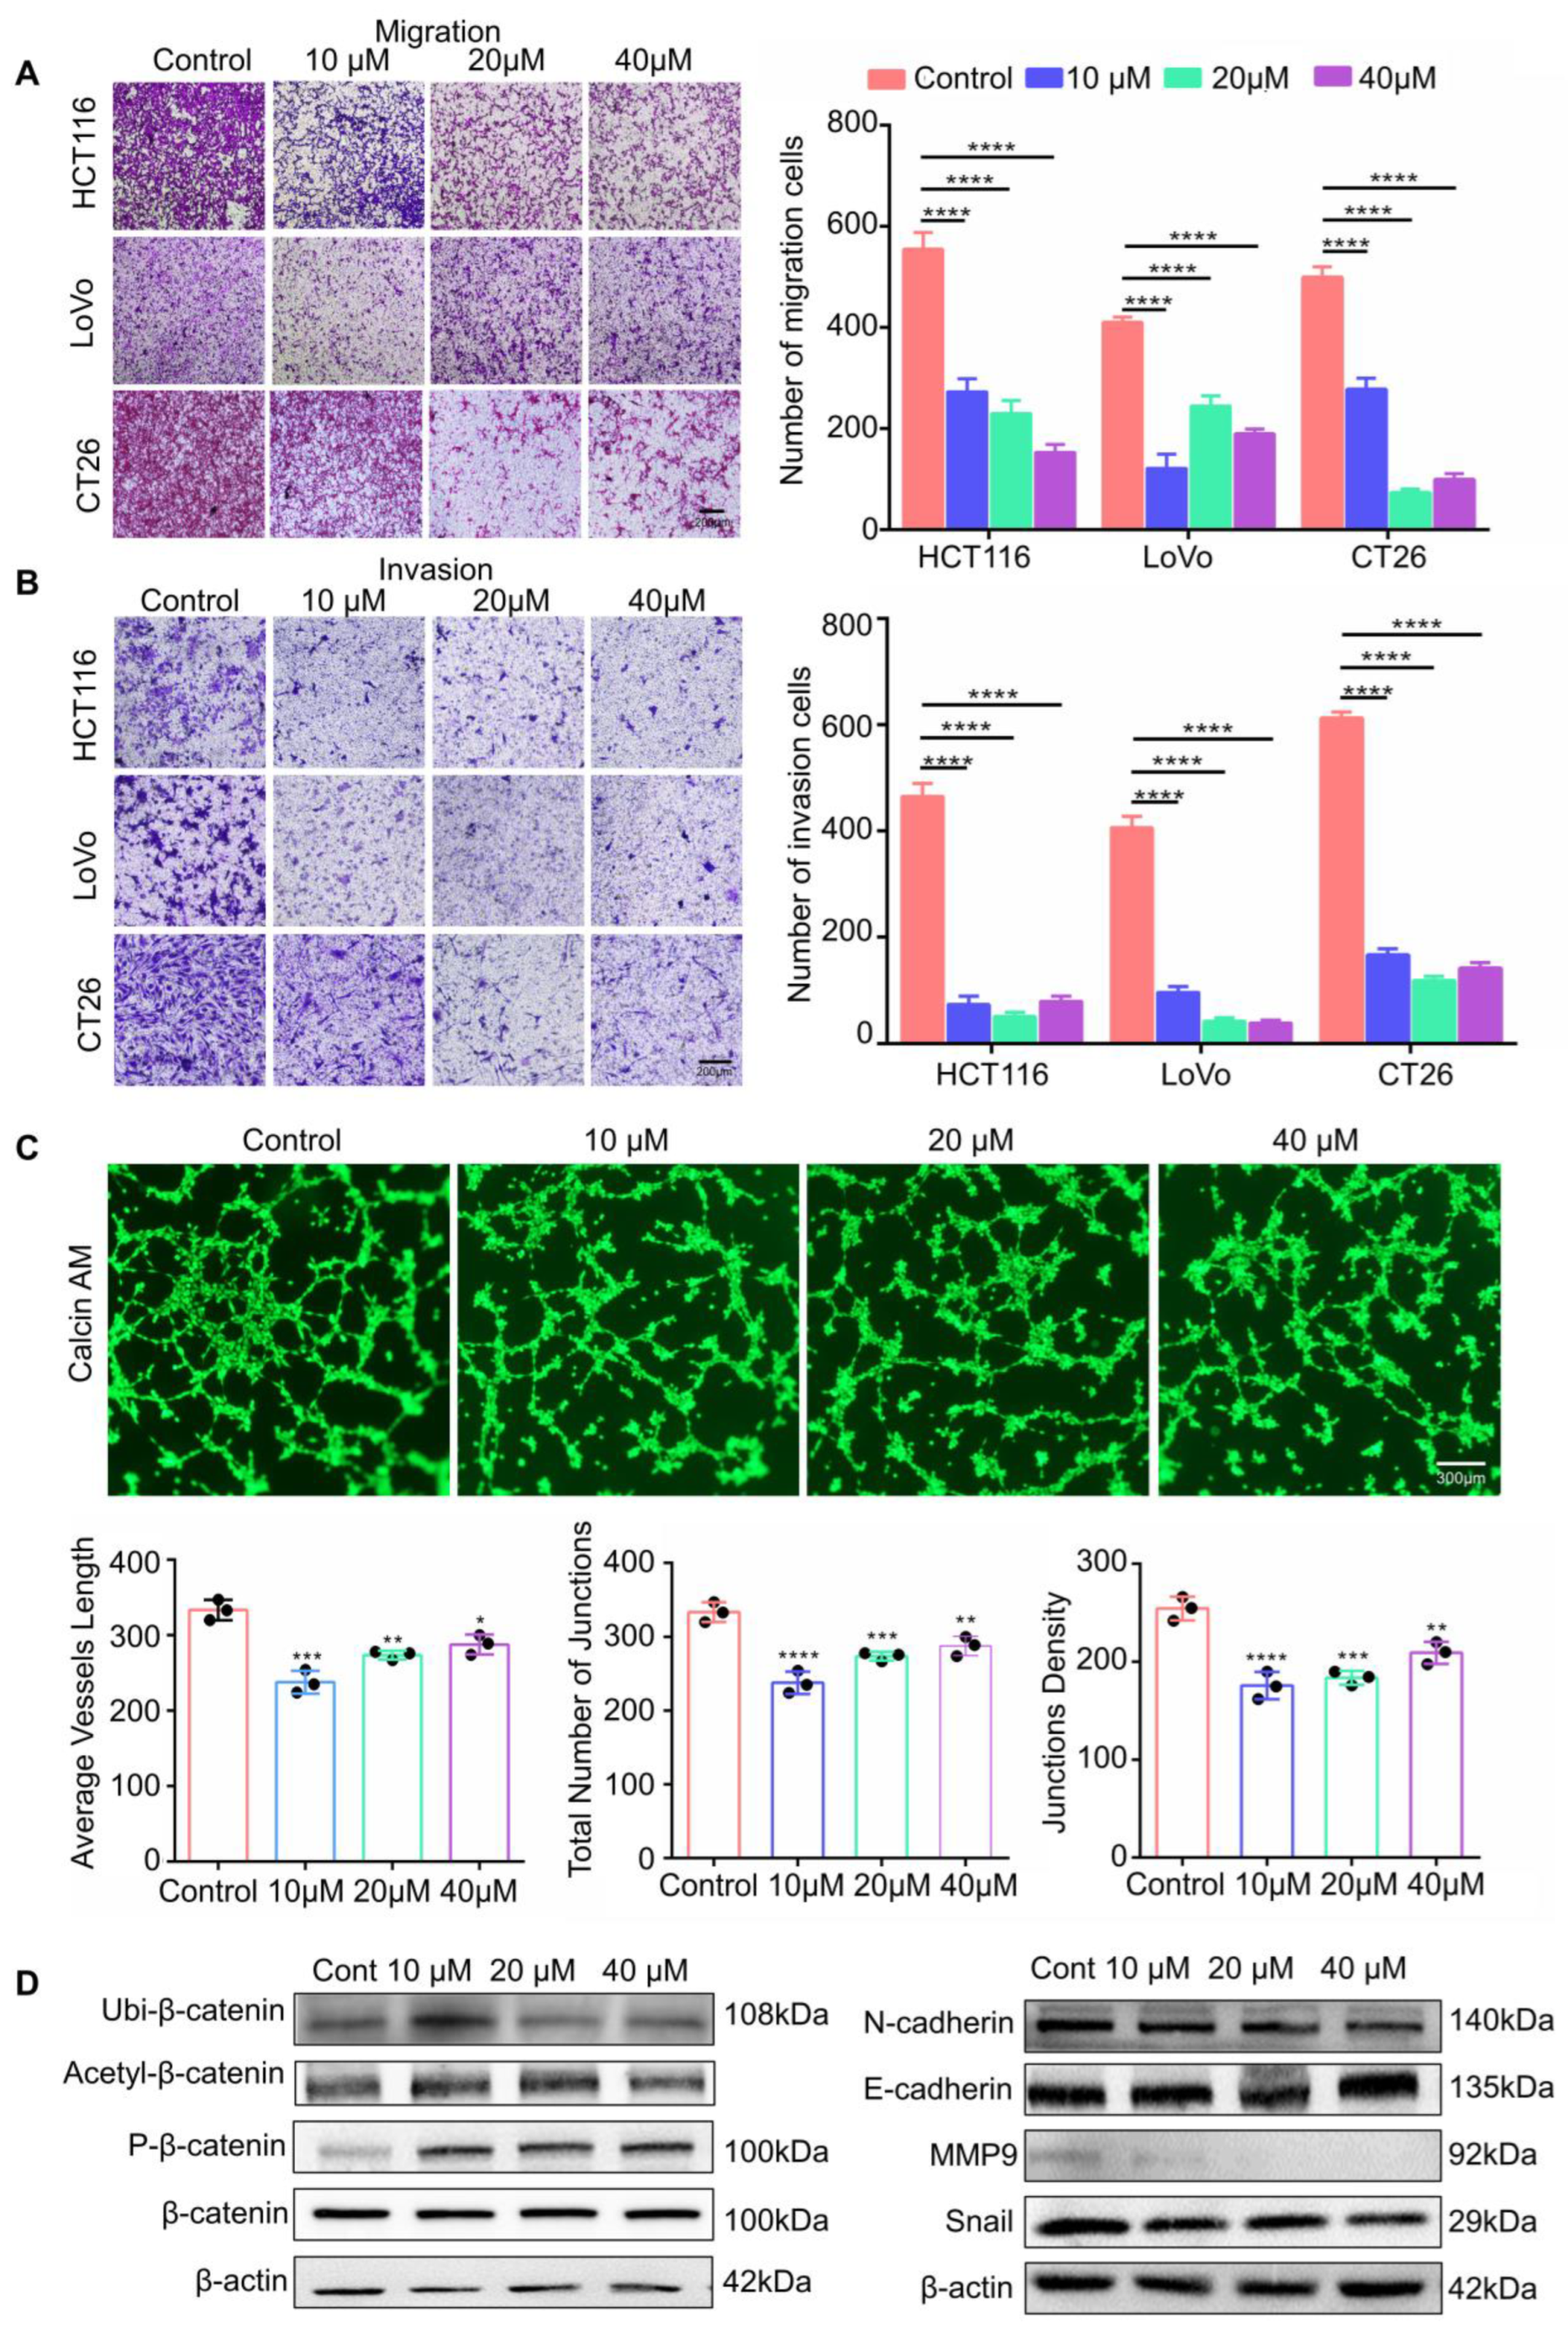
3.4. RP4 Inhibits CRC Cells Invasion and Migration via Suppressing the Wnt/β-catenin Signaling Pathway and Blocking Angiogenesis of HUVECs
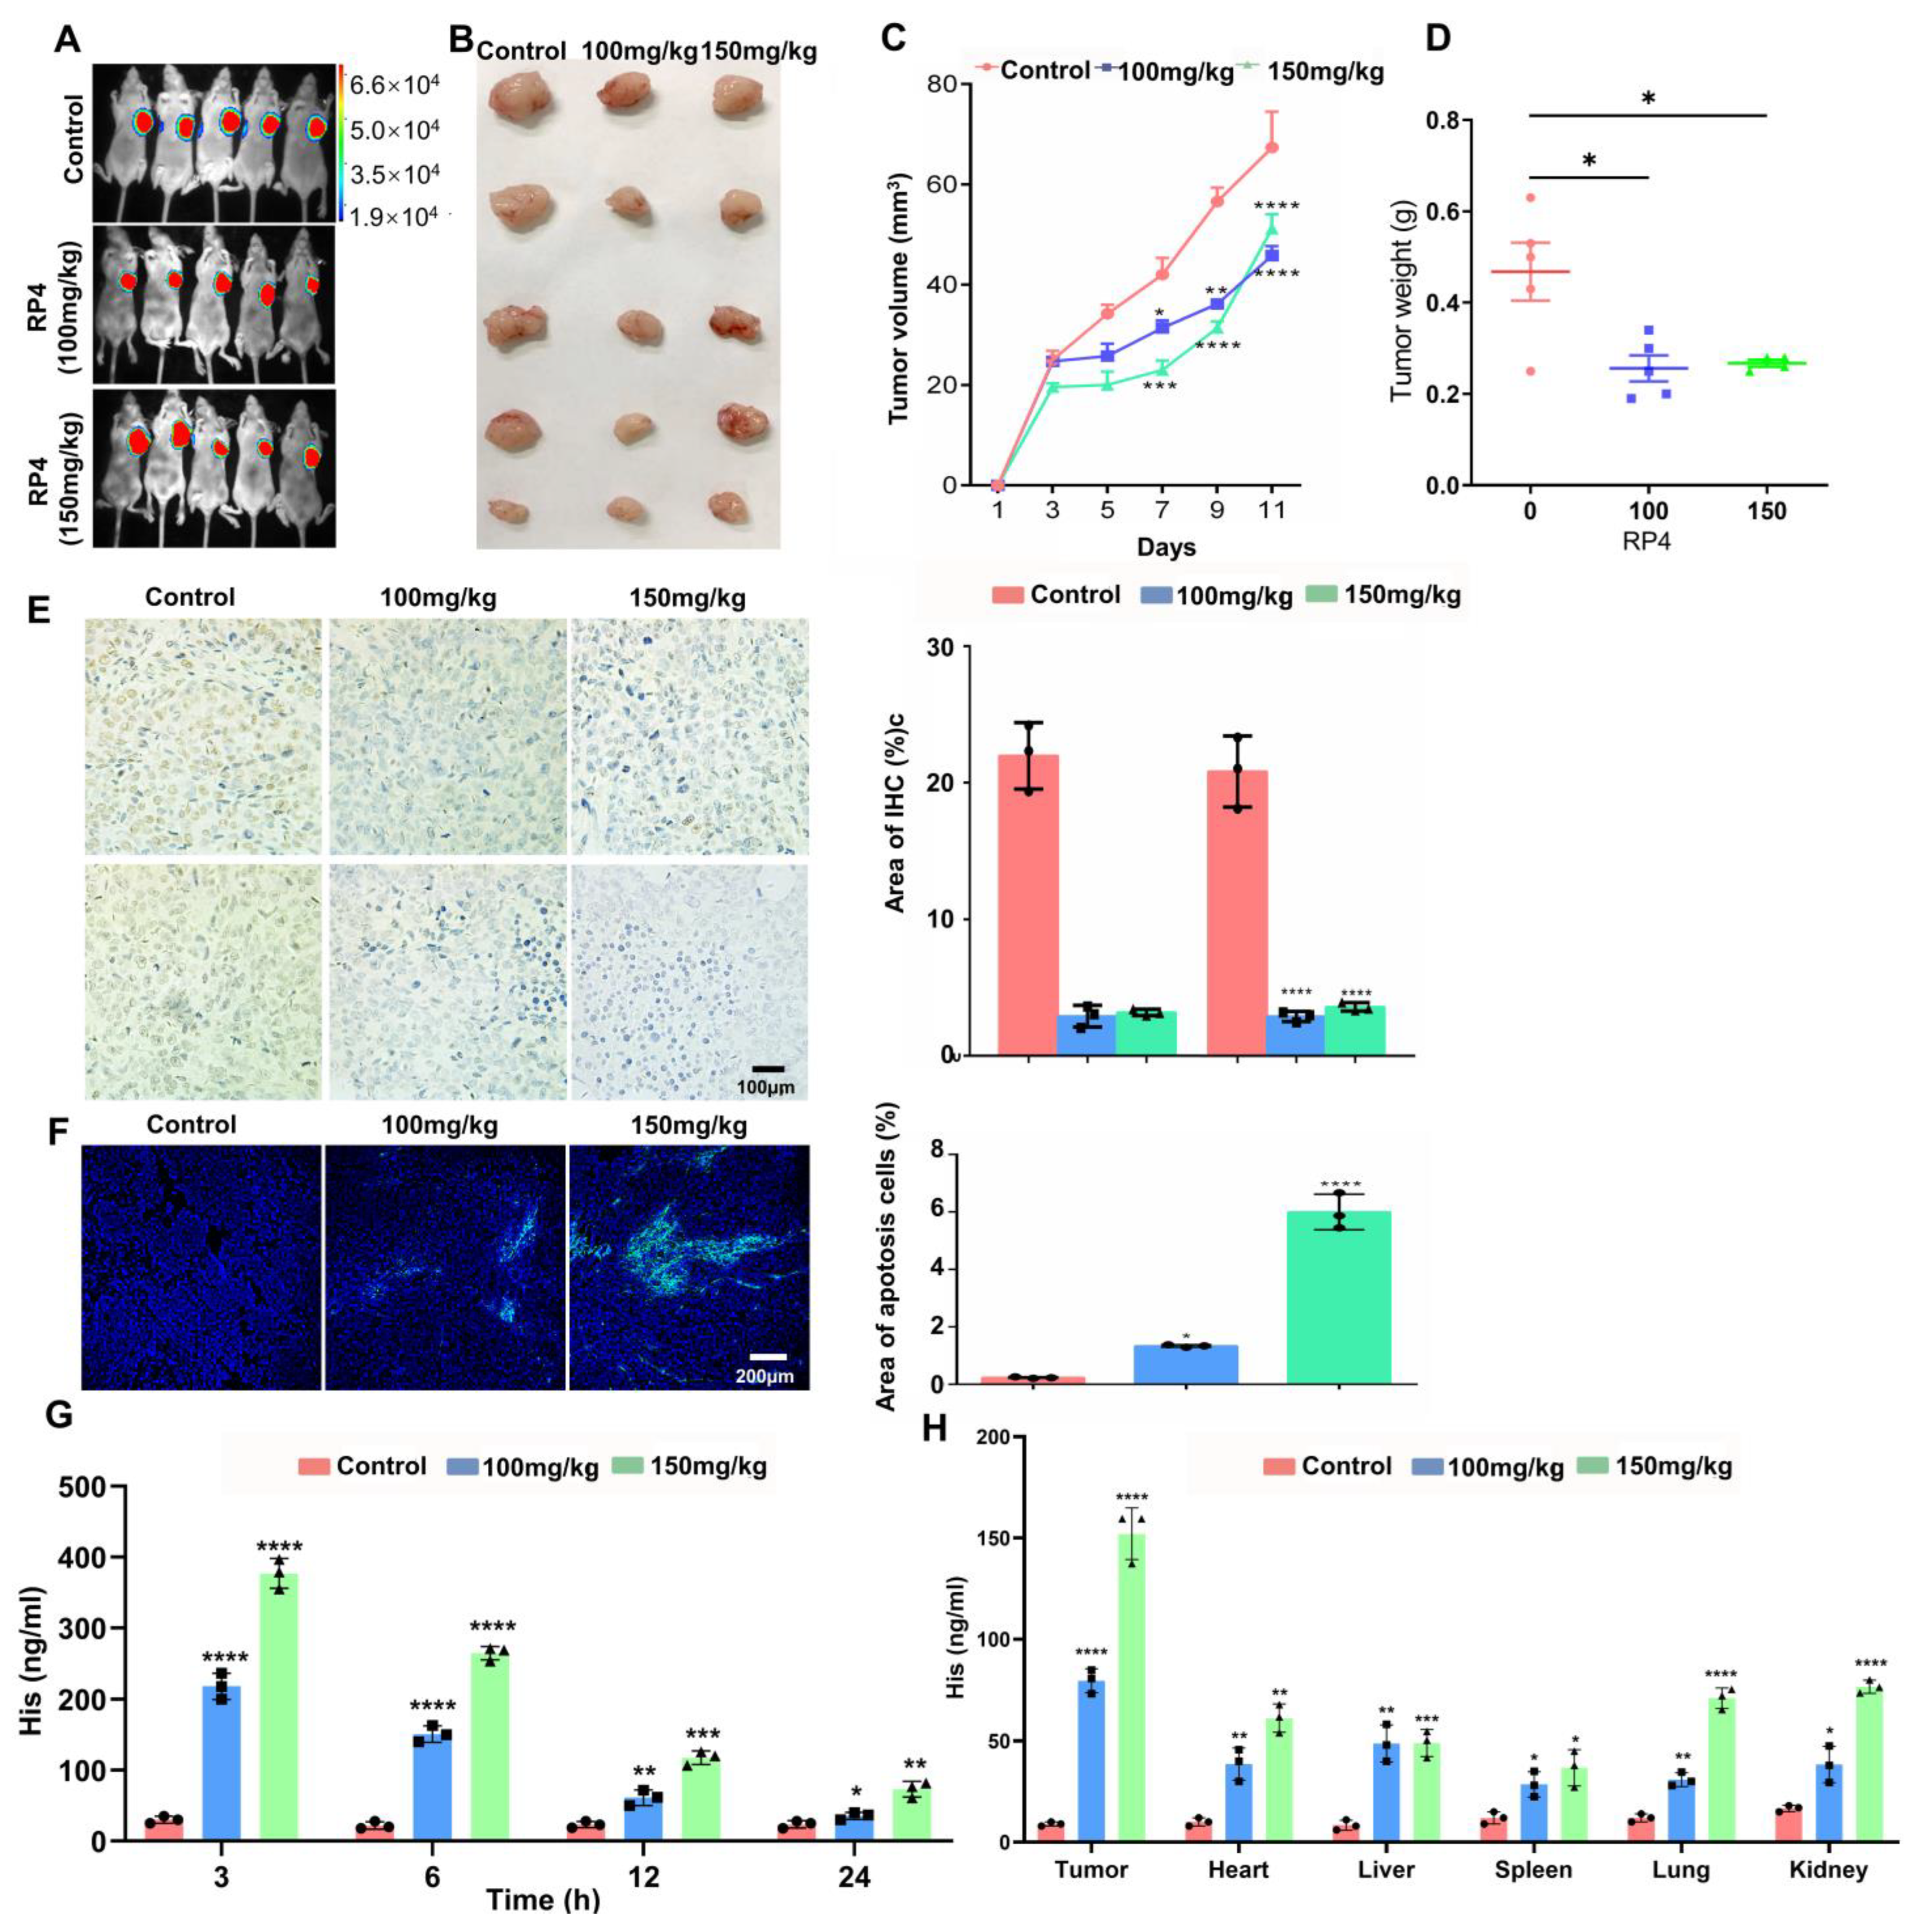
3.5. RP4 Suppress CRC Xenografts Growth In Vivo
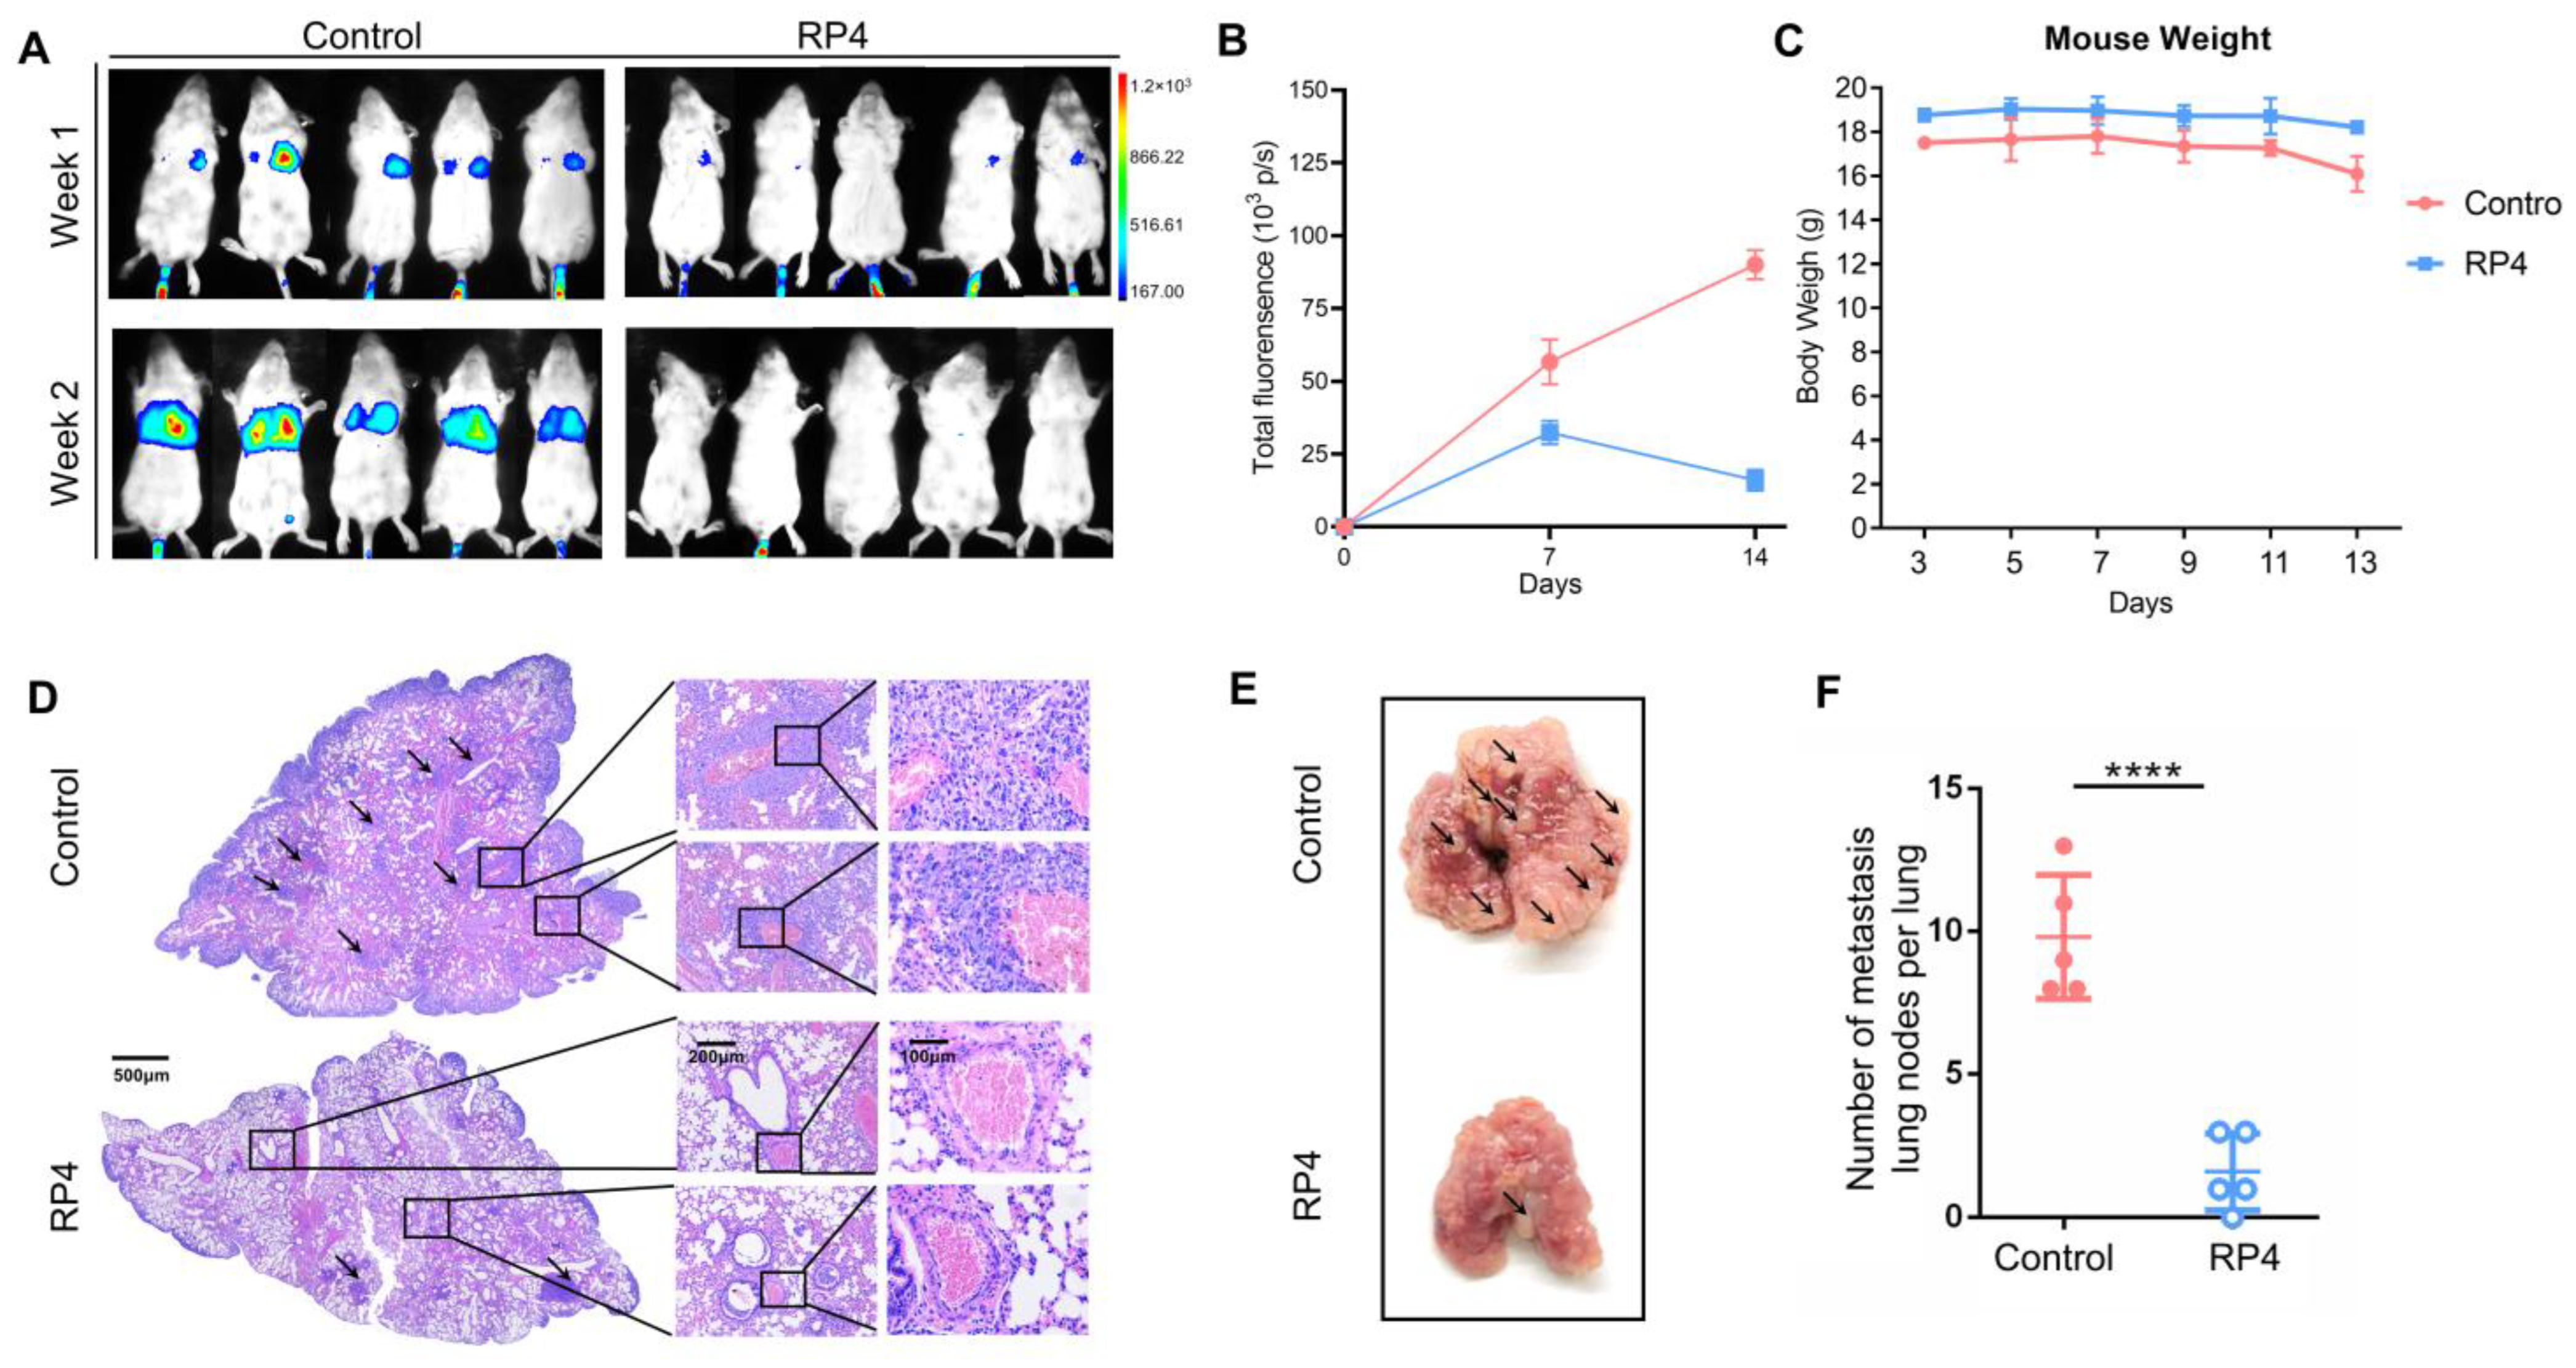
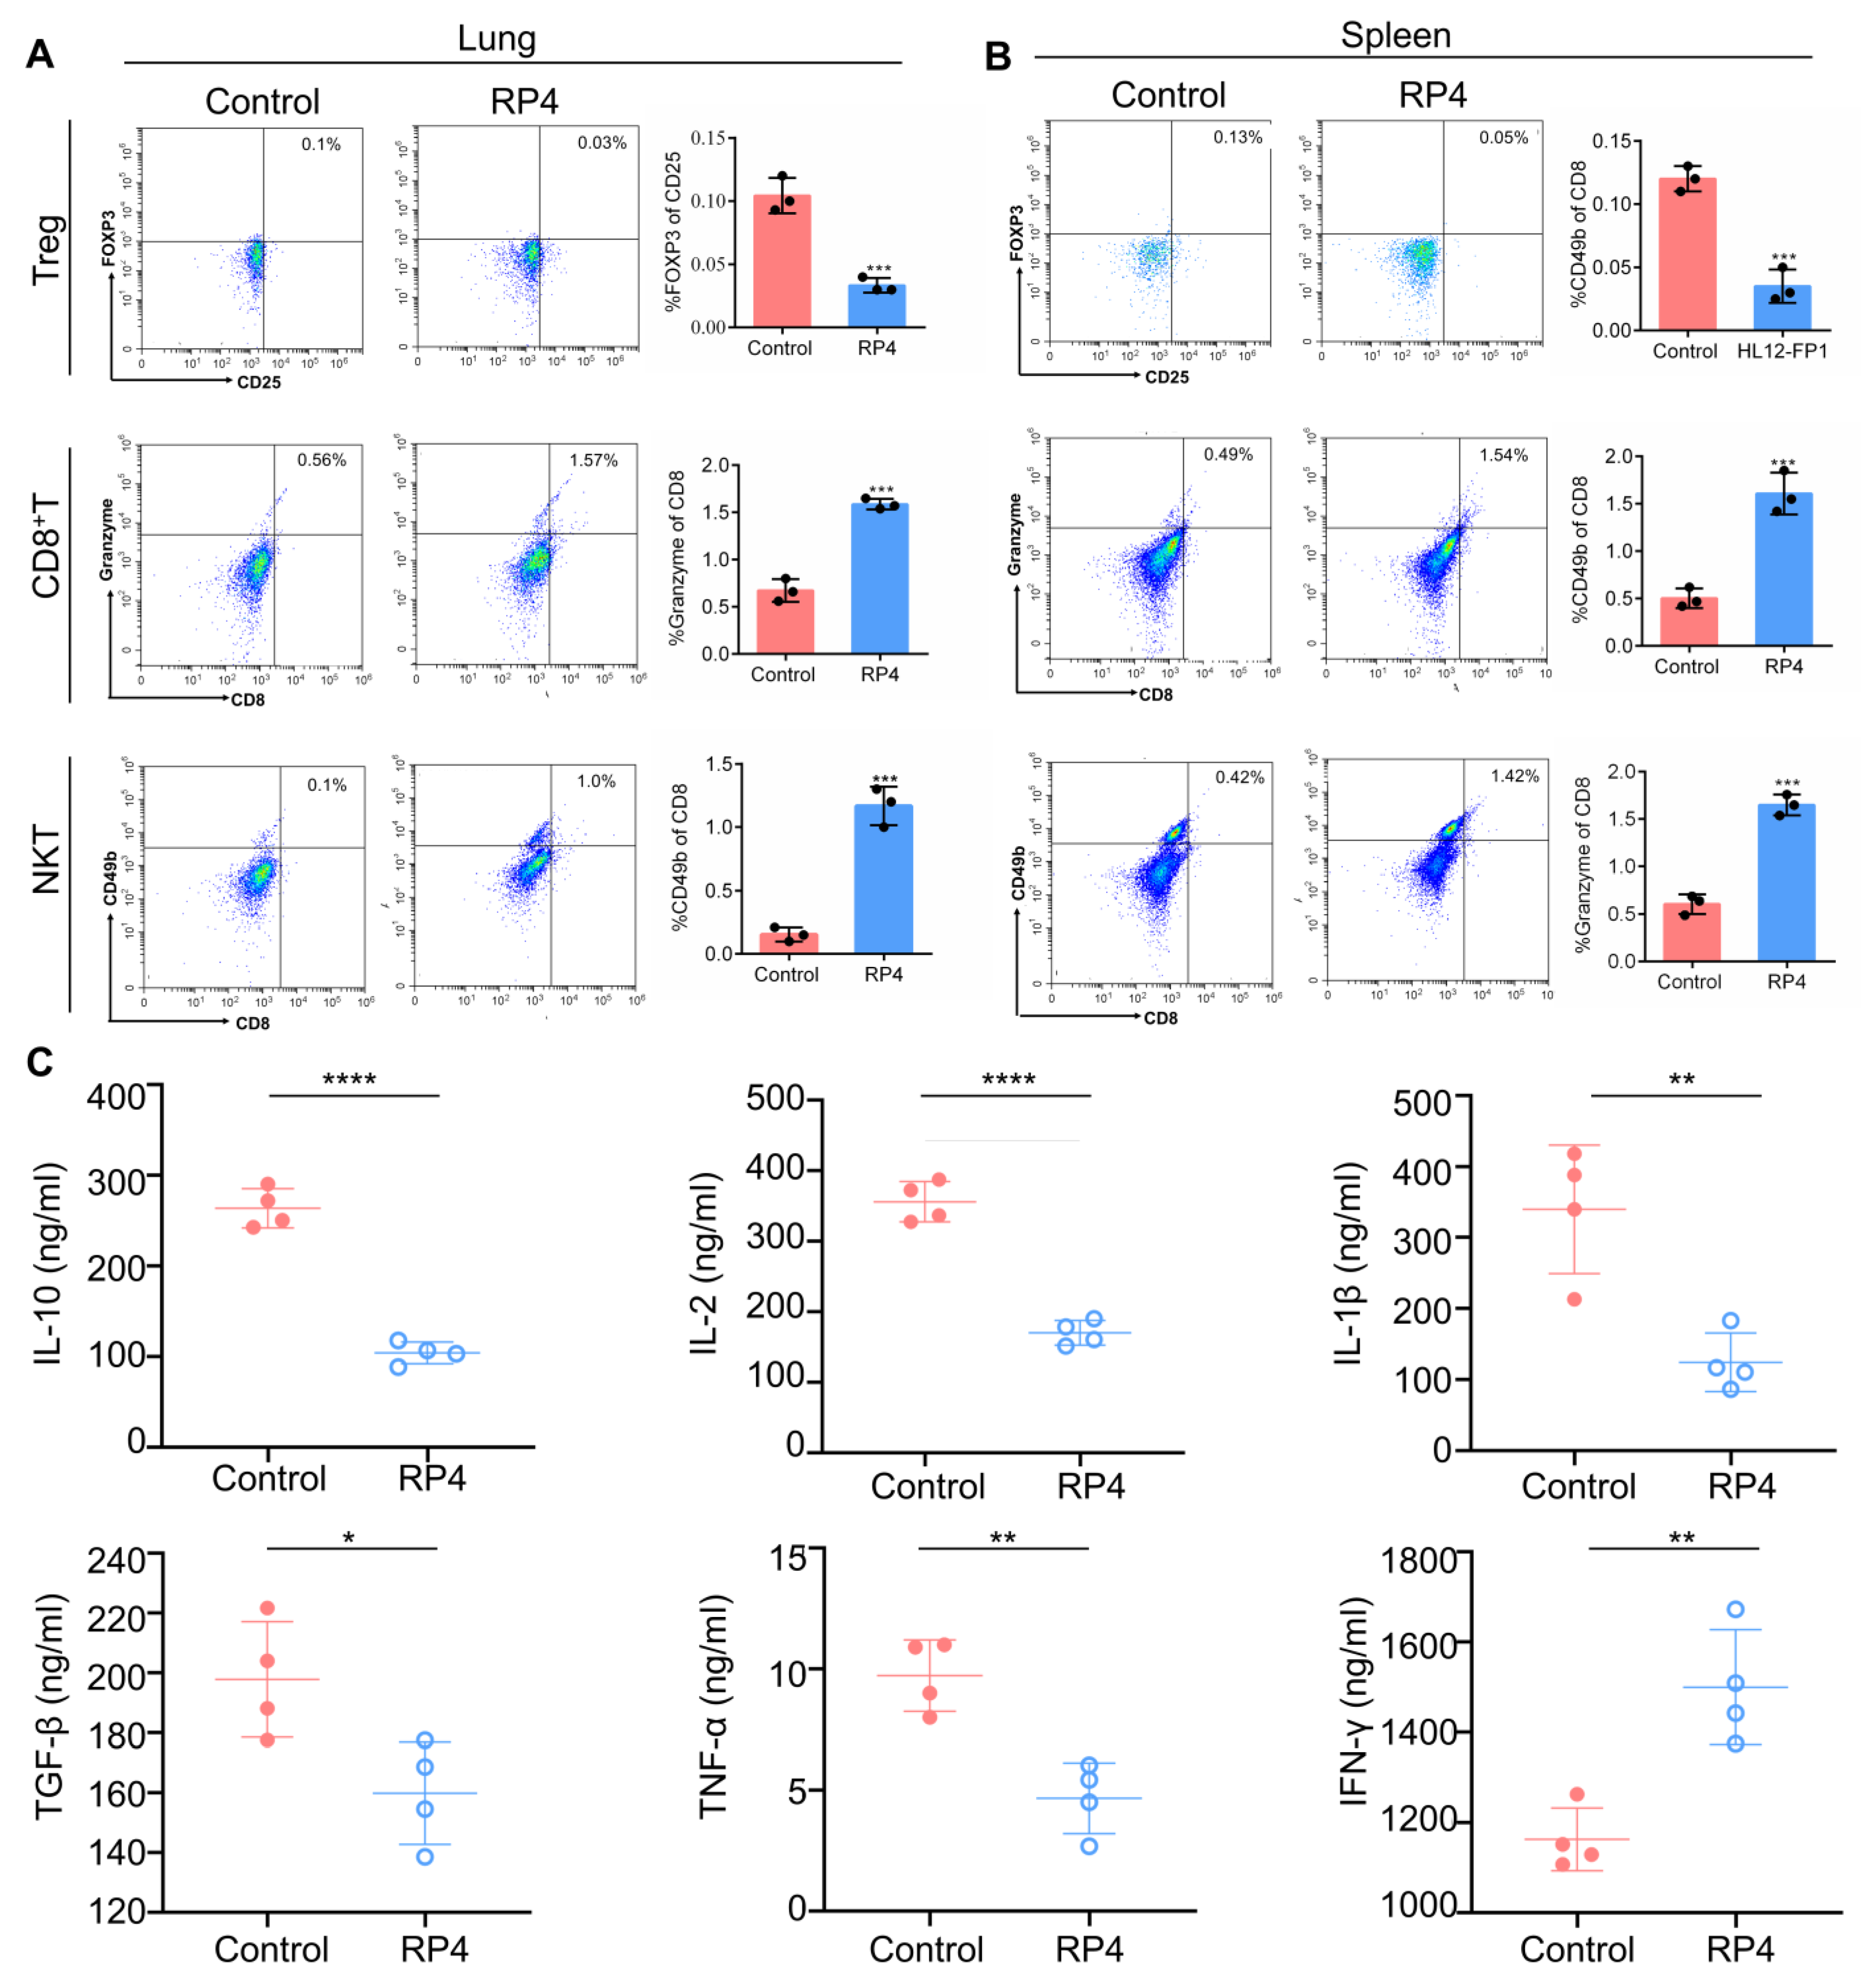
3.6. RP4 Inhibits CRC Lung Metastasis In Vivo by Reprogramming Immune Cell Activities
4. Discussion
Supplementary Materials
Author Contributions
Funding
Institutional Review Board Statement
Informed Consent Statement
Data Availability Statement
Acknowledgments
Conflicts of Interest
References
- Siegel, R.L.; Miller, K.D.; Sauer, A.G.; Fedewa, S.A.; Butterly, L.F.; Anderson, J.C.; Cercek, A.; Smith, R.A.; Jemal, A. Colorectal cancer statistics, 2020. CA Cancer J. Clin. 2020, 70, 145–164. [Google Scholar] [CrossRef] [PubMed] [Green Version]
- Sung, H.; Ferlay, J.; Siegel, R.L.; Laversanne, M.; Soerjomataram, I.; Jemal, A.; Bray, F. Global Cancer Statistics 2020: GLOBOCAN Estimates of Incidence and Mortality Worldwide for 36 Cancers in 185 Countries. CA Cancer J. Clin. 2021, 71, 209–249. [Google Scholar] [CrossRef] [PubMed]
- Dekker, E.; Tanis, P.; Vleugels, J.; Kasi, P.; Wallace, M. Colorectal cancer. Lancet 2019, 394, 1467–1480. [Google Scholar] [CrossRef]
- Baghban, R.; Roshangar, L.; Jahanban-Esfahlan, R.; Seidi, K.; Ebrahimi-Kalan, A.; Jaymand, M.; Kolahian, S.; Javaheri, T.; Zare, P. Tumor microenvironment complexity and therapeutic implications at a glance. Cell Commun. Signal. 2020, 18, 59. [Google Scholar] [CrossRef] [Green Version]
- Wang, M.; Zhao, J.; Zhang, L.; Wei, F.; Lian, Y.; Wu, Y.; Gong, Z.; Zhang, S.; Zhou, J.; Cao, K.; et al. Role of tumor microenvironment in tumorigenesis. J. Cancer 2017, 8, 761–773. [Google Scholar] [CrossRef] [PubMed] [Green Version]
- Stankovic, B.; Bjørhovde, H.A.K.; Skarshaug, R.; Aamodt, H.; Frafjord, A.; Müller, E.; Hammarström, C.; Beraki, K.; Bækkevold, E.S.; Woldbæk, P.R.; et al. Immune cell composition in human non-small cell lung cancer. Front. Immunol. 2019, 9, 3101. [Google Scholar] [CrossRef] [PubMed] [Green Version]
- Tanoue, T.; Morita, S.; Plichta, D.R.; Skelly, A.N.; Suda, W.; Sugiura, Y.; Narushima, S.; Vlamakis, H.; Motoo, I.; Sugita, K.; et al. A defined commensal consortium elicits CD8 T cells and anti-cancer immunity. Nature 2019, 565, 600–605. [Google Scholar] [CrossRef]
- Beatty, G.L.; Paterson, Y. IFN-γ-dependent inhibition of tumor angiogenesis by tumor-infiltrating CD4+ T cells requires tumor responsiveness to IFN-γ. J. Immunol. 2001, 166, 2276–2282. [Google Scholar] [CrossRef] [Green Version]
- Ohue, Y.; Nishikawa, H. Regulatory T (Treg) cells in cancer: Can Treg cells be a new therapeutic target? Cancer Sci. 2019, 110, 2080–2089. [Google Scholar] [CrossRef] [Green Version]
- Knochelmann, H.M.; Dwyer, C.; Bailey, S.; Amaya, S.M.; Elston, D.M.; Mazza-McCrann, J.M.; Paulos, C.M. When worlds collide: Th17 and Treg cells in cancer and autoimmunity. Cell. Mol. Immunol. 2018, 15, 458–469. [Google Scholar] [CrossRef] [Green Version]
- Togashi, Y.; Shitara, K.; Nishikawa, H. Regulatory T cells in cancer immunosuppression—Implications for anticancer therapy. Nat. Rev. Clin. Oncol. 2019, 16, 356–371. [Google Scholar] [CrossRef] [PubMed]
- Brabletz, T.; Kalluri, R.; Nieto, M.A.; Weinberg, R.A. EMT in cancer. Nat. Rev. Cancer 2018, 18, 128–134. [Google Scholar] [CrossRef]
- Ahmad, A.; Sarkar, S.H.; Bitar, B.; Ali, S.; Aboukameel, A.; Sethi, S.; Sarkar, F.H. Garcinol Regulates EMT and Wnt Signaling Pathways In Vitro and In Vivo, Leading to Anticancer Activity against Breast Cancer Cells Garcinol Regulates EMT, miRNAs, and Wnt Signaling. Mol. Cancer Ther. 2012, 11, 2193–2201. [Google Scholar] [CrossRef] [PubMed] [Green Version]
- Hultgardh-Nilsson, A.; Boren, J.; Chakravarti, S. The small leucine-rich repeat proteoglycans in tissue repair and atherosclerosis. J. Intern. Med. 2015, 278, 447–461. [Google Scholar] [CrossRef] [Green Version]
- Oldberg, A.; Antonsson, P.; Lindblom, K.; Heinegård, D. A collagen-binding 59-kd protein (fibromodulin) is structurally related to the small interstitial proteoglycans PG-S1 and PG-S2 (decorin). EMBO J. 1989, 8, 2601–2604. [Google Scholar] [CrossRef]
- Svensson, L.; Närlid, I.; Oldberg, Å. Fibromodulin and lumican bind to the same region on collagen type I fibrils. FEBS Lett. 2000, 470, 178–182. [Google Scholar] [CrossRef] [PubMed] [Green Version]
- Chakravarti, S. Functions of lumican and fibromodulin: Lessons from knockout mice. Glycoconj. J. 2002, 19, 287–293. [Google Scholar] [CrossRef]
- Oldberg, A.; Kalamajski, S.; Salnikov, A.V.; Stuhr, L.; Mörgelin, M.; Reed, R.K.; Heldin, N.-E.; Rubin, K. Collagen-binding proteoglycan fibromodulin can determine stroma matrix structure and fluid balance in experimental carcinoma. Proc. Natl. Acad. Sci. USA 2007, 104, 13966–13971. [Google Scholar] [CrossRef] [Green Version]
- Ao, Z.; Yu, S.; Qian, P.; Gao, W.; Guo, R.; Dong, X.; Xu, J.; Zhang, R.; Jiang, C.; Ji, F.; et al. Tumor angiogenesis of SCLC inhibited by decreased expression of FMOD via downregulating angiogenic factors of endothelial cells. Biomed Pharmacother 2017, 87, 539–547. [Google Scholar] [CrossRef]
- Choudhury, A.; Derkow, K.; Daneshmanesh, A.H.; Mikaelsson, E.; Kiaii, S.; Kokhaei, P.; Österborg, A.; Mellstedt, H. Silencing of ROR1 and FMOD with siRNA results in apoptosis of CLL cells. Br. J. Haematol. 2010, 151, 327–335. [Google Scholar] [CrossRef]
- Bettin, A.; Reyes, I.; Reyes, N. Gene expression profiling of prostate cancer-associated genes identifies fibromodulin as potential novel biomarker for prostate cancer. Int. J. Biol. Markers 2016, 31, e153–e162. [Google Scholar] [CrossRef] [PubMed]
- Khan, F.U.; Owusu-Tieku, N.Y.G.; Dai, X.; Liu, K.; Wu, Y.; Tsai, H.-I.; Chen, H.; Sun, C.; Huang, L. Wnt/β-catenin pathway-regulated fibromodulin expression is crucial for breast cancer metastasis and inhibited by aspirin. Front. Pharmacol. 2019, 10, 1308. [Google Scholar] [CrossRef] [Green Version]
- Huang, C.; Dai, X.-Y.; Cai, J.-X.; Chen, J.; Wang, B.B.; Zhu, W.; Wang, E.; Wei, W.; Zhang, J.V. A Screened GPR1 Peptide Exerts Antitumor Effects on Triple-Negative Breast Cancer. Mol. Ther. Oncolytics 2020, 18, 602–612. [Google Scholar] [CrossRef] [PubMed]
- Cai, C.; Dai, X.; Zhu, Y.; Lian, M.; Xiao, F.; Dong, F.; Zhang, Q.; Huang, Y.; Zheng, Q. A specific RAGE-binding peptide biopanning from phage display random peptide library that ameliorates symptoms in amyloid β peptide-mediated neuronal disorder. Appl. Microbiol. Biotechnol. 2016, 100, 825–835. [Google Scholar] [CrossRef] [PubMed]
- Wang, K.; Dai, X.; Yu, A.; Feng, C.; Liu, K.; Huang, L. Peptide-based PROTAC degrader of FOXM1 suppresses cancer and decreases GLUT1 and PD-L1 expression. J. Exp. Clin. Cancer Res. 2022, 41, 289. [Google Scholar] [CrossRef]
- Zhang, X.-F.; Long, Z.-D.; Liu, X.-M.; Ma, F.; Li, Q.; Lv, Y. Na+ Micro-Current Value Detection as a New Modality for Identification of Benign and Malignant Disease in Surgery. Sci. Rep. 2016, 6, 24937. [Google Scholar] [CrossRef] [Green Version]
- Ino, Y.; Yamazaki-Itoh, R.; Shimada, K.; Iwasaki, M.; Kosuge, T.; Kanai, Y.; Hiraoka, N. Immune cell infiltration as an indicator of the immune microenvironment of pancreatic cancer. Br. J. Cancer 2013, 108, 914–923. [Google Scholar] [CrossRef]
- Saraiva, M.; O’Garra, A. The regulation of IL-10 production by immune cells. Nat. Rev. Immunol. 2010, 10, 170–181. [Google Scholar] [CrossRef] [Green Version]
- Salinas, N.; Olguin, J.E.; Castellanos, C.; Saavedra, R. T cell Suppression In Vitro During T oxoplasma gondii Infection is the Result of IL-2 Competition between Tregs and T cells Leading to Death of Proliferating T cells. Exp. Immunol. 2014, 79, 1–11. [Google Scholar]
- Betts, G.; Jones, E.; Junaid, S.; El-Shanawany, T.; Scurr, M.; Mizen, P.; Kumar, M.; Jones, S.; Rees, B.; Williams, G.; et al. Suppression of tumour-specific CD4(+) T cells by regulatory T cells is associated with progression of human colorectal cancer. Gut 2012, 61, 1163–1171. [Google Scholar] [CrossRef] [Green Version]
- Olkhanud, P.B.; Baatar, D.; Bodogai, M.; Hakim, F.; Gress, R.; Anderson, R.L.; Deng, J.; Xu, M.; Briest, S.; Biragyn, A. Breast cancer lung metastasis requires expression of chemokine receptor CCR4 and regulatory T cells. Cancer Res. 2009, 69, 5996–6004. [Google Scholar] [CrossRef] [PubMed] [Green Version]
- Farhood, B.; Najafi, M.; Mortezaee, K. CD8(+) cytotoxic T lymphocytes in cancer immunotherapy: A review. J. Cell Physiol. 2019, 234, 8509–8521. [Google Scholar] [CrossRef]
- Colombo, M.P.; Piconese, S. Regulatory T-cell inhibition versus depletion: The right choice in cancer immunotherapy. Nat. Rev. Cancer 2007, 7, 880–887. [Google Scholar] [CrossRef] [PubMed]
- Krijgsman, D.; de Vries, N.L.; Skovbo, A.; Andersen, M.N.; Swets, M.; Bastiaannet, E.; Vahrmeijer, A.L.; van de Velde, C.J.H.; Heemskerk, M.H.M.; Hokland, M.; et al. Characterization of circulating T-, NK-, and NKT cell subsets in patients with colorectal cancer: The peripheral blood immune cell profile. Cancer Immunol. Immunother. 2019, 68, 1011–1024. [Google Scholar] [CrossRef] [PubMed] [Green Version]
- Adini, I.; Ghosh, K.; Adini, A.; Chi, Z.-L.; Yoshimura, T.; Benny, O.; Connor, K.M.; Rogers, M.S.; Bazinet, L.; Birsner, A.E.; et al. Melanocyte-secreted fibromodulin promotes an angiogenic microenvironment. J. Clin. Investig. 2014, 124, 425–436. [Google Scholar] [CrossRef] [Green Version]
- Mondal, B.; Patil, V.; Shwetha, S.D.; Sravani, K.; Hegde, A.S.; Arivazhagan, A.; Santosh, V.; Kanduri, M.; Somasundaram, K. Integrative functional genomic analysis identifies epigenetically regulated fibromodulin as an essential gene for glioma cell migration. Oncogene 2017, 36, 71–83. [Google Scholar] [CrossRef]
- Bazan, J.; Calkosinski, I.; Gamian, A. Phage display—A powerful technique for immunotherapy: 1. Introduction and potential of therapeutic applications. Hum. Vaccin. Immunother. 2012, 8, 1817–1828. [Google Scholar] [CrossRef] [Green Version]
- Liu, X.; Peng, J.; He, J.; Li, Q.; Zhou, J.; Liang, X.; Tang, S. Selection and identification of novel peptides specifically targeting human cervical cancer. Amino Acids 2018, 50, 577–592. [Google Scholar] [CrossRef]
- Otvos, L., Jr.; Wade, J.D. Current challenges in peptide-based drug discovery. Front. Chem. 2014, 2, 62. [Google Scholar] [CrossRef] [Green Version]
- Wu, D.; Gao, Y.; Qi, Y.; Chen, L.; Ma, Y.; Li, Y. Peptide-based cancer therapy: Opportunity and challenge. Cancer Lett. 2014, 351, 13–22. [Google Scholar] [CrossRef]
- Serafino, A.; Moroni, N.; Psaila, R.; Zonfrillo, M.; Andreola, F.; Wannenes, F.; Pierimarchi, P. Anti-proliferative effect of atrial natriuretic peptide on colorectal cancer cells: Evidence for an Akt-mediated cross-talk between NHE-1 activity and Wnt/beta-catenin signaling. Biochim. Biophys. Acta 2012, 1822, 1004–1018. [Google Scholar] [CrossRef] [PubMed]
- An, P.; Lei, H.; Zhang, J.; Song, S.; He, L.; Jin, G.; Liu, X.; Wu, J.; Meng, L.; Liu, M.; et al. Suppression of tumor growth and metastasis by a VEGFR-1 antagonizing peptide identified from a phage display library. Int. J. Cancer 2004, 111, 165–173. [Google Scholar] [CrossRef] [PubMed]
- Wang, C.; Zhao, M.; Liu, Y.-R.; Luan, X.; Guan, Y.-Y.; Lu, Q.; Yu, D.-H.; Bai, F.; Chen, H.-Z.; Fang, C. Suppression of colorectal cancer subcutaneous xenograft and experimental lung metastasis using nanoparticle-mediated drug delivery to tumor neovasculature. Biomaterials 2014, 35, 1215–1226. [Google Scholar] [CrossRef] [PubMed]
- Carneiro, B.A.; El-Deiry, W.S. Targeting apoptosis in cancer therapy. Nat. Rev. Clin. Oncol. 2020, 17, 395–417. [Google Scholar] [CrossRef] [PubMed]
- Ebert, G.; Lopaticki, S.; O’Neill, M.T.; Steel, R.; Doerflinger, M.; Rajasekaran, P.; Yang, A.S.; Erickson, S.; Ioannidis, L.; Arandjelovic, P.; et al. Targeting the extrinsic pathway of hepatocyte apoptosis promotes clearance of plasmodium liver infection. Cell Rep. 2020, 30, 4343–4354.e4. [Google Scholar] [CrossRef]
- Bock, F.J.; Tait, S.W.G. Mitochondria as multifaceted regulators of cell death. Nat. Rev. Mol. Cell Biol. 2020, 21, 85–100. [Google Scholar] [CrossRef]
- Kalluri, R.; Neilson, E.G. Epithelial-mesenchymal transition and its implications for fibrosis. JCI 2003, 112, 1776–1784. [Google Scholar] [CrossRef]
- Riaz, S.K.; Ke, Y.; Wang, F.; Kayani, M.A.; Malik, M.F.A. Influence of SHH/GLI1 axis on EMT mediated migration and invasion of breast cancer cells. Sci. Rep. 2019, 9, 6620. [Google Scholar] [CrossRef] [Green Version]
- Sun, J.; Yang, X.; Zhang, R.; Liu, S.; Gan, X.; Xi, X.; Sun, Y. GOLPH3 induces epithelial-mesenchymal transition via Wnt/beta-catenin signaling pathway in epithelial ovarian cancer. Cancer Med. 2017, 6, 834–844. [Google Scholar] [CrossRef]
- Binnewies, M.; Roberts, E.W.; Kersten, K.; Chan, V.; Fearon, D.F.; Merad, M.; Coussens, L.M.; Gabrilovich, D.I.; Ostrand-Rosenberg, S.; Hedrick, C.C.; et al. Understanding the tumor immune microenvironment (TIME) for effective therapy. Nat. Med. 2018, 24, 541–550. [Google Scholar] [CrossRef]
- Krishna, S.; Lowery, F.J.; Copeland, A.R.; Bahadiroglu, E.; Mukherjee, R.; Jia, L.; Anibal, J.T.; Sachs, A.; Adebola, S.O.; Gurusamy, D.; et al. Stem-like CD8 T cells mediate response of adoptive cell immunotherapy against human cancer. Science 2020, 370, 1328–1334. [Google Scholar] [CrossRef] [PubMed]
- Ayala, M.A.M.; Li, Z.; DuPage, M. Treg programming and therapeutic reprogramming in cancer. Immunology 2019, 157, 198–209. [Google Scholar] [CrossRef] [Green Version]
- Pourhanifeh, M.H.; Mohammadi, R.; Noruzi, S.; Hosseini, S.A.; Fanoudi, S.; Mohamadi, Y.; Hashemzehi, M.; Asemi, Z.; Mirzaei, H.R.; Salarinia, R.; et al. The role of fibromodulin in cancer pathogenesis: Implications for diagnosis and therapy. Cancer Cell Int. 2019, 19, 157. [Google Scholar] [CrossRef] [PubMed] [Green Version]
- Thomas, D.A.; Massagué, J. TGF-β directly targets cytotoxic T cell functions during tumor evasion of immune surveillance. Cancer Cell 2005, 8, 369–380. [Google Scholar] [CrossRef] [PubMed] [Green Version]
- Viel, S.; Marçais, A.; Guimaraes, F.S.-F.; Loftus, R.; Rabilloud, J.; Grau, M.; Degouve, S.; Djebali, S.; Sanlaville, A.; Charrier, E.; et al. TGF-β inhibits the activation and functions of NK cells by repressing the mTOR pathway. Sci. Signal. 2016, 9, ra19. [Google Scholar] [CrossRef] [PubMed]


Disclaimer/Publisher’s Note: The statements, opinions and data contained in all publications are solely those of the individual author(s) and contributor(s) and not of MDPI and/or the editor(s). MDPI and/or the editor(s) disclaim responsibility for any injury to people or property resulting from any ideas, methods, instructions or products referred to in the content. |
© 2023 by the authors. Licensee MDPI, Basel, Switzerland. This article is an open access article distributed under the terms and conditions of the Creative Commons Attribution (CC BY) license (https://creativecommons.org/licenses/by/4.0/).
Share and Cite
Deng, T.; Hou, Y.; Lin, G.; Feng, C.; Liu, K.; Chen, W.; Wei, W.; Huang, L.; Dai, X. A Novel Fibromodulin Antagonist Peptide RP4 Exerts Antitumor Effects on Colorectal Cancer. Pharmaceutics 2023, 15, 944. https://doi.org/10.3390/pharmaceutics15030944
Deng T, Hou Y, Lin G, Feng C, Liu K, Chen W, Wei W, Huang L, Dai X. A Novel Fibromodulin Antagonist Peptide RP4 Exerts Antitumor Effects on Colorectal Cancer. Pharmaceutics. 2023; 15(3):944. https://doi.org/10.3390/pharmaceutics15030944
Chicago/Turabian StyleDeng, Ting, Yibo Hou, Gaoyang Lin, Chunyan Feng, Kewei Liu, Wenke Chen, Wei Wei, Laiqiang Huang, and Xiaoyong Dai. 2023. "A Novel Fibromodulin Antagonist Peptide RP4 Exerts Antitumor Effects on Colorectal Cancer" Pharmaceutics 15, no. 3: 944. https://doi.org/10.3390/pharmaceutics15030944