
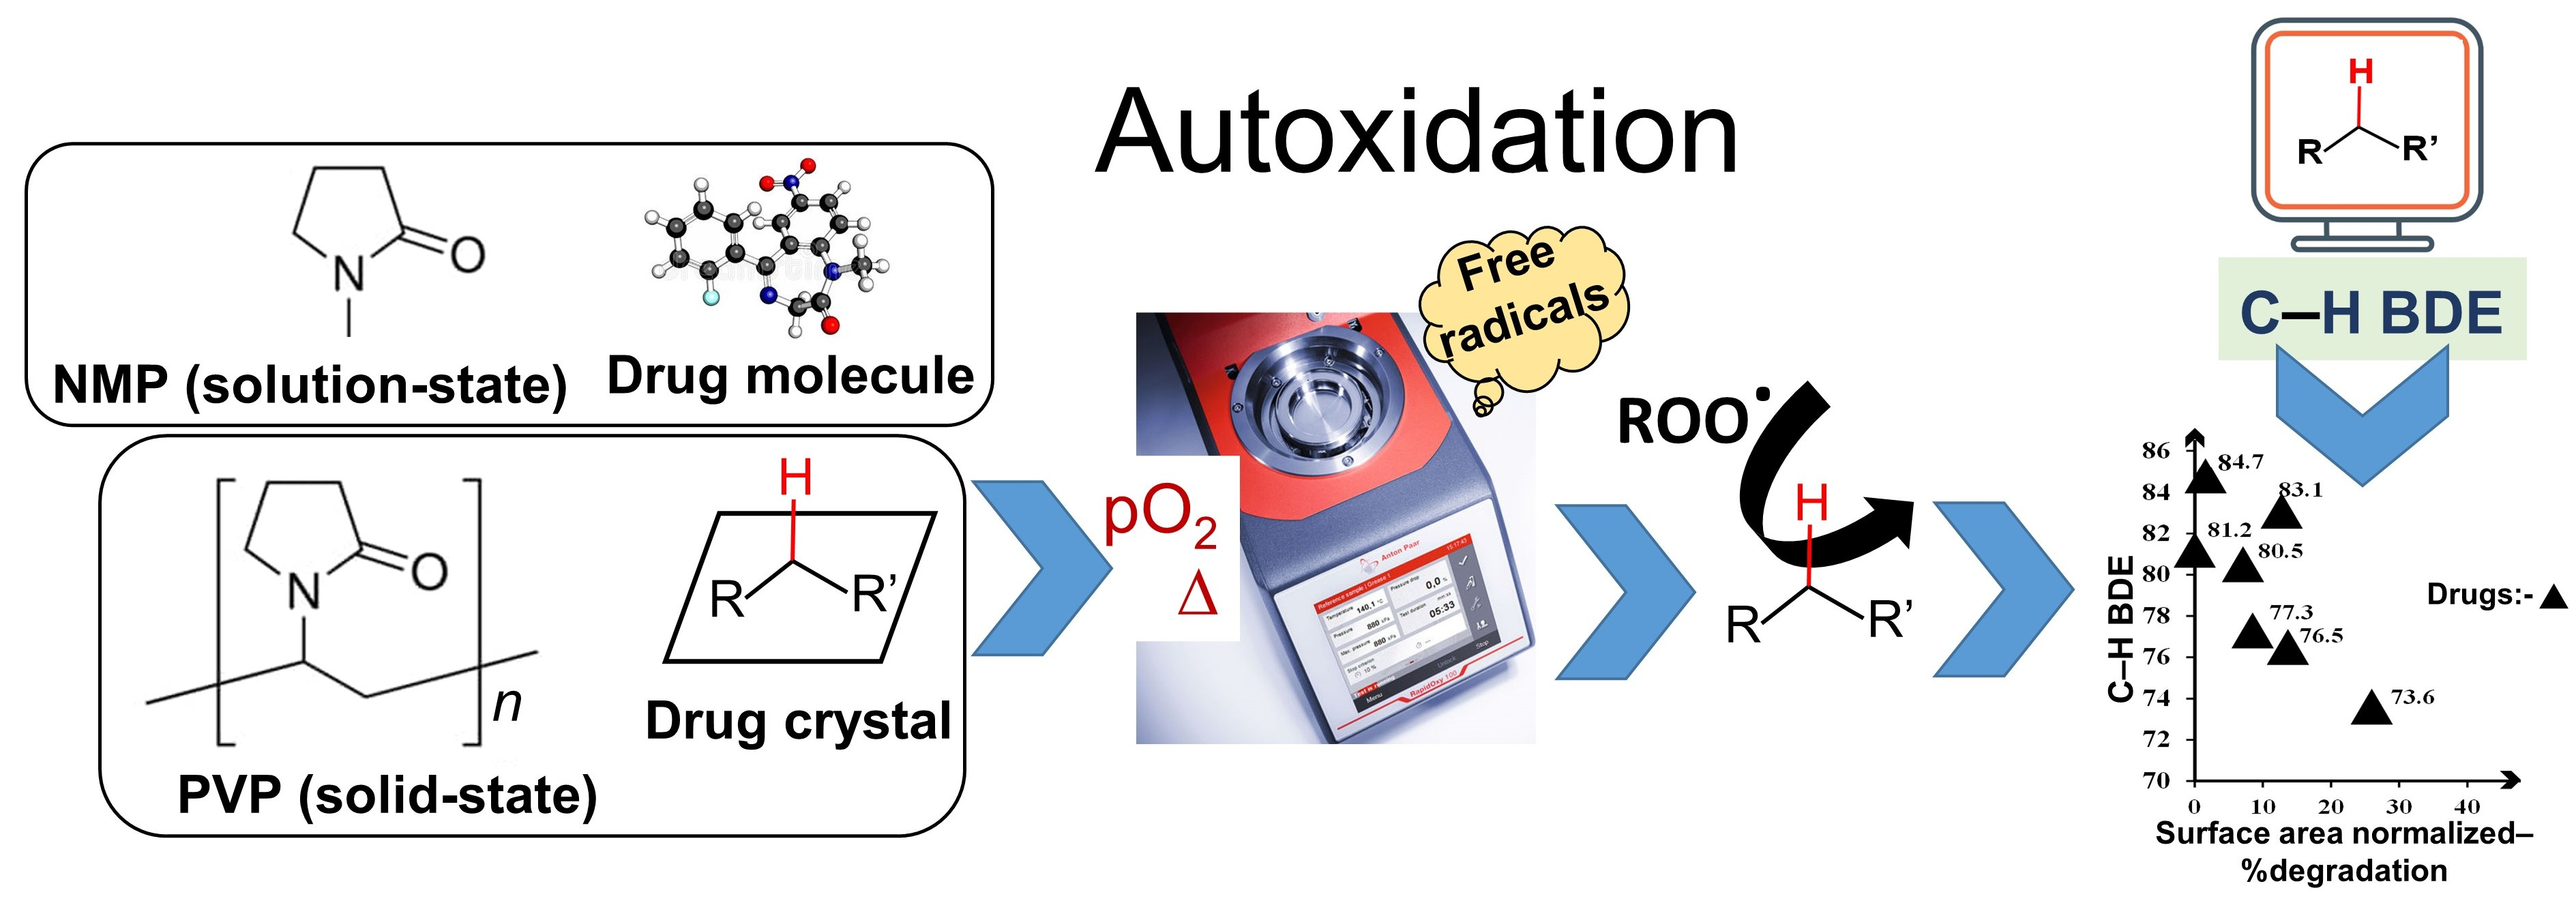
Screening Autoxidation Propensities of Drugs in the Solid-State Using PVP and in the Solution State Using N-Methyl Pyrrolidone

Abstract
:
1. Introduction
2. Materials and Methods
2.1. Materials
2.2. Methods
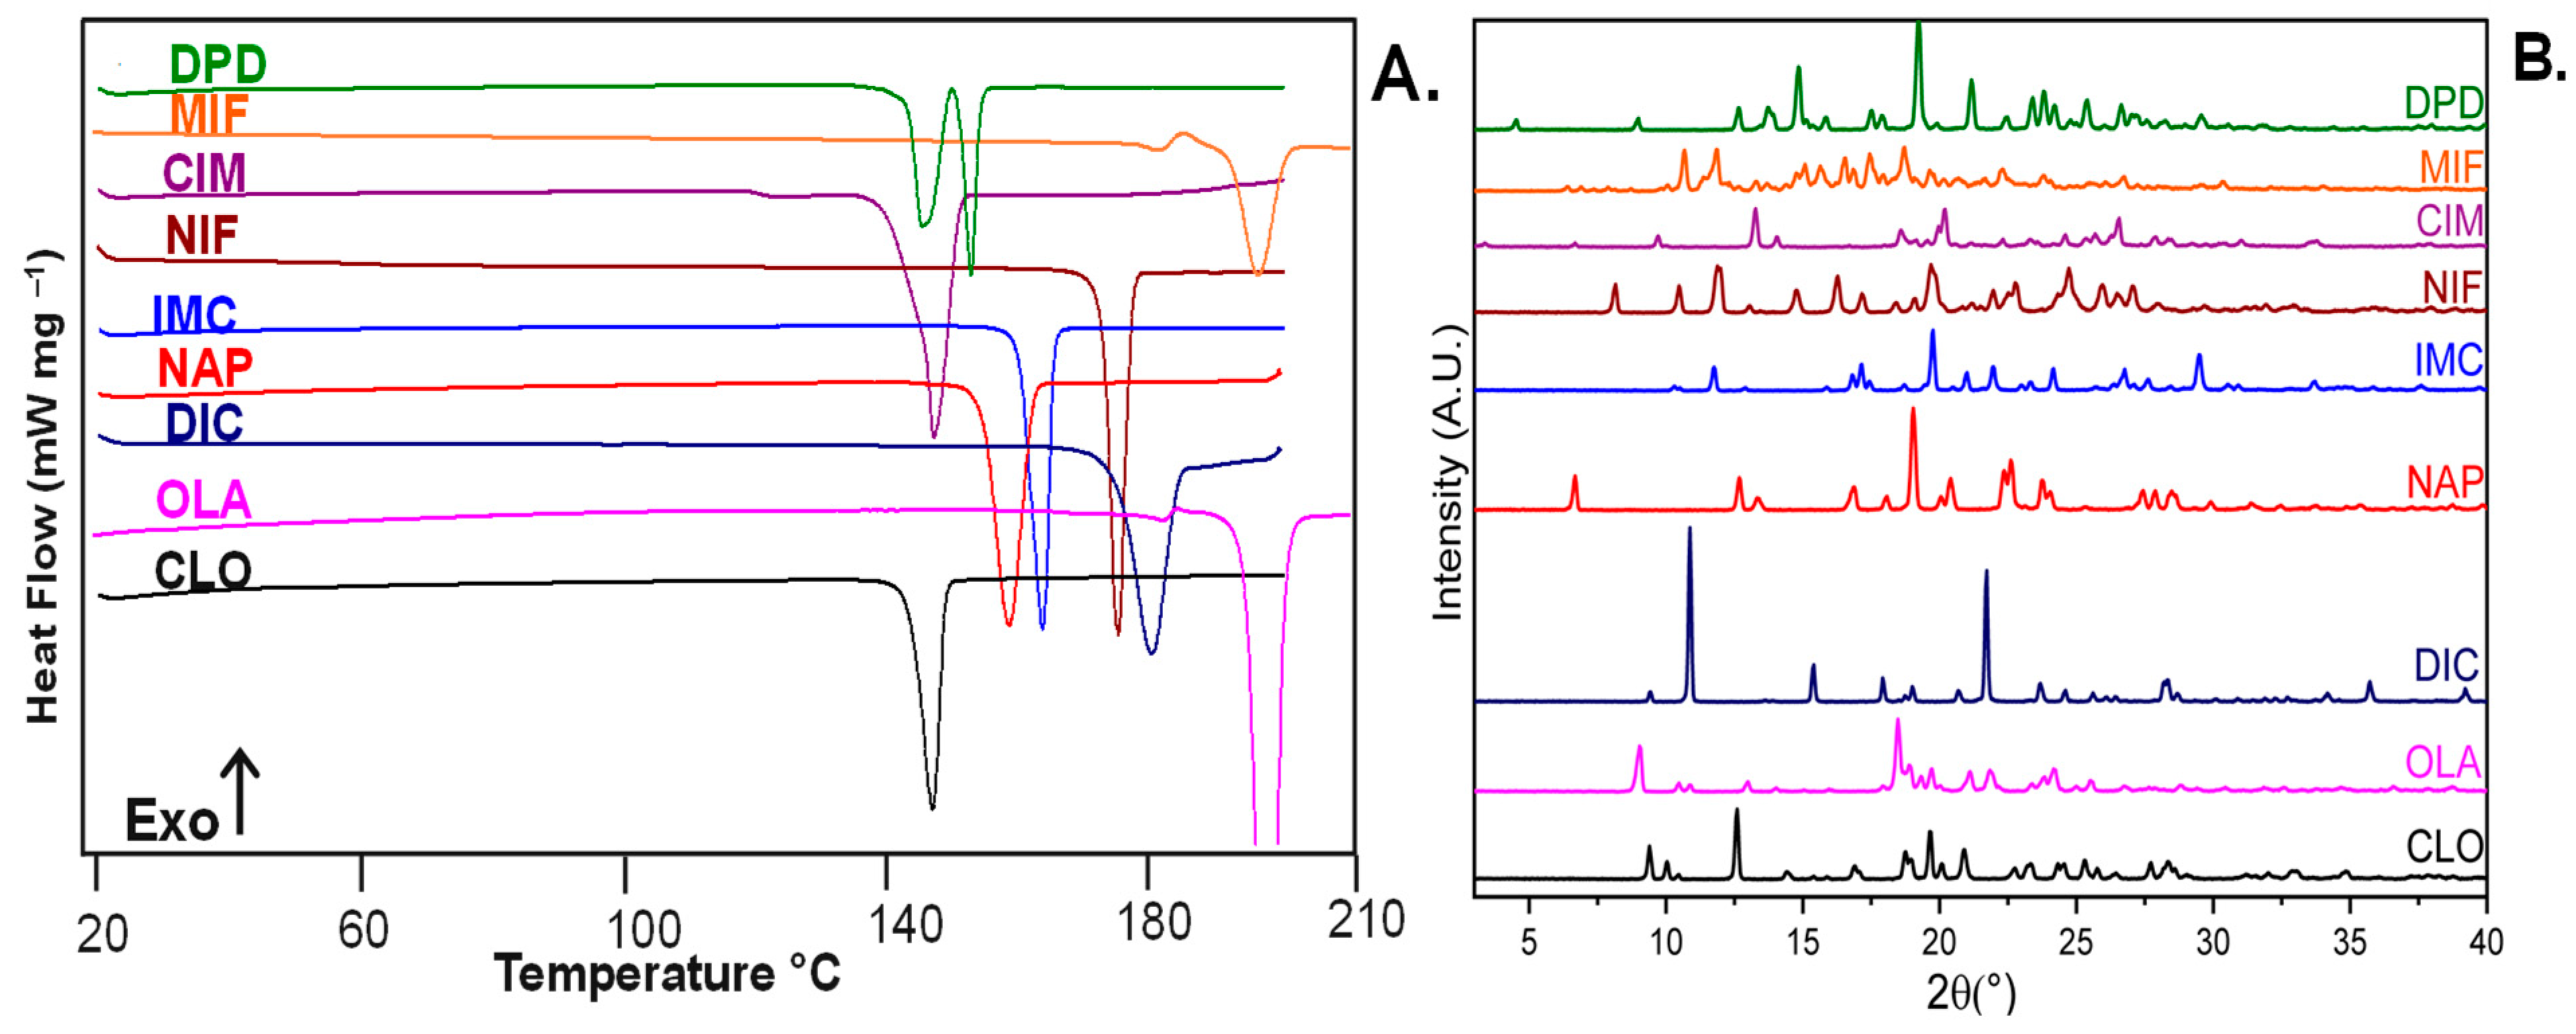
2.2.1. Identification of Drugs by Differential Scanning Calorimetry (DSC)
2.2.2. Identification of Drugs by Powder X-ray Diffraction (pXRD)
2.2.3. Solid State Stress Experiment Using RapidOxy®
2.2.4. Particle Size Distribution and Volume-Specific Surface Area
2.2.5. Kinetic Study Using NMP as the Reaction Medium in RapidOxy®
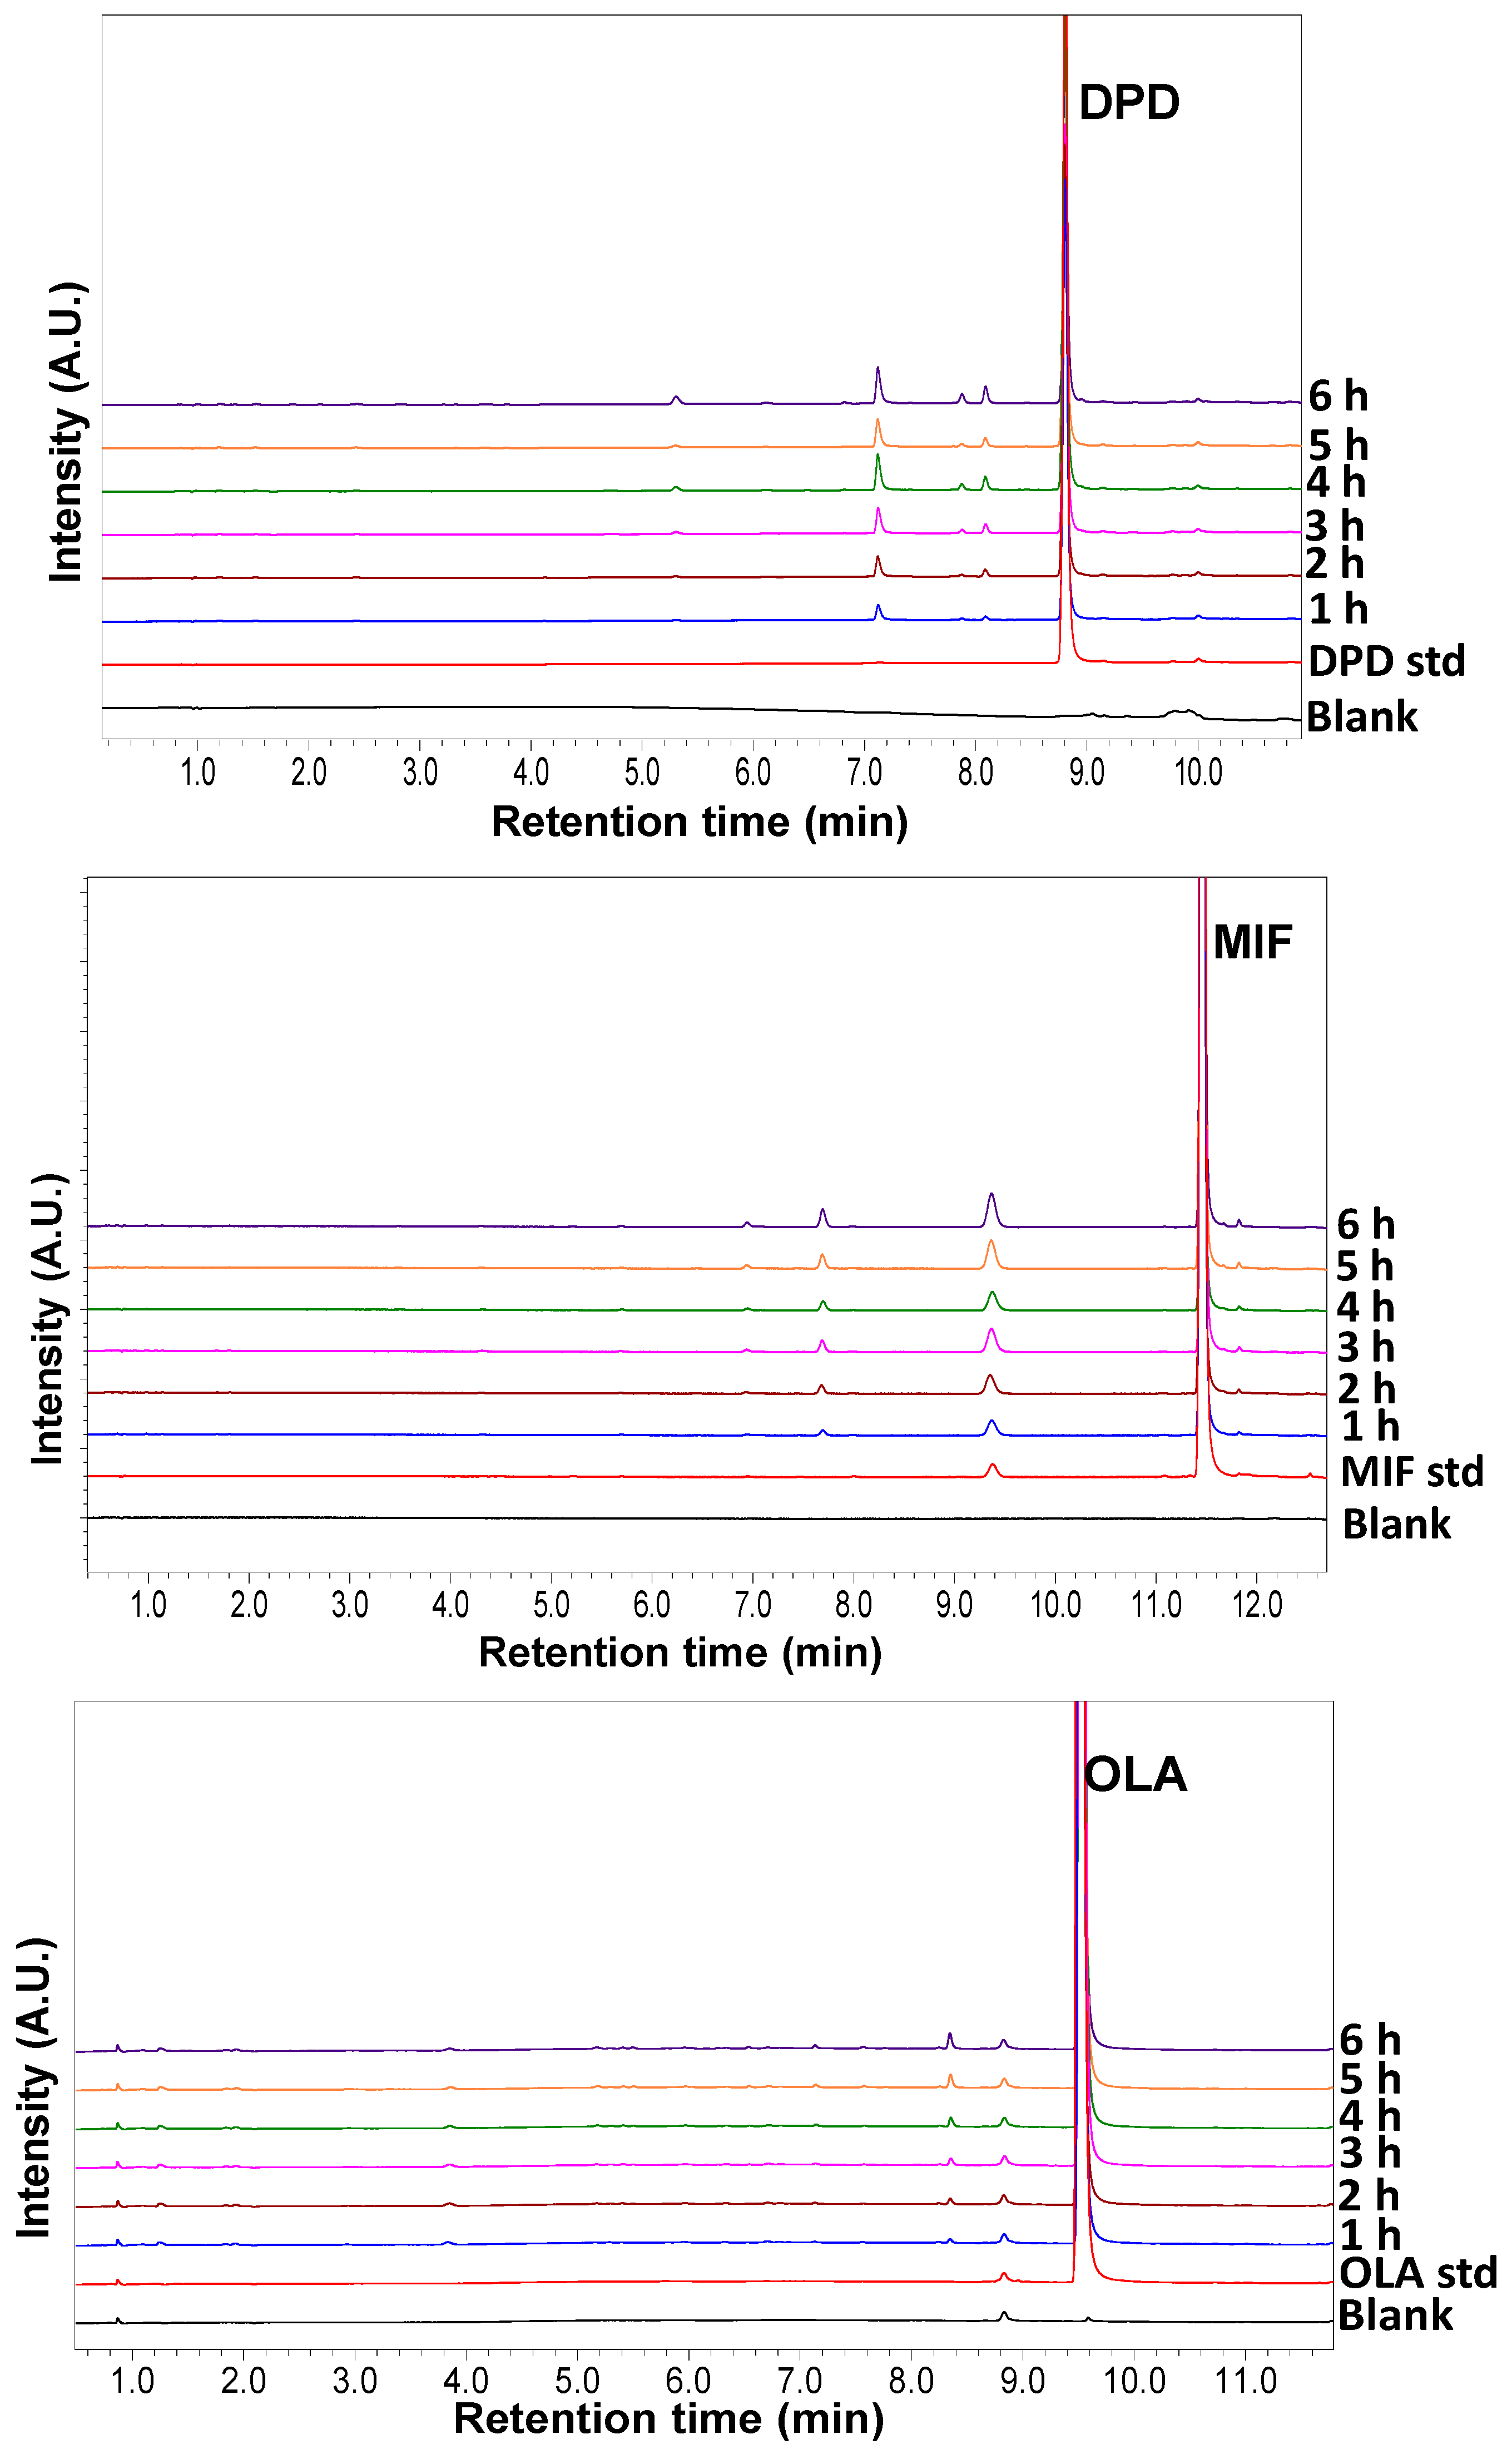
2.2.6. Ultra-Performance Liquid Chromatography (UPLC)
2.2.7. Liquid Chromatography-Mass Spectrometry (LC-MS)
3. Results
3.1. Identification of Selected Compounds by DSC and pXRD
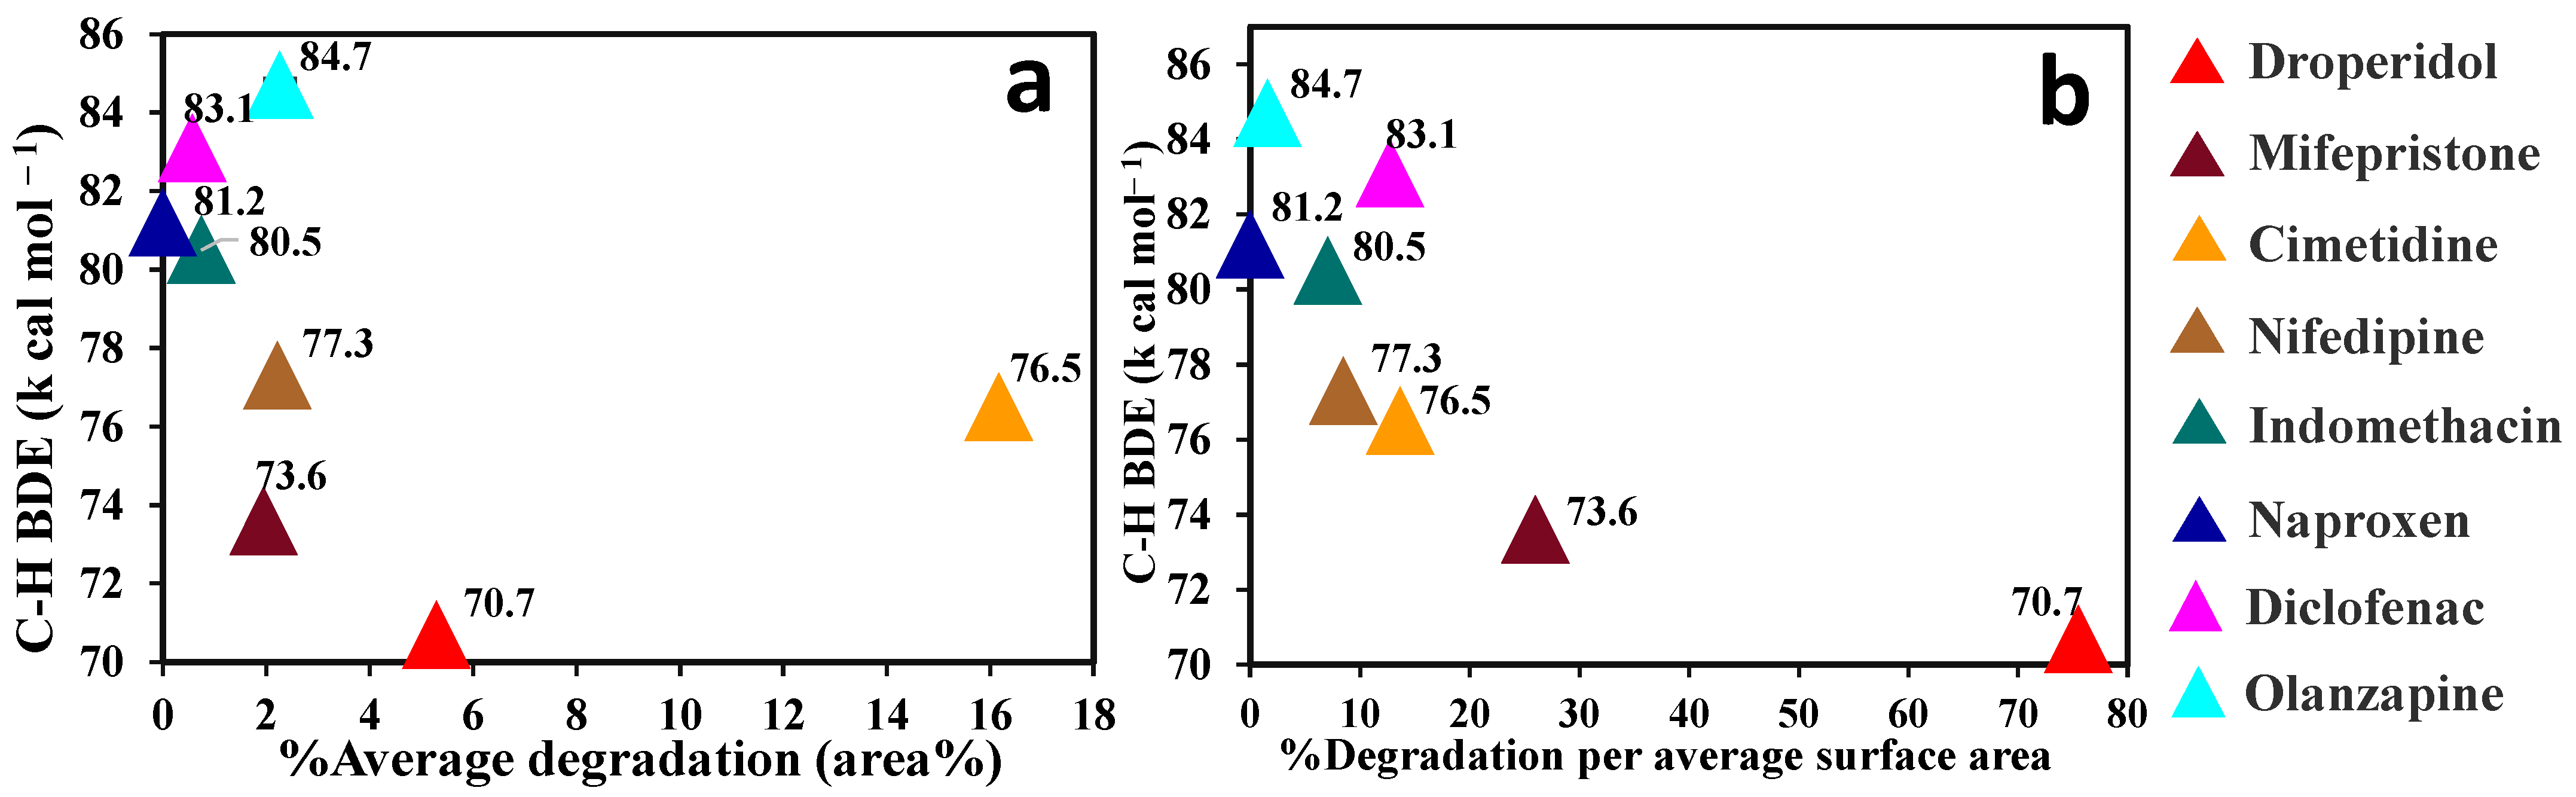
3.2. Solid State Degradation Using RapidOxy®
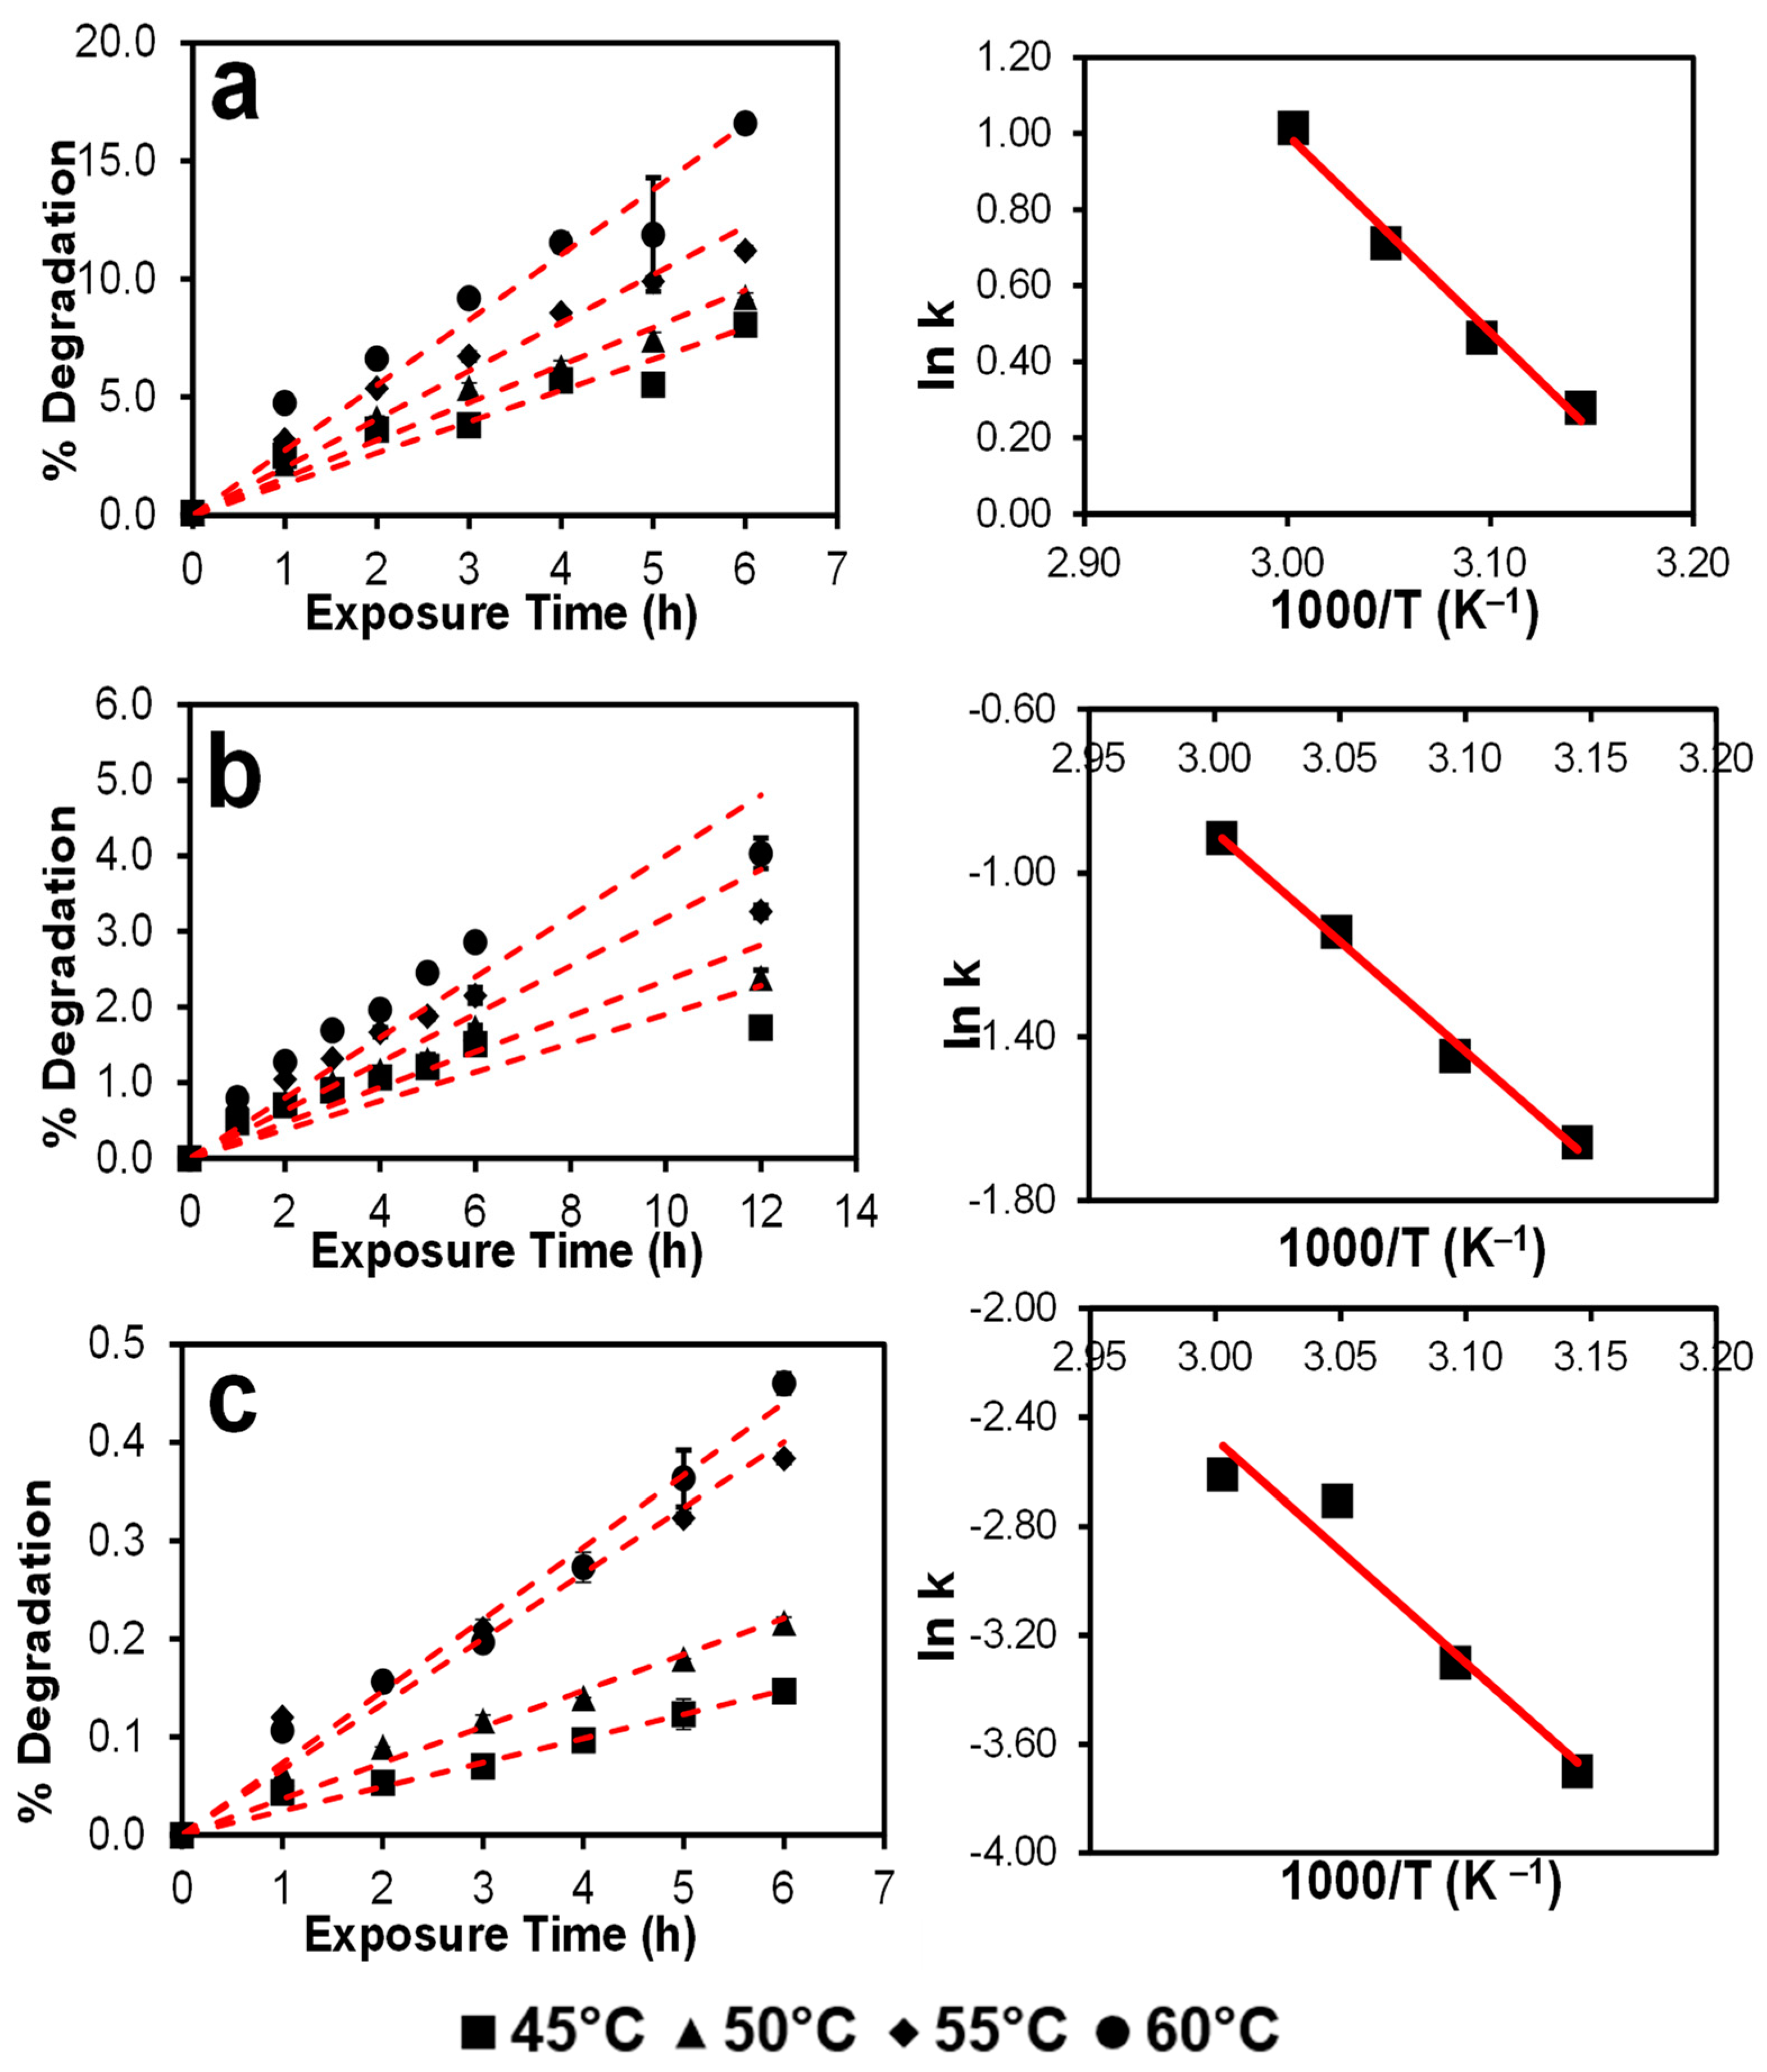
3.3. Autoxidation Kinetics of Selected Drugs in NMP
4. Discussion
5. Conclusions
Supplementary Materials
Author Contributions
Funding
Data Availability Statement
Acknowledgments
Conflicts of Interest
References
- Methods for Stability Testing of Pharmaceuticals; Bajaj, S.; Singh, S. (Eds.) Methods in Pharmacology and Toxicology; Springer: New York, NY, USA, 2018; ISBN 978-1-4939-7685-0. [Google Scholar]
- Freed, A.L.; Colgan, S.T.; Kochling, J.D.; Alasandro, M.S. AAPS Workshop: Accelerating pharmaceutical development through predictive stability approaches, 4–5 April 2016. AAPS Open 2017, 3, 1–10. [Google Scholar] [CrossRef]
- McMahon, M.; Williams, H.; Debie, E.; Fu, M.; Bujalski, R.; Qiu, F.; Wu, Y.; Li, H.; Wang, J.; Hoaglund-Hyzer, C.; et al. Utilization of risk-based predictive stability within regulatory submissions; industry’s experience. AAPS Open 2020, 6, 1. [Google Scholar] [CrossRef]
- Alsante, K.M.; Martin, L.; Baertschi, S.W. A stress testing benchmarking study. Pharm. Technol. 2003, 27, 60–72. [Google Scholar]
- Singh, S.; Junwal, M.; Modhe, G.; Tiwari, H.; Kurmi, M.; Parashar, N.; Sidduri, P. Forced degradation studies to assess the stability of drugs and products. TrAC Trends Anal. Chem. 2013, 49, 71–88. [Google Scholar] [CrossRef]
- Paola, A.; Tonhi, E.; Silv, P. Stability Indicating Methods. In Quality Control of Herbal Medicines and Related Areas; InTech: West Palm Beach, FL, USA, 2011. [Google Scholar]
- Dong, M.W.; Huynh-Ba, K.; Ayers, J.T. Development of Stability-Indicating Analytical Procedures by Hplc: An Overview and Best Practices. Available online: https://www.chromatographyonline.com/view/development-of-stability-indicating-analytical-procedures-by-hplc-an-overview-and-best-practices (accessed on 8 November 2022).
- Hovorka, S.W.; Schöneich, C. Oxidative Degradation of Pharmaceuticals: Theory, Mechanisms and Inhibition. J. Pharm. Sci. 2001, 90, 253–269. [Google Scholar] [CrossRef]
- Gabrič, A.; Hodnik, Ž.; Pajk, S. Oxidation of Drugs during Drug Product Development: Problems and Solutions. Pharmaceutics 2022, 14, 325. [Google Scholar] [CrossRef] [PubMed]
- Celestino, M.T.; Magalhães, U.D.O.; Fraga, A.G.M.; do Carmo, F.A.; Lione, V.; Castro, H.C.; de Sousa, V.P.; Rodrigues, C.R.; Cabral, L.M. Rational use of antioxidants in solid oral pharmaceutical preparations. Braz. J. Pharm. Sci. 2012, 48, 405–415. [Google Scholar] [CrossRef]
- Li, M. Chapter 3. Oxidative degradation. In Organic Chemistry of Drug Degradation; Thurston, D., Ed.; Drug Discovery Series No. 29; Royal Society of Chemistry: Cambridge, UK, 2012; pp. 54–56. ISBN 978-1-84973-421-9. [Google Scholar]
- Yang, X.; Wu, B.; Zhou, J.; Lu, H.; Zhang, H.; Huang, F.; Wang, H. Controlling Intracellular Enzymatic Self-Assembly of Peptide by Host–Guest Complexation for Programming Cancer Cell Death. Nano Lett. 2022, 22, 7588–7596. [Google Scholar] [CrossRef]
- Ding, Y.; Tong, Z.; Jin, L.; Ye, B.; Zhou, J.; Sun, Z.; Yang, H.; Hong, L.; Huang, F.; Wang, W.; et al. An NIR Discrete Metallacycle Constructed from Perylene Bisimide and Tetraphenylethylene Fluorophores for Imaging-Guided Cancer Radio-Chemotherapy. Adv. Mater. 2022, 34, 2106388. [Google Scholar] [CrossRef]
- Sharp, T.R. Calculated carbon-hydrogen bond dissociation enthalpies for predicting oxidative susceptibility of drug substance molecules. Int. J. Pharm. 2011, 418, 304–317. [Google Scholar] [CrossRef] [PubMed]
- Drew, K.L.M.; Reynisson, J. The impact of carbon-hydrogen bond dissociation energies on the prediction of the cytochrome P450 mediated major metabolic site of drug-like compounds. Eur. J. Med. Chem. 2012, 56, 48–55. [Google Scholar] [CrossRef]
- Reid, D.L.; Calvitt, C.J.; Zell, M.T.; Miller, K.G.; Kingsmill, C.A. Early prediction of pharmaceutical oxidation pathways by computational chemistry and forced degradation. Pharm. Res. 2004, 21, 1708–1717. [Google Scholar] [CrossRef]
- Andersson, T.; Broo, A.; Evertsson, E. Prediction of Drug Candidates’ Sensitivity Toward Autoxidation: Computational Estimation of C–H Dissociation Energies of Carbon-Centered Radicals. J. Pharm. Sci. 2014, 103, 1949–1955. [Google Scholar] [CrossRef] [PubMed]
- Boccardi, G. Autoxidation of drugs: Prediction of degradation impurities from results of reaction with radical chain initiators. Farmaco 1994, 49, 431–435. [Google Scholar] [PubMed]
- Reynolds, D.A.N.W.; Galvani, M.; Hicks, S.R.; Joshi, B.J.; Kennedy-gabb, S.A.; Kleinman, M.H.; Parmar, P.Z. The Use of N-Methylpyrrolidone as a Cosolvent and Oxidant in Pharmaceutical Stress Testing. J. Pharm. Sci. 2012, 101, 761–776. [Google Scholar] [CrossRef]
- Buettner, G.R.; Jurkiewicz, B.A. Ascorbate free-radical as a marker of oxidative stress: An EPR study. Free Radic. Biol. Med. 1993, 14, 49–55. [Google Scholar] [CrossRef] [PubMed]
- Dotterer, S.K.; Forbes, R.A.; Hammill, C.L. Impact of metal-induced degradation on the determination of pharmaceutical compound purity and a strategy for mitigation. J. Pharm. Biomed. Anal. 2011, 54, 987–994. [Google Scholar] [CrossRef]
- Baertschi, S.W.; Jansen, P.J.; Alsante, K.M.; Santafianos, D.; Harmon, P.; Boccardi, G. Chapter 2. Stress Testing: A predictive tool. Chapter 3. Stress Testing: The chemistry of drug degradation. Chapter 6. Oxidative susceptibility testing. In Pharmaceutical Stress Testing—Predicting Drug Degradation; Baertschi, S.W., Alsante, K.M., Reed, R.A., Eds.; Informa Healthcare, USA, Inc.: London, UK, 2011; pp. 23,104–105,169. ISBN 9781616310011. [Google Scholar]
- Torres, S.; Brown, R.; Szucs, R.; Hawkins, J.M.; Zelesky, T.; Scrivens, G.; Pettman, A.; Taylor, M.R. The application of electrochemistry to pharmaceutical stability testing—Comparison with in silico prediction and chemical forced degradation approaches. J. Pharm. Biomed. Anal. 2015, 115, 487–501. [Google Scholar] [CrossRef]
- Modhave, D.; Barrios, B.; Paudel, A. PVP-H2O2 Complex as a New Stressor for the Accelerated Oxidation Study of Pharmaceutical Solids. Pharmaceutics 2019, 11, 457. [Google Scholar] [CrossRef]
- Robnik, B.; Naumoska, K.; Zdenkočasar, Z.Z. A Novel Testing Approach for Oxidative Degradation Dependent Incompatibility of Amine Moiety Containing Drugs with PEGs in Solid-State. Pharmaceutics 2020, 12, 37. [Google Scholar] [CrossRef] [PubMed]
- Harmon, P.A.; Kosuda, K.; Nelson, E.; Mowery, M.; Reed, R.A. A novel peroxy radical based oxidative stressing system for ranking the oxidizability of drug substances. J. Pharm. Sci. 2006, 95, 2014–2028. [Google Scholar] [CrossRef]
- Byrn, S.R. Mechanisms of solid-state reactions of drugs. J. Pharm. Sci. 1976, 65, 1–22. [Google Scholar] [CrossRef] [PubMed]
- Iyer, J.; Saraf, I.; Ray, A.; Brunsteiner, M.; Paudel, A. Assessment of Diverse Solid−State Accelerated Autoxidation Methods for Droperidol. Pharmaceutics 2022, 14, 1114. [Google Scholar] [CrossRef]
- Paudel, A.; Van Humbeeck, J.; Van Den Mooter, G. Theoretical and experimental investigation on the solid solubility and miscibility of naproxen in poly(vinylpyrrolidone). Mol. Pharm. 2010, 7, 1133–1148. [Google Scholar] [CrossRef]
- Gupta, J.; Nunes, C.; Vyas, S.; Jonnalagadda, S. Prediction of solubility parameters and miscibility of pharmaceutical compounds by molecular dynamics simulations. J. Phys. Chem. B 2011, 115, 2014–2023. [Google Scholar] [CrossRef]
- Sanghvi, R.; Narazaki, R.; Machatha, S.G.; Yalkowsky, S.H. Solubility improvement of drugs using N-methyl pyrrolidone. AAPS PharmSciTech 2008, 9, 366–376. [Google Scholar] [CrossRef]
- Iyer, J.; Brunsteiner, M.; Ray, A.; Davis, A.; Saraf, I.; Paudel, A. Theoretical and Experimental Investigation of Autoxidation Propensity of Selected Drugs in Solution State. Mol. Pharm. 2023. [Google Scholar] [CrossRef]
- Anton Paar-RapidOxy. Available online: https://www.anton-paar.com/at-de/produkte/details/oxidationsstabilitaetspruefer-rapidoxy-100/ (accessed on 13 January 2020).
- Mohamed, E.H.; Lotfy, H.M.; Hegazy, M.A.; Mowaka, S. Different applications of isosbestic points, normalized spectra and dual wavelength as powerful tools for resolution of multicomponent mixtures with severely overlapping spectra. Chem. Cent. J. 2017, 11, 43. [Google Scholar] [CrossRef]
- PubChem-Droperidol. Available online: https://pubchem.ncbi.nlm.nih.gov/compound/Droperidol#section=Decomposition (accessed on 30 November 2020).
- PubChem and Drugbank-Mifepristone. Available online: https://go.drugbank.com/drugs/DB00834 (accessed on 30 September 2022).
- PubChem-Cimetidine. Available online: https://pubchem.ncbi.nlm.nih.gov/compound/2756#section=Solubility (accessed on 30 November 2020).
- Plumley, C.; Gorman, E.M.; El-Gendy, N.; Bybee, C.R.; Munson, E.J.; Berkland, C. Nifedipine nanoparticle agglomeration as a dry powder aerosol formulation strategy. Int. J. Pharm. 2009, 369, 136–143. [Google Scholar] [CrossRef] [PubMed]
- PubChem-Indomethacin. Available online: https://pubchem.ncbi.nlm.nih.gov/compound/3715#section=pKa (accessed on 30 November 2020).
- PubChem-Naproxen. Available online: https://pubchem.ncbi.nlm.nih.gov/compound/156391#section=pKa (accessed on 30 November 2020).
- PubChem-Diclofenac. Available online: https://pubchem.ncbi.nlm.nih.gov/compound/3033#section=pKa (accessed on 30 November 2020).
- PubChem-Olanzapine. Available online: https://pubchem.ncbi.nlm.nih.gov/compound/Olanzapine (accessed on 16 December 2021).
- PubChem-Clotrimazole. Available online: https://pubchem.ncbi.nlm.nih.gov/compound/2812#section=pKa (accessed on 30 November 2020).
- Junicki, C.A.; Ciipin, R.K. Droperidol. In Analytical Profiles of Drug Substances and Excipients; Klaus Florey, Ed.; Academic press: San Diego, CA, USA, 1978; Volume 7, p. 177. [Google Scholar]
- Xu, J.; Gong, X.F.; Li, P.; Chen, X.F.; Wang, H.P.; Ning, L.F. Mifepristone polymorph with enhanced solubility, dissolution and oral bioavailability. Steroids 2020, 159, 108649. [Google Scholar] [CrossRef] [PubMed]
- Kato, F.; Matsuda, Y.; Watano, S. Physicochemical Characterization of Cimetidine Polymorphs and their Pharmaceutical Properties. J. Soc. Powder Technol. Jpn. 2014, 51, 250–257. [Google Scholar] [CrossRef]
- Testa, C.G.; Prado, L.D.; Costa, R.N.; Costa, M.L.; Linck, Y.G.; Monti, G.A.; Cuffini, S.L.; Rocha, H.V.A. Challenging identification of polymorphic mixture: Polymorphs I, II and III in olanzapine raw materials. Int. J. Pharm. 2019, 556, 125–135. [Google Scholar] [CrossRef] [PubMed]
- Polla, G.I.; Vega, D.R.; Lanza, H.; Tombari, D.G.; Baggio, R.; Ayala, A.P.; Mendes Filho, J.; Fernández, D.; Leyva, G.; Dartayet, G. Thermal behaviour and stability in Olanzapine. Int. J. Pharm. 2005, 301, 33–40. [Google Scholar] [CrossRef]
- Hayase, N.; Itagaki, Y.-I.; Ogawa, S.; Akutsu, S.; Inagaki, S.-I.; Abiko, Y. Newly discovered photodegradation products of nifedipine in hospital prescriptions. J. Pharm. Sci. 1994, 83, 532–538. [Google Scholar] [CrossRef] [PubMed]
- Lienard, P.; Gavartin, J.; Boccardi, G.; Meunier, M. Predicting drug substances autoxidation. Pharm. Res. 2015, 32, 300–310. [Google Scholar] [CrossRef] [PubMed]


| Experimental Values | Theoretical/Calculated Values | |||||
|---|---|---|---|---|---|---|
| Drug | Melting Point Tm (°C) Onset | Melting Enthalpy (J g−1) | Glass Transition Temperature (Tg) (°C) Onset | C–H BDE (kcal mol−1) | pKa | Reference for pKa |
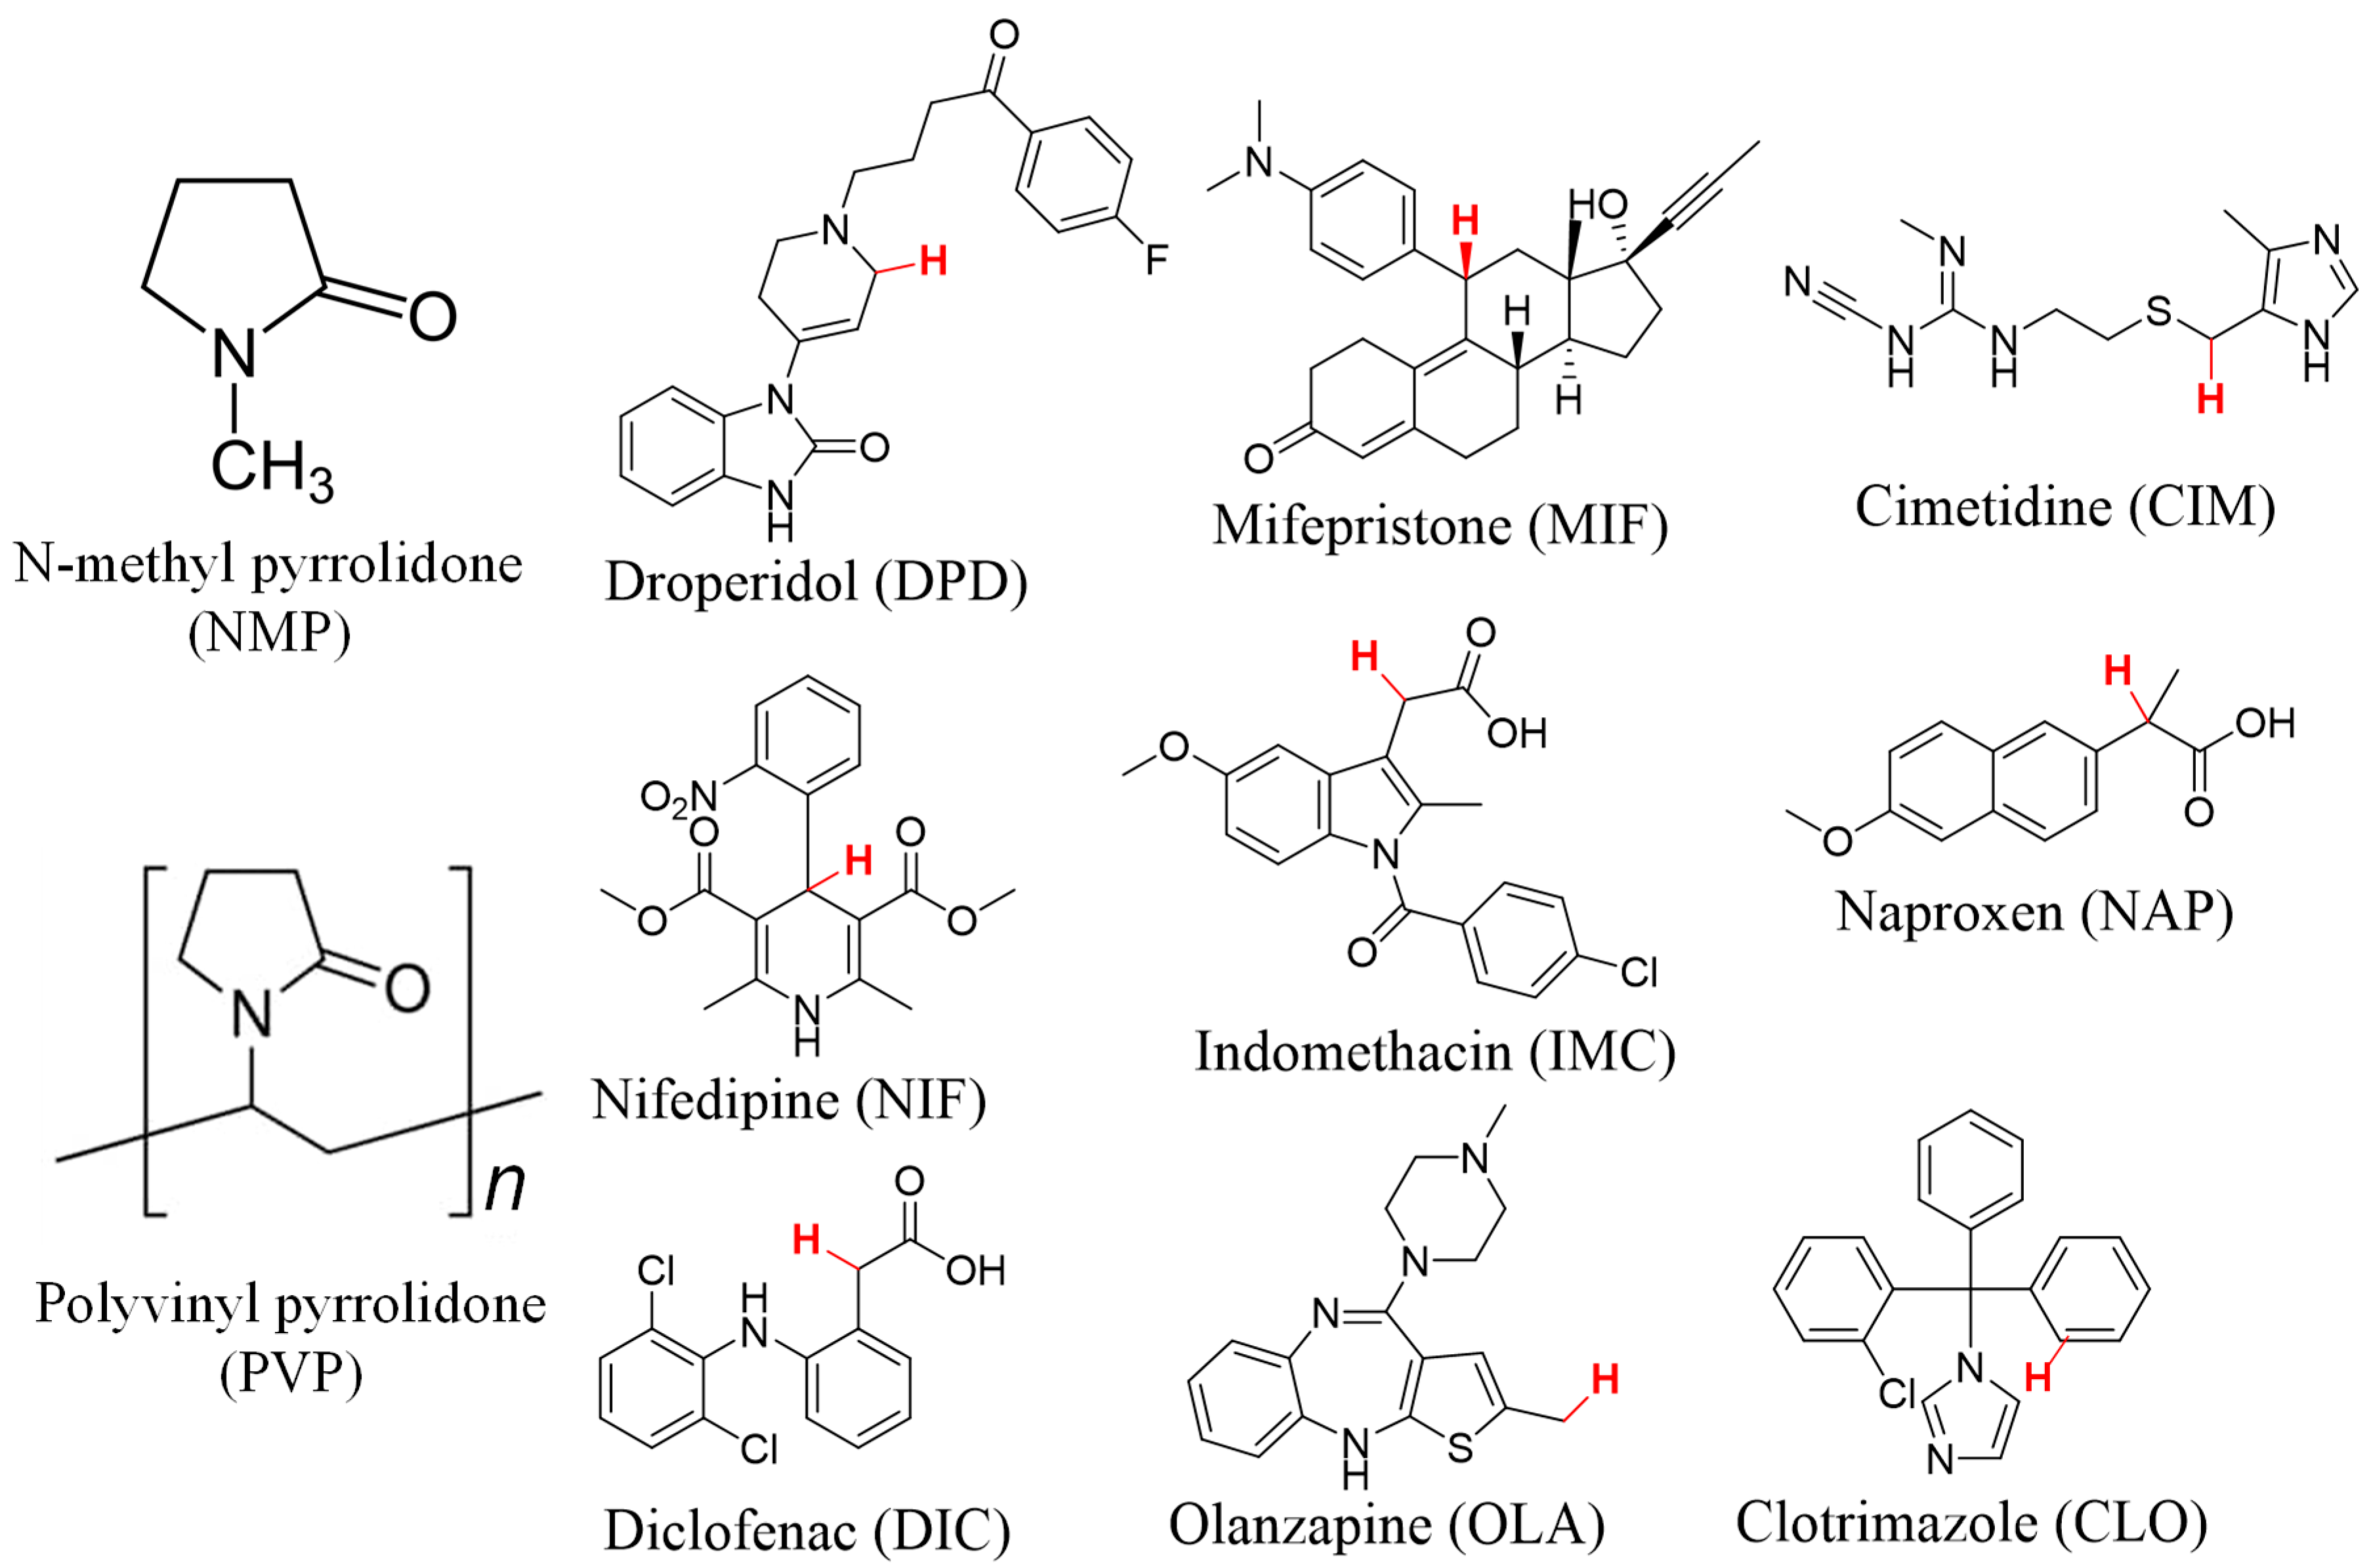
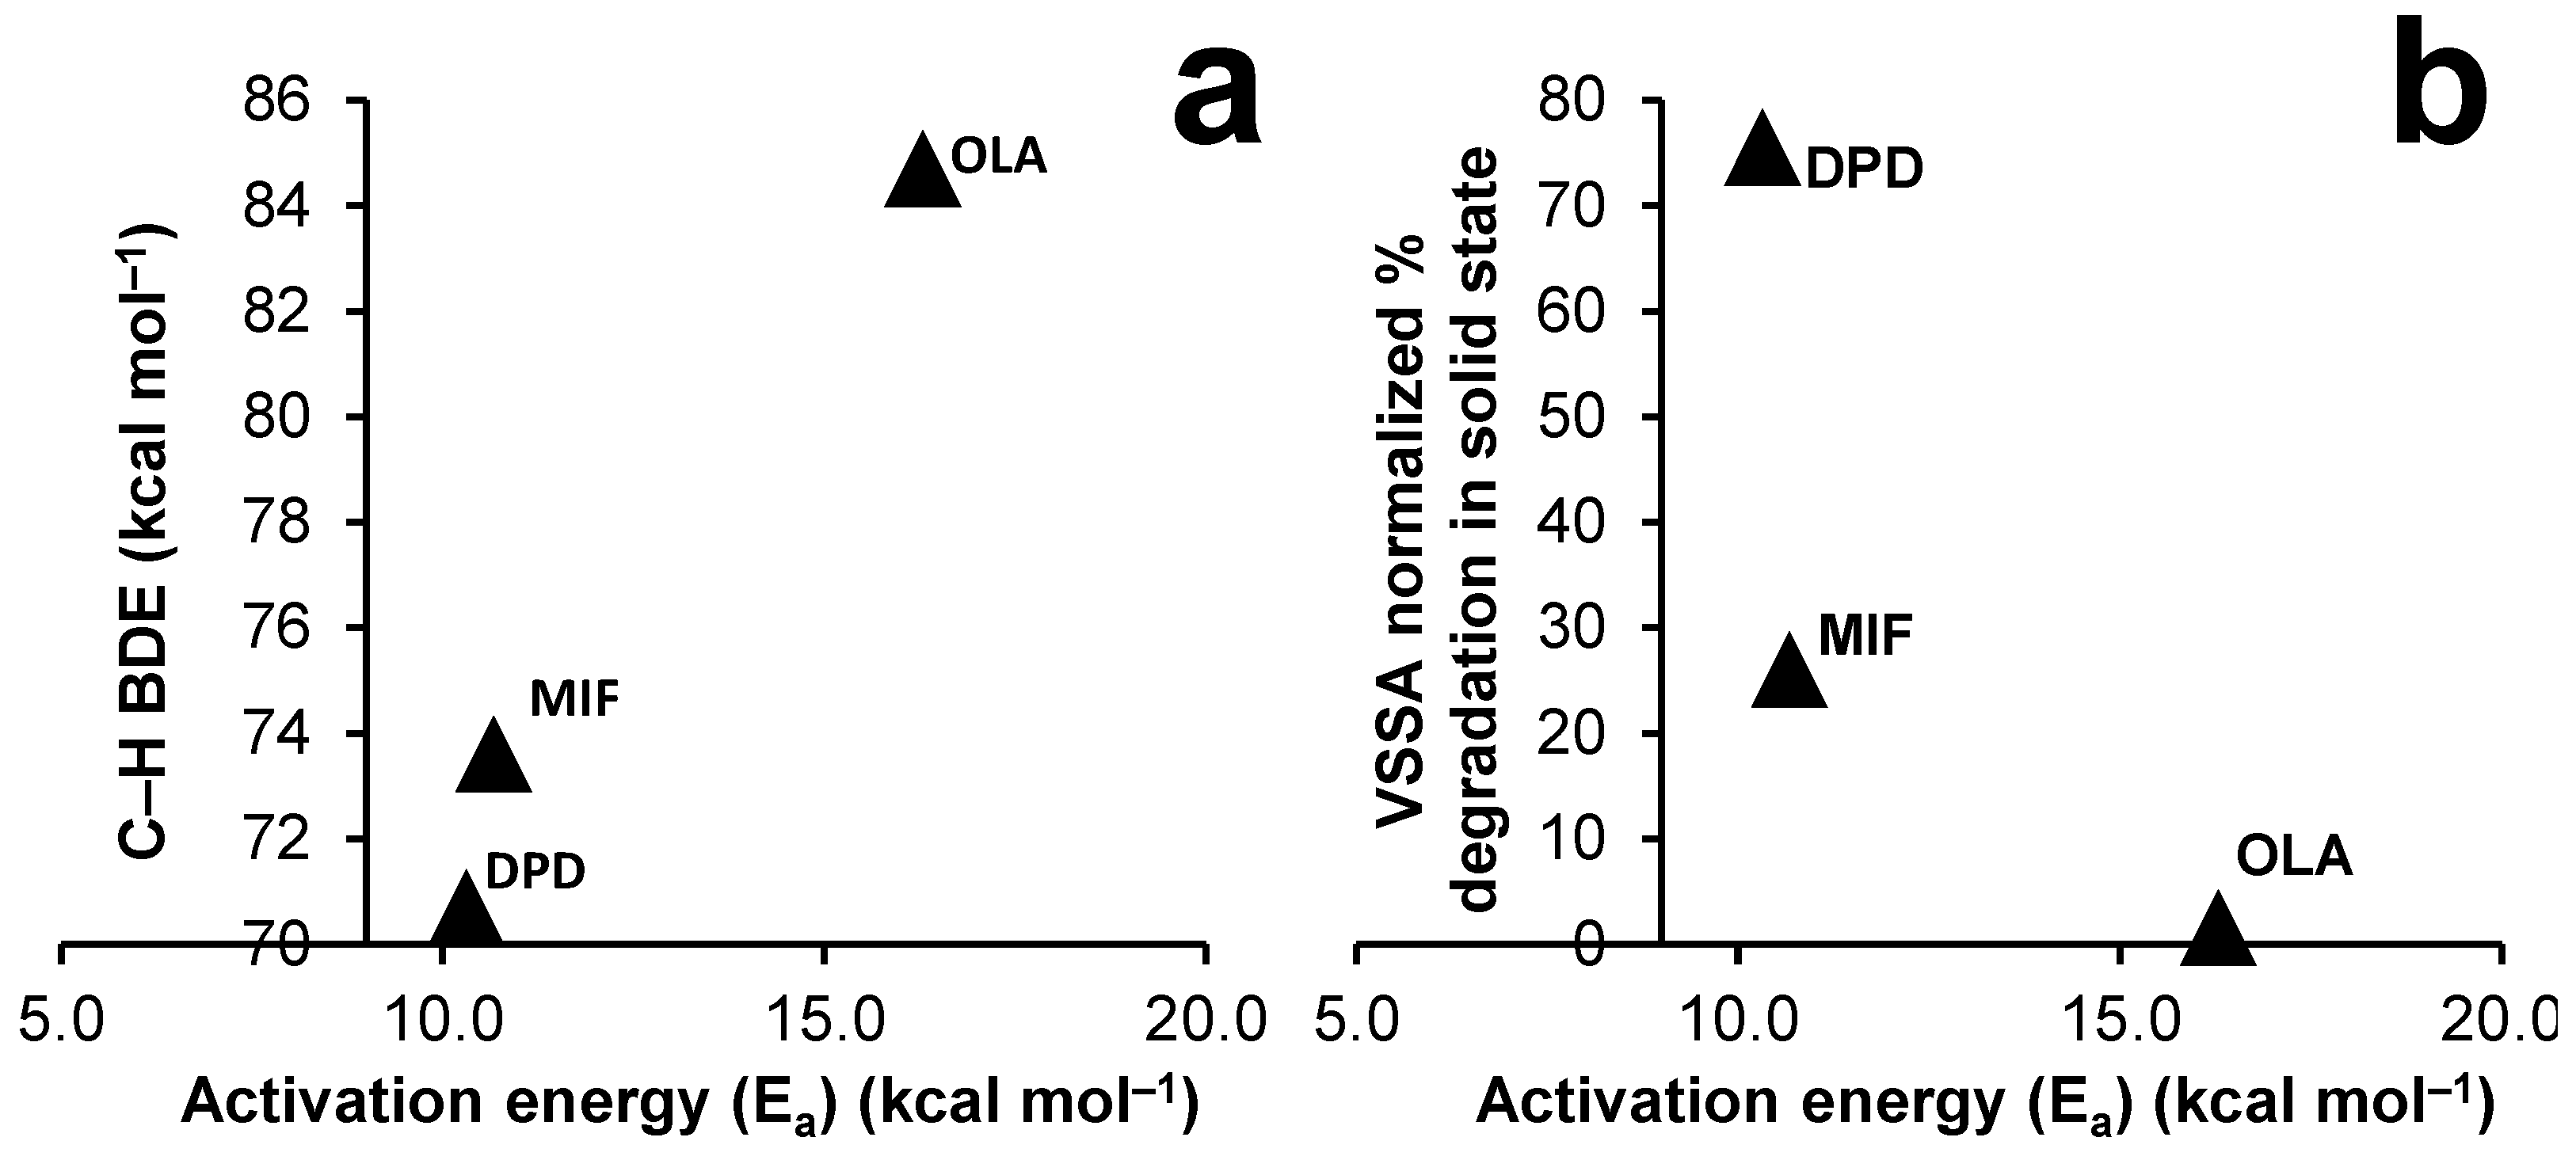
| Droperidol (DPD) | 151 | 103.14 | 28.90 | 70.70 | 7.46 | [35] |
| Mifepristone (MIF) | 192 | 68.27 | 105.30 | 73.60 | 4.89 | [36] |
| Cimetidine (CIM) | 144 | 142.50 | 43.70 | 76.50 | 6.80 | [37] |
| Nifedipine (NIF) | 172 | 114.80 | 40.70 | 77.30 | 3.93 | [38] |
| Indomethacin (IMC) | 159 | 105.40 | 40.60 | 80.50 | 4.50 | [39] |
| Naproxen (NAP) | 154 | 123.00 | * | 81.20 | 4.15 | [40] |
| Diclofenac (DIC) | 175 | 131.40 | 7.20 | 83.10 | 4.15 | [41] |
| Olanzapine (OLA) | 194 | 135.40 | 66.60 | 84.70 | 7.80 | [42] |
| Clotrimazole (CLO) | 143 | 84.78 | 27.90 | 107.60 | 4.10 | [43] |
| Drug | Area% | Range | D50 (µm) | D10 (µm) | Volume-Specific Surface Area (VSSA) (n = 2) | VSSA Normalized | |
|---|---|---|---|---|---|---|---|
| Degradation | n = 2 | Average (m2/cm3) | Range | Average Degradation% | |||
| DPD | 5.29 | 0.03 | 171.82 | 82.32 | 0.07 | 0.03 | 75.50 |
| MIF | 1.95 | 0.07 | 111.31 | 42.14 | 0.08 | 0.01 | 26.00 |
| CIM | 16.17 | 0.07 | 17.52 | 2.34 | 1.18 | 0.14 | 13.70 |
| NIF | 2.22 | 0.01 | 27.25 | 9.45 | 0.26 | 0.01 | 8.52 |
| IMC | 0.75 | 0.03 | 106.57 | 33.23 | 0.11 | 0.01 | 7.10 |
| NAP | 0.37 | 0.06 | 42.10 | 18.85 | 0.18 | 0.03 | 0.00 |
| DIC | 0.58 | 0.21 | 168.82 | 76.42 | 0.05 | 0.01 | 12.78 |
| OLA | 2.26 | 0.38 | 13.44 | 2.40 | 1.44 | 0.04 | 1.57 |
| CLO | 0.00 | – | 37.12 | 17.54 | 0.21 | 0.04 | 0.00 |
| Drug | Temperature (°C) | Autoxidation Rate k (h−1) | Temperature (K) | 1000/T (K−1) | ln k | Slope | Ea (kcal mol−1) | ln A | A |
|---|---|---|---|---|---|---|---|---|---|
| DPD | 45 | 1.320 | 318 | 3.145 | 0.278 | −5.192 | 10.316 | 16.570 | 1.571 × 10⁷ |
| 50 | 1.588 | 323 | 3.096 | 0.463 | |||||
| 55 | 2.035 | 328 | 3.049 | 0.710 | |||||
| 60 | 2.756 | 333 | 3.003 | 1.014 | |||||
| MIF | 45 | 0.190 | 318 | 3.145 | −1.660 | −5.371 | 10.672 | 15.213 | 4.05 × 10⁶ |
| 50 | 0.235 | 323 | 3.096 | −1.448 | |||||
| 55 | 0.318 | 328 | 3.049 | −1.144 | |||||
| 60 | 0.400 | 333 | 3.003 | −0.915 | |||||
| OLA | 45 | 0.025 | 318 | 3.145 | −3.701 | −8.198 | 16.290 | 22.113 | 4.014 × 10⁹ |
| 50 | 0.037 | 323 | 3.096 | −3.302 | |||||
| 55 | 0.067 | 328 | 3.049 | −2.708 | |||||
| 60 | 0.073 | 333 | 3.003 | −2.612 |
Disclaimer/Publisher’s Note: The statements, opinions and data contained in all publications are solely those of the individual author(s) and contributor(s) and not of MDPI and/or the editor(s). MDPI and/or the editor(s) disclaim responsibility for any injury to people or property resulting from any ideas, methods, instructions or products referred to in the content. |
© 2023 by the authors. Licensee MDPI, Basel, Switzerland. This article is an open access article distributed under the terms and conditions of the Creative Commons Attribution (CC BY) license (https://creativecommons.org/licenses/by/4.0/).
Share and Cite
Iyer, J.; Karn, A.; Brunsteiner, M.; Ray, A.; Davis, A.; Saraf, I.; Paudel, A. Screening Autoxidation Propensities of Drugs in the Solid-State Using PVP and in the Solution State Using N-Methyl Pyrrolidone. Pharmaceutics 2023, 15, 848. https://doi.org/10.3390/pharmaceutics15030848
Iyer J, Karn A, Brunsteiner M, Ray A, Davis A, Saraf I, Paudel A. Screening Autoxidation Propensities of Drugs in the Solid-State Using PVP and in the Solution State Using N-Methyl Pyrrolidone. Pharmaceutics. 2023; 15(3):848. https://doi.org/10.3390/pharmaceutics15030848
Chicago/Turabian StyleIyer, Jayant, Anjali Karn, Michael Brunsteiner, Andrew Ray, Adrian Davis, Isha Saraf, and Amrit Paudel. 2023. "Screening Autoxidation Propensities of Drugs in the Solid-State Using PVP and in the Solution State Using N-Methyl Pyrrolidone" Pharmaceutics 15, no. 3: 848. https://doi.org/10.3390/pharmaceutics15030848