
Cell Proteomic Footprinting: Advances in the Quality of Cellular and Cell-Derived Cancer Vaccines

 ,
,  , ,
, ,  and
and
Abstract
:1. Introduction
2. Background of Cell Proteomic Footprinting
3. Cell Proteomic Footprinting
4. Cell Authentication by Cell Proteomic Footprinting
5. Cell Proteomic Footprinting Protocols
5.1. Sample Preparation
- Cells grown to 65% confluence are washed four times with Hanks’ balanced salt solution (HBSS). During the third and fourth washings, the cells are kept in HBSS for 15 min. Washed cells are treated with 0.2 μg/mL of trypsin (15,000 U/mg, Promega, Madison, WI, USA) in HBSS. A 0.5 mL trypsin solution is added to every 10 cm2 of a cell culture plate, incubated for 20 min at 37 °C in saturated humidity, and then the trypsin solution is carefully collected (to avoid the detachment of cells and their entry into the collected trypsin solution).
- The collected trypsin solution is centrifuged (600× g for 5 min) to remove detached cells (if any, cells mainly remain attached during and after treatment with trypsin; however, there should not be a time lag between cell treatment with trypsin and this step to minimize the damage of detached cells).
- The collected trypsin solution is acidified (up to pH 4) by adding 10% acetic acid to stop trypsin action (a litmus test is used to confirm pH).
- The resulting solution contains cell surface antigens. Cells just after treatment with trypsin are covered by HBSS with 10% fetal bovine serum (FBS), and their viability is estimated by trypan blue exclusion or another suitable method [102]. The number of dead cells should not exceed 1%.
5.2. Mass Spectrometry
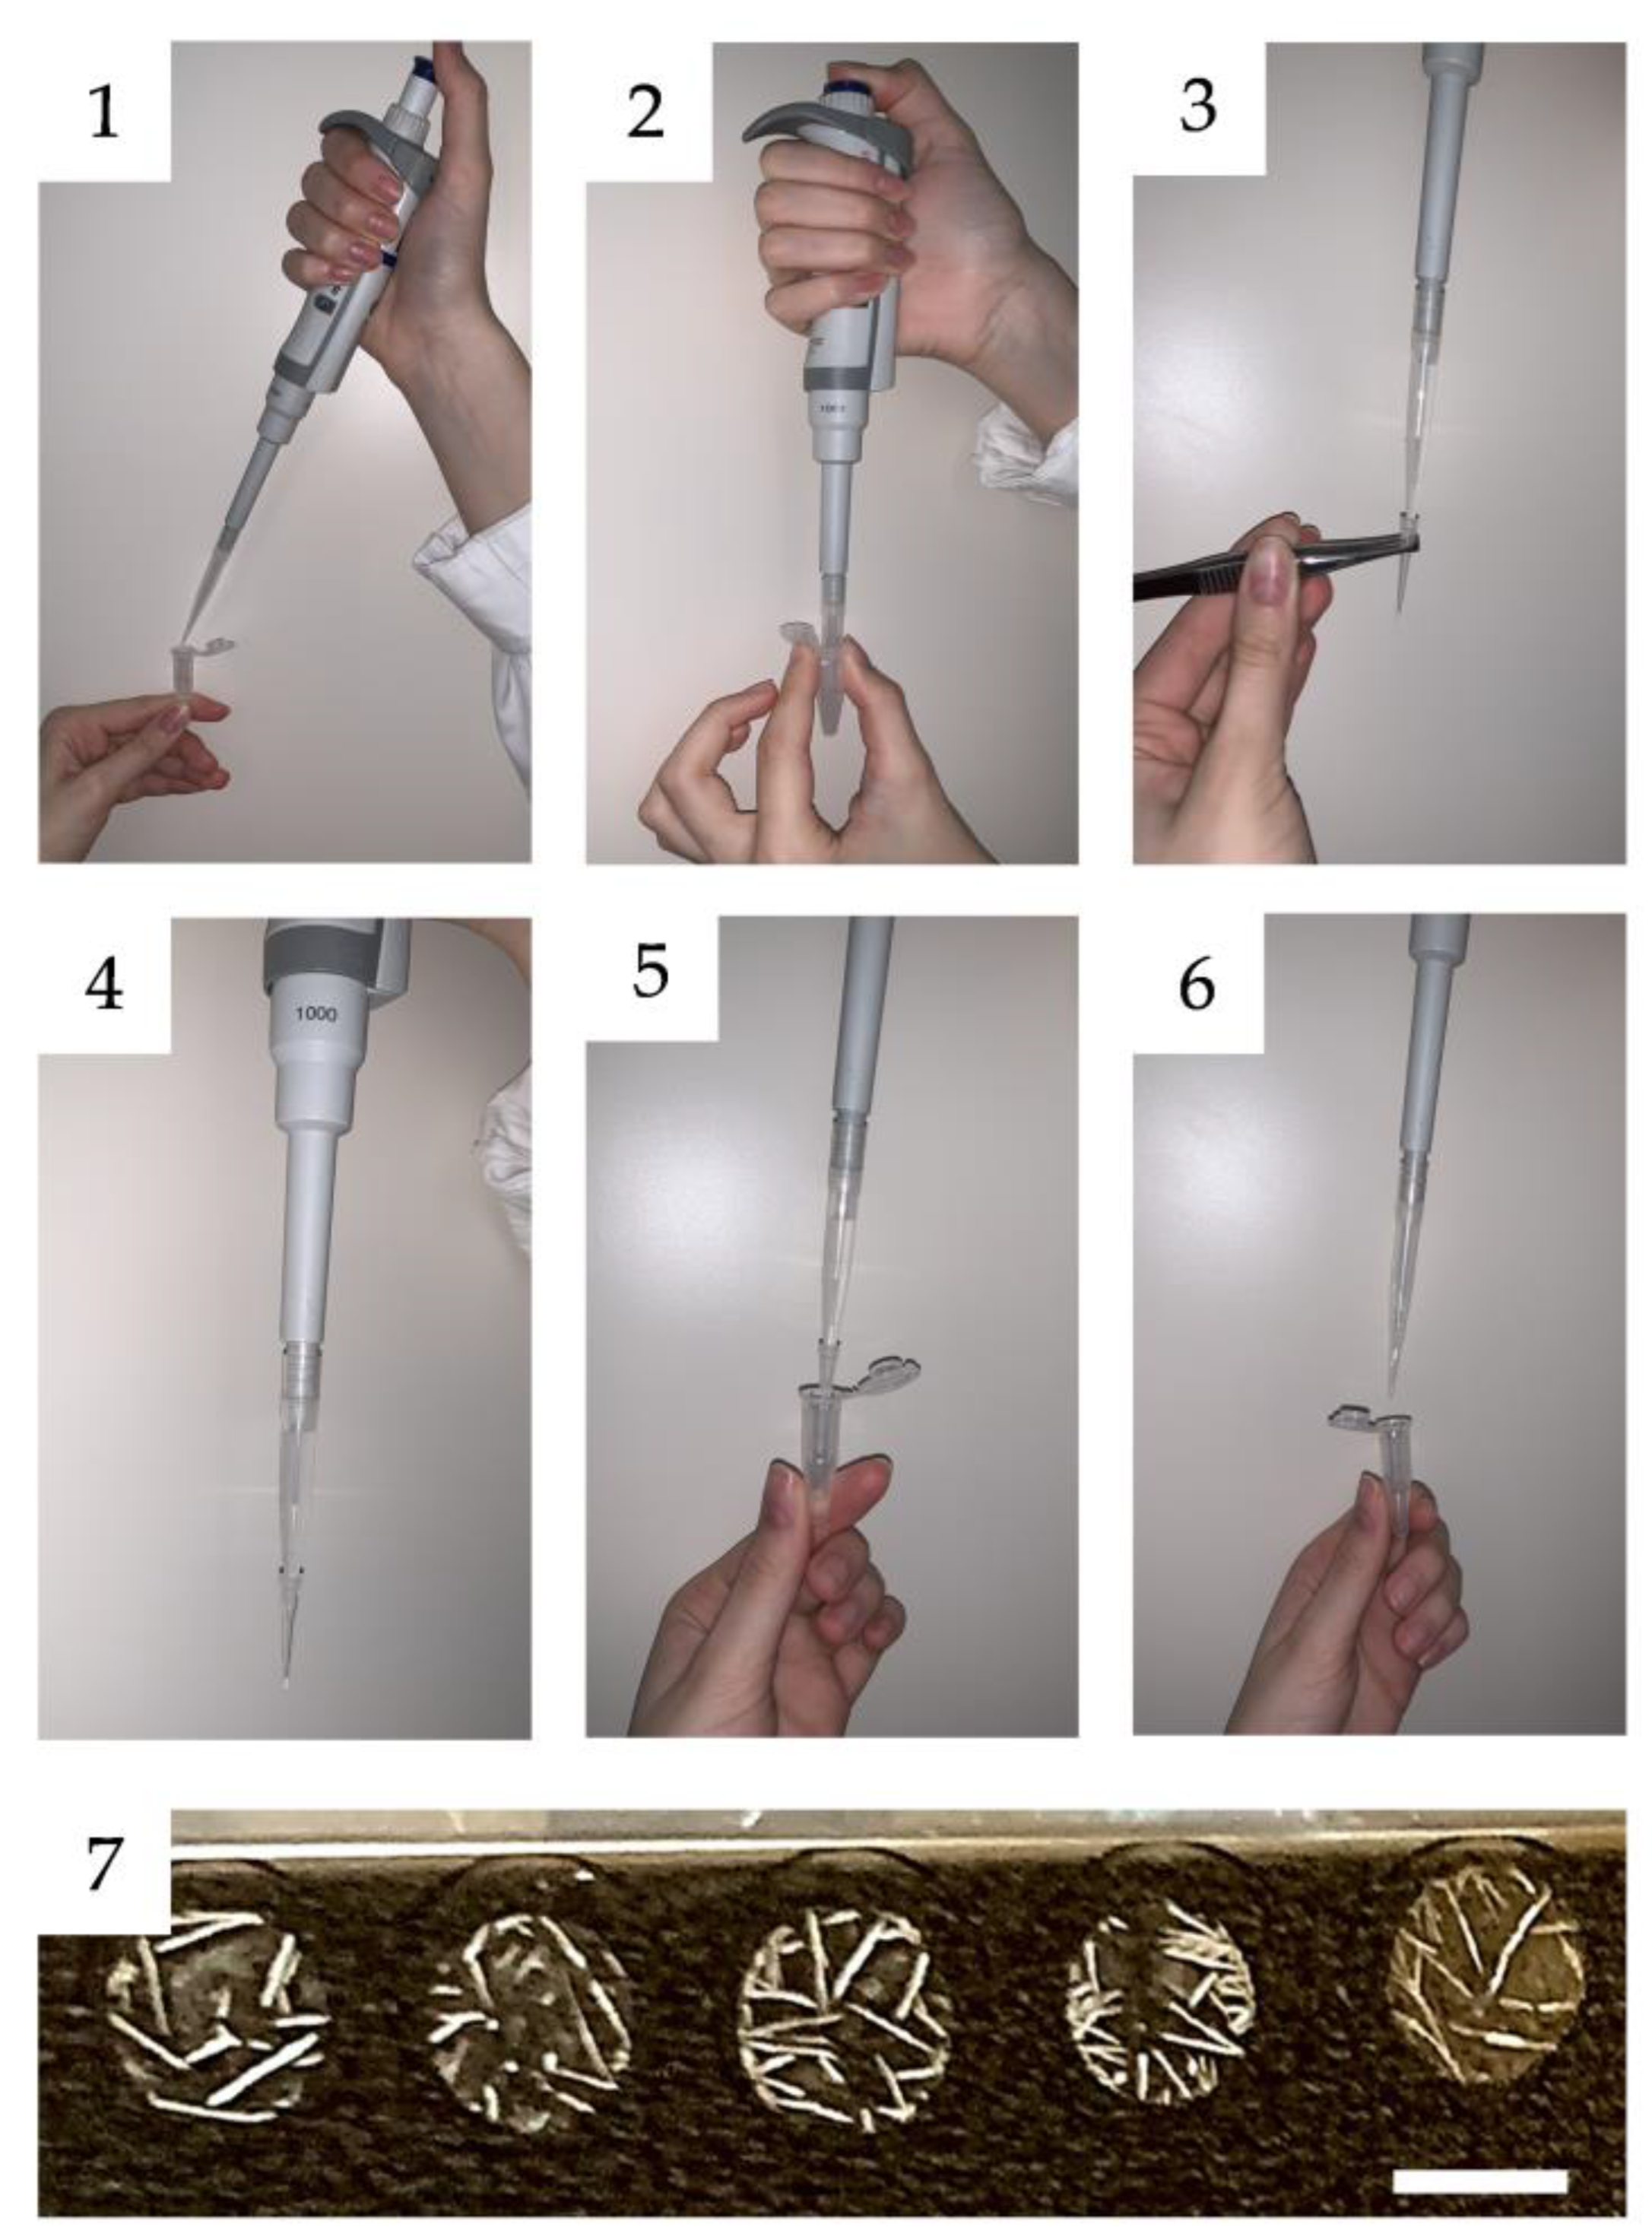
- The peptide sample is desalted using ZipTipC18 (Millipore Corp., Billerica, MA, USA) according to the manufacturer’s protocol with modifications (Figure 5). The concentration of surface antigens in the solution is incredibly low (for example, 2 μg/mL [103]), and the concentration of individual peptides is many orders of magnitude lower. As a result, the typical ZipTip procedure, which entails filling and withdrawing a 10 μL solution, frequently fails to produce a mass spectrum that is saturated with peptides. Passing 1 mL of the solution through the ZipTip several times increases the amount of peptides that can be caught by the ZipTip.
- MALDI samples are prepared using a standard ’dried droplet’ method with 2,5-dihydroxybenzoic acid (DHB) as a matrix.
- Peptide mass spectra are acquired on a MALDI-TOF mass spectrometer (e.g., MicroFLEX, Bruker Daltonik, Germany) in a linear positive ion mode. Mass peak lists are formed manually. The mass spectrometer is set up for the priority detection of ions with an m/z range of 600 to 3500 and a mass accuracy of at least 100 ppm. All peaks above the noise level are selected to generate a cell proteomic footprint [46]. The mass spectra of control samples (Table 3) are used to remove irrelevant masses from the proteomic footprint.
- The footprint’s peptide masses are binned in 0.2 Da intervals and encoded in a binary format, with 1 representing the presence of a measured peptide mass in an interval and 0 representing its absence. Any suitable software can be used for this.
5.3. Cell Proteomic Footprint Processing
6. Supplement to Quality Control
7. CPF Implementation Guide
8. Final Remarks
9. Conclusions
Supplementary Materials
Author Contributions
Funding
Institutional Review Board Statement
Informed Consent Statement
Data Availability Statement
Conflicts of Interest
References
- Zhang, H.; Chen, J. Current status and future directions of cancer immunotherapy. J. Cancer 2018, 9, 1773–1781. [Google Scholar] [CrossRef] [Green Version]
- Li, T.; Qian, C.; Gu, Y.; Zhang, J.; Li, S.; Xia, N. Current progress in the development of prophylactic and therapeutic vaccines. Sci. China Life Sci. 2022, 65. [Google Scholar] [CrossRef]
- Baars, A.; Van Riel, J.M.G.H.; Cuesta, M.A.; Jaspars, E.H.; Pinedo, H.M.; Van den Eertwegh, A.J.M. Metastasectomy and active specific immunotherapy for a large single melanoma metastasis. Hepatogastroenterology 2002, 49, 691–693. [Google Scholar]
- Berd, D.; Maguire, H.C.; McCue, P.; Mastrangelo, M.J. Treatment of metastatic melanoma with an autologous tumor-cell vaccine: Clinical and immunologic results in 64 patients. J. Clin. Oncol. 1990, 8, 1858–1867. [Google Scholar] [CrossRef]
- Méndez, R.; Ruiz-Cabello, F.; Rodríguez, T.; Del Campo, A.; Paschen, A.; Schadendorf, D.; Garrido, F. Identification of different tumor escape mechanisms in several metastases from a melanoma patient undergoing immunotherapy. Cancer Immunol. Immunother. 2007, 56, 88–94. [Google Scholar] [CrossRef]
- Nemunaitis, J.; Sterman, D.; Jablons, D.; Smith, J.W.; Fox, B.; Maples, P.; Hamilton, S.; Borellini, F.; Lin, A.; Morali, S.; et al. Granulocyte-macrophage colony-stimulating factor gene-modified autologous tumor vaccines in non-small-cell lung cancer. J. Natl. Cancer Inst. 2004, 96, 326–331. [Google Scholar] [CrossRef] [Green Version]
- Rüttinger, D.; van den Engel, N.K.; Winter, H.; Schlemmer, M.; Pohla, H.; Grützner, S.; Wagner, B.; Schendel, D.J.; Fox, B.A.; Jauch, K.W.; et al. Adjuvant therapeutic vaccination in patients with non-small cell lung cancer made lymphopenic and reconstituted with autologous PBMC: First clinical experience and evidence of an immune response. J. Transl. Med. 2007, 5, 43. [Google Scholar] [CrossRef] [Green Version]
- Schulof, R.S.; Mai, D.; Nelson, M.A.; Paxton, H.M.; Cox, J.W., Jr.; Turner, M.L.; Mills, M.; Hix, W.R.; Nochomovitz, L.E.; Peters, L.C.; et al. Active specific immunotherapy with an autologous tumor cell vaccine in patients with resected non-small cell lung cancer. Mol. Biother. 1988, 1, 30–36. [Google Scholar]
- Berger, M.; Kreutz, F.T.; Horst, J.L.; Baldi, A.C.; Koff, W.J. Phase I study with an autologous tumor cell vaccine for locally advanced or metastatic prostate cancer. J. Pharm. Pharm. Sci. 2007, 10, 144–152. [Google Scholar] [PubMed]
- De Weger, V.A.; Turksma, A.W.; Voorham, Q.J.M.; Euler, Z.; Bril, H.; Van Den Eertwegh, A.J.; Bloemena, E.; Pinedo, H.M.; Vermorken, J.B.; Van Tinteren, H.; et al. Clinical effects of adjuvant active specific immunotherapy differ between patients with microsatellite-stable and microsatellite-instable colon cancer. Clin. Cancer Res. 2012, 18, 882–889. [Google Scholar] [CrossRef] [Green Version]
- Hanna, M.G.; Hoover, H.C.; Vermorken, J.B.; Harris, J.E.; Pinedo, H.M. Adjuvant active specific immunotherapy of stage II and stage III colon cancer with an autologous tumor cell vaccine: First randomized phase III trials show promise. Vaccine 2001, 19, 2576–2582. [Google Scholar] [CrossRef] [PubMed]
- Harris, J.E.; Ryan, L.; Hoover, H.C.; Stuart, R.K.; Oken, M.M.; Benson, A.B.; Mansour, E.; Haller, D.G.; Manola, J.; Hanna, M.G. Adjuvant active specific immunotherapy for stage II and III colon cancer with an autologous tumor cell vaccine: Eastern Cooperative Oncology Group study E5283. J. Clin. Oncol. 2000, 18, 148–157. [Google Scholar] [CrossRef] [PubMed]
- Ockert, D.; Schirrmacher, V.; Beck, N.; Stoelben, E.; Ahlert, T.; Flechtenmacher, J.; Hagmüller, E.; Buchcik, R.; Nagel, M.; Saeger, H.D. Newcastle disease virus-infected intact autologous tumor cell vaccine for adjuvant active specific immunotherapy of resected colorectal carcinoma. Clin. Cancer Res. 1996, 2, 21–28. [Google Scholar] [CrossRef]
- Antonia, S.J.; Seigne, J.; Diaz, J.; Muro-Cacho, C.; Extermann, M.; Farmelo, M.J.; Friberg, M.; Alsarraj, M.; Mahany, J.J.; Pow-Sang, J.; et al. Phase I trial of a B7-1 (CD80) gene modified autologous tumor cell vaccine in combination with systemic interleukin-2 in patients with metastatic renal cell carcinoma. J. Urol. 2002, 167, 1995–2000. [Google Scholar] [CrossRef] [PubMed]
- Fishman, M.; Hunter, T.B.; Soliman, H.; Thompson, P.; Dunn, M.; Smilee, R.; Farmelo, M.J.; Noyes, D.R.; Mahany, J.J.; Lee, J.H.; et al. Phase II trial of B7-1 (CD-86) transduced, cultured autologous tumor cell vaccine plus subcutaneous interleukin-2 for treatment of stage IV renal cell carcinoma. J. Immunother. 2008, 31, 72–80. [Google Scholar] [CrossRef]
- Kinoshita, Y.; Kono, T.; Yasumoto, R.; Kishimoto, T.; Wang, C.Y.; Haas, G.P.; Nishisaka, N. Antitumor effect on murine renal cell carcinoma by autologous tumor vaccines genetically modified with granulocyte-macrophage colony-stimulating factor and interleukin-6 cells. J. Immunother. 2001, 24, 205–211. [Google Scholar] [CrossRef] [PubMed]
- Copier, J.; Dalgleish, A. Whole-cell vaccines: A failure or a success waiting to happen? Curr. Opin. Mol. Ther. 2010, 12, 14–20. [Google Scholar]
- Bodey, B.; Bodey, B.J.; Siegel, S.E.; Kaiser, H.E. Failure of cancer vaccines: The significant limitations of this approach to immunotherapy. Anticancer Res. 2000, 20, 2665–2676. [Google Scholar]
- Tan, A.C.L.; Goubier, A.; Kohrt, H.E. A quantitative analysis of therapeutic cancer vaccines in phase 2 or phase 3 trial. J. Immunother. Cancer 2015, 3, 48. [Google Scholar] [CrossRef] [Green Version]
- Zhang, X.; Cui, H.; Zhang, W.; Li, Z.; Gao, J. Engineered tumor cell-derived vaccines against cancer: The art of combating poison with poison. Bioact. Mater. 2023, 22, 491–517. [Google Scholar] [CrossRef]
- Cuzzubbo, S.; Mangsbo, S.; Nagarajan, D.; Habra, K.; Pockley, A.G.; McArdle, S.E.B. Cancer Vaccines: Adjuvant Potency, Importance of Age, Lifestyle, and Treatments. Front. Immunol. 2021, 11, 3850. [Google Scholar] [CrossRef] [PubMed]
- Paston, S.J.; Brentville, V.A.; Symonds, P.; Durrant, L.G. Cancer vaccines, adjuvants, and delivery systems. Front. Immunol. 2021, 12, 627932. [Google Scholar] [CrossRef] [PubMed]
- Huang, J.; Li, M.; Mei, B.; Li, J.; Zhu, Y.; Guo, Q.; Huang, J.; Zhang, G. Whole-cell tumor vaccines desialylated to uncover tumor antigenic Gal/GalNAc epitopes elicit anti-tumor immunity. J. Transl. Med. 2022, 20, 496. [Google Scholar] [CrossRef] [PubMed]
- Batista-Duharte, A.; Hassouneh, F.; Alvarez-Heredia, P.; Pera, A.; Solana, R. Immune checkpoint inhibitors for vaccine improvements: Current status and new approaches. Pharmaceutics 2022, 14, 1721. [Google Scholar] [CrossRef] [PubMed]
- Mougel, A.; Terme, M.; Tanchot, C. Therapeutic cancer vaccine and combinations with antiangiogenic therapies and immune checkpoint blockade. Front. Immunol. 2019, 10, 467. [Google Scholar] [CrossRef] [PubMed] [Green Version]
- Huggins, J.W.; Chestnut, R.W.; Durham, N.N.; Carraway, K.L. Molecular changes in cell surface membranes resulting from trypsinization of sarcoma 180 tumor cells. BBA-Biomembr. 1976, 426, 630–637. [Google Scholar] [CrossRef] [PubMed]
- Angus, R.; Collins, C.M.P.; Symes, M.O. Expression of major histocompatibility complex (MHC) antigens and their loss on culture in renal carcinoma. Eur. J. Cancer 1993, 29, 2158–2160. [Google Scholar] [CrossRef]
- Bertozzi, C.C.; Chang, C.-Y.; Jairaj, S.; Shan, X.; Huang, J.; Weber, B.L.; Chu, C.S.; Carroll, R.G. Multiple initial culture conditions enhance the establishment of cell lines from primary ovarian cancer specimens. In Vitro Cell. Dev. Biol. Anim. 2006, 42, 58–62. [Google Scholar] [CrossRef]
- Orth, K.; Hung, J.; Gazdar, A.; Bowcock, A.; Mathis, J.M.; Sambrook, J. Genetic instability in human ovarian cancer cell lines. Proc. Natl. Acad. Sci. USA 1994, 91, 9495–9499. [Google Scholar] [CrossRef] [Green Version]
- Hiorns, L.R.; Bradshaw, T.D.; Skelton, L.A.; Yu, Q.; Kelland, L.R.; Leyland-Jones, B. Variation in RNA expression and genomic DNA content acquired during cell culture. Br. J. Cancer 2004, 90, 476–482. [Google Scholar] [CrossRef] [Green Version]
- Lokhov, P.G.; Balashova, E.E. Tumor-induced endothelial cell surface heterogeneity directly affects endothelial cell escape from a cell-mediated immune response in vitro. Hum. Vacc. Immunother. 2013, 9, 198–209. [Google Scholar] [CrossRef] [PubMed] [Green Version]
- Hounkpe, B.W.; Chenou, F.; de Lima, F.; De Paula, E.V. HRT Atlas v1.0 database: Redefining human and mouse housekeeping genes and candidate reference transcripts by mining massive RNA-seq datasets. Nucleic Acids Res. 2021, 49, D947–D955. [Google Scholar] [CrossRef] [PubMed]
- Butte, A.J.; Dzau, V.J.; Glueck, S.B. Further defining housekeeping, or “maintenance,” genes. Focus on “A compendium of gene expression in normal human tissues”. Physiol. Genom. 2001, 7, 95–96. [Google Scholar] [CrossRef] [PubMed] [Green Version]
- Zhu, J.; He, F.; Hu, S.; Yu, J. On the nature of human housekeeping genes. Trends Genet. 2008, 24, 481–484. [Google Scholar] [CrossRef] [PubMed]
- Bausch-Fluck, D.; Goldmann, U.; Müller, S.; van Oostrum, M.; Müller, M.; Schubert, O.T.; Wollscheid, B. The in silico human surfaceome. Proc. Natl. Acad. Sci. USA 2018, 115, E10988–E10997. [Google Scholar] [CrossRef] [Green Version]
- Shilts, J.; Severin, Y.; Galaway, F.; Müller-Sienerth, N.; Chong, Z.-S.; Pritchard, S.; Teichmann, S.; Vento-Tormo, R.; Snijder, B.; Wright, G.J. A physical wiring diagram for the human immune system. Nature 2022, 608, 397–404. [Google Scholar] [CrossRef]
- Rieckmann, J.C.; Geiger, R.; Hornburg, D.; Wolf, T.; Kveler, K.; Jarrossay, D.; Sallusto, F.; Shen-Orr, S.S.; Lanzavecchia, A.; Mann, M.; et al. Social network architecture of human immune cells unveiled by quantitative proteomics. Nat. Immunol. 2017, 18, 583–593. [Google Scholar] [CrossRef]
- Lokhov, P.G.; Balashova, E.E. Cellular cancer vaccines: An update on the development of vaccines generated from cell surface antigens. J. Cancer 2010, 1, 230–241. [Google Scholar] [CrossRef] [Green Version]
- Kohnert-Stavenhagen, E.; Zimmermann, B. Changes in the surface coat of mesenchymal cells of mouse limb buds after enzymatic cell separation. J. Embryol. Exp. Morphol. 1980, 59, 145–155. [Google Scholar] [CrossRef]
- Kirby, B. The Cell Membrane. Available online: https://www.ncnr.nist.gov/programs/reflect/rp/biology/cell_membrane.html (accessed on 1 September 2022).
- Noor, Z.; Ahn, S.B.; Baker, M.S.; Ranganathan, S.; Mohamedali, A. Mass spectrometry-based protein identification in proteomics-a review. Brief. Bioinform. 2021, 22, 1620–1638. [Google Scholar] [CrossRef]
- Duong, V.-A.; Park, J.-M.; Lee, H. A review of suspension trapping digestion method in bottom-up proteomics. J. Sep. Sci. 2022, 45, 3150–3168. [Google Scholar] [CrossRef] [PubMed]
- Sun, B.; Liu, Z.; Liu, J.; Zhao, S.; Wang, L.; Wang, F. The utility of proteases in proteomics, from sequence profiling to structure and function analysis. Proteomics 2022, e2200132. [Google Scholar] [CrossRef] [PubMed]
- Giddings, M.C.; Shah, A.A.; Gesteland, R.; Moore, B. Genome-based peptide fingerprint scanning. Proc. Natl. Acad. Sci. USA 2003, 100, 20–25. [Google Scholar] [CrossRef] [PubMed] [Green Version]
- Honoré, B. Proteomic protocols for differential protein expression analyses. Methods Mol. Biol. 2020, 2110, 47–58. [Google Scholar] [CrossRef]
- Lokhov, P.; Balashova, E.; Dashtiev, M. Cell proteomic footprint. Rapid Commun. Mass Spectrom. 2009, 23, 680–682. [Google Scholar] [CrossRef] [Green Version]
- Lokhov, P.G.; Lichtenberg, S.; Balashova, E.E. Changing landscape of cancer vaccines–Novel proteomics platform for new antigen compositions. Int. J. Mol. Sci. 2022, 23, 4401. [Google Scholar] [CrossRef]
- Lokhov, P.G.; Mkrtichyan, M.; Mamikonyan, G.; Balashova, E.E. SANTAVAC: Summary of research and development. Vaccines 2019, 7, 186. [Google Scholar] [CrossRef] [Green Version]
- Walmsley, S.J.; Rudnick, P.A.; Liang, Y.; Dong, Q.; Stein, S.E.; Nesvizhskii, A.I. Comprehensive analysis of protein digestion using six trypsins reveals the origin of trypsin as a significant source of variability in proteomics. J. Proteome Res. 2013, 12, 5666–5680. [Google Scholar] [CrossRef] [Green Version]
- O’Brien, S.J. Cell culture forensics. Proc. Natl. Acad. Sci. USA 2001, 98, 7656–7658. [Google Scholar] [CrossRef] [Green Version]
- Stacey, G.N.; Masters, J.R.W.; Hay, R.J.; Drexler, H.G.; MacLeod, R.A.F.; Freshney, R.I. Cell contamination leads to inaccurate data: We must take action now. Nature 2000, 403, 356. [Google Scholar] [CrossRef]
- MacLeod, R.A.F.; Dirks, W.G.; Matsuo, Y.; Kaufmann, M.; Milch, H.; Drexler, H.G. Widespread intraspecies cross-contamination of human tumor cell lines arising at source. Int. J. Cancer 1999, 83, 555–563. [Google Scholar] [CrossRef]
- Cabrera, C.M.; Cobo, F.; Nieto, A.; Cortés, J.L.; Montes, R.M.; Catalina, P.; Concha, A. Identity tests: Determination of cell line cross-contamination. Cytotechnology 2006, 51, 45–50. [Google Scholar] [CrossRef] [PubMed] [Green Version]
- Identity crisis. Nature 2009, 457, 935–936. [CrossRef] [PubMed] [Green Version]
- Masters, J.R. False cell lines: The problem and a solution. Cytotechnology 2002, 39, 69–74. [Google Scholar] [CrossRef]
- Findlay, I.; Taylor, A.; Quirke, P.; Frazier, R.; Urquhart, A. DNA fingerprinting from single cells. Nature 1997, 389, 555–556. [Google Scholar] [CrossRef]
- Arzumanian, O.I.; Poverennaya, E.V.; Kiseleva, V. The curious case of the HepG2 cell line: 40 years of expertise. Int. J. Mol. Sci. 2021, 22, 13135. [Google Scholar] [CrossRef]
- Capes-Davis, A.; Theodosopoulos, G.; Atkin, I.; Drexler, H.G.; Kohara, A.; MacLeod, R.A.F.; Masters, J.R.; Nakamura, Y.; Reid, Y.A.; Reddel, R.R.; et al. Check your cultures! A list of cross-contaminated or misidentified cell lines. Int. J. Cancer 2010, 127, 1–8. [Google Scholar] [CrossRef]
- Buehring, G.C.; Eby, E.A.; Eby, M.J. Cell line cross-contamination: How aware are Mammalian cell culturists of the problem and how to monitor it? In Vitro Cell. Dev. Biol. Anim. 2004, 40, 211–215. [Google Scholar] [CrossRef]
- Didion, J.P.; Buus, R.J.; Naghashfar, Z.; Threadgill, D.W.; Morse, H.C., 3rd; de Villena, F.P.-M. SNP array profiling of mouse cell lines identifies their strains of origin and reveals cross-contamination and widespread aneuploidy. BMC Genom. 2014, 15, 847. [Google Scholar] [CrossRef] [Green Version]
- Keerti, A.; Ninave, S. DNA fingerprinting: Use of autosomal short tandem repeats in forensic DNA typing. Cureus 2022, 14, e30210. [Google Scholar] [CrossRef]
- Chen, A.; Xiong, L.; Qu, Y.; Xi, S.; Tao, R.; Li, C.; Zhang, S. Opportunity of next-generation sequencing-based short tandem repeat system for tumor source identification. Front. Oncol. 2022, 12, 800028. [Google Scholar] [CrossRef] [PubMed]
- Faraonio, R. Oxidative stress and cell senescence process. Antioxidants 2022, 11, 1718. [Google Scholar] [CrossRef] [PubMed]
- Lettieri-Barbato, D.; Aquilano, K.; Punziano, C.; Minopoli, G.; Faraonio, R. MicroRNAs, long non-coding RNAs, and circular RNAs in the redox control of cell senescence. Antioxidants 2022, 11, 480. [Google Scholar] [CrossRef] [PubMed]
- Hayflick, L.; Moorhead, P.S. The serial cultivation of human diploid cell strains. Exp. Cell Res. 1961, 25, 585–621. [Google Scholar] [CrossRef] [PubMed]
- Shay, J.W.; Wright, W.E. Hayflick, his limit, and cellular ageing. Nat. Rev. Mol. Cell Biol. 2000, 1, 72–76. [Google Scholar] [CrossRef] [PubMed]
- Pawlikowski, J.S.; Adams, P.D.; Nelson, D.M. Senescence at a glance. J. Cell Sci. 2013, 126, 4061–4067. [Google Scholar] [CrossRef] [Green Version]
- Croxatto, A.; Prod’hom, G.; Greub, G. Applications of MALDI-TOF mass spectrometry in clinical diagnostic microbiology. FEMS Microbiol. Rev. 2012, 36, 380–407. [Google Scholar] [CrossRef]
- Demirev, P.A.; Fenselau, C. Mass spectrometry for rapid characterization of microorganisms. Annu. Rev. Anal. Chem. 2008, 1, 71–93. [Google Scholar] [CrossRef]
- Fournier, P.-E.; Drancourt, M.; Colson, P.; Rolain, J.-M.; La Scola, B.; Raoult, D. Modern clinical microbiology: New challenges and solutions. Nat. Rev. Microbiol. 2013, 11, 574–585. [Google Scholar] [CrossRef]
- Saffert, R.T.; Cunningham, S.A.; Ihde, S.M.; Jobe, K.E.M.; Mandrekar, J.; Patel, R. Comparison of Bruker Biotyper matrix-assisted laser desorption ionization-time of flight mass spectrometer to BD Phoenix automated microbiology system for identification of gram-negative bacilli. J. Clin. Microbiol. 2011, 49, 887–892. [Google Scholar] [CrossRef] [Green Version]
- Choi, Y.; Kim, D.; Choe, K.W.; Lee, H.; Kim, J.-S.; Ahn, J.-Y.; Lee, M.-K. Performance evaluation of Bruker Biotyper, ASTA MicroIDSys, and VITEK-MS and three extraction methods for filamentous fungal identification in clinical laboratories. J. Clin. Microbiol. 2022, 60, e0081222. [Google Scholar] [CrossRef] [PubMed]
- Cherkaoui, A.; Riat, A.; Renzi, G.; Fischer, A.; Schrenzel, J. Diagnostic test accuracy of an automated device for the MALDI target preparation for microbial identification. Eur. J. Clin. Microbiol. Infect. Dis. 2023, 42, 153–159. [Google Scholar] [CrossRef] [PubMed]
- Evren, E.; Göçmen, J.S.; İştar, E.H.; Yavuzdemir, Ş.; Tekeli, A.; Yavuz, Y.; Karahan, Z.C. Medically important Candida spp. identification: An era beyond traditional methods. Turk. J. Med. Sci. 2022, 52, 834–840. [Google Scholar] [CrossRef] [PubMed]
- Ding, Z.-Y.; Zou, X.-L.; Wei, Y.-Q. Cancer microenvironment and cancer vaccine. Cancer Microenviron. Off. J. Int. Cancer Microenviron. Soc. 2012, 5, 333–344. [Google Scholar] [CrossRef] [PubMed] [Green Version]
- Ohshio, Y.; Teramoto, K.; Hanaoka, J.; Tezuka, N.; Itoh, Y.; Asai, T.; Daigo, Y.; Ogasawara, K. Cancer-associated fibroblast-targeted strategy enhances antitumor immune responses in dendritic cell-based vaccine. Cancer Sci. 2015, 106, 134–142. [Google Scholar] [CrossRef]
- Shintani, Y.; Kimura, T.; Funaki, S.; Ose, N.; Kanou, T.; Fukui, E. Therapeutic targeting of cancer-associated fibroblasts in the non-small cell lung cancer tumor microenvironment. Cancers 2023, 15, 335. [Google Scholar] [CrossRef]
- Mao, X.; Xu, J.; Wang, W.; Liang, C.; Hua, J.; Liu, J.; Zhang, B.; Meng, Q.; Yu, X.; Shi, S. Crosstalk between cancer-associated fibroblasts and immune cells in the tumor microenvironment: New findings and future perspectives. Mol. Cancer 2021, 20, 131. [Google Scholar] [CrossRef]
- Wong, K.Y.; Cheung, A.H.-K.; Chen, B.; Chan, W.N.; Yu, J.; Lo, K.W.; Kang, W.; To, K.F. Cancer-associated fibroblasts in nonsmall cell lung cancer: From molecular mechanisms to clinical implications. Int. J. Cancer 2022, 151, 1195–1215. [Google Scholar] [CrossRef]
- Balashova, E.E.; Dashtiev, M.I.; Lokhov, P.G. Proteomic footprinting of drug-treated cancer cells as a measure of cellular vaccine efficacy for the prevention of cancer recurrence. Mol. Cell. Proteom. 2012, 11, M111.014480. [Google Scholar] [CrossRef] [Green Version]
- Fidler, I.J. The pathogenesis of cancer metastasis: The “seed and soil” hypothesis revisited. Nat. Rev. Cancer 2003, 3, 453–458. [Google Scholar] [CrossRef]
- Lu, Y.; Wei, Y.; Tian, L.; Zhao, X.; Yang, L.; Hu, B.; Kan, B.; Wen, Y.; Liu, F.; Deng, H.; et al. Immunogene therapy of tumors with vaccine based on xenogeneic epidermal growth factor receptor. J. Immunol. 2003, 170, 3162–3170. [Google Scholar] [CrossRef] [PubMed] [Green Version]
- Liotta, L.A.; Kohn, E.C. The microenvironment of the tumour-host interface. Nature 2001, 411, 375–379. [Google Scholar] [CrossRef]
- Olumi, A.F.; Grossfeld, G.D.; Hayward, S.W.; Carroll, P.R.; Tlsty, T.D.; Cunha, G.R. Carcinoma-associated fibroblasts direct tumor progression of initiated human prostatic epithelium. Cancer Res. 1999, 59, 5002–5011. [Google Scholar] [CrossRef] [PubMed]
- Glabman, R.A.; Choyke, P.L.; Sato, N. Cancer-associated fibroblasts: Tumorigenicity and targeting for cancer therapy. Cancers 2022, 14, 3906. [Google Scholar] [CrossRef] [PubMed]
- Lü, Z.F.; Cai, S.Q.; Wu, J.J.; Zheng, M. Biological characterization of cultured dermal papilla cells and hair follicle regeneration in vitro and in vivo. Chin. Med. J. 2006, 119, 275–281. [Google Scholar] [CrossRef]
- Zuk, P.A.; Zhu, M.; Mizuno, H.; Huang, J.; Futrell, J.W.; Katz, A.J.; Benhaim, P.; Lorenz, H.P.; Hedrick, M.H. Multilineage cells from human adipose tissue: Implications for cell-based therapies. Tissue Eng. 2001, 7, 211–288. [Google Scholar] [CrossRef] [PubMed] [Green Version]
- Morimoto, N.; Saso, Y.; Tomihata, K.; Taira, T.; Takahashi, Y.; Ohta, M.; Suzuki, S. Viability and function of autologous and allogeneic fibroblasts seeded in dermal substitutes after implantation. J. Surg. Res. 2005, 125, 56–67. [Google Scholar] [CrossRef] [Green Version]
- Lokhov, P.G.; Balashova, E.E. Antigenic essence: Upgrade of cellular cancer vaccines. Cancers 2021, 13, 774. [Google Scholar] [CrossRef]
- Uldry, E.; Faes, S.; Demartines, N.; Dormond, O. Fine-tuning tumor endothelial cells to selectively kill cancer. Int. J. Mol. Sci. 2017, 18, 1401. [Google Scholar] [CrossRef] [Green Version]
- Algire, G.H.; Chalkley, H.W.; Legallais, F.Y.; Park, H.D. Vasculae reactions of normal and malignant tissues in vivo. I. vascular reactions of mice to wounds and to normal and neoplastic transplants. J. Natl. Cancer Inst. 1945, 6, 73–85. [Google Scholar] [CrossRef]
- Boehm, T.; Folkman, J.; Browder, T.; O’Reilly, M.S. Antiangiogenic therapy of experimental cancer does not induce acquired drug resistance. Nature 1997, 390, 404–407. [Google Scholar] [CrossRef] [PubMed]
- Folkman, J. Tumor angiogenesis: Therapeutic implications. N. Engl. J. Med. 1971, 285, 1182–1186. [Google Scholar] [PubMed]
- Folkman, J. What is the evidence that tumors are angiogenesis dependent? J. Natl. Cancer Inst. 1990, 82, 4–6. [Google Scholar] [CrossRef] [PubMed] [Green Version]
- Pluda, J.M. Tumor-associated angiogenesis: Mechanisms, clinical implications, and therapeutic strategies. Semin. Oncol. 1997, 24, 203–218. [Google Scholar] [PubMed]
- Carmeliet, P.; Jain, R.K. Angiogenesis in cancer and other diseases. Nature 2000, 407, 249–257. [Google Scholar] [CrossRef]
- Aird, W.C. Phenotypic heterogeneity of the endothelium: I. Structure, function, and mechanisms. Circ. Res. 2007, 100, 158–173. [Google Scholar] [CrossRef] [Green Version]
- Aird, W.C. Phenotypic heterogeneity of the endothelium: II. Representative vascular beds. Circ. Res. 2007, 100, 174–190. [Google Scholar] [CrossRef] [Green Version]
- Khodarev, N.N.; Yu, J.; Labay, E.; Darga, T.; Brown, C.K.; Mauceri, H.J.; Yassari, R.; Gupta, N.; Weichselbaum, R.R. Tumour-endothelium interactions in co-culture: Coordinated changes of gene expression profiles and phenotypic properties of endothelial cells. J. Cell Sci. 2003, 116, 1013–1022. [Google Scholar] [CrossRef] [Green Version]
- Bhati, R.; Patterson, C.; Livasy, C.A.; Fan, C.; Ketelsen, D.; Hu, Z.; Reynolds, E.; Tanner, C.; Moore, D.T.; Gabrielli, F.; et al. Molecular characterization of human breast tumor vascular cells. Am. J. Pathol. 2008, 172, 1381–1390. [Google Scholar] [CrossRef] [Green Version]
- St Croix, B.; Rago, C.; Velculescu, V.; Traverso, G.; Romans, K.E.; Montgomery, E.; Lal, A.; Riggins, G.J.; Lengauer, C.; Vogelstein, B.; et al. Genes expressed in human tumor endothelium. Science 2000, 289, 1197–1202. [Google Scholar] [CrossRef]
- Yun, C.; Nolan, K.; Beecham, E.; Reisfeld, R.; Junghans, P. Targeting of T lymphocytes to melanoma cells through chimeric anti-GD3 immunoglobulin T-Cell receptors. Neoplasia 2000, 2, 449–459. [Google Scholar] [CrossRef] [PubMed] [Green Version]
- Balashova, E.E.; Lokhov, P.G. Proteolytically-cleaved fragments of cell-surface proteins from live tumor cells stimulate anti-tumor immune response in vitro. J. Carcinog. Mutagen. 2010, 1, 1–3. [Google Scholar] [CrossRef]
- Tsuchida, S.; Umemura, H.; Nakayama, T. Current status of matrix-assisted laser desorption/ionization-time-of-flight mass spectrometry (MALDI-TOF MS) in clinical diagnostic microbiology. Molecules 2020, 25, 4775. [Google Scholar] [CrossRef]
- Meher, A.K.; Chen, Y.-C. Electrospray modifications for advancing mass spectrometric analysis. Mass Spectrom. 2017, 6, S0057. [Google Scholar] [CrossRef] [PubMed] [Green Version]
- Kumar, M.; Bhatia, R.; Rawal, R.K. Applications of various analytical techniques in quality control of pharmaceutical excipients. J. Pharm. Biomed. Anal. 2018, 157, 122–136. [Google Scholar] [CrossRef] [PubMed]


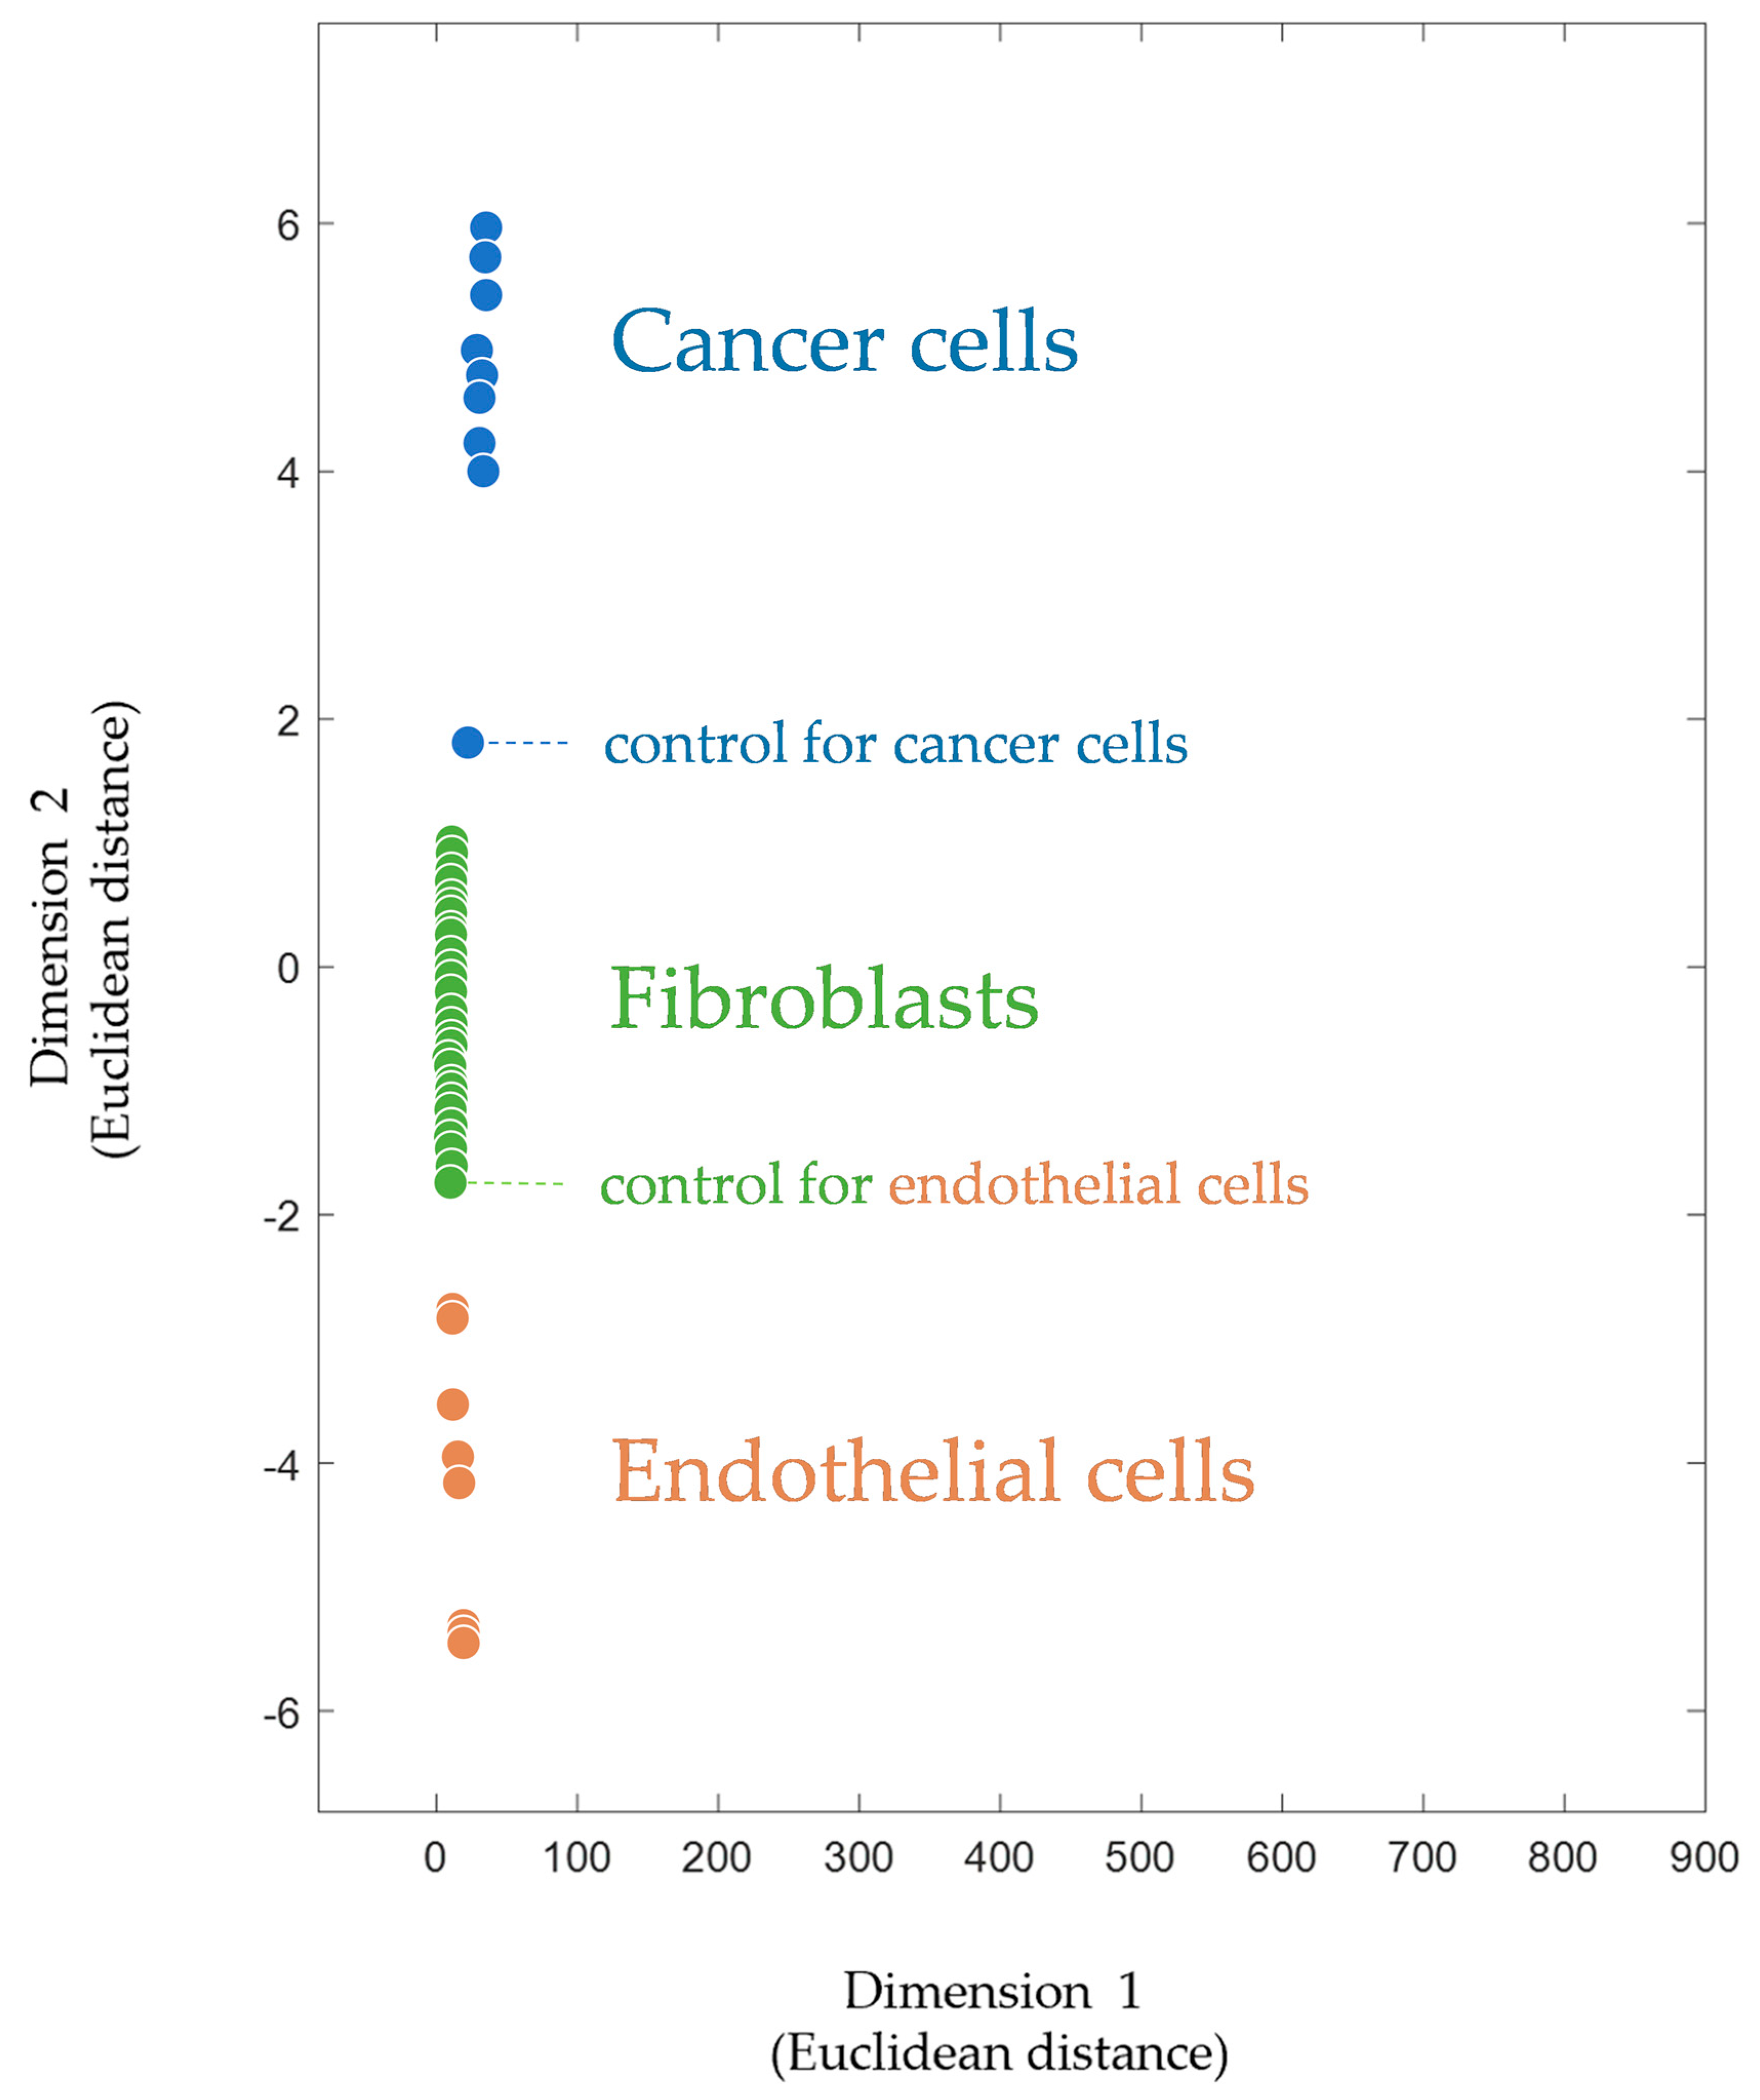
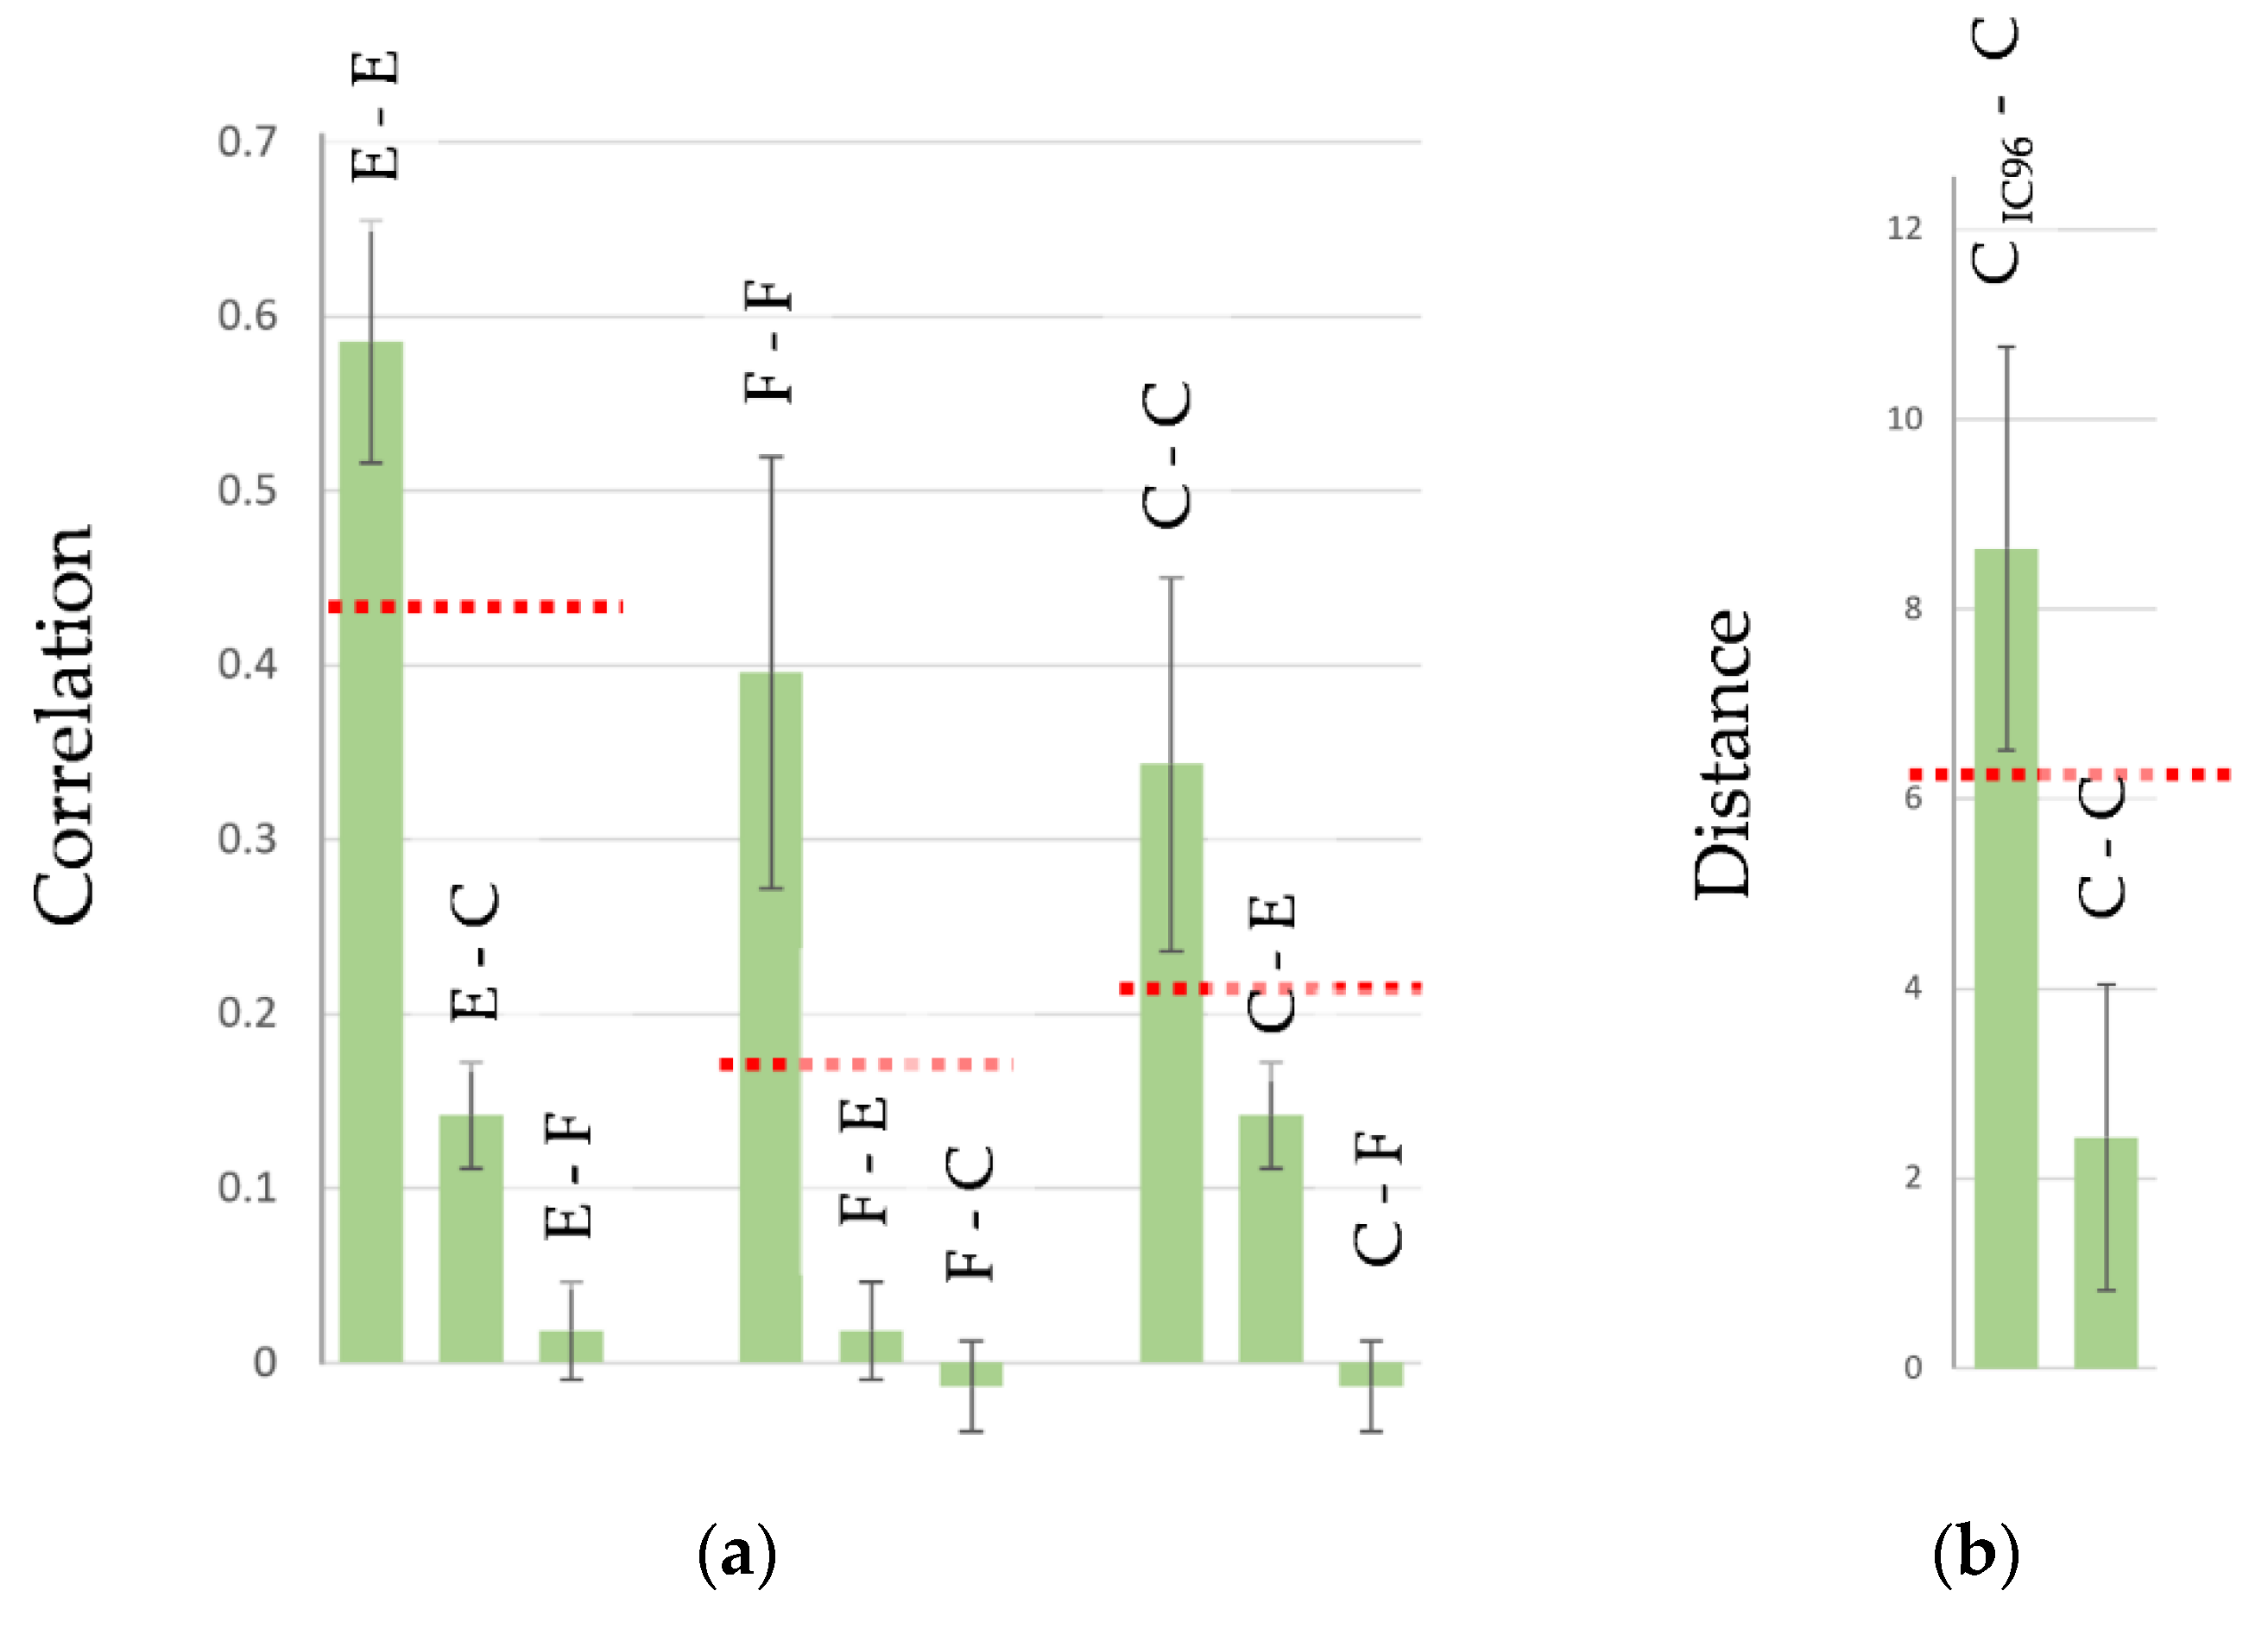
 ) are taken from [31] and correspond to primary cultures of human microvascular endothelial cells (HMECs) with native and tumor-induced phenotypes and from different donors. Footprints of fibroblasts (
 ) are taken from [46] and correspond to primary cultures of human fibroblasts with different origins. Footprints of cancer cells (
 ) are taken from [80] and correspond to different cancer cell lines, both untreated and drug-treated. The footprints for this plot as well as the script (for Matlab software, MathWorks, Natick, MA, USA) for their processing are provided in the Supplementary Materials.
) are taken from [31] and correspond to primary cultures of human microvascular endothelial cells (HMECs) with native and tumor-induced phenotypes and from different donors. Footprints of fibroblasts () are taken from [46] and correspond to primary cultures of human fibroblasts with different origins. Footprints of cancer cells () are taken from [80] and correspond to different cancer cell lines, both untreated and drug-treated. The footprints for this plot as well as the script (for Matlab software, MathWorks, Natick, MA, USA) for their processing are provided in the Supplementary Materials.
) are taken from [80] and correspond to different cancer cell lines, both untreated and drug-treated. The footprints for this plot as well as the script (for Matlab software, MathWorks, Natick, MA, USA) for their processing are provided in the Supplementary Materials.
) are taken from [31] and correspond to primary cultures of human microvascular endothelial cells (HMECs) with native and tumor-induced phenotypes and from different donors. Footprints of fibroblasts () are taken from [46] and correspond to primary cultures of human fibroblasts with different origins. Footprints of cancer cells () are taken from [80] and correspond to different cancer cell lines, both untreated and drug-treated. The footprints for this plot as well as the script (for Matlab software, MathWorks, Natick, MA, USA) for their processing are provided in the Supplementary Materials.


| Cells | Sensitivity (%) | Specificity (%) | Accuracy (%) | AUC |
|---|---|---|---|---|
| ECs versus non-ECs 1 | 100.0 | 100.0 | 100.0 | 1.00 |
| Cancer cells versus non-cancer cells 2 | 100.0 | 96.4 | 96.7 | 0.998 |
| Fibroblasts versus non-fibroblasts 3 | 98.9 | 98.8 | 98.9 | 0.9996 |
| Cells Subpopulations | Sensitivity (%) | Specificity (%) | Accuracy (%) | AUC |
|---|---|---|---|---|
| Cancer cells [IC96Etop, IC96Etop twice] versus [Untr, IC50Etop, IC50Etop twice, IC96Etop, IC96Dox, IC96Tmx] 1,2 | 100.0 | 90.0 | 95.0 | 0.99 |
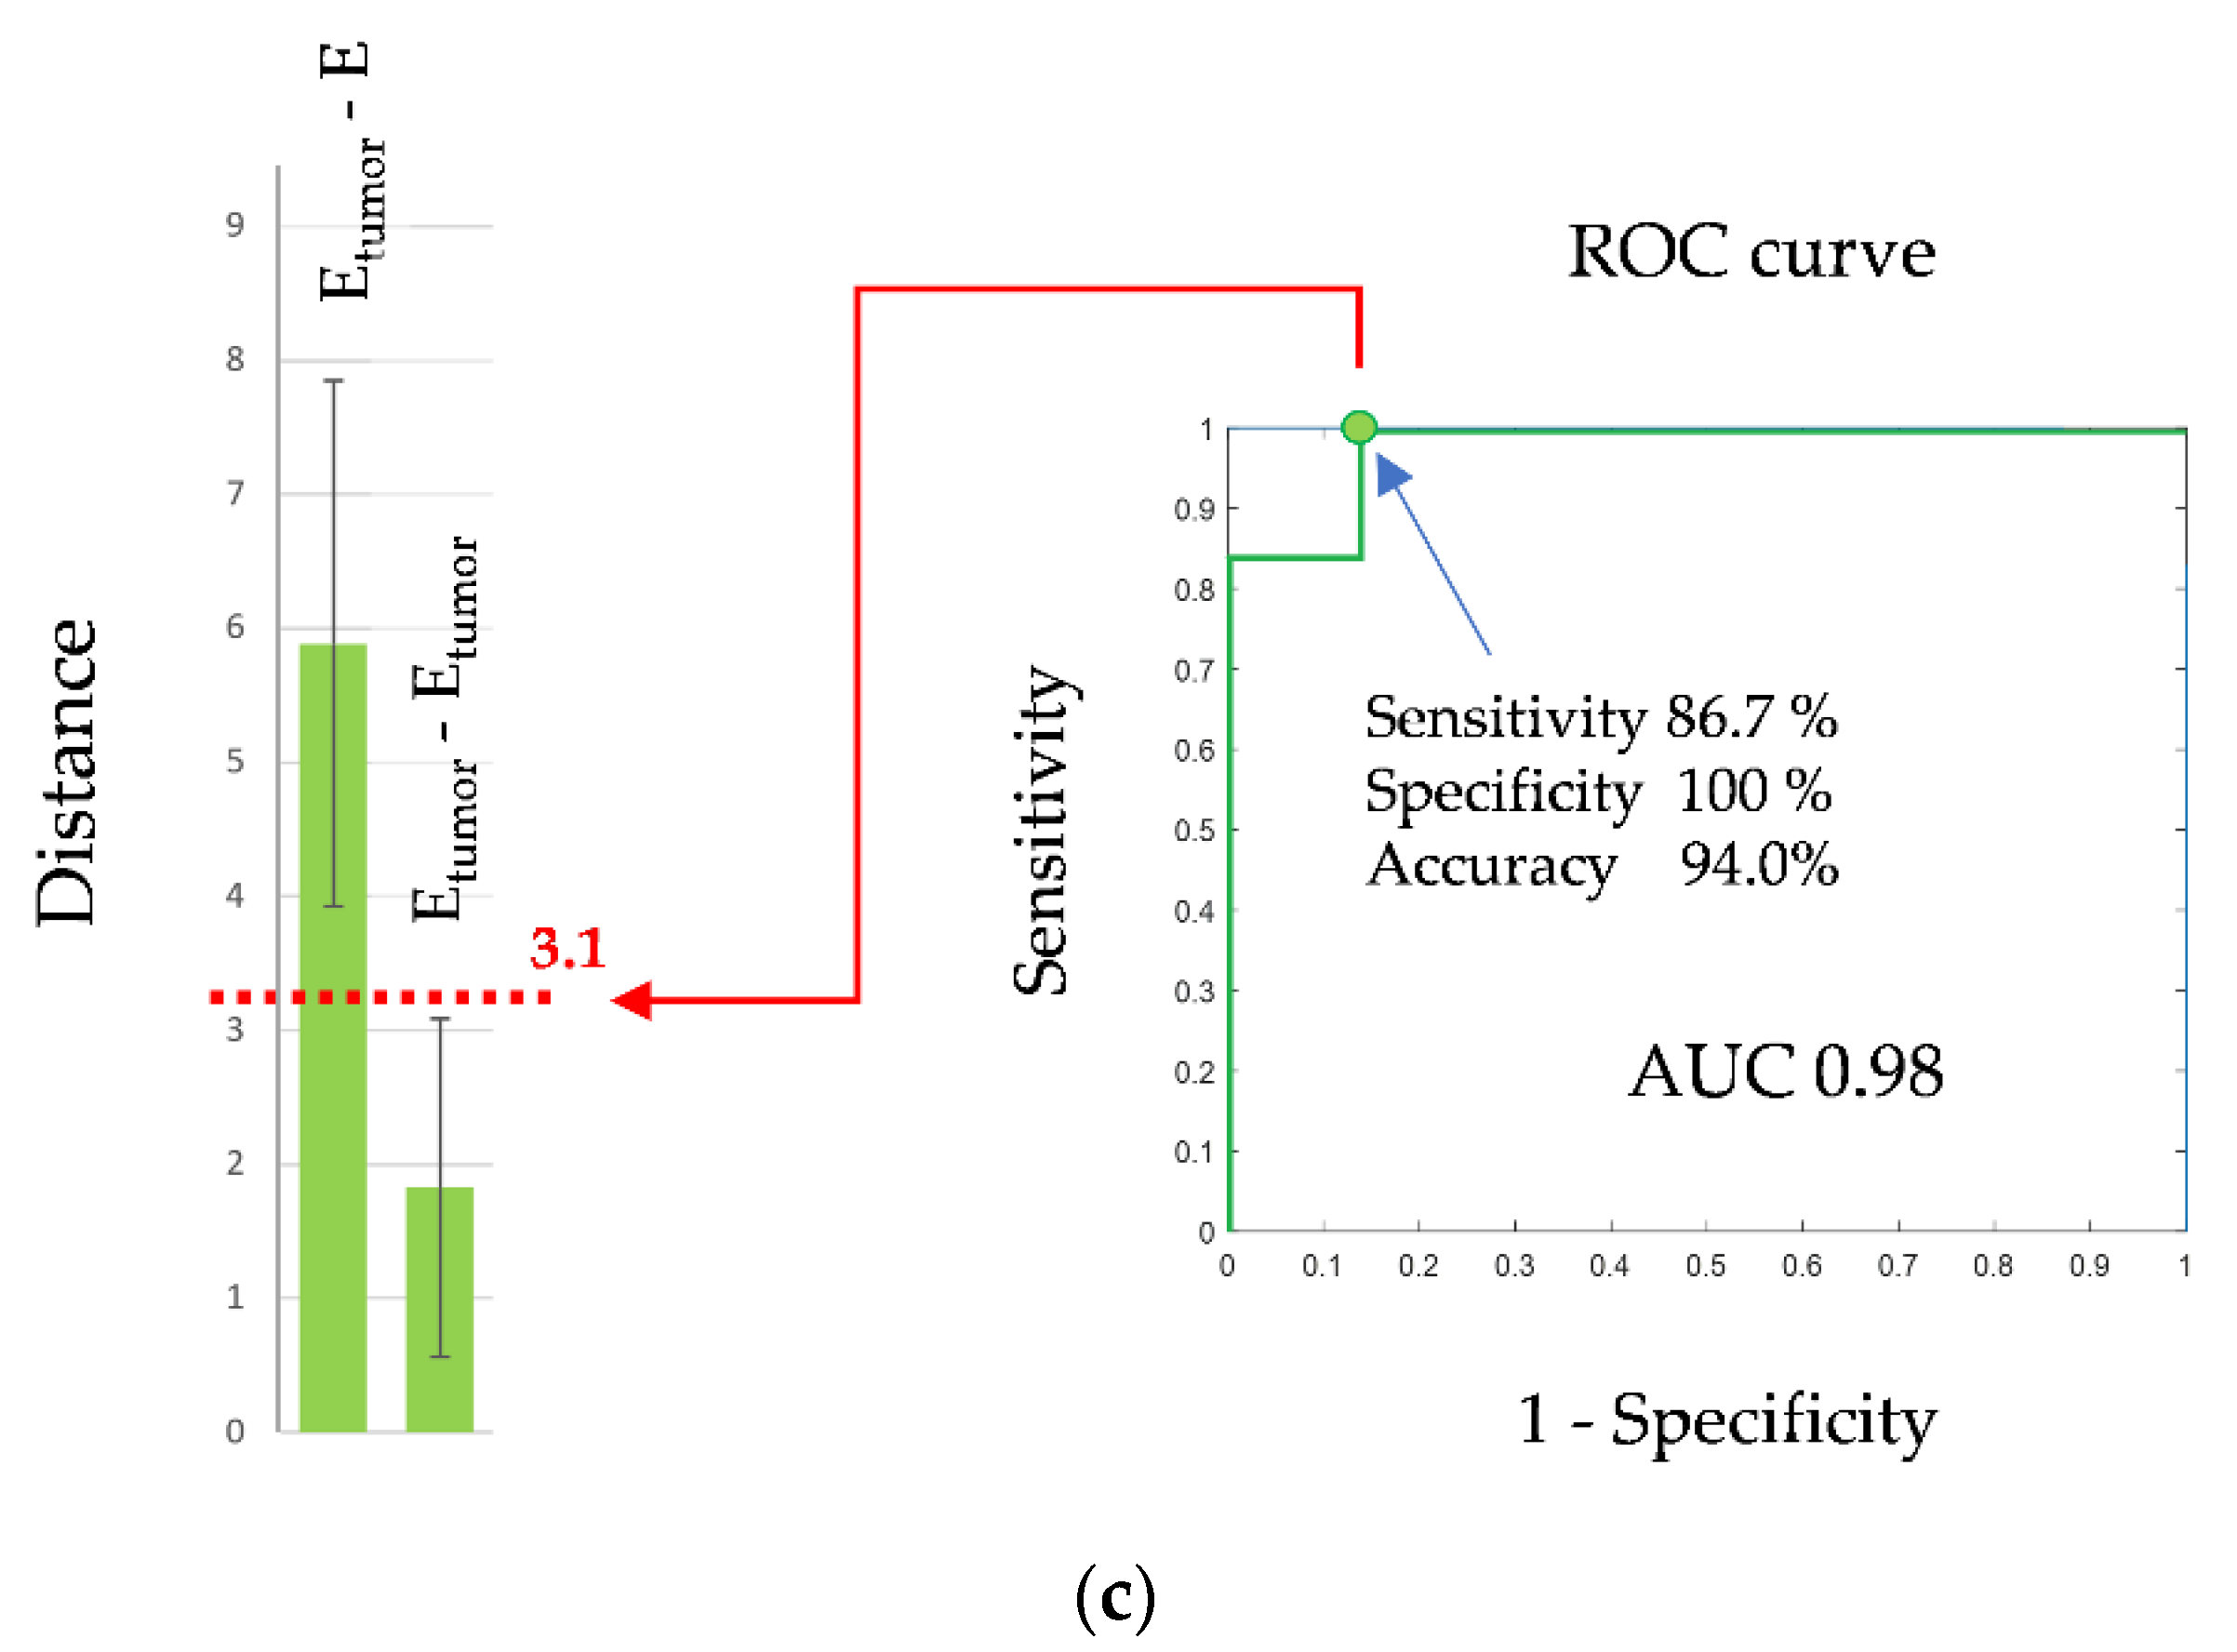
| ECs versus tumor-stimulated ECs 3 | 86.7 | 100.0 | 94.0 | 0.98 |
| Adipose fibroblasts versus skin fibroblasts | 100.0 | 100.0 | 100.0 | 1.00 |
| Skin fibroblasts versus dermal papilla fibroblasts | 94.4 | 66.7 | 68.8 | 0.87 |
| Dermal papilla fibroblasts versus adipose fibroblasts | 83.3 | 83.3 | 83.3 | 0.89 |
| # | Control Sample | Data Provided by the Mass Spectrum of the Sample |
|---|---|---|
| 1 | Blank (mass spectrum of DHB matrix with HBSS and without any peptides). | A list of irrelevant mass peaks (from solution and DHB matrix) that are subtracted from the cell proteomic footprints. |
| 2 | Solution of proteomics-grade trypsin (concentration of 0.2 μg/mL in HBSS; the sample is incubated for 20 min at 37 °C and a minimum volume of 10% acetic acid is added to acidify the solution and terminate the action of trypsin). | A list of mass peaks related to trypsin (trypsin autolysis products). The list allows for the detection of trypsin peaks in the mass spectrum to remove them from the proteomic footprint. Well-known peptides related to autolysis products can be used for the calibration of mass spectra. This list of mass peaks is obtained for each used lot of trypsin preparation. |
| 3 | Culture medium with supplements (e.g., FBS and/or other supplements). | A list of mass peaks related to culture medium with FBS. The list of mass peaks is obtained once for each FBS lot used. |
| 4 | Proteomics-grade trypsin (0.2 μg/mL) incubated in a culture medium with supplements (20 min, 37 °C). | A list of mass peaks related to proteolytic peptides from culture medium supplements (e.g., FBS). The list of mass peaks is obtained once for each FBS lot used. |
| 5 | Cells were frozen and thawed three times before being centrifuged at 600 g for five minutes. | A list of mass peaks related to sample contamination with intracellular content. The list is obtained once for each cell’s lot. |
| 6 | Sample #5 was incubated with proteomics-grade trypsin (20 min, 37 °C; trypsin 0.2 μg/mL). | A list of mass peaks related to sample contamination with intracellular content. The list is obtained once for each cell’s lot. |
| QC Test | Failed Specification | Sources of Variation | Impact of Variation on the Process and Product Attributes | Control of the Variation |
|---|---|---|---|---|
| Cell authentication using CPF. The test can be used after isolating the cells (if applicable), after establishing cell culture (if applicable), after initiating cell culture from a cell bank, while cultivating the cells, and during final product release testing. | Cell death during treatment with trypsin (more than 1%). | Cell damage via trypsin and/or fluid shearing. The sample for CPF is contaminated with intracellular content. | Leads to a cell proteomic footprint contaminated with intracellular content. CPF results are not accepted. The cell product cannot be qualified for use. | 1. To exclude cell damage that occurs as a result of protease treatment, another lot of trypsin should be used. If no effect is observed, trypsin can be used with a higher activity than that used (with a proportional dilution). 2. To minimize cell destruction by fluid shearing, careful cell manipulation can be used and the protocol can be optimized accordingly. As a last resort, the use of cytoprotective agents can be considered at the cell wash stage to decrease cell damage [38]. Importantly, cytoprotectants are polymers; therefore, they should not contaminate the analyzed trypsin solution, as they will interfere with peptide peaks in the mass spectrum. |
| Authentication of cells based on CPF results. | The misidentification of cells. | Cell-based products cannot be produced. | 1. Cells must be disposed of, and their storage and incubation sites (hoods), manipulation sites (laminar systems), and reusable instruments must be sterilized. 2. The cell culture must be recovered from stock in the master or the working cell bank. 3. The possible contact of cells with other cell types at the manufacturing site should be avoided. 4. The cell culture process should be rechecked to reduce the risk the cells becoming recontaminated. | |
| Cross-contamination of cells with other mammalian cells. | Leads to less purity in the cell-based product. In the case of a cancer vaccine, the vaccine becomes unusable due to the increased content of non-target antigens. | |||
| CPF is carried out incorrectly. | The product cannot be qualified for use. | The source of variation should be defined in the sample preparation, mass spectrometry, and data treatment of CPF. For this, the control samples (Table 3) should be used. | ||
| The sample for CPF is contaminated by peptides that originate from culture medium proteins (e.g., from fetal bovine serum). | Cells are not qualified for producing cell products. | 1. The source of variation should be verified using the control mass spectra (Table 3). 2. When the sample is contaminated with peptides that originate from culture medium (e.g., from fetal bovine serum), improved cell washing with Hanks’ balanced salt solution (HBSS) is required before the cells are treated with trypsin. If the problem persists, the addition of one more HBSS wash cycle should be considered. | ||
| Cells do not have the required a molecular phenotype. | Cells are not qualified for producing cell products. | 1. Cells should be disposed of, or, if possible, the required molecular phenotype should be induced. 2. The manufacturing process should be adjusted to produce cells with the required molecular phenotype. |
Disclaimer/Publisher’s Note: The statements, opinions and data contained in all publications are solely those of the individual author(s) and contributor(s) and not of MDPI and/or the editor(s). MDPI and/or the editor(s) disclaim responsibility for any injury to people or property resulting from any ideas, methods, instructions or products referred to in the content. |
© 2023 by the authors. Licensee MDPI, Basel, Switzerland. This article is an open access article distributed under the terms and conditions of the Creative Commons Attribution (CC BY) license (https://creativecommons.org/licenses/by/4.0/).
Share and Cite
Lokhov, P.G.; Balashova, E.E.; Trifonova, O.P.; Maslov, D.L.; Archakov, A.I. Cell Proteomic Footprinting: Advances in the Quality of Cellular and Cell-Derived Cancer Vaccines. Pharmaceutics 2023, 15, 661. https://doi.org/10.3390/pharmaceutics15020661
Lokhov PG, Balashova EE, Trifonova OP, Maslov DL, Archakov AI. Cell Proteomic Footprinting: Advances in the Quality of Cellular and Cell-Derived Cancer Vaccines. Pharmaceutics. 2023; 15(2):661. https://doi.org/10.3390/pharmaceutics15020661
Chicago/Turabian StyleLokhov, Petr G., Elena E. Balashova, Oxana P. Trifonova, Dmitry L. Maslov, and Alexander I. Archakov. 2023. "Cell Proteomic Footprinting: Advances in the Quality of Cellular and Cell-Derived Cancer Vaccines" Pharmaceutics 15, no. 2: 661. https://doi.org/10.3390/pharmaceutics15020661