Systematic Review

Is a Lower Dose of Rivaroxaban Required for Asians? A Systematic Review of a Population Pharmacokinetics and Pharmacodynamics Analysis of Rivaroxaban

1
Department of Pharmacy, Shanghai Chest Hospital, Shanghai Jiao Tong University, Shanghai 200030, China
2
Department of Pharmacy, Huashan Hospital, Fudan University, Shanghai 200437, China
*
Author to whom correspondence should be addressed.
Pharmaceutics 2023, 15(2), 588; https://doi.org/10.3390/pharmaceutics15020588
Submission received: 4 December 2022 / Revised: 18 January 2023 / Accepted: 26 January 2023 / Published: 9 February 2023

Abstract

:
Rivaroxaban has been widely used to prevent and treat various thromboembolic diseases for more than a decade. However, whether a lower dose of rivaroxaban is required for Asians is still debatable. This review aimed to explore the potential ethnic difference in pharmacokinetic/pharmacodynamic (PK/PD) characteristics between Asians and Caucasians. A systematic search was conducted and twenty-four studies were identified, of which 10 were conducted on Asian adults, 11 on predominantly Caucasian adults, and 3 on Caucasian pediatrics. The apparent clearance (CL/F) of rivaroxaban in Caucasian adults with non-valvular atrial fibrillation (6.45–7.64 L/h) was about 31–43% higher than that in Asians (4.46–5.98 L/h) taking 10~20 mg rivaroxaban every 24 h. Moreover, there was no obvious difference in CL/F among Japanese, Chinese, Thai, and Irani people. Regarding PK/PD relationship, prothrombin time was linked to rivaroxaban concentration in a linear or near-linear manner, and Factor Xa activity was linked with the Emax model. The exposure–response relationship was comparable between Asians and Caucasians. Renal function has a significant influence on CL/F, and no covariate was recognized for exposure–response relationship. In conclusion, a lower dose of rivaroxaban might be required for Asians, and further studies are warranted to verify this ethnic difference to facilitate optimal dosing regimens.

1. Introduction

Rivaroxaban is one of the most commonly used direct oral anticoagulants (DOACs) for the management of several thromboembolic disorders, such as deep vein thrombosis, pulmonary embolism, non-valvular atrial fibrillation (NVAF), and acute coronary syndrome (ACS) [1]. It has also been approved for the treatment and reduction of the recurrence risk of venous thromboembolism (VTE) in children [2,3].
Following oral administration, rivaroxaban is rapidly absorbed and reaches a peak concentration within 2–4 h [4]. The bioavailability of rivaroxaban is dose-dependent, reaching 80–100%, without being affected by food, upon the oral administration of 2.5–10 mg tablets. However, bioavailability is decreased by 34% in healthy subjects when it is administered as 20 mg tablets under fasting conditions [4,5]. The plasma protein binding for rivaroxaban is approximately 92–95%. Further, the clearance (CL) of rivaroxaban is a dual pathway: approximately 2/3 of rivaroxaban is metabolized by hepatic cytochrome P450 (CYP) enzymes 3A4/5, 2J2, and CYP-independent enzymes, while the remaining 1/3 is eliminated unchanged via the kidney, involving transporters in active renal secretion such as P-glycoprotein (P-pg) and breast cancer resistance protein (BCRP) [4,6]. The anticoagulant effect of rivaroxaban is regarded as the direct inhibition of free and clot-bound Factor Xa (FXa). Rivaroxaban could also prolong prothrombin time (PT) and activated partial thromboplastin time (aPTT) [4,7].
A dosing regimen of 20 mg q24h was approved for patients with NVAF according to global clinical trials [8]. Meanwhile, a dosing regimen of 15 mg q24h was approved for Japanese patients [9]. Although the recommended dosing regimen for other Asians with NVAF, such as Chinese, South Korean, and Thai patients, was determined as 20 mg q24h, some studies recently found that a dose lower than that recommended might have the same efficacy and be safer for Asians [10,11,12]. Although rivaroxaban has been widely used for more than 10 years worldwide, the factors that account for this discrepancy remain unknown [13]. Moreover, whether Asians actually require a lower dose of rivaroxaban, compared to that for Caucasians, to achieve similar efficacy and safety is still debatable.
Some factors were assessed in terms of whether they influence the pharmacokinetics (PK) and pharmacodynamics (PD) of rivaroxaban during clinical development. Only renal function was found to have a notable impact on the CL of rivaroxaban, and dose regimens in patients with NVAF should be adjusted accordingly [8]. Because patients in the real world could be different from those treated during clinical trials, it is not clear whether there are any other factors affecting the PK/PD of rivaroxaban.
The population approach is widely used to identify the pathophysiological factors that cause changes in the dose–exposure–response relationship and, accordingly, if dose adjustment is required. Terrier et al. [14] reviewed the effect of covariates on exposure to rivaroxaban [14], but they did not assess the difference in PK/PD among various ethnicities. Moreover, several population PK and PK/PD studies in Asians were reported to identify significant covariates based on CL in recent years. Thus, this review aimed to (i) explore the potential ethnic differences in the PK/PD of rivaroxaban between Asian and Caucasian populations and (ii) summarize the covariates affecting the PK/PD of rivaroxaban.

2. Methods

2.1. Study Identification

Population PK and PK/PD studies of rivaroxaban were systematically searched in the PubMed, Embase, and Web of Science databases from inception through 31 August 2022. The following search terms were employed: “rivaroxaban”, and “population pharmacokinetic”, or “pharmacokinetic model*”, “pharmacokinetic and pharmacodynamic”, “pharmacokinetic/pharmacodynamic”, “pharmacokinetic-pharmacodynamic”, “nonlinear mixed effect”, “NONMEM”, “WinNonMix”, “MONOLIX”, “Pmetrics”, “ADAPT”, “P-PHARM”, “nlmixed”, “NLME”, or “USC PACK.” The reference lists of the included articles were also checked. A literature search was performed by two independent authors and inspected by a third author.
All published population PK and PK/PD models of rivaroxaban were included if they met the following criteria: (i) study population: patients or healthy subjects, (ii) treatment with rivaroxaban as the studied drug, and (iii) data analysis: population PK or population PK/PD analysis.
Articles were excluded if they met the following criteria: (i) they were reviews, conference abstracts, or focused on methodology/algorithm/software, (ii) they were not published in the English language, or (iii) they did not provide sufficient information on the methodology and population PK or population PK/PD model.

2.2. Reporting Quality

According to the previous guidelines established by Kanji et al. [15] and Jamsen et al. [16], a 30-item checklist was developed to evaluate literature quality, with information to be included when reporting a transparent and accurate clinical PK/PD study. If an item in the checklist was reported in the study, 1 point was counted in the scoring item; otherwise, no point was counted. The total score for each study was calculated and shown as a percentage, which was defined as the compliance rate.

2.3. Data Extraction

The following information was extracted from the identified articles: (i) characteristics and demographics of the study population (e.g., patients/healthy subjects, age, body weight (BW), sex, and renal and hepatic function); (ii) study design (e.g., study type, number of included subjects, dosing regimens, sampling design, and bioassay method used); and (iii) information on population PK or population PK/PD analyses (e.g., structural model, statistical model, parameter estimates, covariates, model evaluation approaches, and model application).

2.4. Comparison of Studies

The study characteristics, population PK, and population PK/PD analyses were summarized in a tabular format. The visual predictive distributions (VPDs) of the concentration-time and PD biomarker-time profiles at steady state were generated via Monte Carlo simulations based on reported population PK/PD models from each study [17]. A total of 1000 virtual patients were simulated for each scenario. All simulations were performed using NONMEM software (version 7.5; ICON Development Solutions, Ellicott City, MD, USA).
The effects of the included covariates on the PK parameters and PD metrics were assessed using forest plots. Continuous covariates, such as age, BW, and serum creatinine (SCr) level, were scaled to the same range. In contrast, binary covariates such as sex were expressed as 0 and 1. The upper and lower limits of the parameters were estimated based on the range of the corresponding covariates. Each range was normalized to the median value in each model. Therefore, the effect of each covariate can be shown as a range of the limit to the median value, as follows (Equation (1)):
effect   of   covariate   ( i )   in   model   ( j ) = e s t i m a t e d   r a n g e   o f   p a r a m e t e r   ( k ) m e d i a n   v a l u e   o f   p a r a m e t e r   ( k )   i n   m o d e l   ( j ) × 100 %
Data were analyzed and plotted using R software (version 4.2.1; www.r-project.org; accessed on 1 September 2022).

3. Results

3.1. Study Identification

A total of 353 publications were initially selected from the PubMed, EMBASE, and Web of Science databases, of which 167 were excluded after screening. After a full-text review, 23 studies were deemed eligible. One additional study was identified from the reference list of the included studies [18]; hence, a total of 24 articles published between 2007 and 2022 were retained. A PRISMA diagram is shown in Figure S1.

3.2. Reporting Quality

The 30-item checklist and corresponding analysis outcomes of each study are shown in Table S1. The range of compliance in the included studies was 43.3–93.3%, with a median compliance of 80.8%. The compliance in 18 of the 24 studies was greater than or equal to 80%. Moreover, there was no obvious difference in compliance between studies published before or after publishing the guidelines [15,16] (81.7% vs. 80.3%).

3.3. Study Characteristics

3.3.1. Basic Characteristics

All 24 studies included were prospective, and each of their characteristics is listed in Table 1. Two studies involved healthy adult subjects [19,20], nineteen studies included adult patients [18,21,22,23,24,25,26,27,28,29,30,31,32,33,34,35,36,37,38], and three studies were conducted on pediatric patients [39,40,41]. Ten studies (41.7%) were from the Asians, including Japanese (n = 4), Chinese (n = 4), Thai (n = 1), and Iranian population (n = 1), the study cohorts of which were almost all patients with NVAF [18,20,25,26,30,34,35,36,37,38]. Fourteen studies were conducted on population of multiple ethnicities, which were all or predominantly Caucasians [19,21,22,23,24,27,28,29,31,32,33,39,40,41]. Twelve studies (50%) developed a model with data from phase I, II, or III clinical trials [19,21,22,23,24,25,26,27,29,31,39,40,41], while the remaining studies enrolled subjects from real-world clinical settings [18,20,28,30,32,33,34,35,36,37,38].
Zhang et al. [29] combined data from the studies by Mueck et al. [23] and Girgis et al. [27]. Willmann et al. pooled data from five previous studies by Mueck et al. [21,22,23], Xu et al. [24], and Girgis et al. [27]. The study by Speed et al. [33] applied the data obtained in study by Barsam et al. [28] and enrolled additional patients to ensure a greater sample set.
In most studies, population analysis was performed using the NONMEM software. Two used Phoenix NLME software [18,30], while one study used Monolix software [38].

3.3.2. Population Pharmacokinetic Models

The final population PK parameters of the included studies are presented in Table 2. Nineteen studies (79.2%) described the PK of rivaroxaban using a one-compartment model, whereas the other five used a two-compartment model [19,20,39,40,41]. Twenty-two studies (91.7%) described the process of first-order absorption and elimination, while one study employed sequential zero-order and first-order absorption [20], and another study employed the lag time on absorption [19]. The plasma concentration of rivaroxaban was measured using high-performance liquid chromatography with tandem mass spectrometry (n = 19) [19,20,21,22,23,24,25,26,27,29,30,31,34,35,36,37,39,40,41] or anti-Xa assays (n = 5) [18,28,32,33,35].

3.3.3. Population Pharmacokinetic-Pharmacodynamic Models

Thirteen studies developed population PK/PD models of rivaroxaban, which linked the plasma concentration of rivaroxaban to response, including parameters such as PT (n = 13) [19,20,21,22,23,24,25,26,27,30,32,34,38], FXa activity (n = 4) [19,22,26,27], anti-Xa activity (n = 2) [20,38], aPTT (n = 4) [19,26,32,38], Heptest (n = 2) [19,26], and prothrombinase-induced clotting time (PiCT, n = 1) [27].
PT was measured using various thromboplastin reagents in different studies. It was correlated with rivaroxaban concentration in either a linear (Equations (2) and (3)) or near-linear relationship (Equations (4) and (5)):
M = M 0 + s l o p e × C p
M = M 0 + s l o p e × log ( C p )
M = M 0 + s l o p e × C p 1 H i l l × C p
M = M 0 + s l o p e × C p H i l l
where M represents the measurement of PT (APTT, Heptest, or PiCT), M0 represents the baseline of PT (APTT, Heptest, or PiCT), slope represents the change in PT (APTT, Heptest, or PiCT) per unit rivaroxaban concentration change, Cp represents the plasma concentration of rivaroxaban, and Hill represents the exponent of rivaroxaban concentration.
FXa activity was measured directly using a two-step photometric assay [19,22,26] or expressed as a percentage change compared with the control plasma [27]. It was linked to the rivaroxaban concentration with an Emax or sigmoid Emax model, as shown in Equations (6)–(8):
Table 1. Study characteristics.
Study (Year)Study
Type
Country/RaceStudy
Population
No. of Subjects
(M/F)
No. of Samples
(Per Person)
Age (Years) aBody weight
(kg) a
Lean body mass
(kg) a
CrCl
(or eGFR, mL/min) a
Dose Regimens
Mueck et al.
(2007) [19]
Phase ICaucasianHealthy
subjects
43 (43/0)PK: 1809 (42.1)
PD markers in total:
6533 (151.9) b
32.5 [20–45]NANANA5 mg qd,
5–30 mg bid,
5 mg tid
Mueck et al.
(2008a) [21]
Phase IIEuropeans,
Israeli
HRSPK: 758 (302/456)
PT: 1118 (NA)
PK: 5743 (7.6)
PT: 10467 (8.9)
66 [26–93] c75 [45–120] cNA88.1 [18.8–208] 2.5–30 mg bid,
5–40 mg qd
Mueck et al.
(2008b) [22]
Phase IICanadians,
American,
Europeans
HRS, KRS1013 (NA)PK: 7660 (7.6)
PD markers in total:
>9100 (>9.0) d
HRS: 65 [26–87]
KRS: 67 [39–92]
HRS: 76 [45–125]
KRS: 86 [50–173]
HRS:51 [34–81]
KRS: 51 [28–83]
HRS: 96 [33–218]
KRS: 104 [35–259]
2.5–30 mg bid
Mueck et al.
(2011) [23]
Phase IIMost
Caucasian
DVT870 (487/383)PK: 4634 (5.3)61 [18–94]NAMale: 63 ± 8
Female: 47 ± 5
87.4 ± 1.510–30 mg bid,
20–40 mg qd
Xu et al.
(2012) [24]
Phase IIIWhite (95.8),
Black (0.8%),
Asian (1.7%),
Others (1.7%)
ACS2290 (1784/506)PK: NA
PT: 6644 (4.9) e
57 [24–87]84 [36–181]60.7 [30.4–90.4]96.9 [22.4–298]2.5–10 mg bid,
5–20 mg qd
Tanigawa et al. (2013) [26]Phase IIJapaneseNVAF182 (148/34)PK: 842 (4.6)
FXa activity: 985 (5.4)
PT: 987 (5.4)
aPTT: 986 (5.4)
Heptest: 987 (5.4)
65.6 ± 10.0
[30–92]
67.2 ± 10.4
[45–103]
51.4 ± 7.2
[34.7–67.9]
Baseline: 79.7 ± 25.2
[29.0–175.8]
Day 28: 80.7 ± 26.6
[29.0–198.8]
10–20 mg qd,
2.5–20 mg bid
Kaneko et al.
(2013) [25]
Phase IIIJapaneseNVAF597 (NA)PK: 1834 (3.1)
PT: 1869 (3.1)
70.98 ± 8.31
72 [34–89]
64.45 ± 10.65
63.9 [35–104]
49.69 ± 7.14
50.24 [30.18–70.48]
67.41 ± 22.89
64 [26–172]
15 mg qd (10 mg qd in patients with CrCl < 50 mL/min)
Girgis et al.
(2014) [27]
Phase IIIMost
Caucasian
NVAF161 (NA)PK: 801 (5.0)
FXa activity: 799 (5.0)
PT: 796 (5.0)
PiCT: 742 (4.6)
65 ± 9.5NA57.5 ± 9.9NA20 mg qd (15 mg qd for patients with CrCl 30–49 mL/min)
Zhang et al.
(2017) [29]
Phase II,
III
Most
Caucasian
DVT,
NVAF
285 (NA)NANVAF: 65 [51–81] f
DVT: 59 [31–83] f
NANVAF: 56.6
[42.5–73.6] f
DVT: 54.1
[40.1–72.7] f
NA20 mg qd (15 mg for NVAF patients with CrCl 30–49 mL/min)
Barsam et al.
(2017) [28]
Post-
marketing study
Caucasian (74%),
Afro-Caribbean (21%),
Other (5%)
Acute VTE treatment, VTE
prevention
101 (59/42)PK: 193 (1.9) g52 [20–86] h88 ± 23.457.0 ± 11.367%: > 80 mL/min
25%: 50–79 mL/min
7.8%: 30–49 mL/min
0.2%: < 30 mL/min
10–20 mg qd,
15 mg bid
Suzuki et al.
(2018) [30]
Post-
marketing study
Japanese NVAF96 (81/15)PK: 192 (2)
PT: 192 (2)
68.0 ± 9.569.1 ± 11.4NABaseline: 76.2 ± 21.3
2–4 h after drug
intake: 77.6 ± 21.8
15 mg qd (10 mg in patients with CrCl < 50 mL/min)
Willmann et al.
(2018a) [31]
Phase II,
III
MultinationalHRS, KRS, DVT, ACS, NVAF4918 (2985/1933)PK: 22843 (4.6)60.53 ± 11.8282.48 ± 16.8757.05 ± 10.0097.74 ± 33.97 i2.5–30 mg bid,
2.5–40 mg qd
Willmann et al.
(2018b) [39]
Phase IWhite (74.6%),
Black (1.7%),
Asian (3.4%),
Hispanic (11.9%),
Missing (6.8%)
Children with VTE59 (33/26)PK: 206 (3.5)6.8 ± 4.9
6.0 [0.5–17]
29.5 ± 18.3
27.7 [6.2–77.8]
NANA10, 20 mg
Zdovc et al.
(2019) [32]
Post-
marketing study
SloveniaHRS, KRS17 (8/9)
PK: 82 (4.8) g
PT: NA
aPTT: NA
64 [49–82]84 [54–125]53 [38–81]82 [57–150] j10 mg qd
Goto et al.
(2020) [18]
Post-
marketing study
JapaneseNVAF119 (85/34)PK: 162 (1.3) g10 mg: 73.1 ± 10.0
15 mg: 66.7 ± 10.0
10 mg: 60.3 ± 15.5
15 mg: 67.3 ± 13.8
NA10 mg: 64.0 ± 21.2
15 mg: 84.4 ± 27.7
10, 15 mg qd
Speed et al. (2020) [33]Post-
marketing study
The United
Kingdom
VTE, NVAF, other913 (522/391)PK: 1108 (1.2) g67.03 ± 15.00
[19–96]
85.75 ± 23.07
[39–172]
55.8 ± 13.191.47 ± 43.81
[16–259]
10–30 mg qd,
10–15 mg bid
Willmann et al. (2021) [40]Phase IIIMost
Caucasian
Children with VTE, post-
Fontan surgery
524 (NA)PK: 1988 (3.8)Not defined
(16% <2 years)
<6 months:
4.1 ± 1.3 [2.7–7.9]
6 months–2 years:
9.5 ± 2.3 [5.4–15.1]
2–6 years:
16.4 ± 4.2 [10.1–39.1]
6–12 years:
32.4 ± 10.8 [17–71]
12–18 years:
67.9 ± 21.1 [20–194]
NA<6 months:
111 ± 45.6 [50.6–220]
6 month–2 years:
156 ± 52.4 [74.4–456]
2–6 years:
168 ± 49.4 [43.8–287]
6–12 years:
178 ± 43.5 [76.7–330]
12–18 years:
144 ± 38.3 [73.8–354]
0.4–20 mg qd
Esmaeili et al. (2022) [38]Post-
marketing study
Iranian NVAF, DVT, PE69 (33/36)PK: 126 (1.8) 64 [36–86]70 [46–112]49.6 [34.8–72.0]63.8 [23.5–128.5]20 mg bid,
10–20 mg qd
Liu et al.
(2022) [34]
Post-
marketing study
ChineseNVAF195 (111/84)PK: 256 (1.3)
PT: 244 (1.3)
66.7 ± 11.7
68 [28–96]
68.9 ± 12.9
68 [36.5–119]
51.5 ± 8.9
51.8 [29.0–73.3]
77.8 ± 21.2
79.7 [21.9–127.7]
5–20 mg qd
Singkham et al. (2022) [35]Post-
marketing study
ThaiNVAF60 (38/22)PK: 240 (4) g69.4 ± 9.264.0 ± 14.1NA59.0 ± 22.810–20 mg qd
Willmann et al. (2022) [41]Phase IIIMultinationalChildren with
congenital heart disease and undergone the Fontan
procedure
NANANANANANANA
Zhang et al.
(2022) [37]
Post-
marketing study
ChineseNVAF150 (95/55)PK: 263 (1.8)68.0 ± 12.6
69 [23–90]
67.4 ± 20.8
66.1 [38.0–110.0]
NA72.1 ± 33.5
71.1 [13.3–146.7]
10,15, 20 mg,
others
Zhao et al.
(2022) [20]
Post-
marketing study
ChineseHealthy
subjects,
NVAF
Healthy subjects: 304 (202/102)
NVAF: 223 (118/105)
PK: 4726 (15.5) k
PT: 1624 (3.1)
Anti-Xa: 1253 (2.4)
Healthy subjects:
30 [18–62]
NVAF:
70 [34–91]
Healthy subjects:
62.8 [47.0–83.0]
NVAF:
68.2 [38–112]
NAHealthy subjects:
103 [71.5–568]
NVAF:
76.3 [26.1–178]
Healthy subjects:
10–20 mg (single dose)
NVAF: 5–30 mg qd
Zhang et al.
(2023) [36]
Post-
marketing study
Chinese NVAF180 (96/84)PK: 360 (2)81.8 ± 4.3
81 (75–95)
67.3 ± 12.4
70 (40–100)
NA71.7 ± 22.1
73.3 (20.4–113.7)
5–20 mg qd
Abbreviations: ACS: patients with acute coronary syndrome; aPTT: activated partial thromboplastin time; CrCl: creatinine clearance; DVT: patients with deep vein thrombosis; eGFR: estimated glomerular filtration rate; FXa: Factor Xa; HRS: patients with hip replacement surgery; KRS: patients with knee replacement surgery; NA: not available; NVAF: patients with non-valvular atrial fibrillation; PD: pharmacodynamics; PE: patients with pulmonary embolism; PiCT: prothrombinase-induced clotting time; PK: pharmacokinetics; PT: prothrombin time; VTE: patients with venous thrombus embolism. a the data were shown as mean ± SD or median [min–max]. b PD data included FXa activity, PT, aPTT, and Heptest. c Only data from PK cohorts were provided. d PD data include FXa activity and PT. e PT data was from 1347 patients. f The data was shown as median [5th percentile–95th percentile]. g PK data was measured by anti-Xa assays. h the data was shown as mean [min–max]. i CrCl was calculated using modified Crockroft–Gault equation. j eGFR calculated using modified diet in renal disease equation. k The PK data were only obtained from healthy subjects.
Table 2. Final population pharmacokinetic parameters of included studies.
Study (Year)Estimation MethodFixed Effect Parameters Between-Subject VariabilityResidual
Unexplained Variability
Model
Evaluation
Model
Application
Mueck et al.
(2007) [19]
FOCEka (/h)0.9752.9% (BSV)
93.8% (IOV)
25.4%GOF, OFVDetermination of sampling window in phase II
ALAG (h)0.25102.5% (IOV)
CL/F (L/h)9.1717.4%
Vc/F (L)55.3 (dose < 30 mg)
79.2 (dose = 30 mg)
30.7%
Vp/F (L)12.6 (dose < 30 mg)
23.5 (dose = 30 mg)
38.6%
Q/F (L/h)1.35/
Mueck et al.
(2008a) [21]
FOCE-Ika (/h)0.047 (day 2 for mixed population 1)
0.222 (day 3–4 for mixed population 1)
1.07 (≤ 4 days for mixed population 2)
1.49 (> 4 days for all patients)
/52.6%GOF, OFVNA
CL (L/h)5.46 (day 2)
6.91 (day 3–4)
7.51 × [1 − 0.01 × (age − 66) + 0.003 × (CrCl − 88.1) + 0.22 × (ALB − 3.4)
  − 0.012 × (HCT − 37.3)] (day > 4)
38.2%
V (L)58.2 × [1 + 0.64 × (BSA − 1.84)]32.4%
F0.877 (5, 10 mg, compared to 2.5 mg)
0.791 (20 mg, compared to 2.5 mg)
/
Mueck et al.
(2008b) [22]
FOCE-Ika (/h)0.092 (≤ 3 days for population 1, HRS)
1.81 (≤ 3 days for population 2 and > 3 days for the total population, HRS)
1.20 (> 3 days, KRS)
/37.1% (HRS)
34% (KRS)
GOF, OFVNA
CL (L/h)
6.4 (≤ 3 days, HRS)
7.3 × [1 − 0.015 × (age − 65) − 0.21 × (SCr − 0.78)] (> 3 days, HRS)
6.13 × [1 + 0.002 × (CrCl − 103)] × 0.85 (if female) (> 3 days, KRS) a
70.1% (HRS, ≤ 3 days)
38.6% (HRS, > 3 days) b
V (L)49.1 × [1 + 0.018 × (LBM − 51)] (HRS)
55.7 × [1 + 0.67 × (BSA − 1.95)] (KRS)
/
F1 (2.5 mg bid)
0.847 (HRS, 5, 10 mg bid)
0.74 (KRS, 5, 10 mg bid)
0.609 (HRS, 20, 30 mg bid)
0.53 (KRS, 20, 30 mg bid)
/
Mueck et al.
(2011) [23]
FOCE-Ika (/h)1.23/40.7%GOF, bootstrap,
VPC
The effect of identified factor on PK, and factors influencing PK in NVAF patients
CL (L/h)5.67 × [1 − 0.007 × (age − 61) − 0.269 × (SCr − 0.94)]39.9%
V (L)54.4 × [1 + 0.008 × (LBM − 56) − 0.005 × (age − 61)]28.8%
F0.79 (20 mg compared to 10 mg)
0.63 (30, 40 mg compared to 10 mg)
/
Xu et al.
(2012) [24]
FOCEka (/h)1.24139%35.2 %GOF, VPCThe effect of identified factors on PK
CL (L/h)6.48 × [1 − 0.0112 × (age − 57) − 0.151 × (SCr − 0.95)]31.3% (BSV)
32.4% (IOV)
V (L)57.9 × [1 + 0.00833 × (LBM − 60.7) − 0.00707 × (age-57)]10.0%
F1 (2.5 mg)
0.851 (< 10 mg)
0.705 (≥ 10 mg)
/
Tanigawa et al. (2013) [26]FOCE-Ika (/h)0.668%40.2%GOF, VPC,
bootstrap
Comparison of PK
parameters in Japanese and Caucasian patients
CL (L/h)4.72 × [1 − 0.0165 × (BUN − 16.73)]21.3%
V (L)42.9/
F124.4%
Kaneko et al.
(2013) [25]
FOCE-Ika (/h)0.61758.2%13.1%GOF, VPC,
bootstrap
Comparison of the posthoc estimated PK parameters between Japanese and
non-Japanese patients
CL (L/h) c4.73 × (CrCl/67.11)0.159 × [1 − 0.0132 × (HCT − 42.14)]41.0%
V (L)43.863.6%
F137.7% (IOV)
Girgis et al.
(2014) [27]
FOCE-Ika (/h)1.16/47.9%PE%, GOF,
pc-VPC
Dose modification for patients with renal impairment
CL/F (L/h)6.1 × [1 − 0.011 × (age − 65) − 0.194 × (SCr − 1.09)]35.2%
V/F (L)79.7 × [1 − 0.00133 × (age − 65) + 0.0118 × (LBM − 57.5)]17.6%
Zhang et al.
(2017) [29]
FOCE-Ika (/h)0.982/47.5%GOF, VPCCross-study PK comparison
CL/F (L/h)6.31 × [1 − 0.011 × (age − 65) − 0.244 × (SCr − 1.05)]/1.12 (if DVT)34.6%
V/F (L)70.3 × [1 − 0.00347 × (age − 65) − 0.109 × (LBM − 56.62)]/1.12 (if DVT)15.5%
Barsam et al.
(2017) [28]
FOCEka (/h)1.21/31%
0.016 ng/mL
VPCNA
CL/F (L/h)8.86 × (CrCl/79)0.43448%
V/F (L)10160%
Suzuki et al.
(2018) [30]
FOCEka (/h)1.3744.6%41.8%GOFNA
CL/F (L/h)4.40 × (CrCl/75)0.324 × (ALT/22)−0.225 × (1 − 0.319 × INH)20.6%
V/F (L)38.263.6%
Willmann et al. (2018a) [31]FOCE-Ika (/h)0.82179.25%45.06%GOF, pc-VPCThe effect of identified factors on PK
CL (L/h)6.58 × (CrCl/93)0.406
   × (BW/81) −0.278
   × 0.966 (if co-medication with P-pg inhibitor)
   × 0.978 (if co-medication with strong CYP3A4 inhibitors)
   × 0.863 (if co-medication with moderate CYP3A4 inhibitors)
   × 0.939 (if co-medication with weak CYP3A4 inhibitors)
   × 1.30 (if co-medication with CYP3A4 inducers)
   × 1 (if venous thromboembolism treatment)
   × 0.849 (if non-valvular atrial fibrillation)
   × 1.14 (if acute coronary syndromes)
   × 1.04 (if venous thromboembolism prevention, < 72 h)
   × 1.29 (if venous thromboembolism prevention, ≥ 72 h)
40.87%
V (L)62.5 × (BW/81) 0.216 × (age/61) −0.189 × 0.889 (if female)19.77%
F0.59 + 0.66 × e− 0.048 × dose/
Willmann et al. (2018b) [39]FOCE-Ika (/h)0.717 (for tablet or diluted suspension)
0.208 (for undiluted suspension)
39.7% 46.6%Compare PK
parameters with
that derived from non-compartmental analysis
Comparison of PK
parameters with PBPK model predictions
CL (L/h)7.26 × (BW/70)0.32326.2%
Vc (L)50.9 × (BW/70)/
Vp (L)13.5/
Q (L/h)0.928/
F0.648/
Zdovc et al.
(2019) [32]
Laplacian method with interactionka (/h)0.147794%59.5%GOF, VPC,
bootstrap
The effect of identified factors on PK
CL/F (L/h)6.12 × (ABCB1 expression/1.25)0.81780.8%
V/F (L)96.8/
Goto et al.
(2020) [18]
NAka (/h)0.617 d58.2% d13.1 % dGOF, VPCNA
CL (L/h)5.59 × (CrCl/67.11)0.15941.0% d
V (L)50.963.6% d
F137.7% d
Speed et al.
(2020) [33]
FOCE-1ka (/h)0.707/46.37%VPC, bootstrapThe effect of identified factors on PK
CL/F (L/h)5.57 × (CrCl_LBM/55)0.44623.02% e
V/F59.4 × (LBM/55)0.519/
Willmann et al. (2021) [40]NAka (/h)0.799 (for tablet and diluted suspension)
0.226 (for undiluted suspension)
/ NAComparison of PK
parameters with PBPK model predictions
CL (L/h)8.02 × (BW/82.48)0.48127.0%46.9%
Vc (L)53.2 × (BW/82.48)0.821/
Vp (L)13.5 × (BW/82.48)0.821/
Q (L/h)2.5 × (BW/82.48)0.761/
F0.59 + 0.66 × e− dose/BW × 3.9725.1%
Esmaeili et al.
(2022) [38]
SAEMka (/h)0.821 f/38%GOF, bootstrapNA
CL/F (L/h)3.7 × (CrCl/62.3)0.89 × (CTP/5.7)−1.7661%
V/F (L)5921%
Liu et al.
(2022) [34]
FOCE-Ika (/h)0.617 d/33.6%GOF, VPC,
bootstrap
The effect of identified factors on PK and PD, and dose modification
CL/F (L/h)5.03 × (eGFR/80)0.5335.4%
V/F (L)40.3/
Singkham et al. (2022) [35]FOCE-Ika (/h)0.69775.91%0.092 mg/LGOF, VPC,
bootstrap
The effect of identified factors on PK, and dose modification
CL/F (L/h)4.19 × (CrCl/57.5)0.27721.94%
V/F (L)37.5 × (BW/63)0.412/
Willmann et al. (2022) [41]NAka (/h)0.799/51.9%GOF Comparison of PK
parameters with PBPK model predictions, and simulation for dose-exposure relationship
CL (L/h)6.07 × (BW/82.48)0.48131.8%
Vc (L)53.2 × (BW/82.48)0.821/
Vp (L)59.1 × (BW/82.48)0.821/
Q (L/h)2.5 × (BW/82.48)0.761/
F0.752 (≥5 years)
1.2 (<5 years)
40.1%
Zhang et al.
(2022) [37]
FOCE-Ika (/h)0.821 f/36.6%
2.51 μg/L
GOF, VPC,
bootstrap
The effect of identified factors on PK, and dose
modification
CL/F (L/h)5.79 × e(CRCl − 76.1) × 0.00586 × e-(TBIL − 14) × 0.0144
  × 1.476 (if ABCB1 rs4728709 AA/GA)
38.3%
V/F (L)51.5 × e(BW−66) × 0.0087318.5%
Zhao et al.
(2022) [20]
FOCE-Ika (/h)0.406 × 0.830 (if postprandial status) g/21.0%
1.95 μg/L
GOF, bootstrapThe effect of identified factors on PD
D (h)0.101 × 4.9 (if postprandial status) g183% g
ALAG (h)0.164 g/
CL/F (L/h)7.39 × (CrCl/95)0.6100347.1%
Vc/F (L)10.9 × (BMI/22.85)1.364 g53.8% g
Vp/F (L)50.9 g68.1% g
Q/F (L/h)4.4 g77.9% g
F0.867 (15 mg, compared to 10 mg) g
0.608 (20 mg, compared to 10 mg) g
× 1.244 (if postprandial status) g
15.5% g
Zhang et al.
(2023) [36]
FOCE-Ika (/h)0.821 f/20 %
0.193 μg/L
GOF, VPC,
bootstrap
The effect of identified factors on PK, and dose
modification
CL/F (L/h)3.68 × (eGFR/73.275)0.528 × (TBIL/13.63)−0.246
  × 1.257 (if ABCB1 rs1045642 CT/TT)
/
V/F (L)42.9/
Abbreviations: ABCB1: ATP-binding cassette sub-family B member; ALAG: the absorption lag time; ALB: albumin; ALT: alanine aminotransferase; BMI: body mass index; BSA: body surface area; BSV: between-subject variability; BUN: blood urea nitrogen; BW: body weight; CL: clearance; CL/F: apparent clearance; CrCl: creatinine clearance; CrCl_LBM: creatinine clearance calculated using lean body mass; CTP: transformed Child–Turcotte–Pugh Score; CYP3A4: cytochrome P450 3A4; D: duration; DVT: patients with deep vein thrombosis; F: bioavailability; FOCE: first-order conditional estimation; FOCE-I: first-order conditional estimation with interaction; GOF: goodness-of-fit; HCT: hematocrit; HRS: patients with hip replacement surgery; INH: CYP3A4 inhibitors or P-gp inhibitors; IOV: inter-occasion variability; ka, absorption rate; KRS: patients with knee replacement surgery; LBM: lean body mass; OFV: objective function value; PBPK: physiologically based pharmacokinetic; pc-VPC: prediction-corrected visual predictive check; PD: pharmacodynamics; PE: prediction error; P-gp: P-glycoprotein; PK: pharmacokinetics; Q: inter-compartment clearance; Q/F: apparent inter-compartment clearance; SAEM: stochastic approximation expectation-maximization; SCr: serum creatinine; TBIL: total bilirubin; V: volume of distribution; Vc: central volume of distribution; Vc/F: apparent central volume of distribution; V/F: apparent volume of distribution; Vp: peripheral volume of distribution; VPC: visual predictive check; Vp/F: apparent peripheral volume of distribution. a The typical value of CL for patients with KRS after surgery < 3 days was not reported. b The BSV of CL for patients with KRS was not reported. c Correlation between CL and V was 0.729. d The estimates were fixed to values reported by Kaneko et al. [25]. e The BSV of CL was Box-cox transformed with an estimate of lambda −1.83. f The estimates were fixed to values reported by Willmann et al. [31]. g The estimates in patients were fixed to values estimated according to the study conducted in healthy subjects by Zhao et al. [20].
M = M 0 × ( 1 E m a x × C p E C 50 + C p )
M = M 0 × ( 1 E m a x × C p H i l l E C 50 H i l l + C p H i l l )
M = E m a x × C p H i l l E C 50 H i l l + C p H i l l
where M represents the measurement of FXa activity (aPTT, or anti-Xa), M0 represents the baseline FXa activity (aPTT, or anti-Xa), Emax represents the maximum FXa activity (aPTT, or anti-Xa), EC50 represents the rivaroxaban concentration generating 50% of the maximum FXa activity (aPTT, or anti-Xa), Hill represents the exponent of rivaroxaban concentration, and Cp represents the plasma concentration of rivaroxaban.
Anti-Xa activity was correlated with rivaroxaban concentration in a near-linear (Equation (5)) or Emax model (Equation (8)) [20,38]. aPTT was expressed as a linear (Equation (2)), near-linear (Equation (4)), or Emax-related relationship (Equation (6)) [19,26,32,38]. Heptest was expressed as an Emax-related relationship (Equations (6) and (7)) [19,27] and PiCT showed a near-linear relationship (Equation (4)) [27]. The final PD parameters of the included studies are listed in Table 3 and Table S2.

3.3.4. Model Evaluation

All models were internally evaluated using goodness-of-fit plots, non-parametric bootstrapping, visual predictive check (VPC), and prediction-corrected VPC (pc-VPC). Three studies conducted an internal evaluation by comparing PK parameter estimates with physiologically based pharmacokinetic (PBPK) model predictions [39,40,41].

3.3.5. Model Application

Eleven studies performed Monte Carlo simulations to explore the effects of the identified covariates on PK or PD parameters [20,23,24,27,31,32,33,34,35,36,37]. Four studies proposed further recommendations for dose regimens in different subgroups [27,34,36,37].

3.4. Comparison of Studies

The simulated concentration-time and PD biomarker-time profiles at the steady state of the included studies were compared. Detailed information on the simulated patient characteristics is provided in Table S3. For a comparison of PK parameters, apparent clearance (CL/F) was chosen because it is the most important PK parameter for long-term pharmacotherapy and could be compared directly among studies that employed different dosing regimens [42]. As for the PD index, FXa activity was selected for comparison because it directly reflects the inhibitive effect of rivaroxaban. PT, which was investigated in most studies, was also compared. Other PD biomarkers were not assessed because of a lack of adequate data or evidence of their clinical relevance.
Regarding the PK comparison, studies with overlapping data and smaller sample sizes were excluded [21,22,23,24,27,28,29]. Therefore, 17 studies were used to compare the PK parameters [18,19,20,25,26,30,31,32,33,34,35,36,37,38,39,40,41], and 13 studies were used for PD [19,20,21,22,23,24,25,26,27,30,32,34,38] analyses. Studies conducted on patients who were predominantly Caucasians were grouped into Caucasian models.

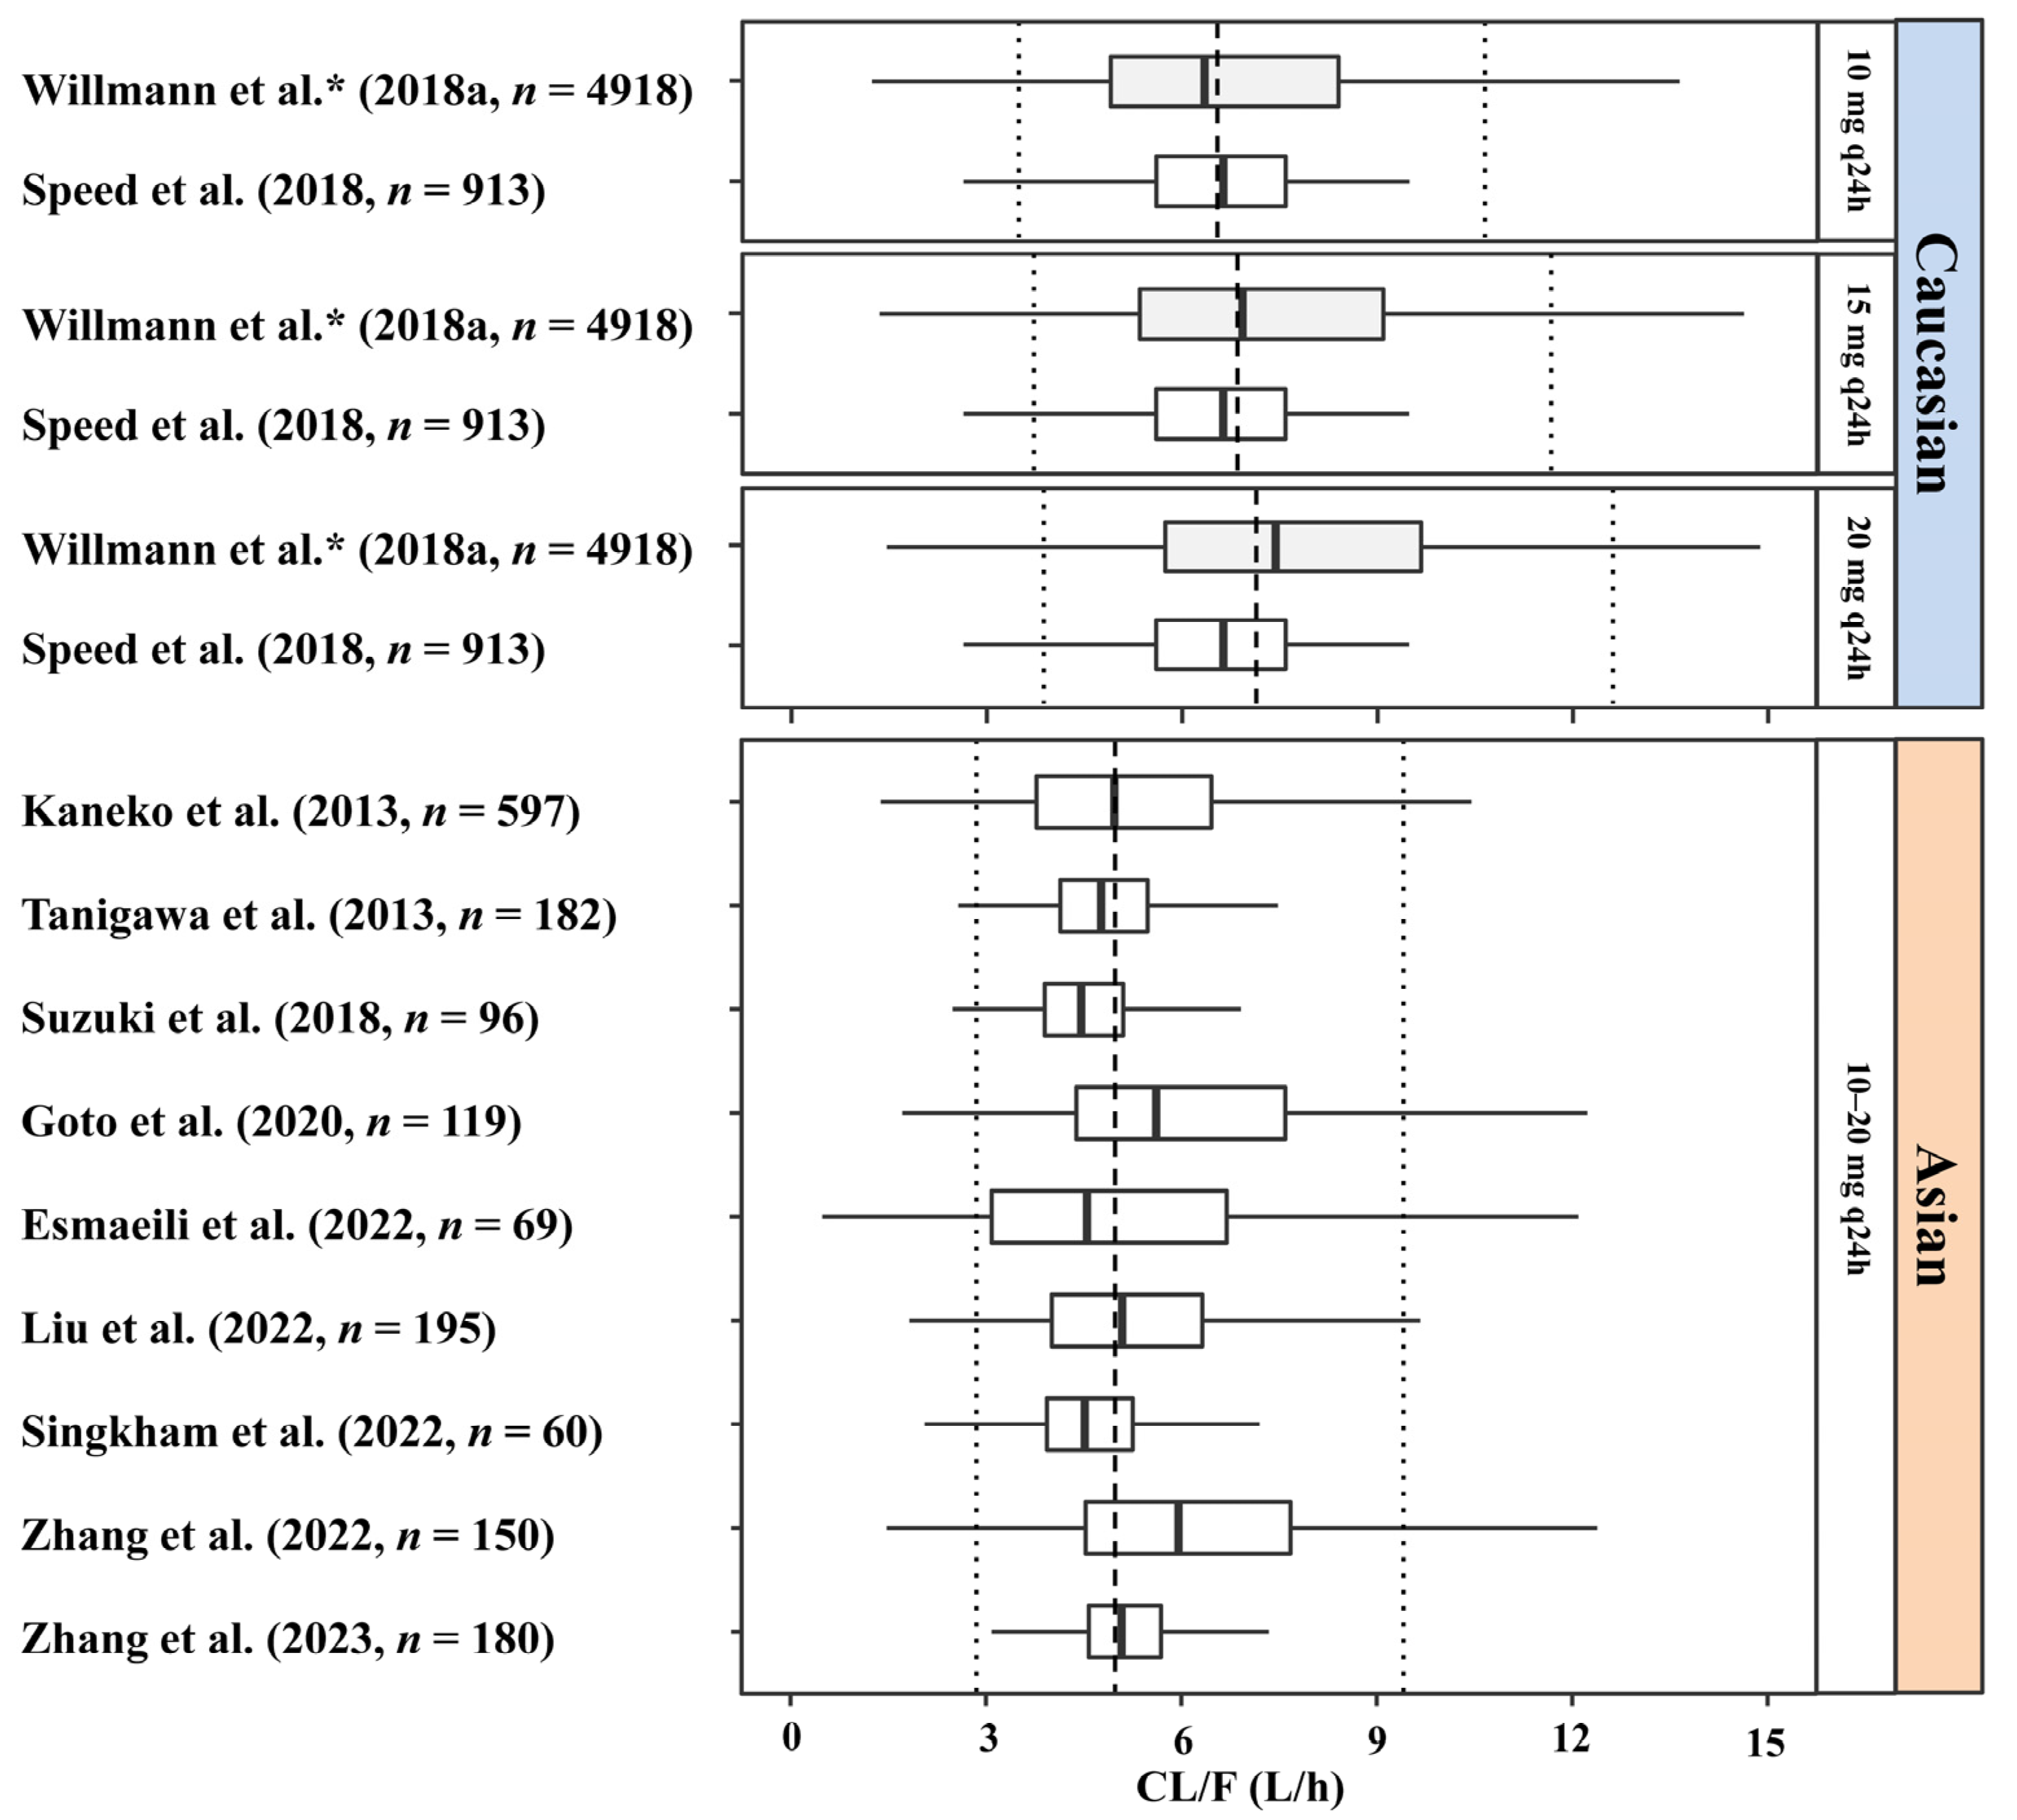
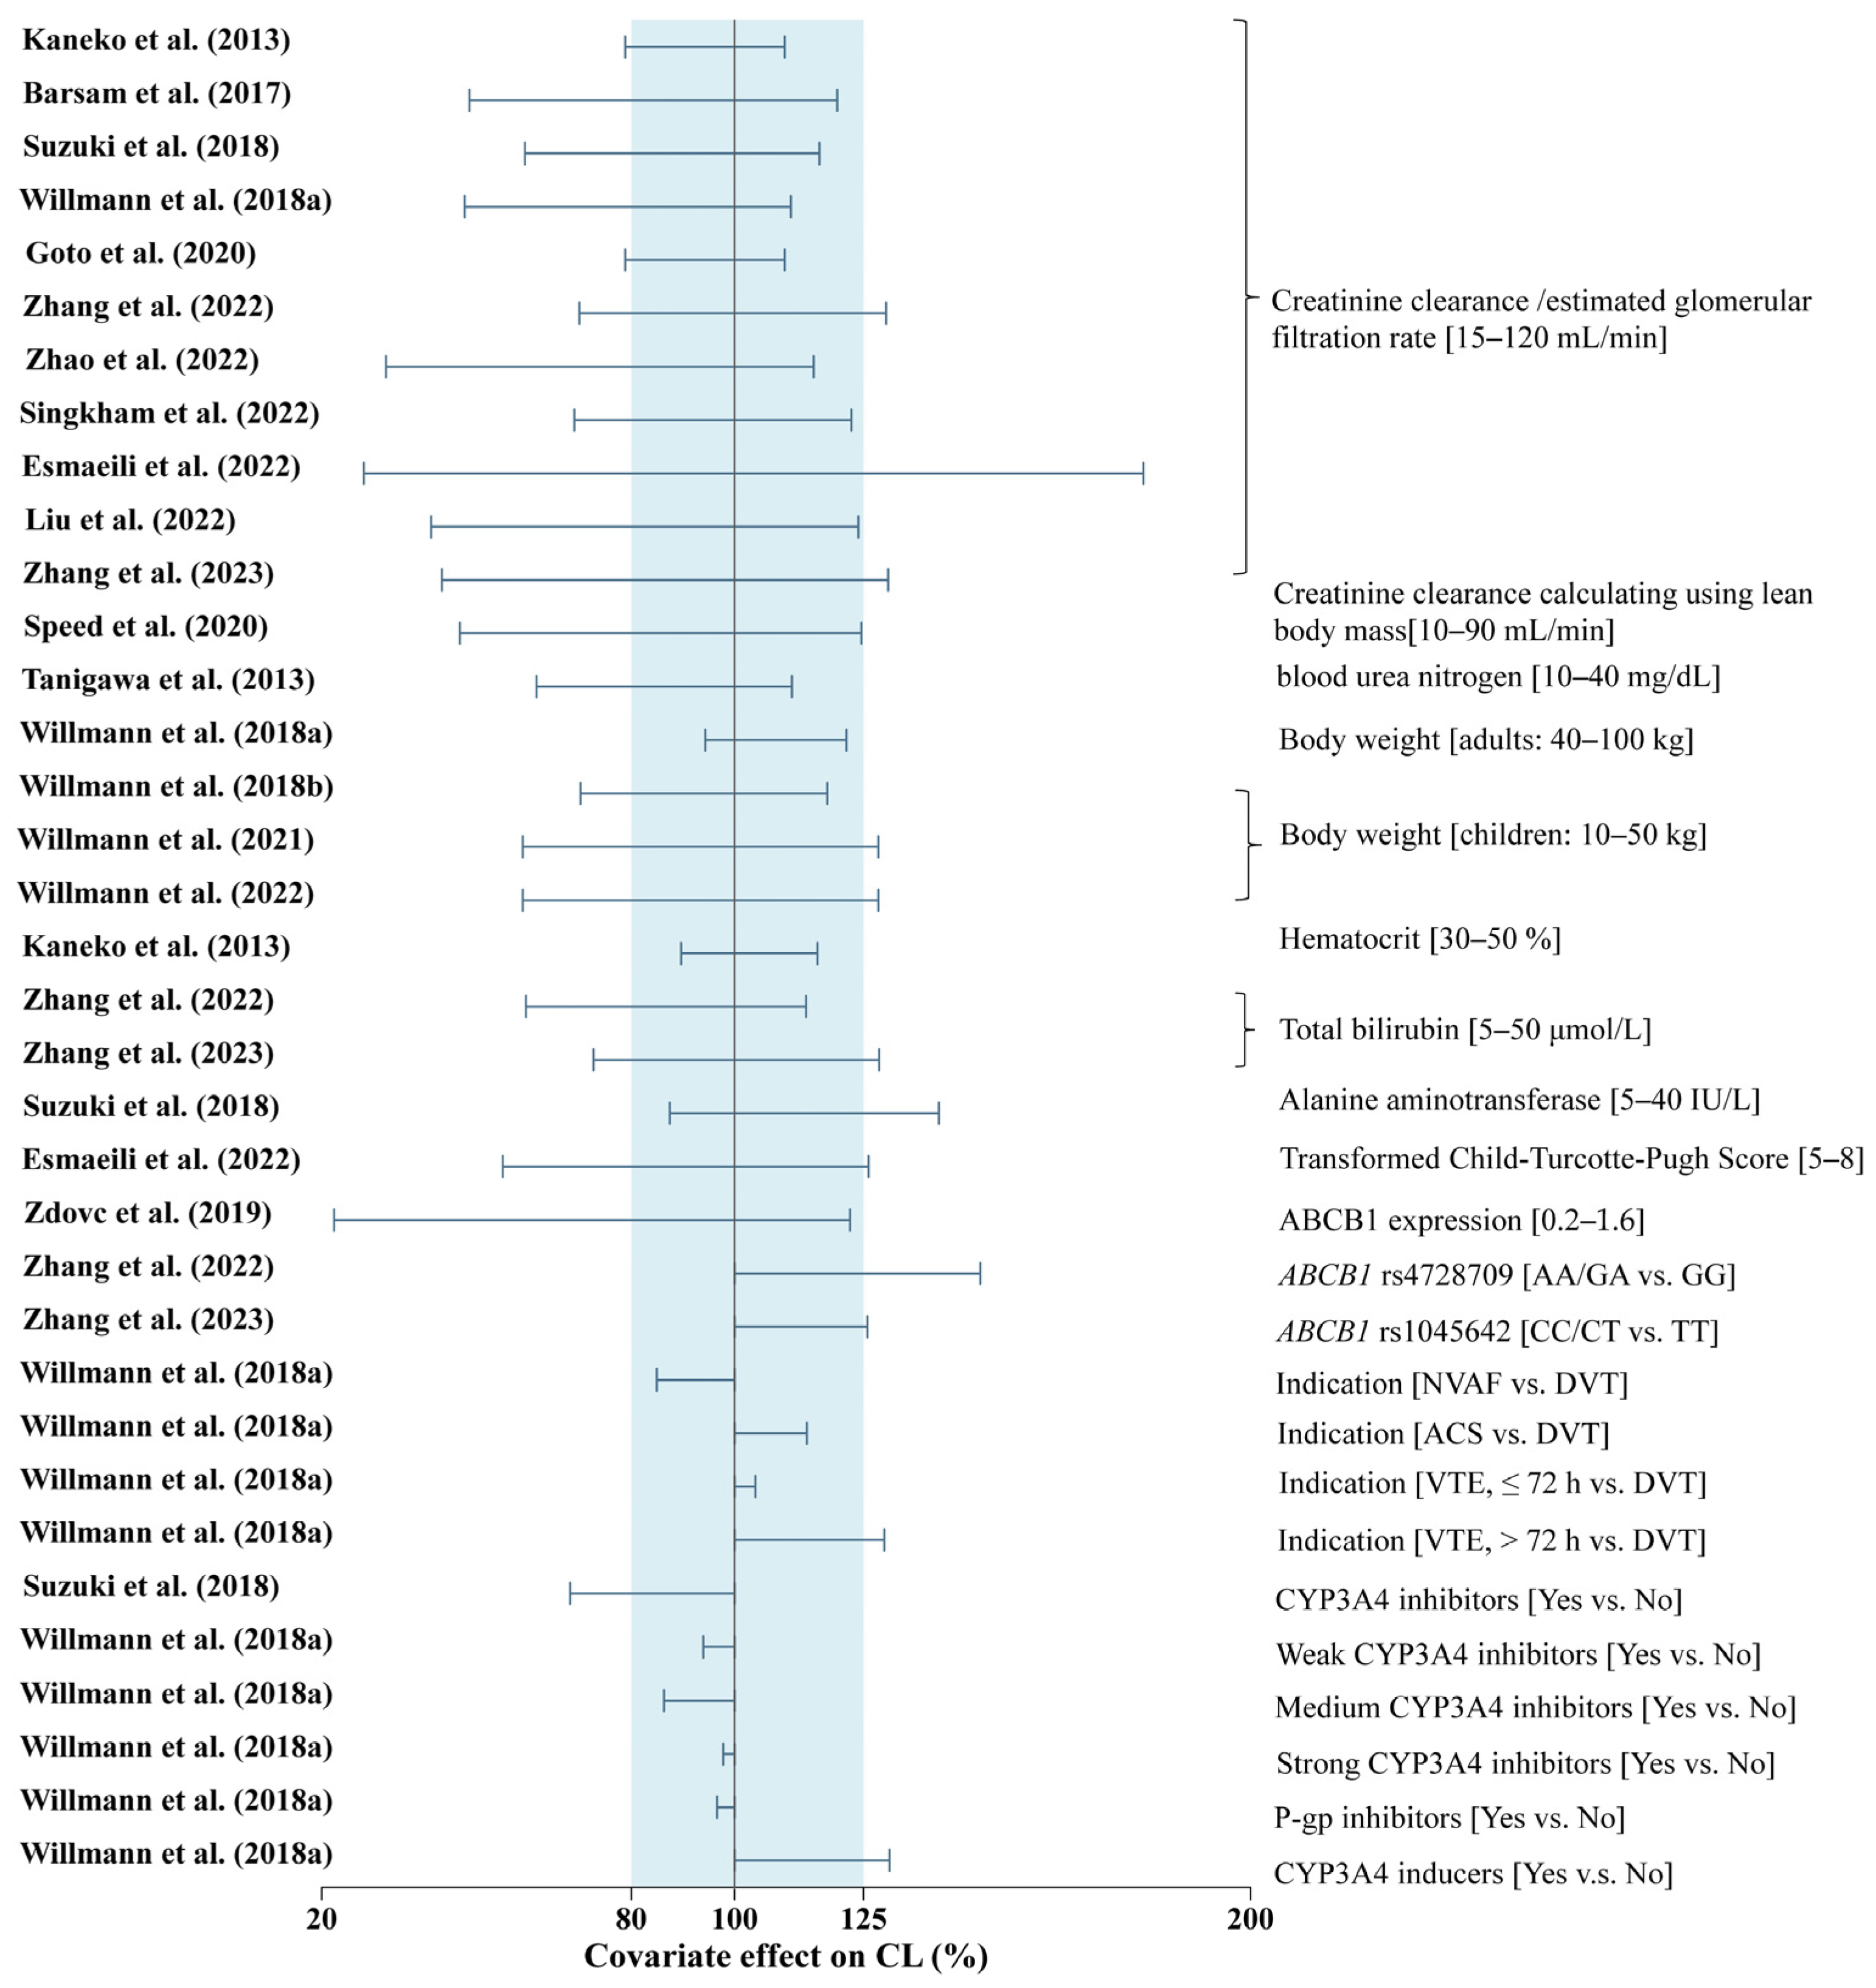
3.4.1. Pharmacokinetic Analysis

The dose-dependent bioavailability was reported in nine studies [19,20,21,22,23,24,31,40,41]. For studies conducted on patients with NVAF, bioavailability was estimated in a dose-dependent manner only by Willmann et al. [31], but it was fixed or not estimated in other studies. Therefore, the CL/F values in different dose groups were compared.
Table 3. Final population pharmacodynamic parameters of included studies.
Study (Year)Analytical Method/
Regent
Formula Fixed Effect Parameters Between-Subject Variability Residual Unexplained Variability
Prothrombin time
Mueck et al. (2007) [19]Neoplastin Plus®PT = PT0 + slope × Cp
PT0 (s)12.73.7%1.58 s
slope (s/(μg/L))0.045812.3%
Mueck et al. (2008b) [22] aSTA® Neoplastine®PT = PT0 + slope × CpPT0 (s)13.1 × [1 + 0.034 × (ALB − 3.3)] × [1–0.0045 × (CrCl − 96)] (HRS)
13.4 × [1 + 0.05 × (ALB − 3.6)] × [1–0.008 × (CrCl − 104)] (KRS)
5.8% (HRS)
7.4% (KRS)
8.6% (HRS)
10.9% (KRS)
slope (s/(μg/L))0.032 (HRS)
0.042 (KRS)
43.2%
Mueck et al. (2011) [23]STA® Neoplastine®PT = PT0 + slope × Cp1-Hill × CpPT0 (s)12.5 × [1–0.0004 × (CrCl − 87.4)]9.7%10.3%
slope (s/(μg/L))0.036/
Hill0.0000996 × [1 + 0.0046 × (CrCl − 87.4)]4.3%
Xu et al.
(2012) [24]
STA Neoplastin CI Plus®PT = PT0 + slope × Cp1-Hill × CpPT0 (s)13.9 × [1–0.0003 × (CrCl − 96.9)]9.32%7.6%
slope (s/(μg/L))0.032/
Hill0.0000593 × [1 + 0.0233 × (CrCl − 96.9)]6.61%
Kaneko et al. (2013) [25]Neoplastin Plus®PT = PT0 + slope × Cp1-Hill × CpPT0 (s)11.4 × [1 + 0.0035 × (age − 70.98) + 0.00242 × (LBM − 49.69)
− 0.065 × (ALB − 4.22) − 0.015 × (HGB − 14.06)]
9.6%7.1%
slope (s/(μg/L))0.0467/
Hill0.000155 × (TBIL/14.02)−1.117.3%
Tanigawa et al. (2013) [26]Neoplastin Plus®PT = PT0 + slope × CpHillPT0 (s)13.78.0%9.4%
slope (s/(μg/L))0.022727.0%
Hill1.1/
Girgis et al. (2014) [27]STA Neoplastin CI Plus®PT = PT0 + slope × Cp1-Hill × CpPT0 (s)11.4 × [1–0.000192 × (CrCl − 76)]22.6%12.9%
slope (s/(μg/L))0.04264.42%
Hill0.0000551 × [1 + 0.0174 × (CrCl − 76)]/
Suzuki et al. (2018) [30]Neoplastin Plus®PT = PT0 + slope × CpPT0 (s)14/0.87 s
slope (s/(μg/L))0.0335 × (HCT/42)−1.1011.7%
Thromborel® SPT = PT0 + slope × CpPT0 (s)12.5/0.71 s
slope (s/(μg/L))0.0158 × (HCT/42)−1.38 × (ALB/4.2)−2.318.7%
ThromboCheck PT®PT = PT0 + slope × CpPT0 (s)11.8/0.61 s
slope (s/(μg/L))0.0220 × (HCT/42)−1.309.5%
RecombiPlasTin 2G®PT = PT0 + slope × CpPT0 (s)12.1/0.75 s
slope (s/(μg/L))0.032311.2%
Suzuki et al. (2018) [30]Thrombocheck PT Plus®PT = PT0 + slope × CpPT0 (s)13.2/0.82 s
slope (s/(μg/L))0.0266 × (HCT/42)−1.07 × (age/69)0.68010.6%
Zdovc et al. (2019) [32]Thromborel® SPT = PT0 + slope × log(Cp)PT0 (s)12.811.4%1.85 s
slope (s/(μg/L))0.215109%
Liu et al.
(2022) [34]
Thromborel® SPT = PT0 + slope × CpPT0 (s)13.9 × e0.00574 × (TBIL − 12) × (1 − 0.0872 × eGFR/80)5.6 %9.4%
slope (s/(μg/L))0.013361.8 %
Esmaeili et al. (2022) [38]FisherbrandTMPT = PT0 + slope × CpPT0 (s)12.62%12%
slope (s/(μg/L))0.01854%
Zhao et al.
(2022) [20]
Thromborel® SPT = PT0 + slope × CpHillPT0 (s)11.4 × (BW/68.2)−0.159 × (TCHO/3.96)−0.0794 b6.9% b0.372 s
slope (s/(μg/L))0.0018 b24.9% b
Hill1.37 b/
Factor Xa activity
Mueck et al. (2007) [19]Two-step photometric
assay
FXa = FXa0 × (1 − E max   ×   C p EC 50   +   Cp )FXa0 (U/mL)0.8710.09%0.0027 U/mL
Emax (U/mL)0.869.9%
EC50 (μg/L)220/
Mueck et al. (2008b) [22]Two-step photometric
assays
FXa = FXa0 × (1 − E max   ×   C p EC 50   +   Cp )FXa0 (U/mL)113.9% (HRS)
14.5% (KRS)
8.4% (HRS)
9.7% (KRS)
Emax (U/mL)0.881 (day 1, HRS)
0.942 (steady state, HRS)
0.837 (KRS)
/
EC50 (μg/L)296 (HRS)
243(day 1, KRS)
172 (steady state, KRS)
36.6% (HRS)
50.2% (KRS)
Tanigawa et al. (2013) [26]Two-step photometric
assays
FXa = FXa0 × ( 1 - E max   ×   C p hill EC 50 hill   +   C p hill ) FXa0 (U/mL)0.803 × [1 − 0.00656 × (age − 65.59)]4.8%6.9%
Emax (U/mL)0.928/
EC50 (μg/L)22110.6%
Hill 1.16/
Girgis et al. (2014) [27]Two-step photometric
assays
FXa = FXa0 × ( 1 - E max   ×   C p EC 50   +   Cp ) FXa0104% c16.61%10.05%
Emax107% c/
EC50 (μg/L)7605.97%
Abbreviations: ALB: albumin; BW: body weight; Cp: rivaroxaban plasma concentration; CrCl: creatinine clearance; EC50: concentration generating 50% of the maximum effect; eGFR: estimated glomerular filtration rate; Emax: the maximum effect; FXa: factor Xa; FXa0: baseline of FXa; HCT: hematocrit; HGB: hemoglobin; HRS: patients with hip replacement surgery; KRS: patients with knee replacement surgery; LBM: lean body mass; PT: prothrombin time; PT0: baseline of PT; TBIL: total bilirubin; TCHO: total cholesterol. a Complex PT model with components describing recovery of clotting factors to pre-surgery levels over time was developed by Mueck et al. (2008b) [22], and the simplified formula was provided in the table. b The estimates in patients with NVAF were fixed to values estimated from healthy subjects by Zhao et al. [20]. c Data were expressed as a percentage of factor Xa activity in control plasma. Notes: Study by Mueck et al. (2008a) [21] also applied PT to develop PK/PD model, but did not report the parameter estimates.
For patients with NVAF and normal renal function, the CL/F of rivaroxaban in Caucasian adult patients (6.45–7.64 L/h) was 31–43% higher than that in Asians (4.46–5.98 L/h) taking 10–20 mg q24h (Figure 1). However, there was also no obvious difference in the median CL/F among Asians, including Japanese, Chinese, Thai, and Iranian patients with NVAF (Figure S2). The simulated concentration-time profiles at steady state of all included studies were shown in Figure S3.
Covariates on the CL of rivaroxaban in previous studies included renal function [CrCl, eGFR, and blood urea nitrogen (BUN)], hepatic function [alanine aminotransferase (ALT), total bilirubin (TBIL), transformed Child–Turcotte–Pugh Score (CTP)], genetic polymorphisms of ABCB1, and the presence of co-medication. The effects of the covariates on CL in each study are shown in Figure 2.
Eleven studies identified renal function as significant covariates on the CL of rivaroxaban, including CrCl, eGFR, or BUN. The impact of CrCl on CL varied in these studies. Compared with patients with CrCl (or eGFR) of 80 mL/min, moderately (CrCl (or eGFR) 30–49 mL/min) or severely impaired renal function (CrCl (or eGFR) 15–29 mL/min) may lead to a decrease in the CL of approximately 4–50% and 12–72%, respectively. The change in CL/F per unit renal function was similar between Asian and Caucasian patients but had a large variability. For example, the CL/F of rivaroxaban decreased by 0.13–5.58% in the Asian population and 0.34–2.84% in the Caucasian population per 1 mL/min decrease in CrCl (or eGFR) from 15 to 120 mL/min (Figure S4).
A significant effect of hepatic function on CL was reported in four studies, which were characterized by the ALT, TBIL, and CTP levels [30,36,37,38]. Increased TBIL (>35 μmol/L) or CTP (>6.5) levels may lead to a decrease in the CL/F of rivaroxaban by >20% (Figure 2). Nevertheless, the identified liver indices were different in each of these studies, which warrants further evaluation.
Body weight (BW) was also identified as a significant covariate in three studies conducted on pediatric patients [39,40,41] (Figure 2). The body-weight-adjusted CL/F in children was higher than that in adults. For Caucasian children weighing 10, 30, and 50 kg, the median body weight-adjusted CL/F was reported to be approximately 2.05-, 1.47-, and 1.16-fold higher than that in adults, respectively (Figure S5). BW was also assessed in 15 studies conducted on adult patients [20,21,22,23,25,28,29,30,31,32,33,34,35,36,37,38], but only one study by Willmann et al. [31] found an increase in CL with a decrease in the BW of patients, which may not have clinical relevance (Figure 2).
The impact of genetic polymorphisms of ABCB1 (rs1045642, rs4148738, or rs4728709) on CL was reported, with an effect ranging from 19 to 57% among patients [34,36,37]. The study conducted by Zdovc et al. [32] identified the relative expression of the ABCB1 gene determined using the comparative Ct method as a significant covariate for CL in 17 patients [32].
Furthermore, co-medication, including CYP3A4 inhibitors, inducers, and P-gp inhibitors, was found to notably affect CL in two studies [30,31]. Co-medication with CYP3A4 inducers increased CL by approximately 30% compared to rivaroxaban monotherapy [31]. The influence of strong, moderate, and weak CYP3A4 inhibitors and P-gp inhibitors on CL was < 15% in a study by Willmann et al. [31]. In contrast, it was approximately 32% in the study by Suzuki et al. [30].

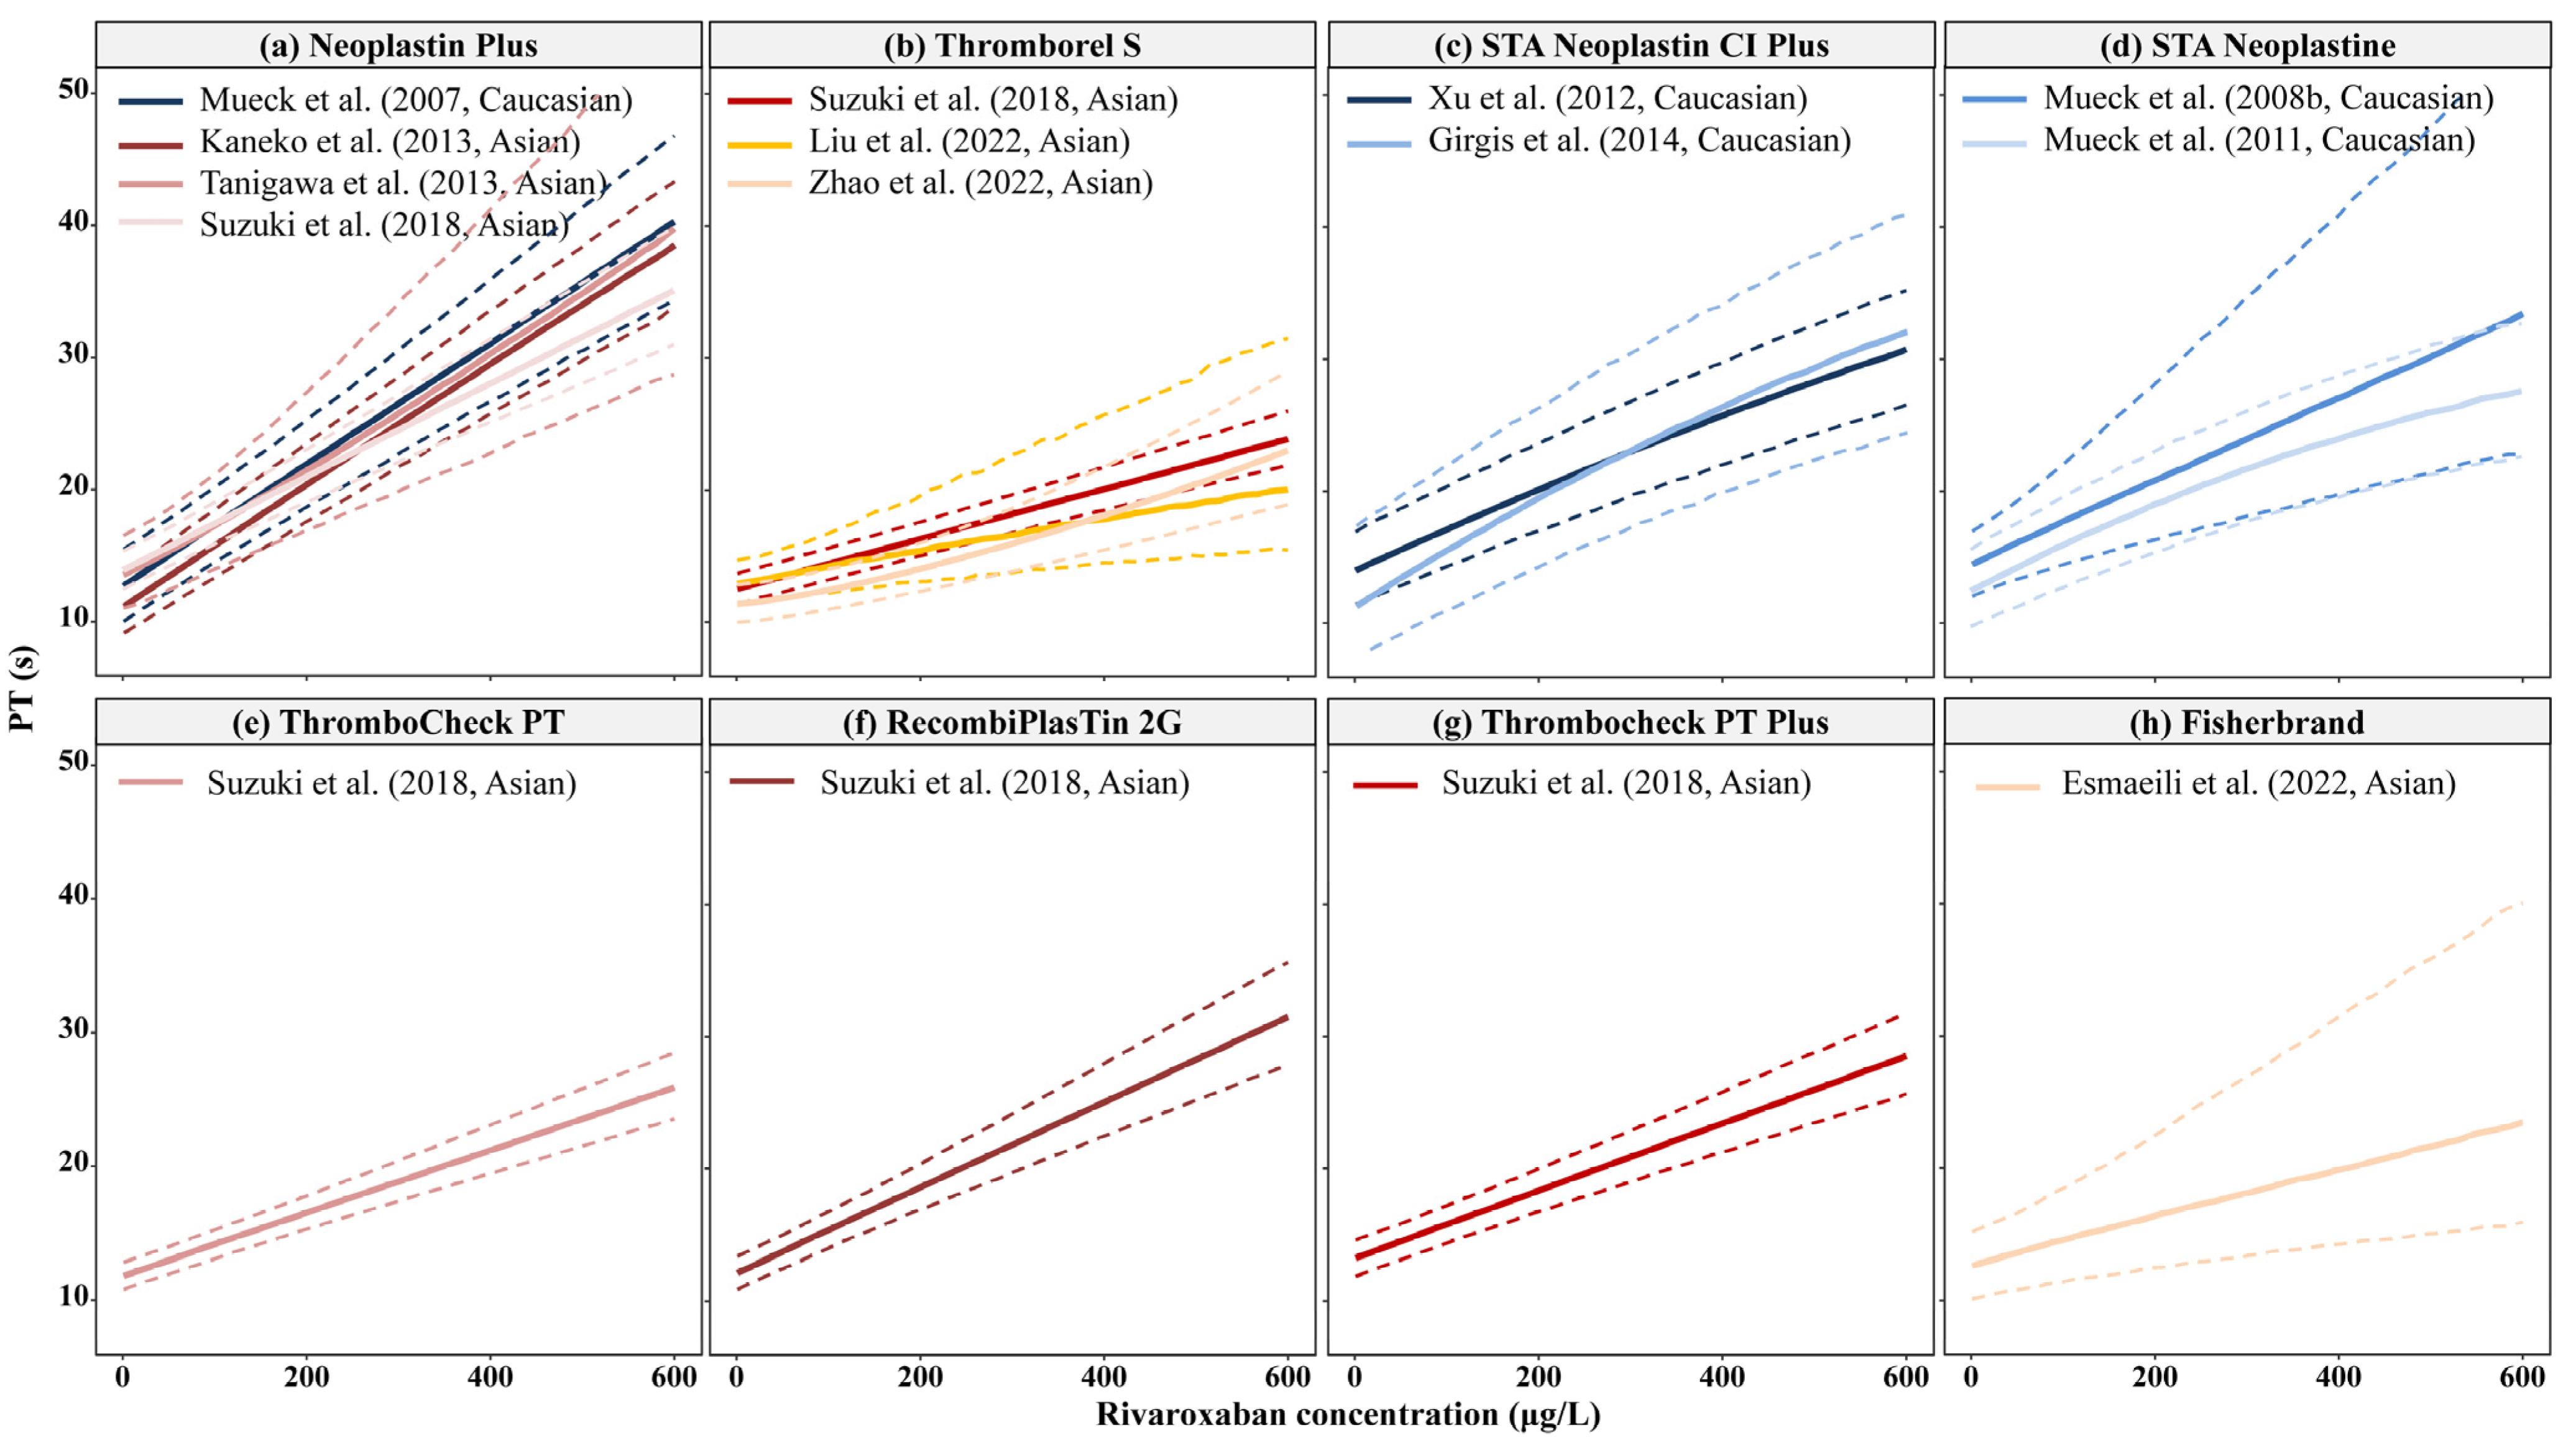
3.4.2. Pharmacodynamics Analysis: PT

Most studies displayed similar VPDs in the PT-time profiles (Figure S6), except for the study by Zdovc et al. [32], which may be due to the imprecise estimation of the PK and PD parameters in that study (ωka: 794%; ωCL: 81%; ωslope: 109%). Therefore, that study was excluded from further analyses.
The relationship between rivaroxaban concentration and PT according to the type of PT reagent used is shown in Figure 3. As illustrated in Figure 3a (Neoplastin Plus), no obvious difference between Asian and Caucasian populations was observed when the same bioassay for PT was used. Moreover, the estimated baseline PT (PT0) was similar between Asian (11.4–14 s) and Caucasian (11.4–13.9 s) populations, as listed in Table 3. The estimated change in PT per unit rivaroxaban concentration change (slope) was also similar between Asians [0.0018–0.0467 s/(μg/L)] [20,25,26,30,34,38] and Caucasians [0.032–0.0458 s/(μg/L)] [19,22,23,24,27,32], but with large variability, which may be due to the different PT reagents employed in these studies.
Renal function (CrCl, eGFR), hepatic function [albumin (ALB), TBIL], demographics (age, BW), hemoglobin (HGB), and total cholesterol were identified as significant covariates for PT0 [20,22,23,24,25,27,34]. However, the impact of these covariates was limited compared to the PT change due to increased rivaroxaban concentration. HCT, ALB, and age were identified as significant covariates on the slope in the study by Suzuki et al. [30], which may deserve further evaluation (Figure S7).

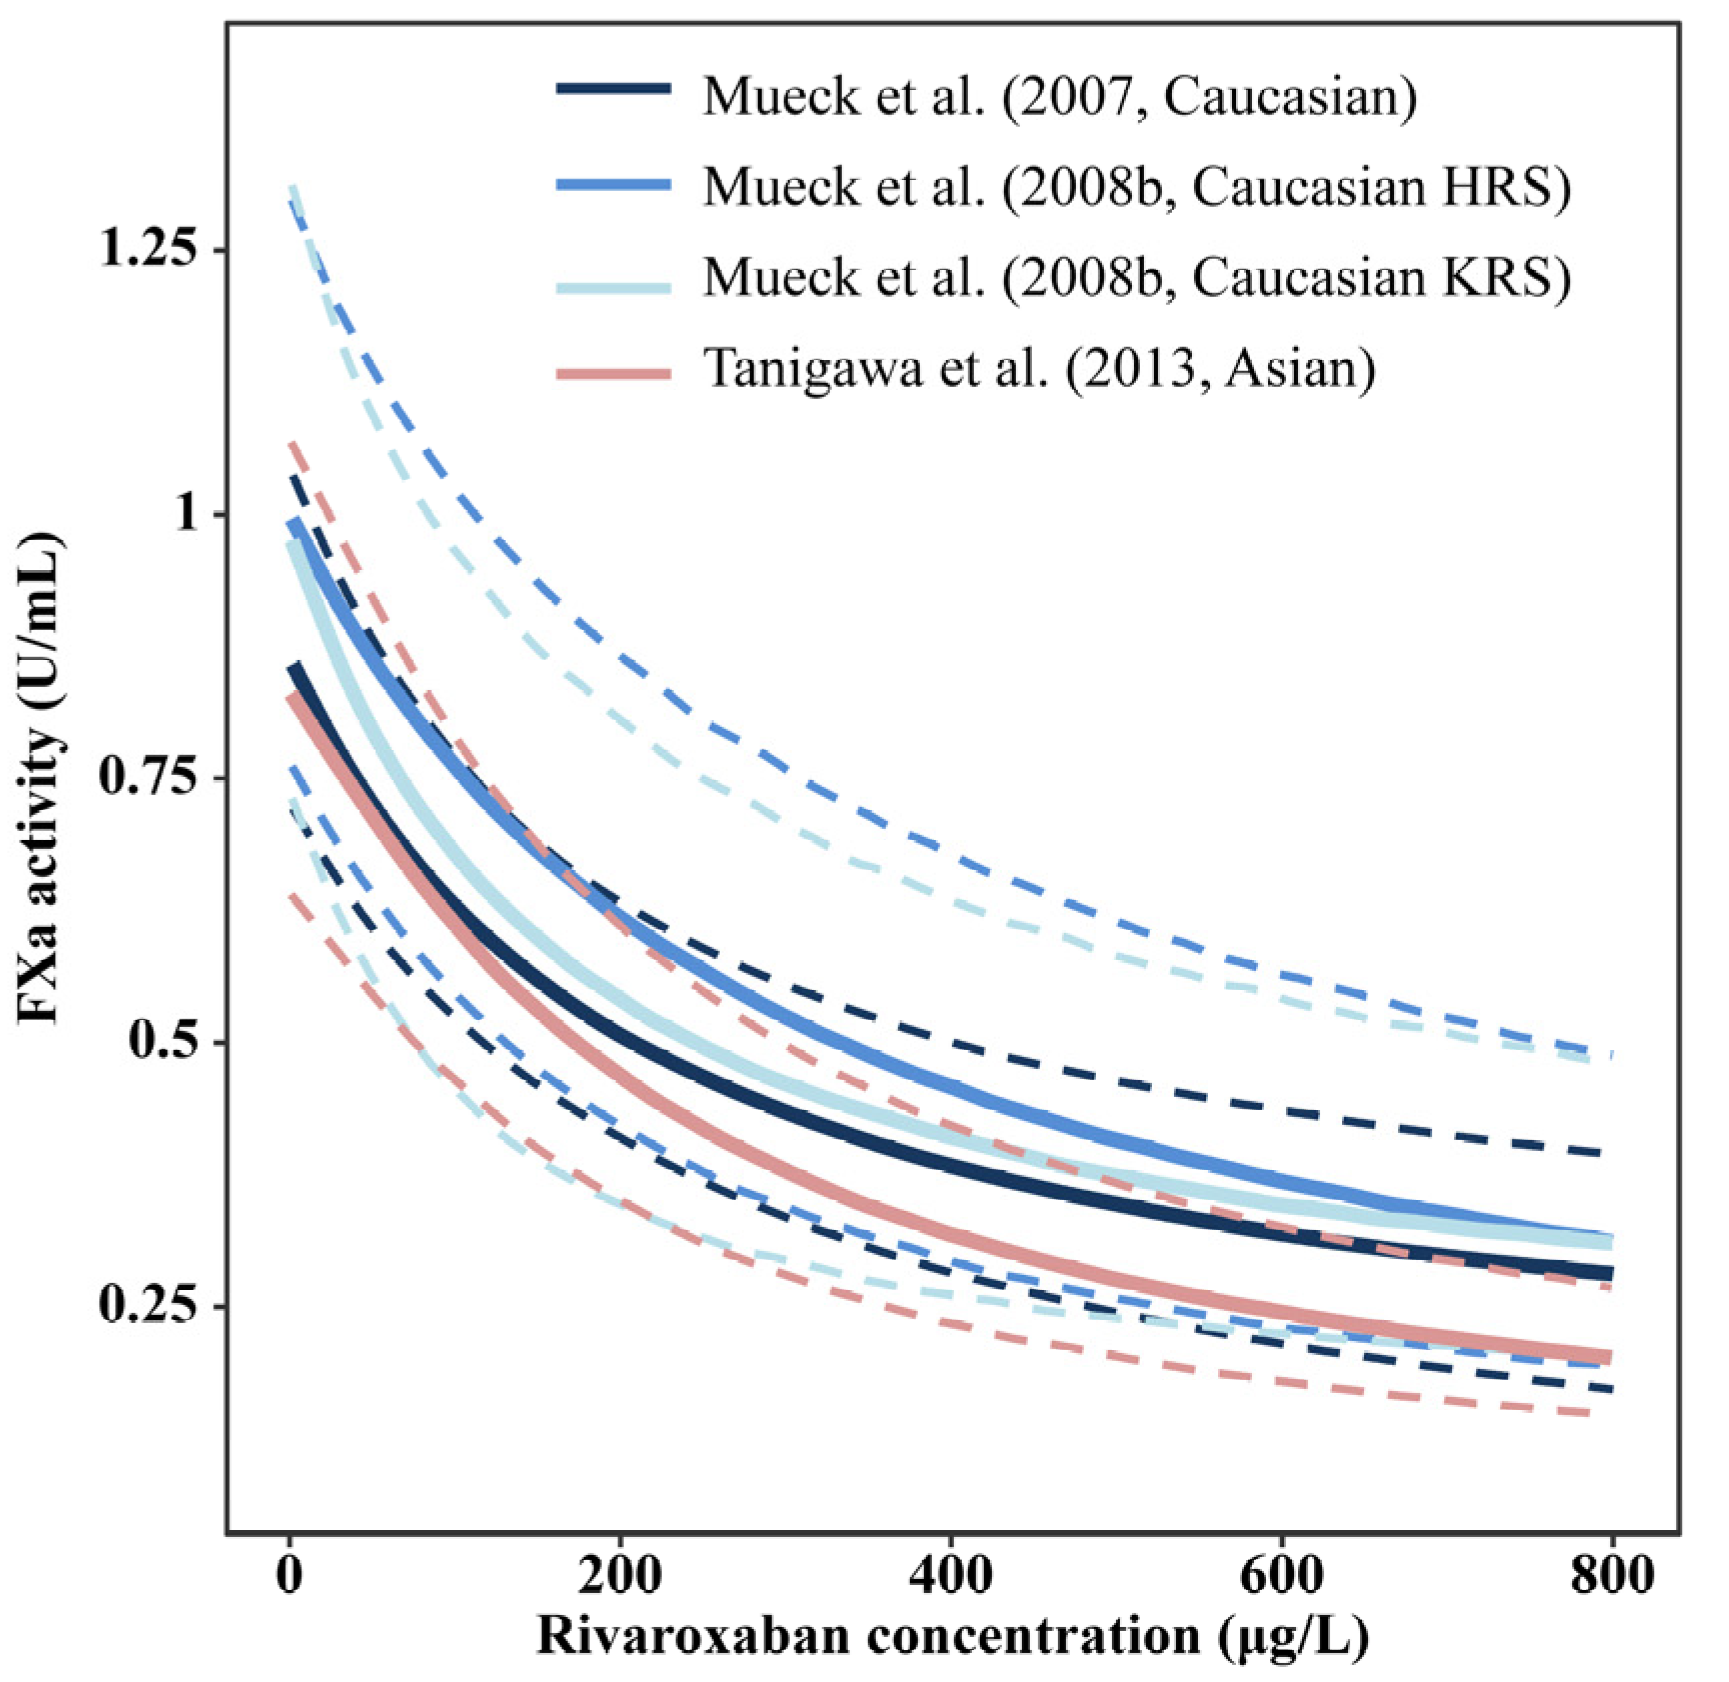
3.4.3. Pharmacodynamics Analysis: FXa Activity

The relationship between FXa activity and rivaroxaban concentration in Asians was similar to that in Caucasians (Figure 4). The estimates of parameters related to FXa activity in the Asian population (FXa0: 0.803 U/mL; Emax: 0.928 U/mL; EC50: 221 μg/L) [26] were comparable to those in Caucasian populations (FXa0: 0.87–1.0 U/mL; Emax: 0.86–0.942 U/mL; EC50: 172–296 μg/L) using the same bioassay for FXa activity determination as listed in Table 3.
The VPDs of FXa activity-time profiles at steady state in all included studies are shown in Figure S8. Few covariates have been reported for FXa activity. Only the study by Girgis et al. [27] found that age had an impact on baseline FXa activity, but no details were provided. Because only one study was conducted on Japanese patients and two studies were conducted in a non-Japanese population, further investigation may need to be performed.

4. Discussion

Rivaroxaban is a DOAC that was first approved in 2008 and is currently widely used globally, for the treatment and prevention of thromboembolic disorders. However, whether a lower rivaroxaban dose is required for Asian people is still debatable. To our knowledge, this is the first systematic review to summarize the knowledge regarding such potential ethnic differences from the perspective of the population PK and PK/PD profiles of rivaroxaban.
Population PK studies conducted in real-world patients showed that the median CL/F of rivaroxaban in adult Caucasian patients was approximately 31–43% higher than in Asian patients with normal renal and hepatic function. This finding is also supported by phase II and III clinical studies conducted on Japanese patients with NVAF [25,26]. An approximate one-third decrease in the CL/F in Asians might lead to the requirement of one-third reduction in the rivaroxaban dose, as compared to that for Caucasians. The effects of BW, age, renal function, and hepatic function could not explain the difference.
The difference in CL/F may be partially attributed to the genetic polymorphism of ABCB1. A population PK study conducted by Zhang et al. [37] identified that patients carrying ABCB1 (rs 4728709) AA/GA had a 47.6% higher CL/F than those with GG. Moreover, Zhang et al. [36] identified that patients carrying ABCB1 (rs1045642) CT/TT had a 25.7% higher CL/F than those with a CC polymorphism [36]. The frequency of ABCB1 (rs 4728709) AA/GA in American and African-American populations was determined to be approximately 2.1-fold higher than that in Asians. Moreover, it was also reported that the trough rivaroxaban concentration between different genotypes of ABCB1 at the rs128503 locus was significantly different [43]. However, all of these studies were performed in a Chinese population, and further studies in other ethnicities may be considered to explore the impact of genetic polymorphisms.
Moreover, food intake may also play a role in the differences in CL/F because the bioavailability of rivaroxaban is food-dependent upon administration at doses between 15 and 20 mg. Differences in dietary habits and diet content among ethnicities may also explain the differences observed. However, information about food, such as meal timing and dietary content, was not recorded in most of the studies and may deserve further investigation.
According to European Medicines Agency, no clinically relevant inter-ethnic differences are observed among Caucasian, African-American, Hispanic, Japanese, or Chinese patients regarding rivaroxaban PK and PD characteristics [44]. However, the statement was different from the Food and Drug Administration (FDA), which reported that healthy Japanese subjects have 20–40% higher exposures on average, compared to those in other ethnicities including Chinese, and these differences in exposure are reduced when corrected for body weight [45]. The reason for this different statement is unclear.
The PK and PD characteristics in Chinese healthy subjects (n = 8) taking a single dose was reported to be in line with that in Caucasian subjects when not corrected by body weight, even though a 47% lower area under the concentration–time curve (AUC) per body weight was observed in Chinese individuals [46]. However, AUC at steady state in Caucasian healthy subjects taking multiple doses of rivaroxaban were 1.32- to 1.51-fold of that in Chinese subjects [46,47]. Data from healthy subjects might not fully represent patients in the real world. Population analyses of real-world data could thus contribute to comprehensively delineating PK and PD characteristics.
Previous exposure–response analyses based on patients with NVAF showed that the risk of ischemic stroke, non-central nervous system systematic embolism, or all-cause death in Asians was not significantly different from that in individuals from other regions. However, Asians had a statistically significantly higher risk of major or non-major clinically relevant bleeding compared to that in West European and Latin American individuals [48]. The different risks of bleeding between geographic regions were also reported in other types of patients [49,50]. This could be partially explained by the other confounding factors, such as history of gastrointestinal bleeding, baseline use of non-steroidal anti-inflammatory drugs or aspirin, and age [48]. Moreover, the higher risk of bleeding in Asians might be attributed to higher rivaroxaban exposure compared to that in other ethnicities with the same dose regimen.
Renal function has a significant impact on the CL/F of rivaroxaban because 1/3 of the drug is eliminated unchanged in the urine, and about half of the metabolites are eliminated by the kidney. The change in CL/F by unit renal function has large variability among studies, ranging from 0.13 to 5.58%, but no obvious difference was observed between Asian and Caucasian populations.
Although approximately 2/3 of rivaroxaban is metabolized by hepatic enzymes [4], only 4 of 24 studies have reported the effect of the hepatic function index on the CL/F of rivaroxaban. The identified indices were ALT, TBIL, and CTP; none were well-recognized in previous studies [30,36,37,38]. This may be because none of these covariates could fully reflect hepatic function.
The effect of age on CL/F was ≤30% and may not have significant clinical relevance as the drug label recommended by the FDA [45]. However, it should be noted that elderly patients in the real world have more concomitant diseases and are prone to have an unstable morbid state [51]. Besides the risk of increased PK exposure, elderly patients also have a higher risk of thrombotic and bleeding events. Therefore, further studies may need to be performed to assess the effects of rivaroxaban treatment on the elderly population.
It has been reported that Caucasian children weighing ≤ 30 kg had at least 47% higher CL/F per body weight (kg) than Caucasian adults. This can be explained by the fact that the ratio of liver to total body mass is larger in children than in adults, resulting in increased blood flow. Stronger hepatic metabolic enzyme activity may also partially contribute to this [52]. Owing to the lack of population PK studies in Asian children, further studies need to be conducted.
The exposure-PT relationship was described as linear or near-linear in Asian and Caucasian patients. The baseline PT and change in PT induced by rivaroxaban concentration in Asians were not significantly different from that in Caucasian populations, suggesting no distinct difference between Asian and Caucasian populations. However, it should be noted that PT may not be a specific biomarker for rivaroxaban and could be influenced by the bioassay method and test reagents used.
In addition, the relationship between exposure and FXa activity in the Asian population was similar to that in the Caucasian population, as described by the Emax model, revealing comparable estimates in baseline FXa, EC50, and Emax. However, only three studies (one in Japanese patients and two in non-Japanese patients) were conducted, which may require further investigation. Moreover, further studies are needed to explore the relationship between FXa activity and clinical outcomes, such as the rate of bleeding and thrombotic events.
Considering the lower CL/F of rivaroxaban in Asians than in Caucasians and the similar PK/PD relationship among ethnicities, it could be inferred that a lower dose of rivaroxaban is required for Asians. This finding is supported by studies based on other Asian populations, except for Japanese individuals [10,11,12]. Meanwhile, the efficacy of a lower rivaroxaban dose was also confirmed with Japanese patients in real world clinical settings [53]. However, owing to inconsistent findings [54,55,56], further studies with larger sample sizes are warranted for verification.
Our study had several limitations. First, because only literature published in English was included in our analysis, studies published in other languages were omitted. However, this may not essentially impact our conclusion because studies published in other languages may be limited by their small sample size. Second, we did not assign weights to studies with different sample sizes and reporting quality when comparing PK/PD characteristics. However, approximately 3/4 of the included studies had a sample size greater than 100 and a compliance rate ≥ 80%, which means that they should be recognized as well-reported.

5. Conclusions

In this review, the potential ethnic difference in the PK/PD of rivaroxaban was evaluated from the perspective of a population analysis. Approximately 31–43% lower CL/F of rivaroxaban was observed in Asians than Caucasians. However, the relationship between rivaroxaban concentration and PT or FXa activity was similar between the two ethnicities. Renal function was identified as a significant covariate of the CL/F of rivaroxaban, and no well-recognized covariates significantly affected PT or FXa activity. A lower dose of rivaroxaban might be required for Asians, and further studies are needed to explain the difference in the CL/F of rivaroxaban between Asian and Caucasian populations, which is essential for optimal patient dose regimens.

Supplementary Materials

The following supporting information can be downloaded at: https://www.mdpi.com/article/10.3390/pharmaceutics15020588/s1, Figure S1: PRISMA flow diagram for identifying population pharmacokinetic and population pharmacokinetic-pharmacodynamic studies of rivaroxaban; Figure S2: Concentration-time profiles of rivaroxaban at steady state; Figure S3: Distribution of apparent clearance of rivaroxaban in Japanese patients, Chinese patients, and other Asian patients with non-valvular atrial fibrillation; Figure S4: The apparent clearance of rivaroxaban versus renal function as reported in population pharmacokinetic models; Figure S5: The apparent clearance per body weight in pediatric and adult patients; Figure S6: Prothrombin time-time profiles of rivaroxaban at steady state for (a) Asian patients with NVAF and (b) Caucasian patients with or without NVAF; Figure S7: Effect of covariates on baseline PT (a) and slope (b); Figure S8: FXa activity-time profiles of rivaroxaban at steady state; Table S1: Checklist for literature quality when reporting a clinical pharmacokinetic study; Table S2: Final population pharmacodynamic parameters of the included studies; Table S3: Demographic information of the simulated patients.

Author Contributions

X.-Q.L. and Z.J. designed the concept and planned the work. X.-Q.L. and Z.-R.L. performed the literature search and data analysis. X.-Q.L. and Z.J. drafted the manuscript. Z.-R.L., C.-Y.W., Y.-T.C. and Z.J. revised the manuscript. All authors have read and agreed to the published version of the manuscript.

Funding

X.-Q.L. is supported by the third ladder elite of Shanghai Chest Hospital. Z.J. is partially supported by National Natural Science Foundation of China (No. 82073933).

Institutional Review Board Statement

Not applicable.

Informed Consent Statement

Not applicable.

Data Availability Statement

All data generated or analyzed during this study are included in this article.

Conflicts of Interest

The authors declare they have no direct conflict of interest.

References

  1. Trujillo, T.; Dobesh, P.P. Clinical use of rivaroxaban: Pharmacokinetic and pharmacodynamic rationale for dosing regimens in different indications. Drugs 2014, 74, 1587–1603. [Google Scholar] [CrossRef] [PubMed]
  2. Young, G.; Lensing, A.W.A.; Monagle, P.; Male, C.; Thelen, K.; Willmann, S.; Palumbo, J.S.; Kumar, R.; Nurmeev, I.; Hege, K.; et al. Rivaroxaban for treatment of pediatric venous thromboembolism. An Einstein-Jr phase 3 dose-exposure-response evaluation. J. Thromb. Haemost. 2020, 18, 1672–1685. [Google Scholar] [CrossRef] [PubMed]
  3. Male, C.; Lensing, A.W.A.; Palumbo, J.S.; Kumar, R.; Nurmeev, I.; Hege, K.; Bonnet, D.; Connor, P.; Hooimeijer, H.L.; Torres, M.; et al. Rivaroxaban compared with standard anticoagulants for the treatment of acute venous thromboembolism in children: A randomised, controlled, phase 3 trial. Lancet Haematol. 2020, 7, e18–e27. [Google Scholar] [CrossRef] [PubMed]
  4. Mueck, W.; Stampfuss, J.; Kubitza, D.; Becka, M. Clinical pharmacokinetic and pharmacodynamic profile of rivaroxaban. Clin. Pharmacokinet. 2014, 53, 1–16. [Google Scholar] [CrossRef] [PubMed]
  5. Stampfuss, J.; Kubitza, D.; Becka, M.; Mueck, W. The effect of food on the absorption and pharmacokinetics of rivaroxaban. Int. J. Clin. Pharmacol. Ther. 2013, 51, 549–561. [Google Scholar] [CrossRef]
  6. Mueck, W.; Kubitza, D.; Becka, M. Co-administration of rivaroxaban with drugs that share its elimination pathways: Pharmacokinetic effects in healthy subjects. Br. J. Clin. Pharmacol. 2013, 76, 455–466. [Google Scholar] [CrossRef]
  7. Kvasnicka, T.; Malikova, I.; Zenahlikova, Z.; Kettnerova, K.; Brzezkova, R.; Zima, T.; Ulrych, J.; Briza, J.; Netuka, I.; Kvasnicka, J. Rivaroxaban—Metabolism, pharmacologic properties and drug interactions. Curr. Drug Metab. 2017, 18, 636–642. [Google Scholar] [CrossRef]
  8. Patel, M.R.; Mahaffey, K.W.; Garg, J.; Pan, G.; Singer, D.E.; Hacke, W.; Breithardt, G.; Halperin, J.L.; Hankey, G.J.; Piccini, J.P.; et al. Rivaroxaban versus warfarin in nonvalvular atrial fibrillation. N. Engl. J. Med. 2011, 365, 883–891. [Google Scholar] [CrossRef]
  9. Hori, M.; Matsumoto, M.; Tanahashi, N.; Momomura, S.-I.; Uchiyama, S.; Goto, S.; Izumi, T.; Koretsune, Y.; Kajikawa, M.; Kato, M.; et al. Rivaroxaban vs. warfarin in Japanese patients with atrial fibrillation—The J-ROCKET AF study. Circ. J. 2012, 76, 2104–2111. [Google Scholar] [CrossRef]
  10. Chan, Y.H.; Lee, H.F.; Wang, C.L.; Chang, S.H.; Yeh, C.H.; Chao, T.F.; Yeh, Y.H.; Chen, S.A.; Kuo, C.T. Comparisons of rivaroxaban following different dosage criteria (ROCKET AF or J-ROCKET AF trials) in Asian patients with atrial fibrillation. J. Am. Heart Assoc. 2019, 8, e013053. [Google Scholar] [CrossRef]
  11. Lee, H.F.; Chan, Y.H.; Tu, H.T.; Kuo, C.T.; Yeh, Y.H.; Chang, S.H.; Wu, L.S.; See, L.C. The effectiveness and safety of low-dose rivaroxaban in Asians with non-valvular atrial fibrillation. Int. J. Cardiol. 2018, 261, 78–83. [Google Scholar] [CrossRef]
  12. Yu, H.T.; Yang, P.S.; Jang, E.; Kim, T.H.; Uhm, J.S.; Kim, J.Y.; Pak, H.N.; Lee, M.H.; Lip, G.Y.H.; Joung, B. Label Adherence of Direct Oral Anticoagulants Dosing and Clinical Outcomes in Patients with Atrial Fibrillation. J. Am. Heart Assoc. 2020, 9, e014177. [Google Scholar] [CrossRef]
  13. Hori, M.; Kajikawa, M. The J-ROCKET AF Study: A matter of ethnicity or a matter of weight? Reply. Circ. J. 2013, 77, 2637. [Google Scholar] [CrossRef]
  14. Terrier, J.; Gaspar, F.; Guidi, M.; Fontana, P.; Daali, Y.; Csajka, C.; Reny, J.L. Population Pharmacokinetic Models for Direct Oral Anticoagulants: A Systematic Review and Clinical Appraisal Using Exposure Simulation. Clin. Pharmacol. Ther. 2022, 112, 353–363. [Google Scholar] [CrossRef]
  15. Kanji, S.; Hayes, M.; Ling, A.; Shamseer, L.; Chant, C.; Edwards, D.J.; Edwards, S.; Ensom, M.H.; Foster, D.R.; Hardy, B.; et al. Reporting Guidelines for Clinical Pharmacokinetic Studies: The ClinPK Statement. Clin. Pharmacokinet. 2015, 54, 783–795. [Google Scholar] [CrossRef]
  16. Jamsen, K.M.; McLeay, S.C.; Barras, M.A.; Green, B. Reporting a population pharmacokinetic-pharmacodynamic study: A journal’s perspective. Clin. Pharmacokinet. 2014, 53, 111–122. [Google Scholar] [CrossRef]
  17. Duffull, S.B.; Wright, D.F. What do we learn from repeated population analyses? Br. J. Clin. Pharmacol. 2015, 79, 40–47. [Google Scholar] [CrossRef]
  18. Goto, E.; Horinaka, S.; Ishimitsu, T.; Kato, T. Factor Xa inhibitors in clinical practice: Comparison of pharmacokinetic profiles. Drug Metab. Pharmacokinet. 2020, 35, 151–159. [Google Scholar] [CrossRef]
  19. Mueck, W.; Becka, M.; Kubitza, D.; Voith, B.; Zuehlsdorf, M. Population model of the pharmacokinetics and pharmacodynamics of rivaroxaban—An oral, direct Factor Xa inhibitor—In healthy subjects. Int. J. Clin. Pharmacol. Ther. 2007, 45, 335–344. [Google Scholar] [CrossRef]
  20. Zhao, N.; Liu, Z.; Xie, Q.; Wang, Z.; Sun, Z.; Xiang, Q.; Cui, Y. A Combined Pharmacometrics Analysis of Biomarker Distribution Under Treatment with Standard- or Low-Dose Rivaroxaban in Real-World Chinese Patients With Nonvalvular Atrial Fibrillation. Front. Pharmacol. 2022, 13, 814724. [Google Scholar] [CrossRef]
  21. Mueck, W.; Borris, L.C.; Dahl, O.E.; Haas, S.; Huisman, M.V.; Kakkar, A.K.; Kälebo, P.; Muelhofer, E.; Misselwitz, F.; Eriksson, B.I. Population pharmacokinetics and pharmacodynamics of once-and twice-daily rivaroxaban for the prevention of venous thromboembolism in patients undergoing total hip replacement. Thromb. Haemost. 2008, 100, 453–461. [Google Scholar] [PubMed]
  22. Mueck, W.; Eriksson, B.I.; Bauer, K.A.; Borris, L.; Dahl, O.E.; Fisher, W.D.; Gent, M.; Haas, S.; Huisman, M.V.; Kakkar, A.K.; et al. Population pharmacokinetics and pharmacodynamics of rivaroxaban--an oral, direct factor Xa inhibitor—In patients undergoing major orthopaedic surgery. Clin. Pharmacokinet. 2008, 47, 203–216. [Google Scholar] [CrossRef] [PubMed]
  23. Mueck, W.; Lensing, A.W.; Agnelli, G.; Decousus, H.; Prandoni, P.; Misselwitz, F. Rivaroxaban: Population pharmacokinetic analyses in patients treated for acute deep-vein thrombosis and exposure simulations in patients with atrial fibrillation treated for stroke prevention. Clin. Pharmacokinet. 2011, 50, 675–686. [Google Scholar] [CrossRef] [PubMed]
  24. Xu, X.S.; Moore, K.; Burton, P.; Stuyckens, K.; Mueck, W.; Rossenu, S.; Plotnikov, A.; Gibson, M.; Vermeulen, A. Population pharmacokinetics and pharmacodynamics of rivaroxaban in patients with acute coronary syndromes. Br. J. Clin. Pharmacol. 2012, 74, 86–97. [Google Scholar] [CrossRef] [PubMed]
  25. Kaneko, M.; Tanigawa, T.; Hashizume, K.; Kajikawa, M.; Tajiri, M.; Mueck, W. Confirmation of model-based dose selection for a Japanese phase III study of rivaroxaban in non-valvular atrial fibrillation patients. Drug Metab. Pharmacokinet. 2013, 28, 321–331. [Google Scholar] [CrossRef]
  26. Tanigawa, T.; Kaneko, M.; Hashizume, K.; Kajikawa, M.; Ueda, H.; Tajiri, M.; Paolini, J.F.; Mueck, W. Model-based dose selection for phase III rivaroxaban study in Japanese patients with non-valvular atrial fibrillation. Drug Metab. Pharmacokinet. 2013, 28, 59–70. [Google Scholar] [CrossRef]
  27. Girgis, I.G.; Patel, M.R.; Peters, G.R.; Moore, K.T.; Mahaffey, K.W.; Nessel, C.C.; Halperin, J.L.; Califf, R.M.; Fox, K.A.; Becker, R.C. Population pharmacokinetics and pharmacodynamics of rivaroxaban in patients with non-valvular atrial fibrillation: Results from ROCKET AF. J. Clin. Pharmacol. 2014, 54, 917–927. [Google Scholar] [CrossRef]
  28. Barsam, S.J.; Patel, J.P.; Roberts, L.N.; Kavarthapu, V.; Patel, R.K.; Green, B.; Arya, R. The impact of body weight on rivaroxaban pharmacokinetics. Res. Pract. Thromb. Haemost. 2017, 1, 180–187. [Google Scholar] [CrossRef]
  29. Zhang, L.; Peters, G.; Haskell, L.; Patel, P.; Nandy, P.; Moore, K.T. A Cross-Study Analysis Evaluating the Effects of Food on the Pharmacokinetics of Rivaroxaban in Clinical Studies. J. Clin. Pharmacol. 2017, 57, 1607–1615. [Google Scholar] [CrossRef]
  30. Suzuki, S.; Yamashita, T.; Kasai, H.; Otsuka, T.; Sagara, K. An analysis on distribution and inter-relationships of biomarkers under rivaroxaban in Japanese patients with non-valvular atrial fibrillation (CVI ARO 1). Drug Metab. Pharmacokinet. 2018, 33, 188–193. [Google Scholar] [CrossRef]
  31. Willmann, S.; Zhang, L.; Frede, M.; Kubitza, D.; Mueck, W.; Schmidt, S.; Solms, A.; Yan, X.; Garmann, D. Integrated population pharmacokinetic analysis of rivaroxaban across multiple patient populations. CPT Pharmacomet. Syst. Pharmacol. 2018, 7, 309–320. [Google Scholar] [CrossRef]
  32. Zdovc, J.; Petre, M.; Pišlar, M.; Repnik, K.; Mrhar, A.; Vogrin, M.; Potočnik, U.; Grabnar, I. Downregulation of ABCB1 gene in patients with total hip or knee arthroplasty influences pharmacokinetics of rivaroxaban: A population pharmacokinetic-pharmacodynamic study. Eur. J. Clin. Pharmacol. 2019, 75, 817–824. [Google Scholar] [CrossRef]
  33. Speed, V.; Green, B.; Roberts, L.N.; Woolcombe, S.; Bartoli-Abdou, J.; Barsam, S.; Byrne, R.; Gee, E.; Czuprynska, J.; Brown, A.; et al. Fixed dose rivaroxaban can be used in extremes of bodyweight: A population pharmacokinetic analysis. J. Thromb. Haemost. 2020, 18, 2296–2307. [Google Scholar] [CrossRef]
  34. Liu, X.Q.; Zhang, Y.F.; Ding, H.Y.; Yan, M.M.; Jiao, Z.; Zhong, M.K.; Ma, C.L. Population pharmacokinetic and pharmacodynamic analysis of rivaroxaban in Chinese patients with non-valvular atrial fibrillation. Acta Pharmacol. Sin. 2022, 43, 2723–2734. [Google Scholar] [CrossRef]
  35. Singkham, N.; Phrommintikul, A.; Pacharasupa, P.; Norasetthada, L.; Gunaparn, S.; Prasertwitayakij, N.; Wongcharoen, W.; Punyawudho, B. Population Pharmacokinetics and Dose Optimization Based on Renal Function of Rivaroxaban in Thai Patients with Non-Valvular Atrial Fibrillation. Pharmaceutics 2022, 14, 1744. [Google Scholar] [CrossRef]
  36. Zhang, D.; Chen, W.; Qin, W.; Du, W.; Wang, X.; Zuo, X.; Li, P. Population Pharmacokinetics and Hemorrhagic Risk Analysis of Rivaroxaban in Elderly Chinese Patients with Nonvalvular Atrial Fibrillation. J. Clin. Pharmacol. 2023, 53, 66–76. [Google Scholar] [CrossRef]
  37. Zhang, F.; Chen, X.; Wu, T.; Huang, N.; Li, L.; Yuan, D.; Xiang, J.; Wang, N.; Chen, W.; Zhang, J. Population Pharmacokinetics of Rivaroxaban in Chinese Patients with Non-Valvular Atrial Fibrillation: A Prospective Multicenter Study. Clin. Pharmacokinet. 2022, 61, 881–893. [Google Scholar] [CrossRef]
  38. Esmaeili, T.; Rezaee, M.; Abdar Esfahani, M.; Davoudian, A.; Omidfar, D.; Rezaee, S. Rivaroxaban population pharmacokinetic and pharmacodynamic modeling in Iranian patients. J. Clin. Pharm. Ther. 2022, 47, 1284–1292. [Google Scholar] [CrossRef]
  39. Willmann, S.; Thelen, K.; Kubitza, D.; Lensing, A.W.A.; Frede, M.; Coboeken, K.; Stampfuss, J.; Burghaus, R.; Mück, W.; Lippert, J. Pharmacokinetics of rivaroxaban in children using physiologically based and population pharmacokinetic modelling: An EINSTEIN-Jr phase I study. Thromb. J. 2018, 16, 32. [Google Scholar] [CrossRef]
  40. Willmann, S.; Coboeken, K.; Zhang, Y.; Mayer, H.; Ince, I.; Mesic, E.; Thelen, K.; Kubitza, D.; Lensing, A.W.A.; Yang, H.; et al. Population pharmacokinetic analysis of rivaroxaban in children and comparison to prospective physiologically-based pharmacokinetic predictions. CPT Pharmacomet. Syst. Pharmacol. 2021, 10, 1195–1207. [Google Scholar] [CrossRef]
  41. Willmann, S.; Ince, I.; Ahsman, M.; Coboeken, K.; Zhang, Y.; Thelen, K.; Kubitza, D.; Zannikos, P.; Zhou, W.; Pina, L.M.; et al. Model-informed bridging of rivaroxaban doses for thromboprophylaxis in pediatric patients aged 9 years and older with congenital heart disease. CPT Pharmacomet. Syst. Pharmacol. 2022, 11, 1111–1121. [Google Scholar] [CrossRef] [PubMed]
  42. Holford, N.; Yim, D.S. Clearance. Trans. Clin. Pharmacol. 2015, 23, 42–45. [Google Scholar] [CrossRef]
  43. Wang, Y.; Chen, M.; Chen, H.; Wang, F. Influence of ABCB1 gene polymorphism on rivaroxaban blood concentration and hemorrhagic events in patients with atrial fibrillation. Front. Pharmacol. 2021, 12, 639854. [Google Scholar] [CrossRef] [PubMed]
  44. European Medicines Agency Summary of Product Characteristics. Available online: https://www.ema.europa.eu/en/documents/product-information/xarelto-epar-product-information_en.pdf (accessed on 13 January 2023).
  45. Food and Drug Administration. XARELTO® (Insert Package). Available online: https://www.accessdata.fda.gov/drugsatfda_docs/label/2021/215859s000lbl.pdf (accessed on 1 November 2022).
  46. Zhao, X.; Sun, P.; Zhou, Y.; Liu, Y.; Zhang, H.; Mueck, W.; Kubitza, D.; Bauer, R.J.; Zhang, H.; Cui, Y. Safety, pharmacokinetics and pharmacodynamics of single/multiple doses of the oral, direct Factor Xa inhibitor rivaroxaban in healthy Chinese subjects. Br. J. Clin. Pharmacol. 2009, 68, 77–88. [Google Scholar] [CrossRef] [PubMed]
  47. Kubitza, D.; Becka, M.; Wensing, G.; Voith, B.; Zuehlsdorf, M. Safety, pharmacodynamics, and pharmacokinetics of BAY 59-7939—An oral, direct Factor Xa inhibitor—After multiple dosing in healthy male subjects. Eur. J. Clin. Pharmacol. 2005, 61, 873–880. [Google Scholar] [CrossRef]
  48. Zhang, L.; Yan, X.; Fox, K.A.A.; Willmann, S.; Nandy, P.; Berkowitz, S.D.; Hermanowski-Vosatka, A.; Weitz, J.I.; Solms, A.; Schmidt, S.; et al. Associations between model-predicted rivaroxaban exposure and patient characteristics and efficacy and safety outcomes in patients with non-valvular atrial fibrillation. J. Thromb. Thrombolysis 2020, 50, 20–29. [Google Scholar] [CrossRef]
  49. Zhang, L.; Yan, X.; Nandy, P.; Willmann, S.; Fox, K.A.A.; Berkowitz, S.D.; Sharma, A.; Hermanowski-Vosatka, A.; Schmidt, S.; Weitz, J.I.; et al. Influence of model-predicted rivaroxaban exposure and patient characteristics on efficacy and safety outcomes in patients with acute coronary syndrome. Ther. Adv. Cardiovasc. Dis. 2019, 13, 1753944719863641. [Google Scholar] [CrossRef]
  50. Reinecke, I.; Solms, A.; Willmann, S.; Spiro, T.E.; Peters, G.; Weitz, J.I.; Mueck, W.; Garmann, D.; Schmidt, S.; Zhang, L.; et al. Associations between model-predicted rivaroxaban exposure and patient characteristics and efficacy and safety outcomes in the prevention of venous thromboembolism. J. Thromb. Thrombolysis 2020, 50, 12–19. [Google Scholar] [CrossRef]
  51. Kampouraki, E.; Abohelaika, S.; Avery, P.; Biss, T.; Murphy, P.; Wynne, H.; Kamali, F. Elderly people are inherently sensitive to the pharmacological activity of rivaroxaban: Implications for DOAC prescribing. J. Thromb. Thrombolysis 2021, 52, 170–178. [Google Scholar] [CrossRef]
  52. Batchelor, H.K.; Marriott, J.F. Paediatric pharmacokinetics: Key considerations. Br. J. Clin. Pharmacol. 2015, 79, 395–404. [Google Scholar] [CrossRef] [Green Version]
  53. Ikeda, T.; Ogawa, S.; Kitazono, T.; Nakagawara, J.; Minematsu, K.; Miyamoto, S.; Murakawa, Y.; Iwashiro, S.; Okayama, Y.; Sunaya, T.; et al. Real-world safety and effectiveness of rivaroxaban using Japan-specific dosage during long-term follow-up in patients with atrial fibrillation: XAPASS. PLoS ONE 2021, 16, e0251325. [Google Scholar] [CrossRef]
  54. Chan, Y.H.; Chao, T.F.; Chen, S.W.; Lee, H.F.; Yeh, Y.H.; Huang, Y.C.; Chang, S.H.; Kuo, C.T.; Lip, G.Y.H.; Chen, S.A. Off-label dosing of non-vitamin K antagonist oral anticoagulants and clinical outcomes in Asian patients with atrial fibrillation. Heart Rhythm 2020, 17, 2102–2110. [Google Scholar] [CrossRef]
  55. Lee, S.R.; Lee, Y.S.; Park, J.S.; Cha, M.J.; Kim, T.H.; Park, J.; Park, J.K.; Lee, J.M.; Kang, K.W.; Shim, J.; et al. Label Adherence for Non-Vitamin K Antagonist Oral Anticoagulants in a Prospective Cohort of Asian Patients with Atrial Fibrillation. Yonsei Med. J. 2019, 60, 277–284. [Google Scholar] [CrossRef]
  56. Amarenco, P.; Haas, S.; Hess, S.; Kirchhof, P.; Lambelet, M.; Bach, M.; Turpie, A.G.G.; Camm, A.J. Outcomes associated with non-recommended dosing of rivaroxaban: Results from the XANTUS study. Eur. Heart J. Cardiovasc. Pharmacother. 2019, 5, 70–79. [Google Scholar] [CrossRef]
Figure 1. Apparent clearance of rivaroxaban in adult Caucasian and Asian patients with non-valvular atrial fibrillation taking 10–20 mg rivaroxaban. The typical patients of Caucasian and Asians were set as male, 60 years old, and had the following demographic parameters: body weight, 70 kg; lean body mass (LBM), 50 kg; serum creatinine, 1 mg/dL; creatinine clearance (CrCl, or estimated glomerular filtration rate [eGFR]), 80 mL/min; CrCl calculated with LBM, 60 mL/min; blood urea nitrogen, 16 mg/dL; hematocrit, 40%; albumin, 4 g/dL; alanine aminotransferase, 22 IU/L; total bilirubin, 14 μmol/L; transformed Child–Turcotte–Pugh Score, 5.7; ABCB1 expression, 1.25; ABCB1 rs1045642, TT; ABCB1 rs4728709, GG; and without the co-administration of CYP3A4 inducers/inhibitors or P-gp inhibitors. The dashed and dotted lines in each panel represent the median, 5th, and 95th percentiles of the apparent clearance in each corresponding population, respectively. * The dose-dependent bioavailability (F) was estimated in study by Willmann et al. [18,25,26,30,31,33,34,35,36,37,38].
Pharmaceutics 15 00588 g001
Figure 2. Effect of covariates on the apparent clearance of rivaroxaban. The horizontal bars represent the effect of each covariate on clearance (CL) in each study. The effect of each covariate on CL was characterized as the ratio of CL in the range of each covariate to the typical CL. The gray shadow represents the range of 80–125% [18,20,25,26,28,30,31,33,34,35,36,37,38,39,40,41].
Pharmaceutics 15 00588 g002
Figure 3. Relationship between prothrombin time (PT) and rivaroxaban concentration between Asian and Caucasian populations using different PT thromboplastin reagents. The reagents used in the included studies were the following: (a) Neoplastion Plus, (b) Thromborel S, (c) STA Neoplastin CI Plus, (d) STA Neoplastine, (e) ThromboCheck PT, (f) RecombiPlasTin 2G, (g) Thrombocheck PT Plus, and (h) Fisherbrand. The bold, solid, and dashed lines represent the median, 5th, and 95th percentiles of the simulated PT-rivaroxaban concentration profiles in each model, respectively. Zdovc et al. reported PT models with a reagent named Thromborel S. Because the PT-time profile of that model was significantly different from the others (Supplementary Figure S3), it was excluded from the subgroup analysis [19,20,22,23,24,25,26,27,30,34,38].
Pharmaceutics 15 00588 g003
Figure 4. Relationship between Factor Xa activity and rivaroxaban concentration between Asian and Caucasian. The bold, solid, and dashed lines represent the median, 5th, and 95th percentiles of the simulated Factor Xa activity-rivaroxaban concentration profiles in each study, respectively. HRS: patients with hip replacement surgery; KRS: patients with knee replacement surgery [19,22,26].
Pharmaceutics 15 00588 g004
Disclaimer/Publisher’s Note: The statements, opinions and data contained in all publications are solely those of the individual author(s) and contributor(s) and not of MDPI and/or the editor(s). MDPI and/or the editor(s) disclaim responsibility for any injury to people or property resulting from any ideas, methods, instructions or products referred to in the content.

