
Integrating In Vitro Biopharmaceutics into Physiologically Based Biopharmaceutic Model (PBBM) to Predict Food Effect of BCS IV Zwitterionic Drug (GSK3640254)
 , , ,
, , ,
Abstract
:1. Introduction
- (1)
- Should the free or the total luminal concentration be used as reference for permeation?
- The current assumption is that only the free monomers will permeate the cell membrane. However, what evidence/criteria should enable this decision?
- (2)
- Which biorelevant media should be used, and which better reflect the in vivo solubility of GSK254?
- (3)
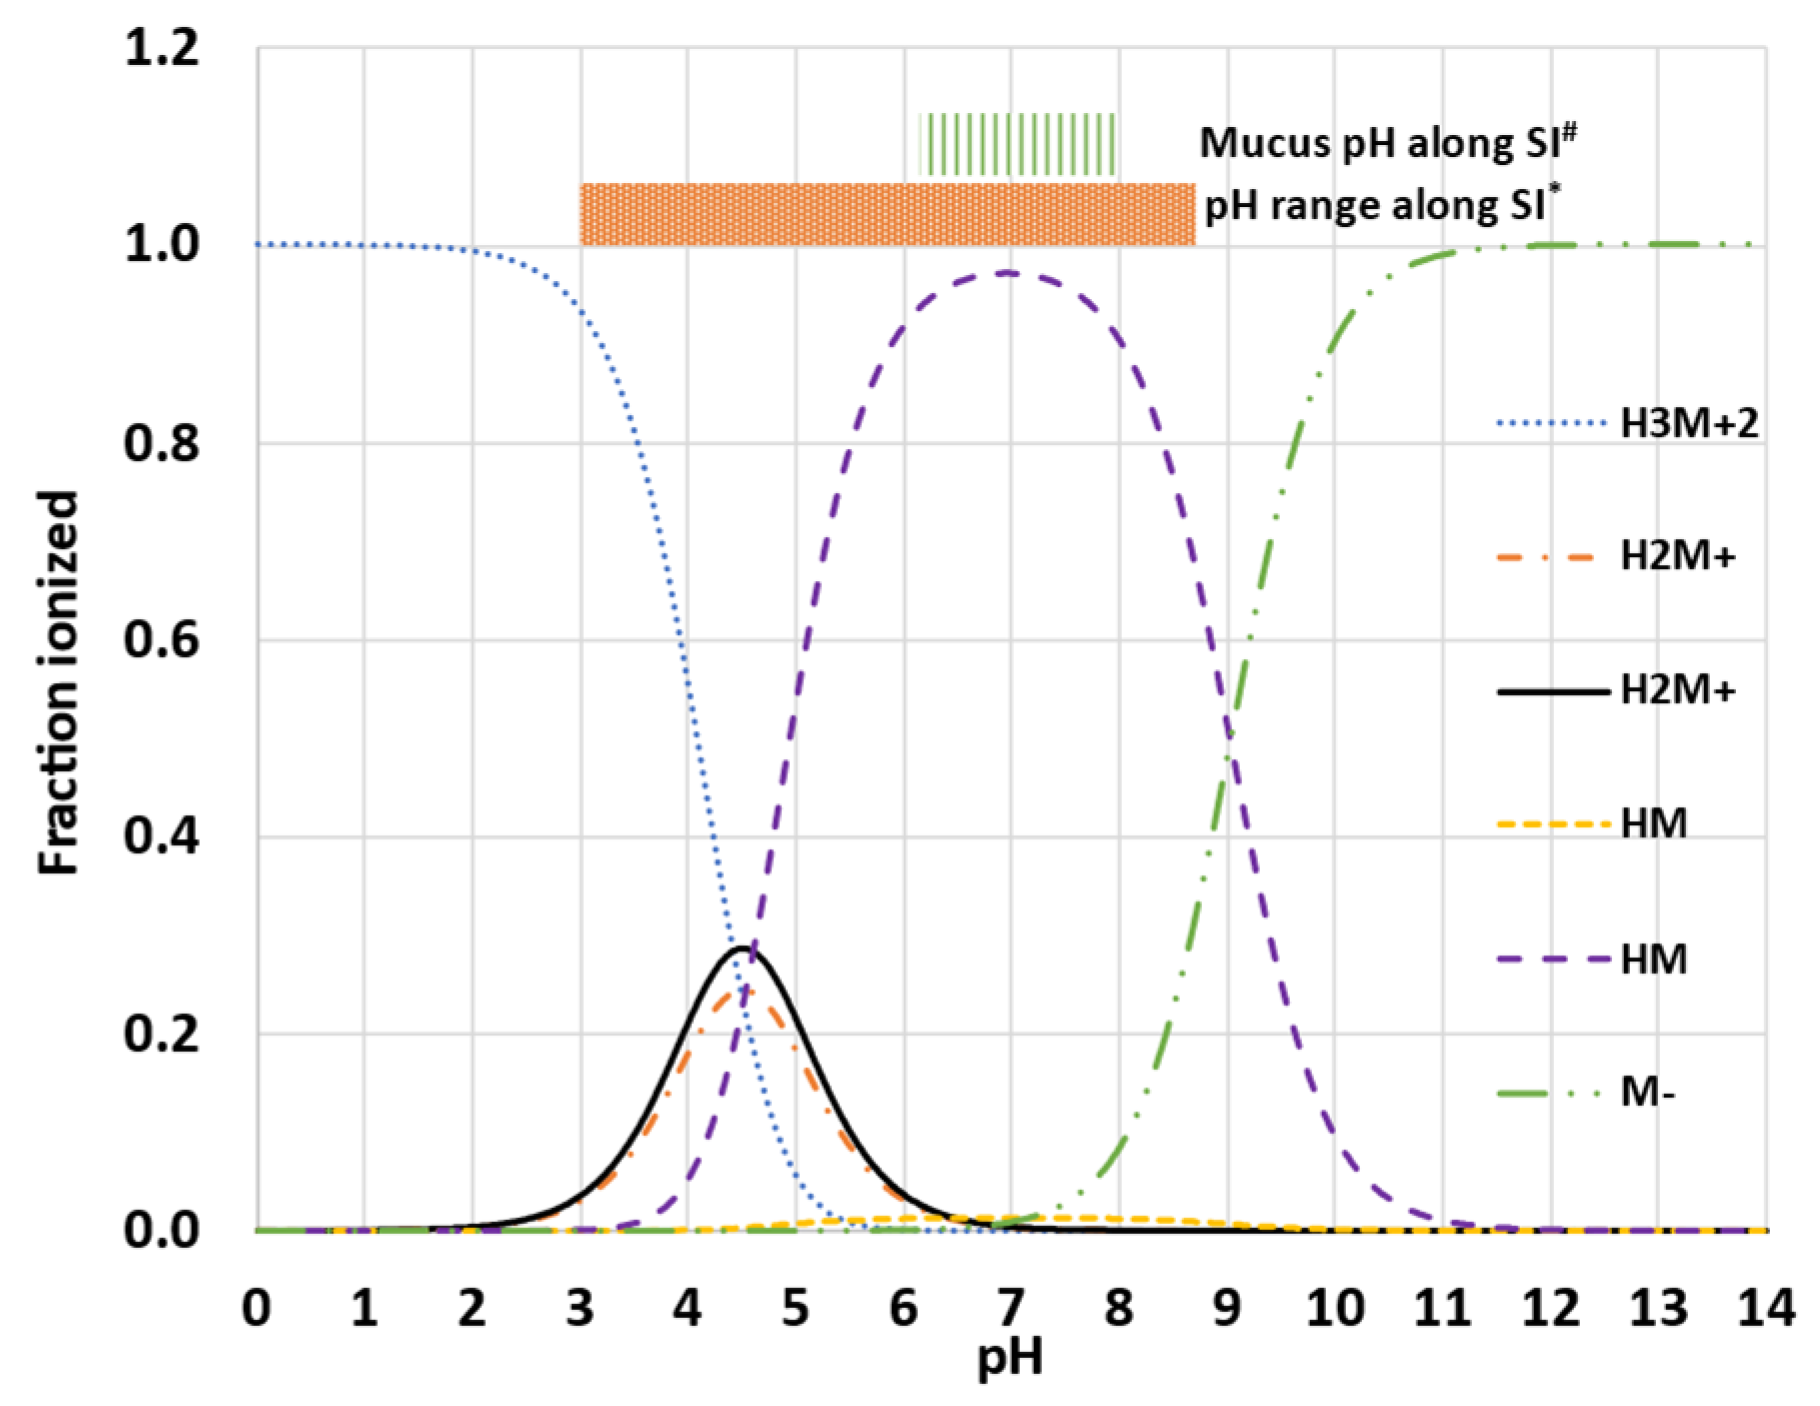
- PBPK platforms, such as Simcyp®, use the water-to-micelle partition coefficient (LogKM:W) to estimate the total solubility of the drug, as well as to calculate the free fraction available for absorption in the mechanistic permeability model (MechPeff). However, the LogKM:W is a single value applied on two different environments, the bulk luminal environment and the mucus microenvironment. Considering the challenges with different ionization of an ampholyte between the two environments, can a global/single parameter be used and describe both, luminal solubility, and permeability? The reason is that the LogKM:W for the ionized species is a single value and cannot describe the electrostatic repulsion and attraction interactions, occurring interchangeably, between the drug and the micelles. Thus, the luminal pH may favor electrostatic attraction forces, whereas the mucus pH favors repulsion forces and vice versa.
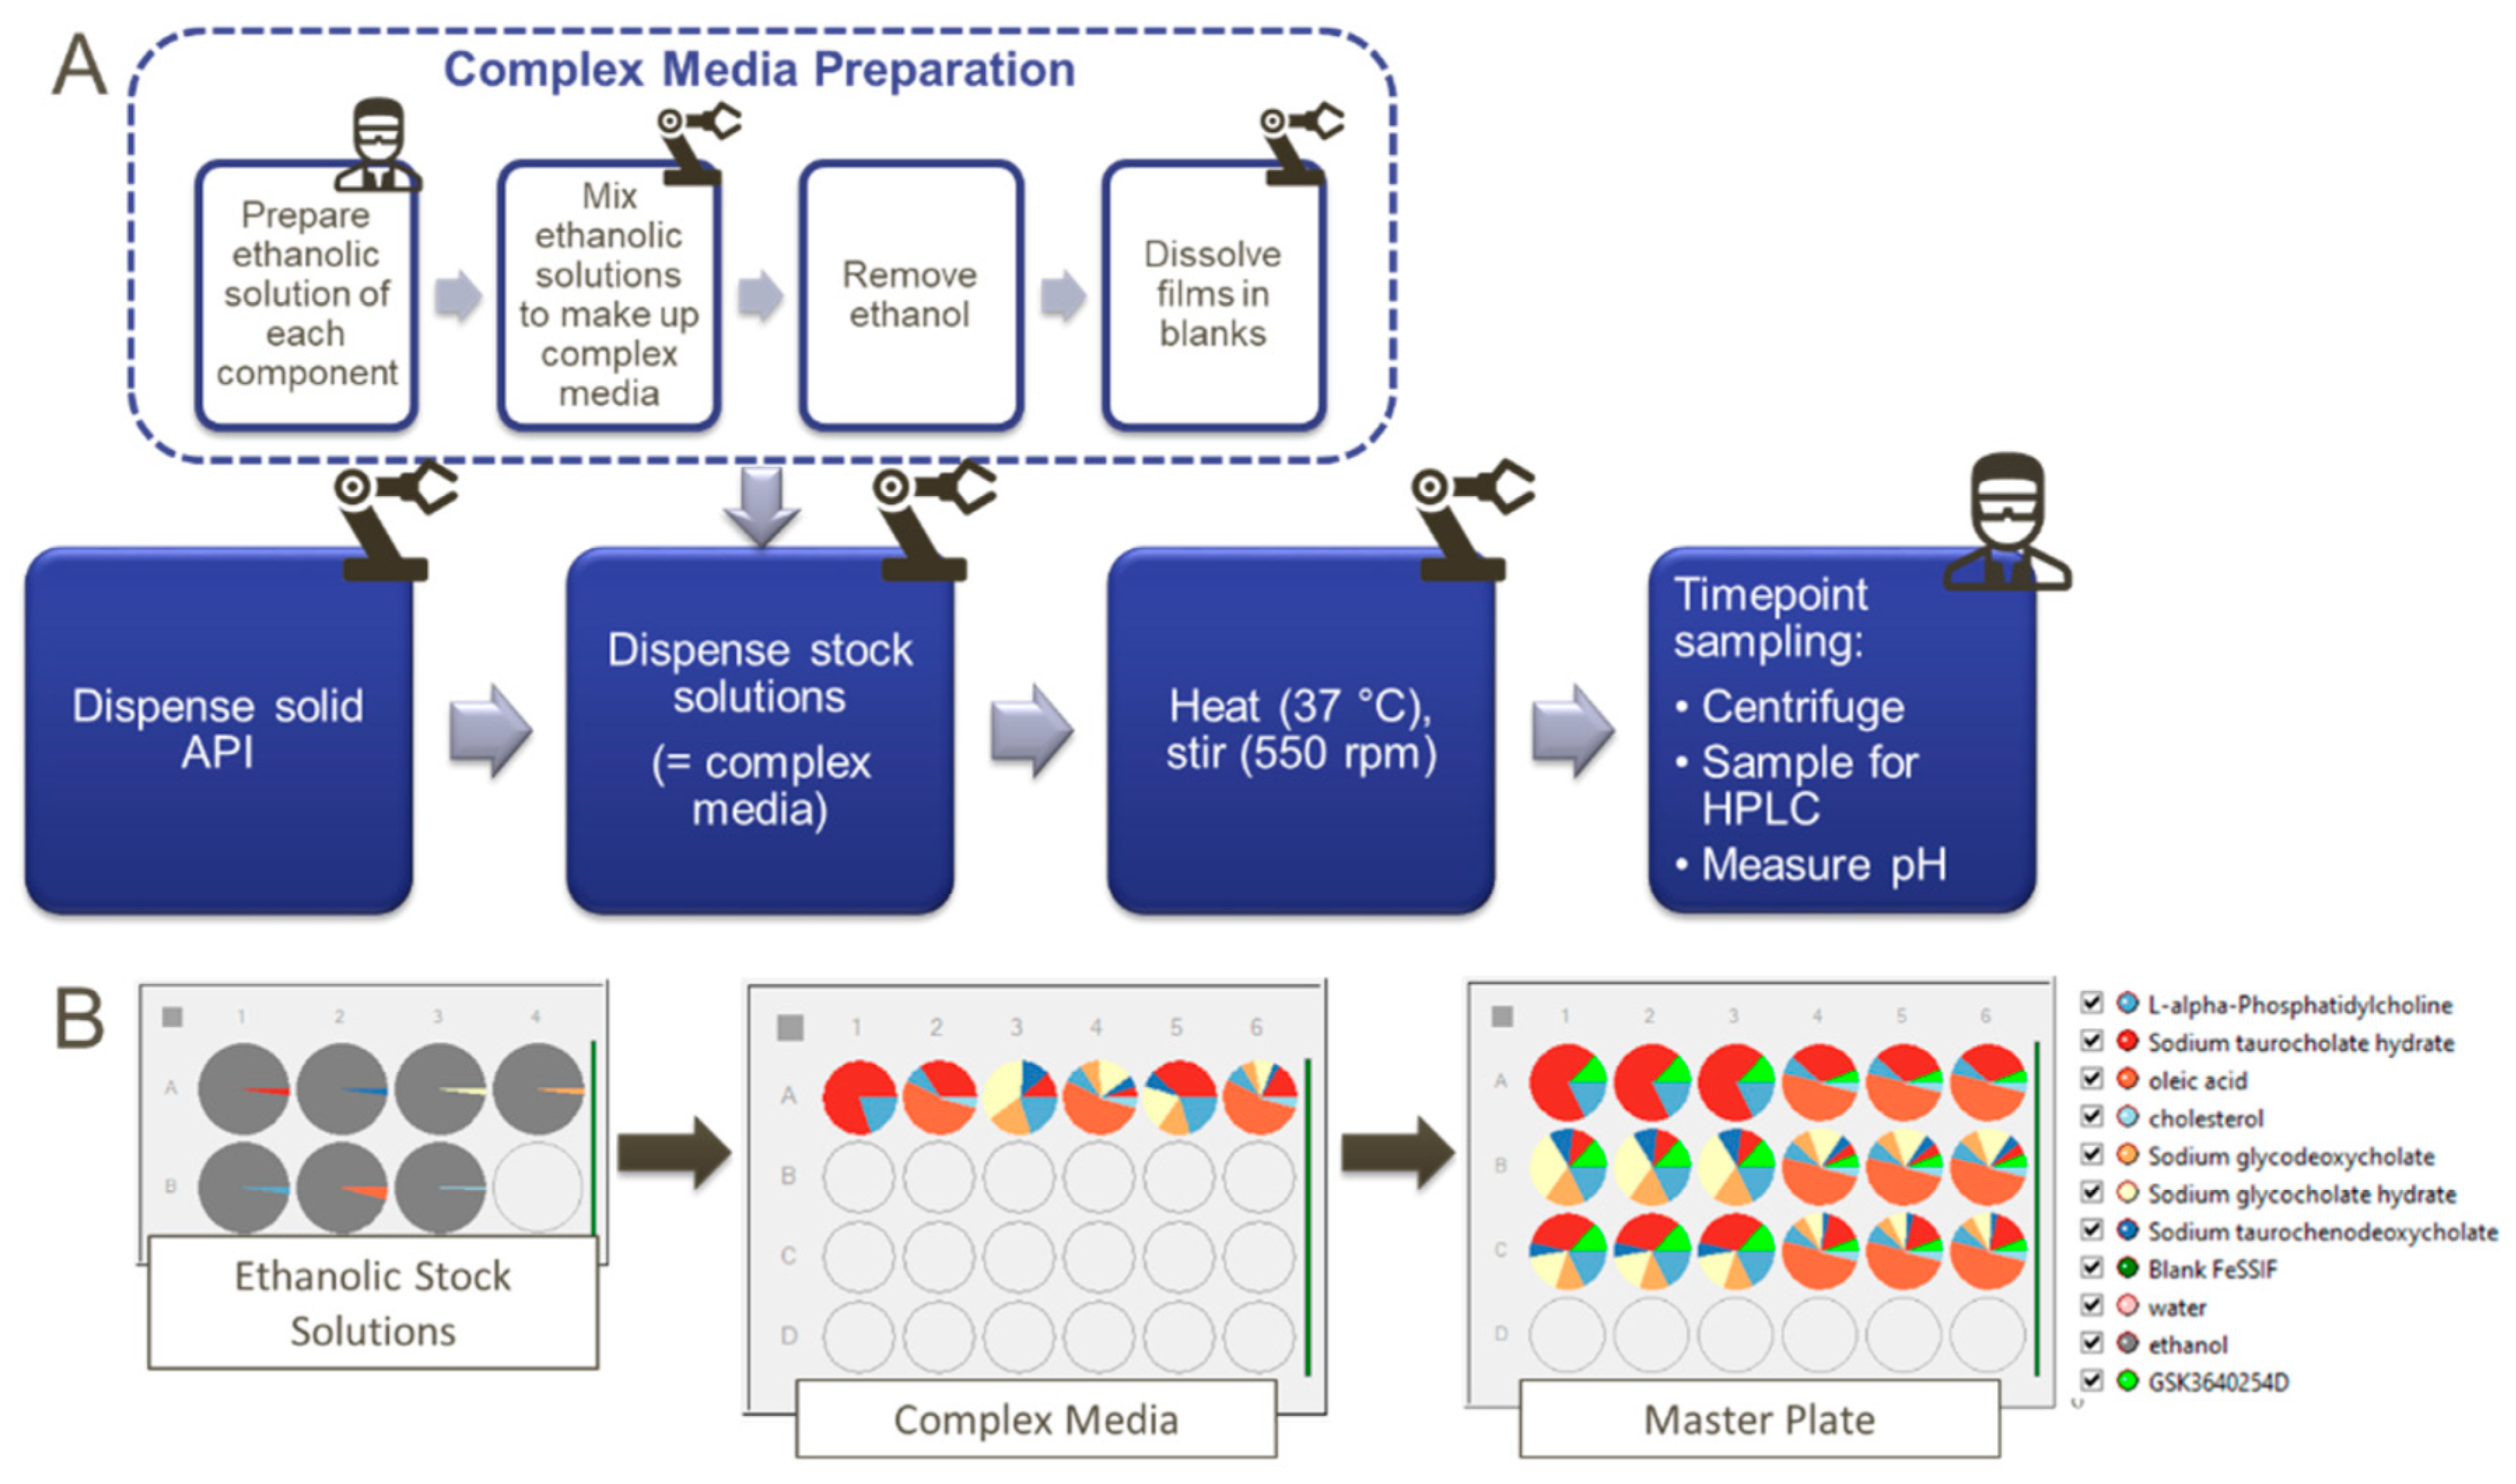
2. Materials and Methods
2.1. List of Chemicals
2.2. Solubility Measurements
2.3. Permeability Measurements
2.4. Clinical Studies
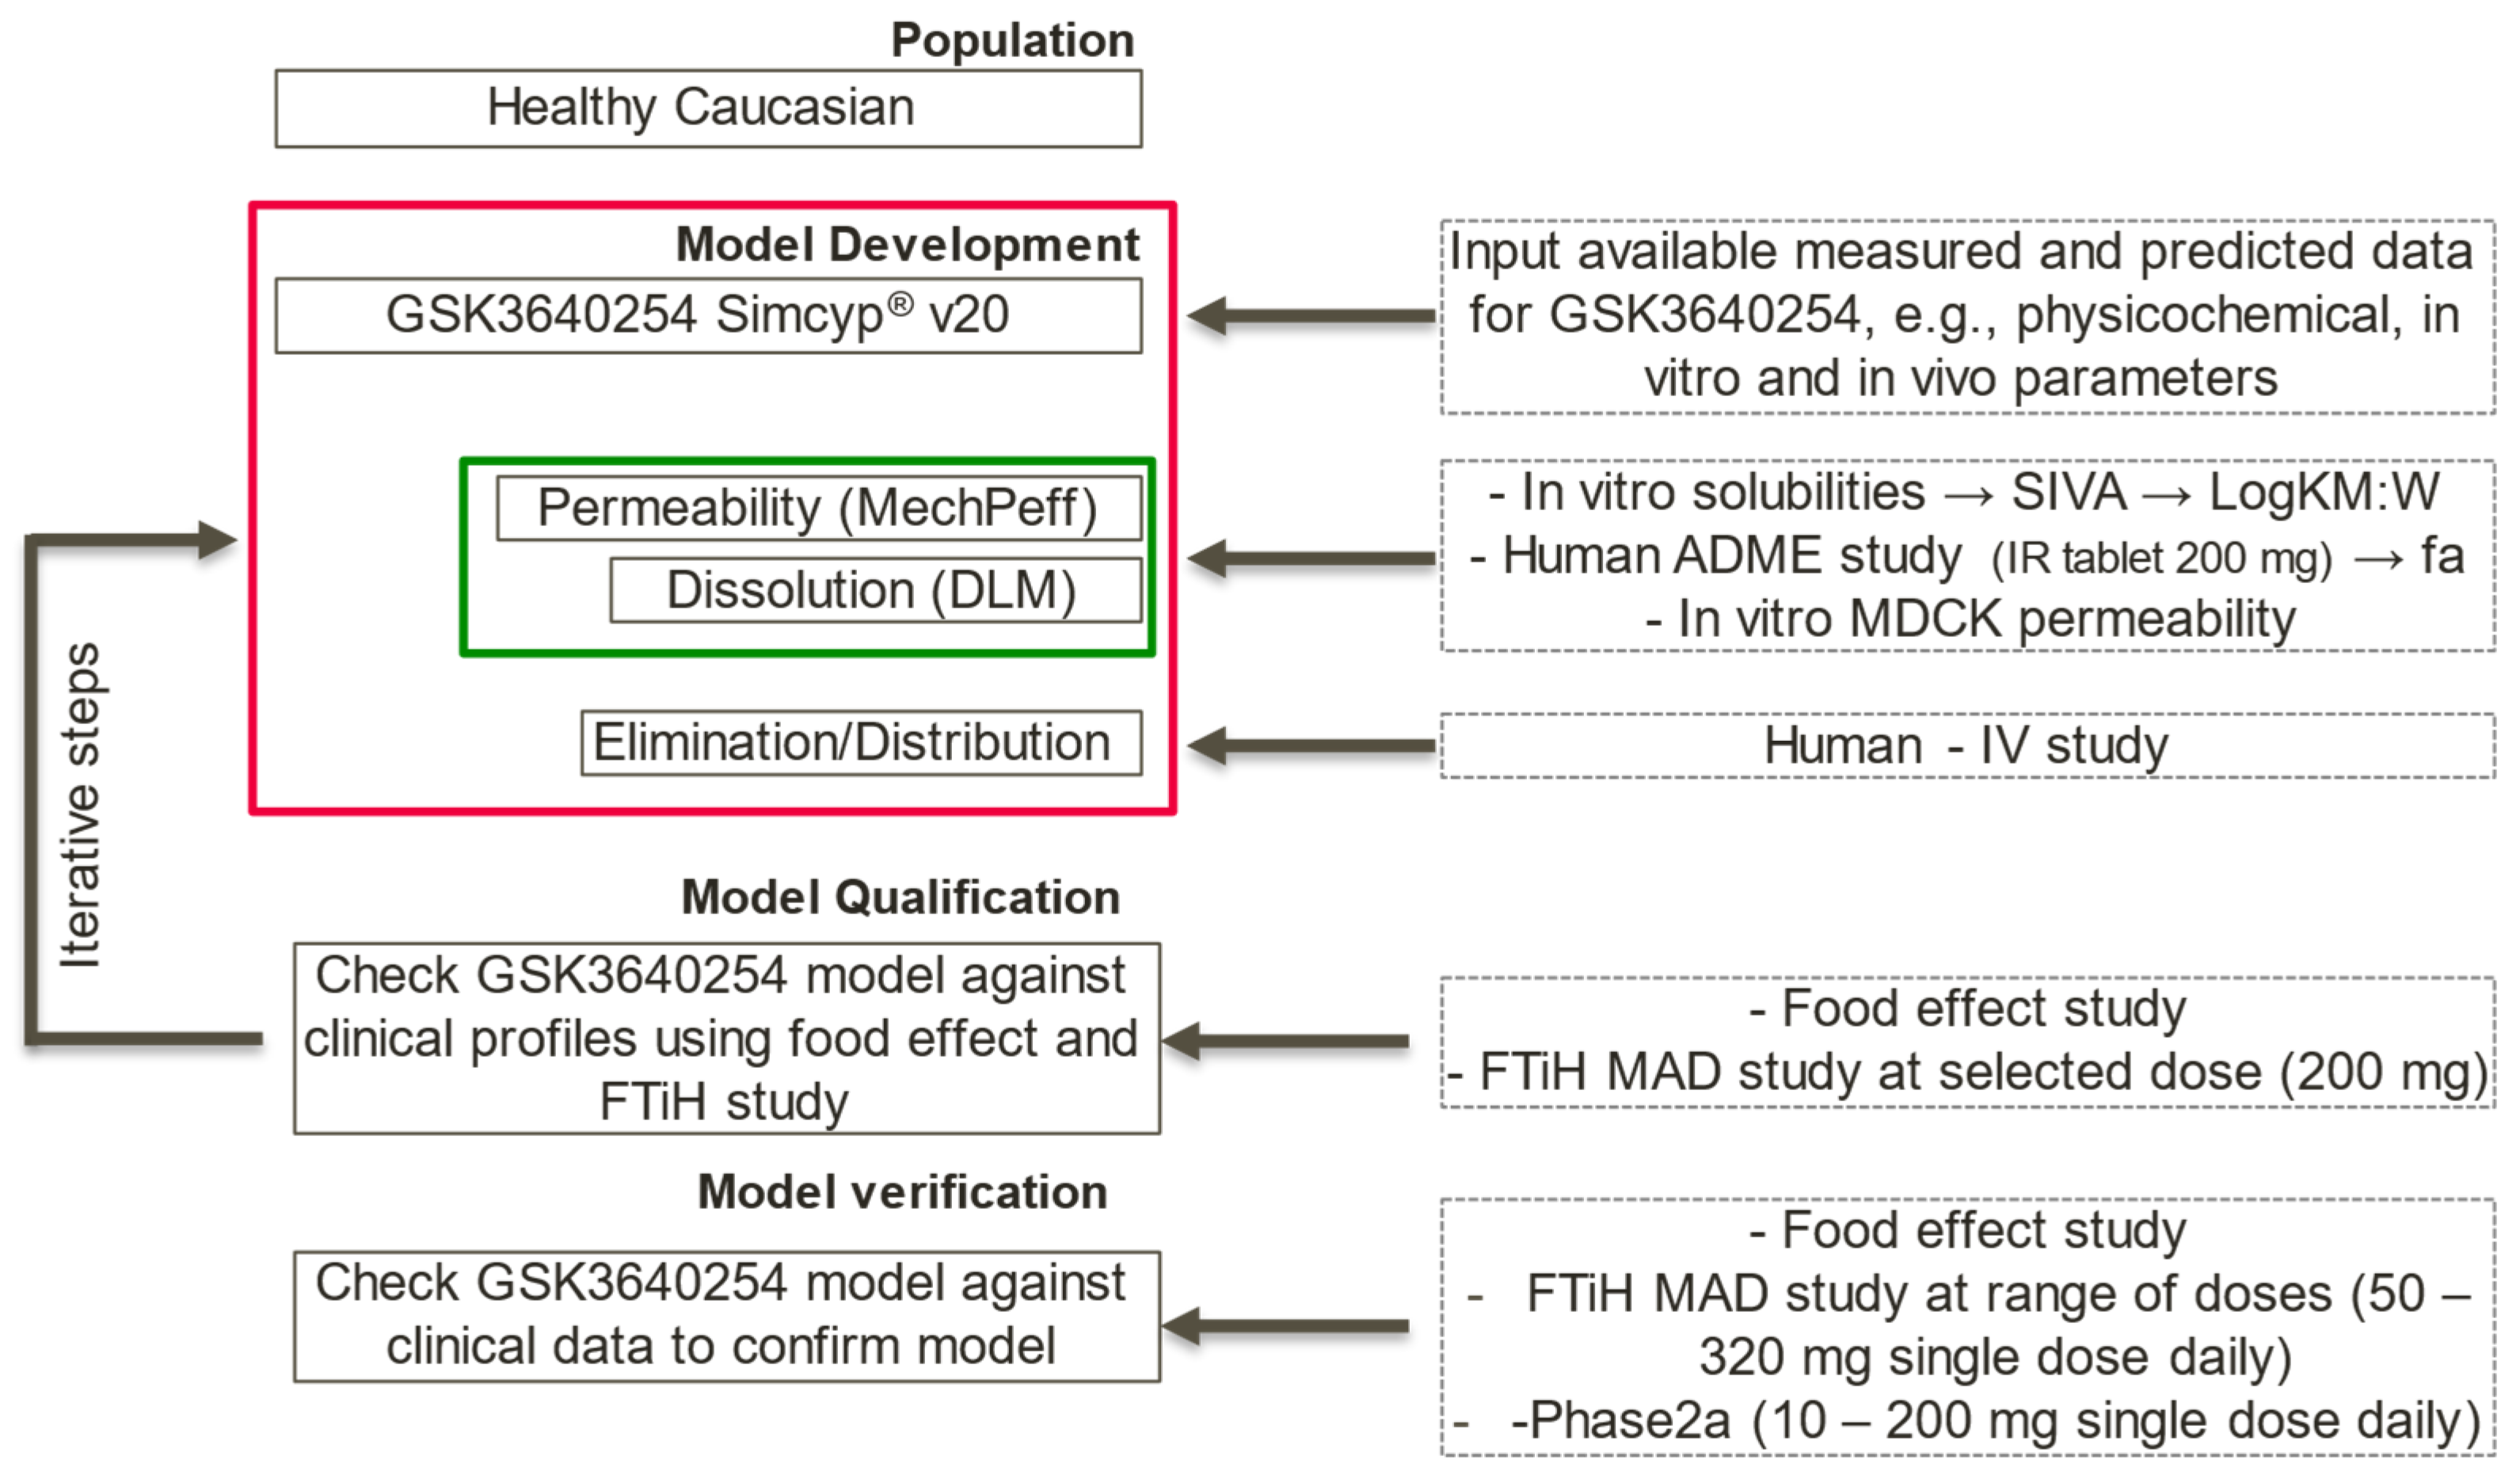
2.5. PBBM Modelling Strategy
2.5.1. Dissolution and Absorption
- (1)
- GSK254 solubility in aqueous media was below the limit of quantification. Hence, it was not possible to measure a quantitative value for the intrinsic solubility (S0) of the drug. Therefore, a value of 0.00015 (mg/mL) was used after fitting FTIH clinical data, i.e., across a range of doses. However, the sensitivity analysis showed that any value below 0.001 (mg/mL) showed no significant difference in the predictions in both fasted and fed states.
- (2)
- A mass balance (ADME) study alongside the in vitro permeability data was used to set the parameters for the MechPeff model for the fed state.
- First, deconvolution of the plasma concentration profile of an immediate release (IR) tablet formulation (single dose—200 mg) was performed to get the dissolution profile that was directly imported to the ADAM model in order to remove at this development stage any issue with population variability in solubility/dissolution of the drug in fed and focus on capturing the fraction of the drug absorbed in the enterocytes (i.e., fa) and hence the pharmacokinetic (pk) data of the drug.
- Parameter Sensitivity Analysis (PSA) was performed to understand the interplay of reference concentration for permeation, ion permeation and LogKM:W on the pharmacokinetic parameters of GSK254, such as Cmax and Tmax. PSA was performed at this development stage at fixed intrinsic transcellular permeability (Ptrans,0) predicted from octanol-to-water partition coefficient (LogPO:W). The reason for looking to the reference concentration for permeation is that the assumption behind the two options available in the MechPeff model (i.e., free fraction or total concentration) is that the free monomer can be absorbed by the enterocytes and secondly, the diffusion of the bound drug to micelles is lower compared to free monomer, which will affect the mucus permeability (PUBL) and hence the overall permeability. The decision of which option was chosen was made based on assessing the outcomes of the PSA with respect to the clinical data as well as with the observations from the in vitro permeability data in the presence of bile salt micelles. Similarly, the in vitro permeability data was used to decide if ion permeation was occurring or not.
- Another adjustment was to significantly reduce the absorption of GSK254 in the colon (see Table 3). GSK254, upon absorption, is metabolized to its glucuronide via UGT glucuronidation in the liver. This metabolite is secreted via biliary clearance and re-ejected to the small intestine. Because of its high hydrophilicity, this metabolite does not get absorbed and hence it is accumulated in the colon. Upon bacterial metabolism, the glucuronide is converted back to the parent drug. However, the absorption of the formed GSK254 is negligible and this is supported by the PO-ADME study in which the faeces losses were >94% in the parent drug [12]. Moreover, no GSK254-glucoronide was detected in the faeces, suggesting almost complete conversion of the glucuronide back to GSK254 in the gut with no significant re-absorption of GSK254. This can be further supported from the IV-ADME study where there were no secondary peaks, suggesting no enterohepatic recirculation of GSK254 after bacterial metabolism of its glucuronide form. Thus, reducing the absorption in the colonic compartment in the PBBM model is a valid approach supported by clinical data.
- (3)
- SIVA v4 was used to estimate LogKM:W values from the in vitro solubility measurements and the values imported into the ADAM model.
- (4)
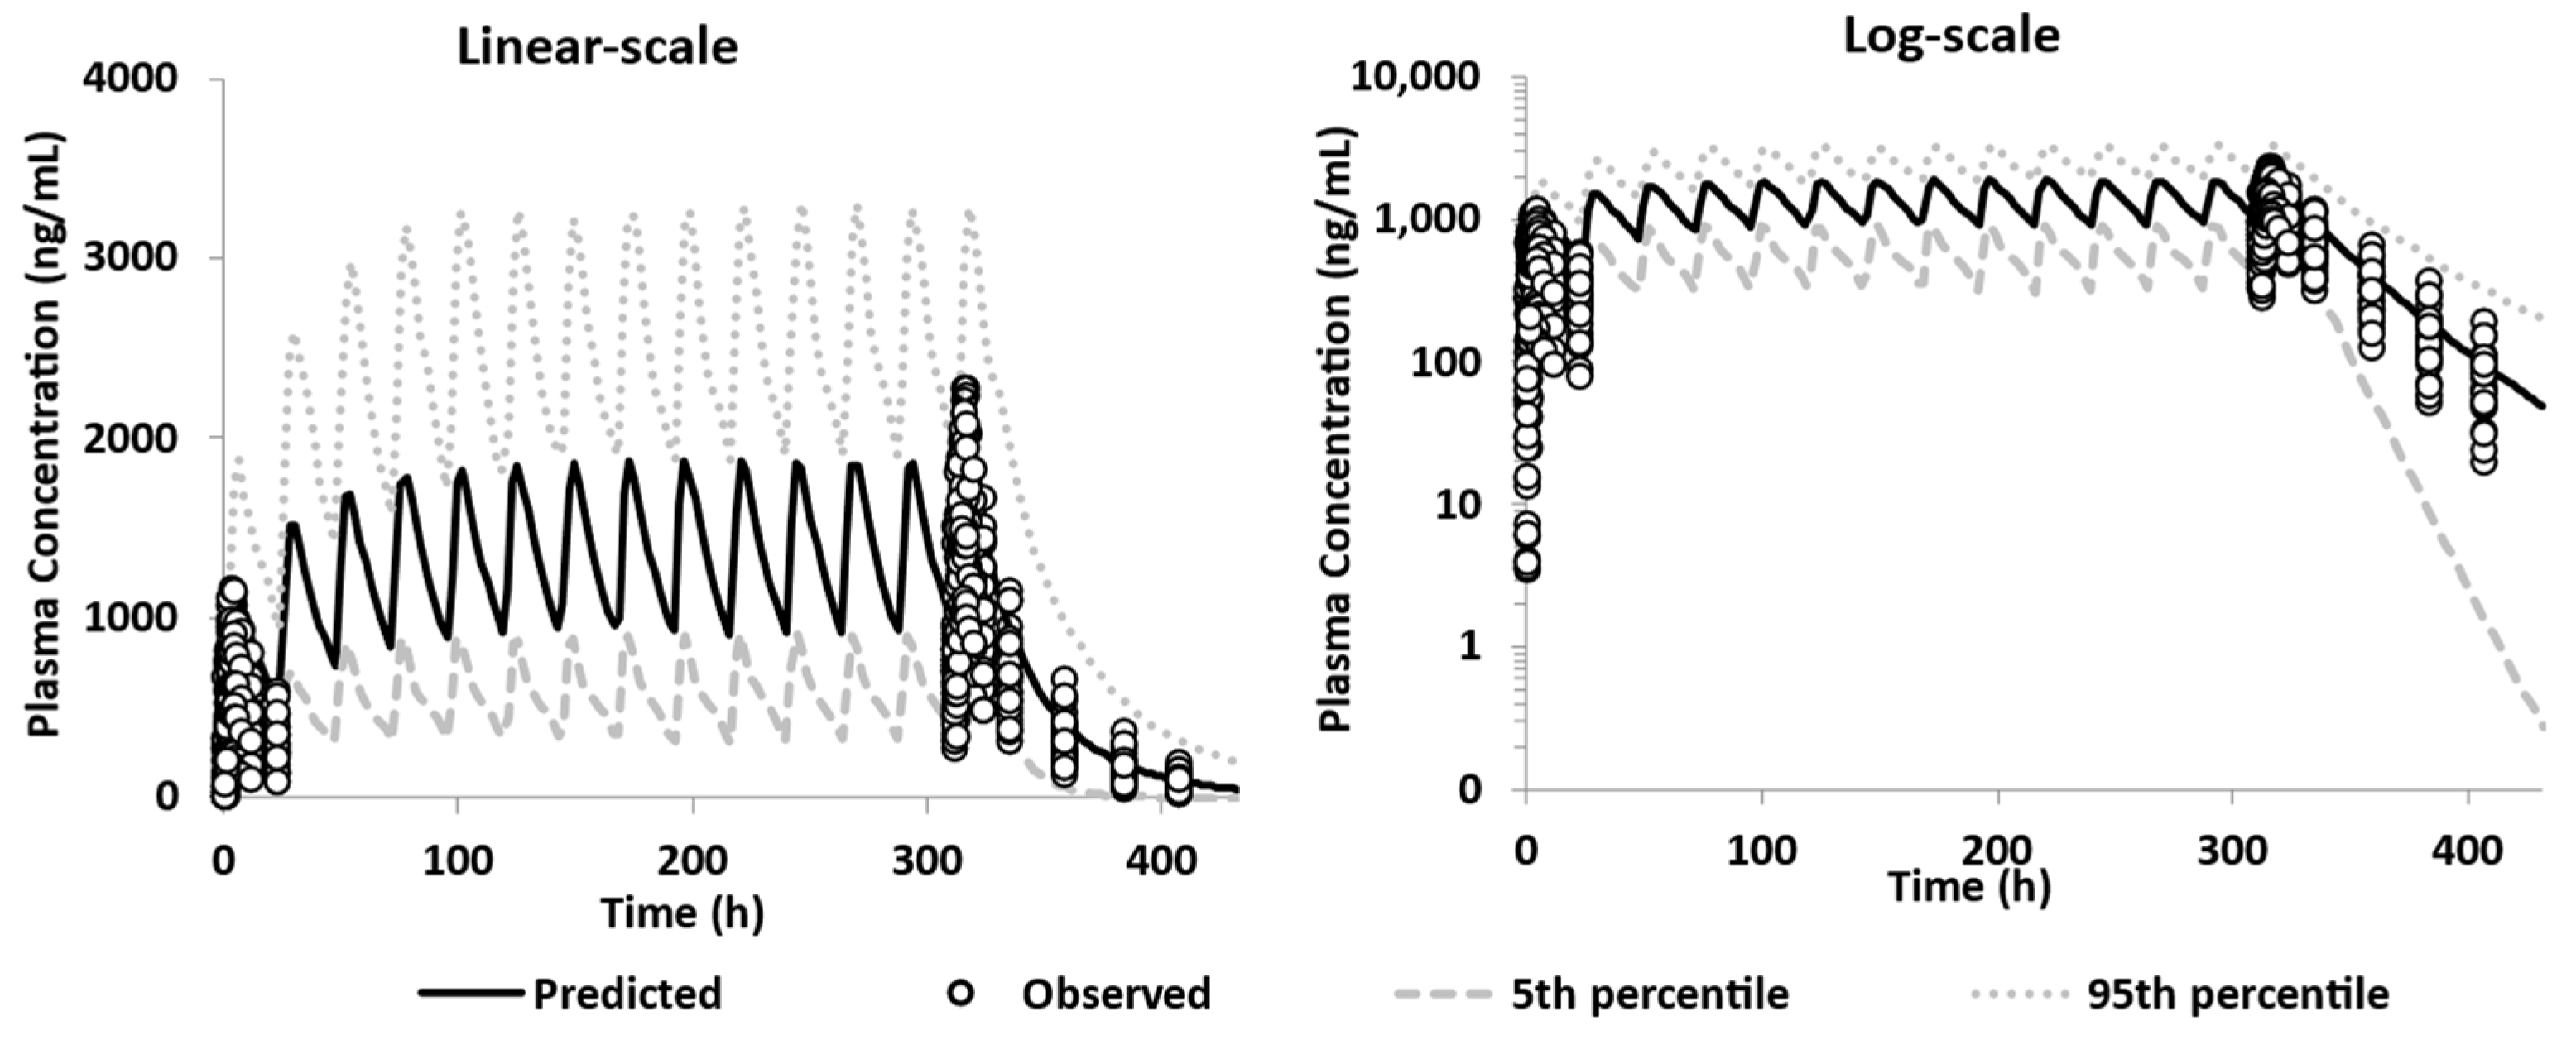
- PBBM model qualification was performed using a food effect relative bioavailability (rBA) study and FTIH study at selected doses (e.g., 200 mg, similar to the dose given in the ADME study).
- (5)
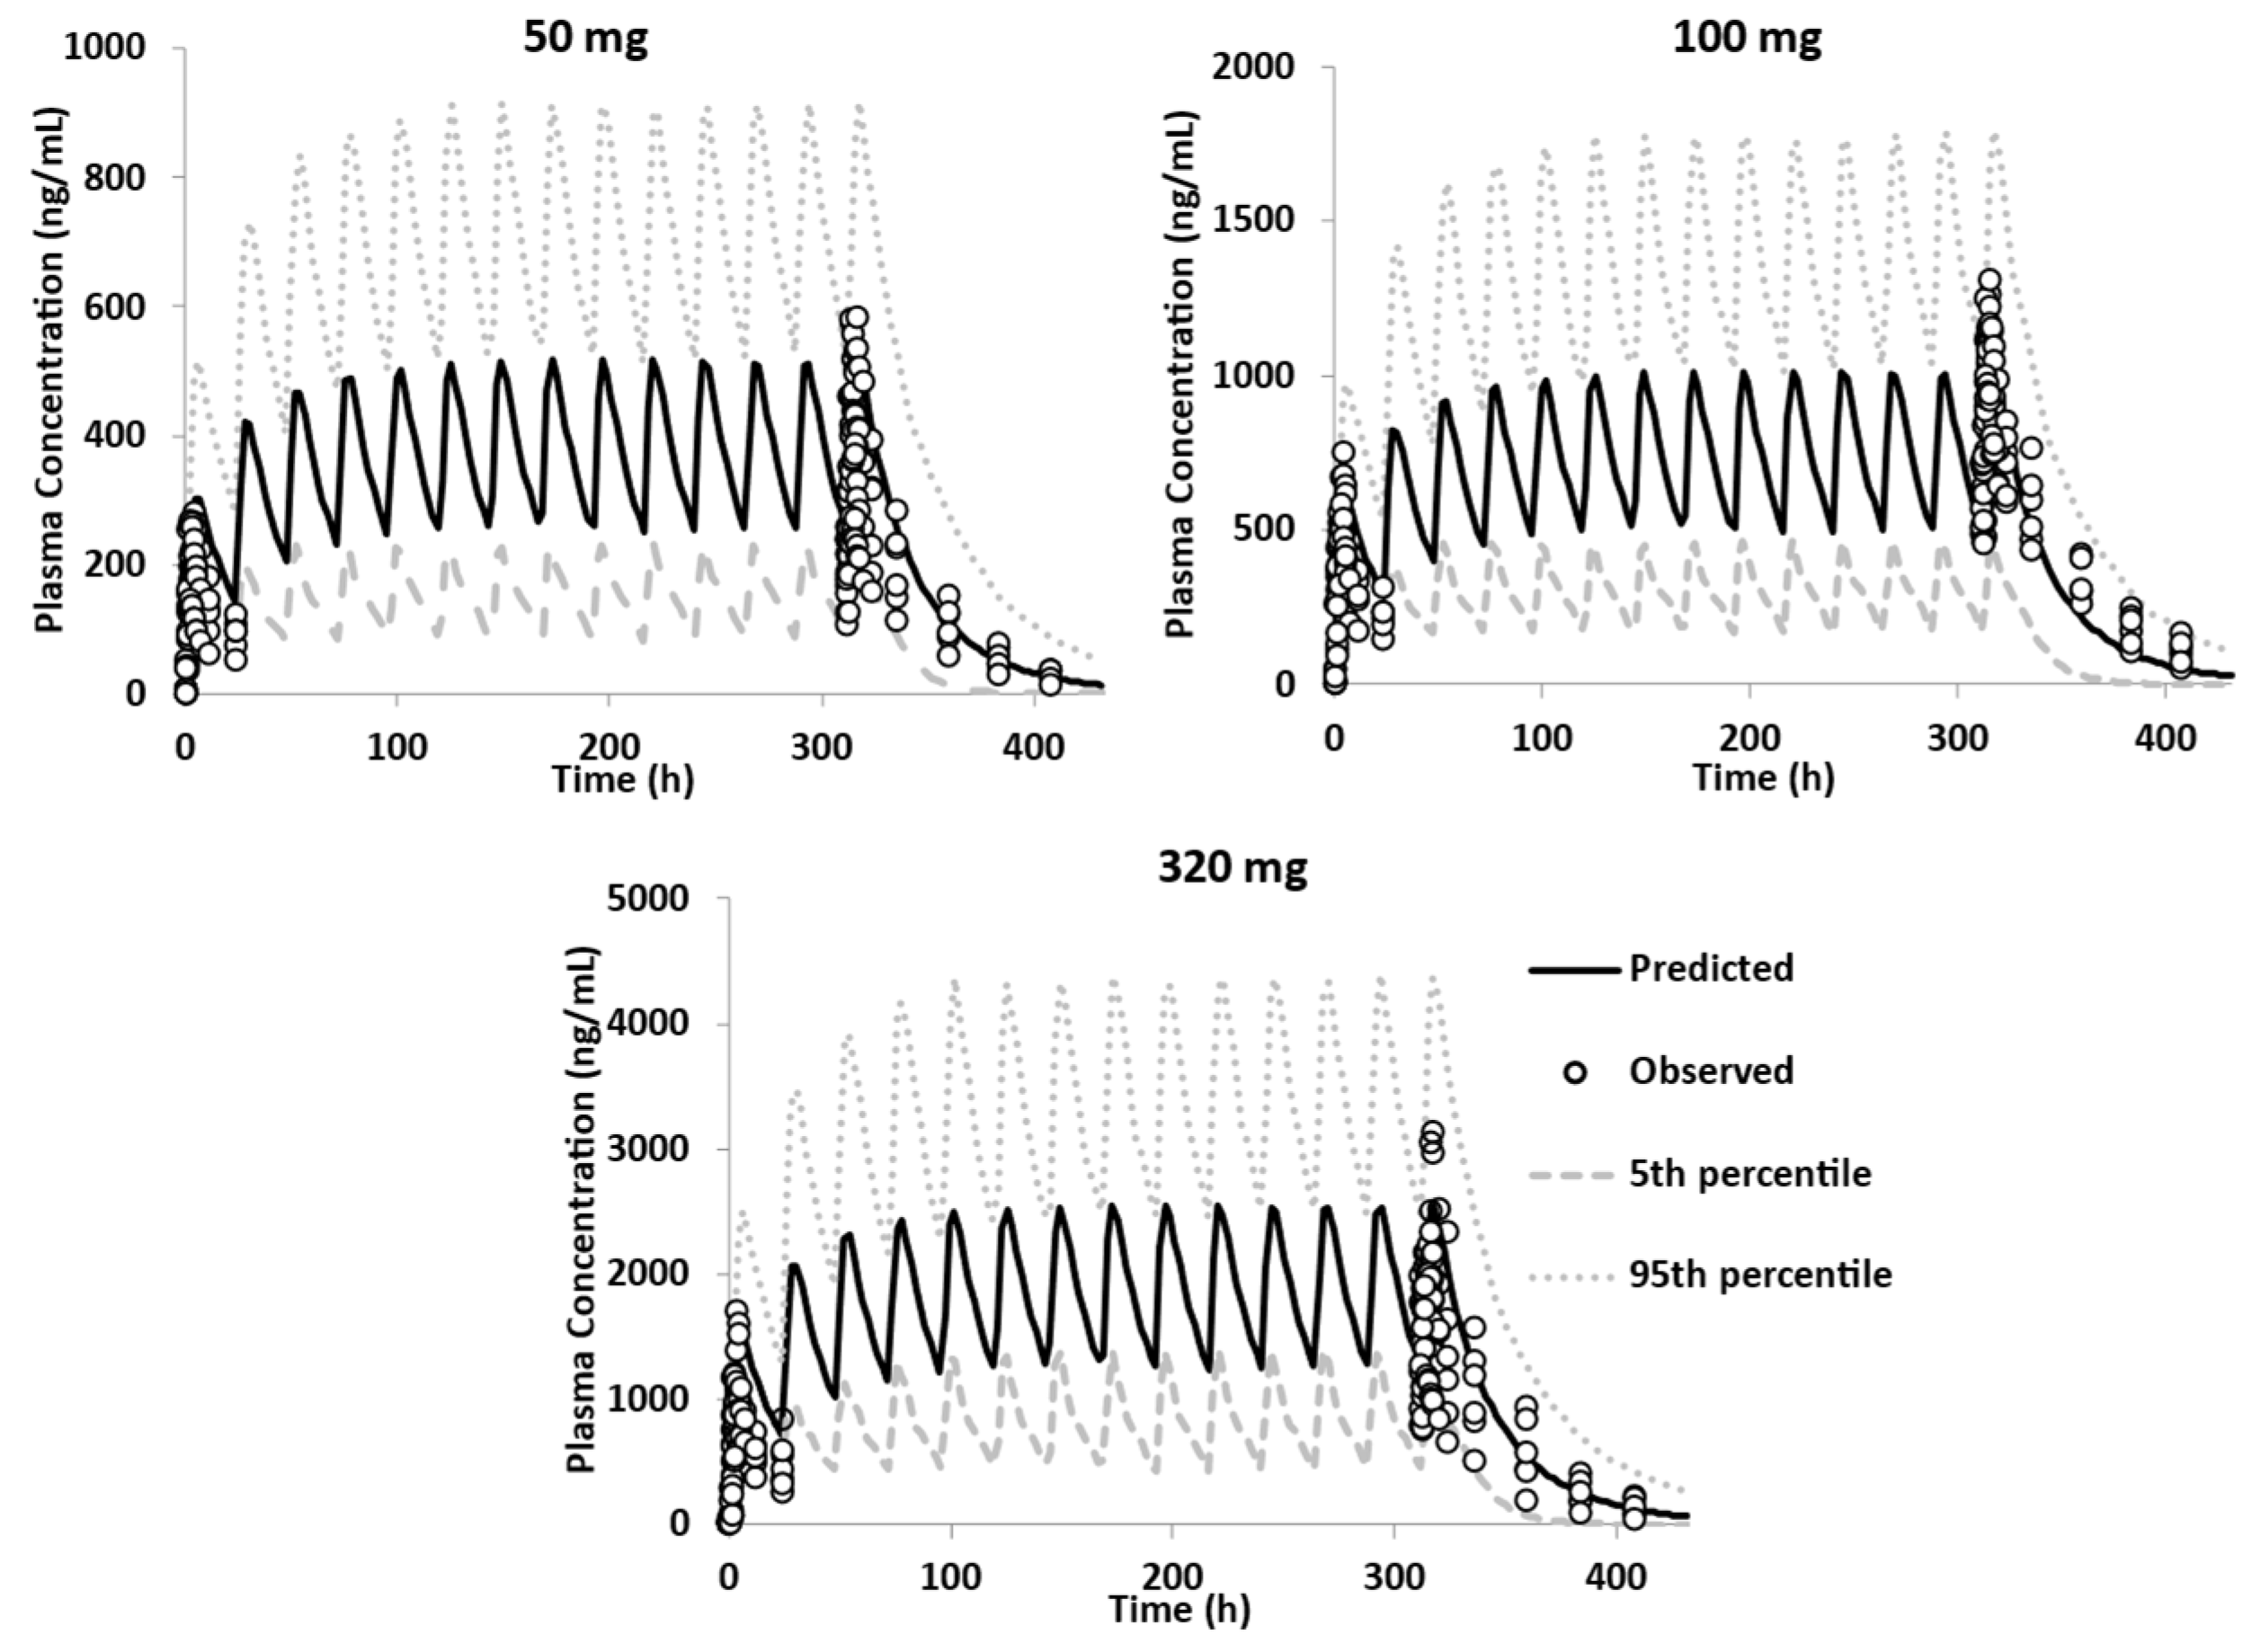
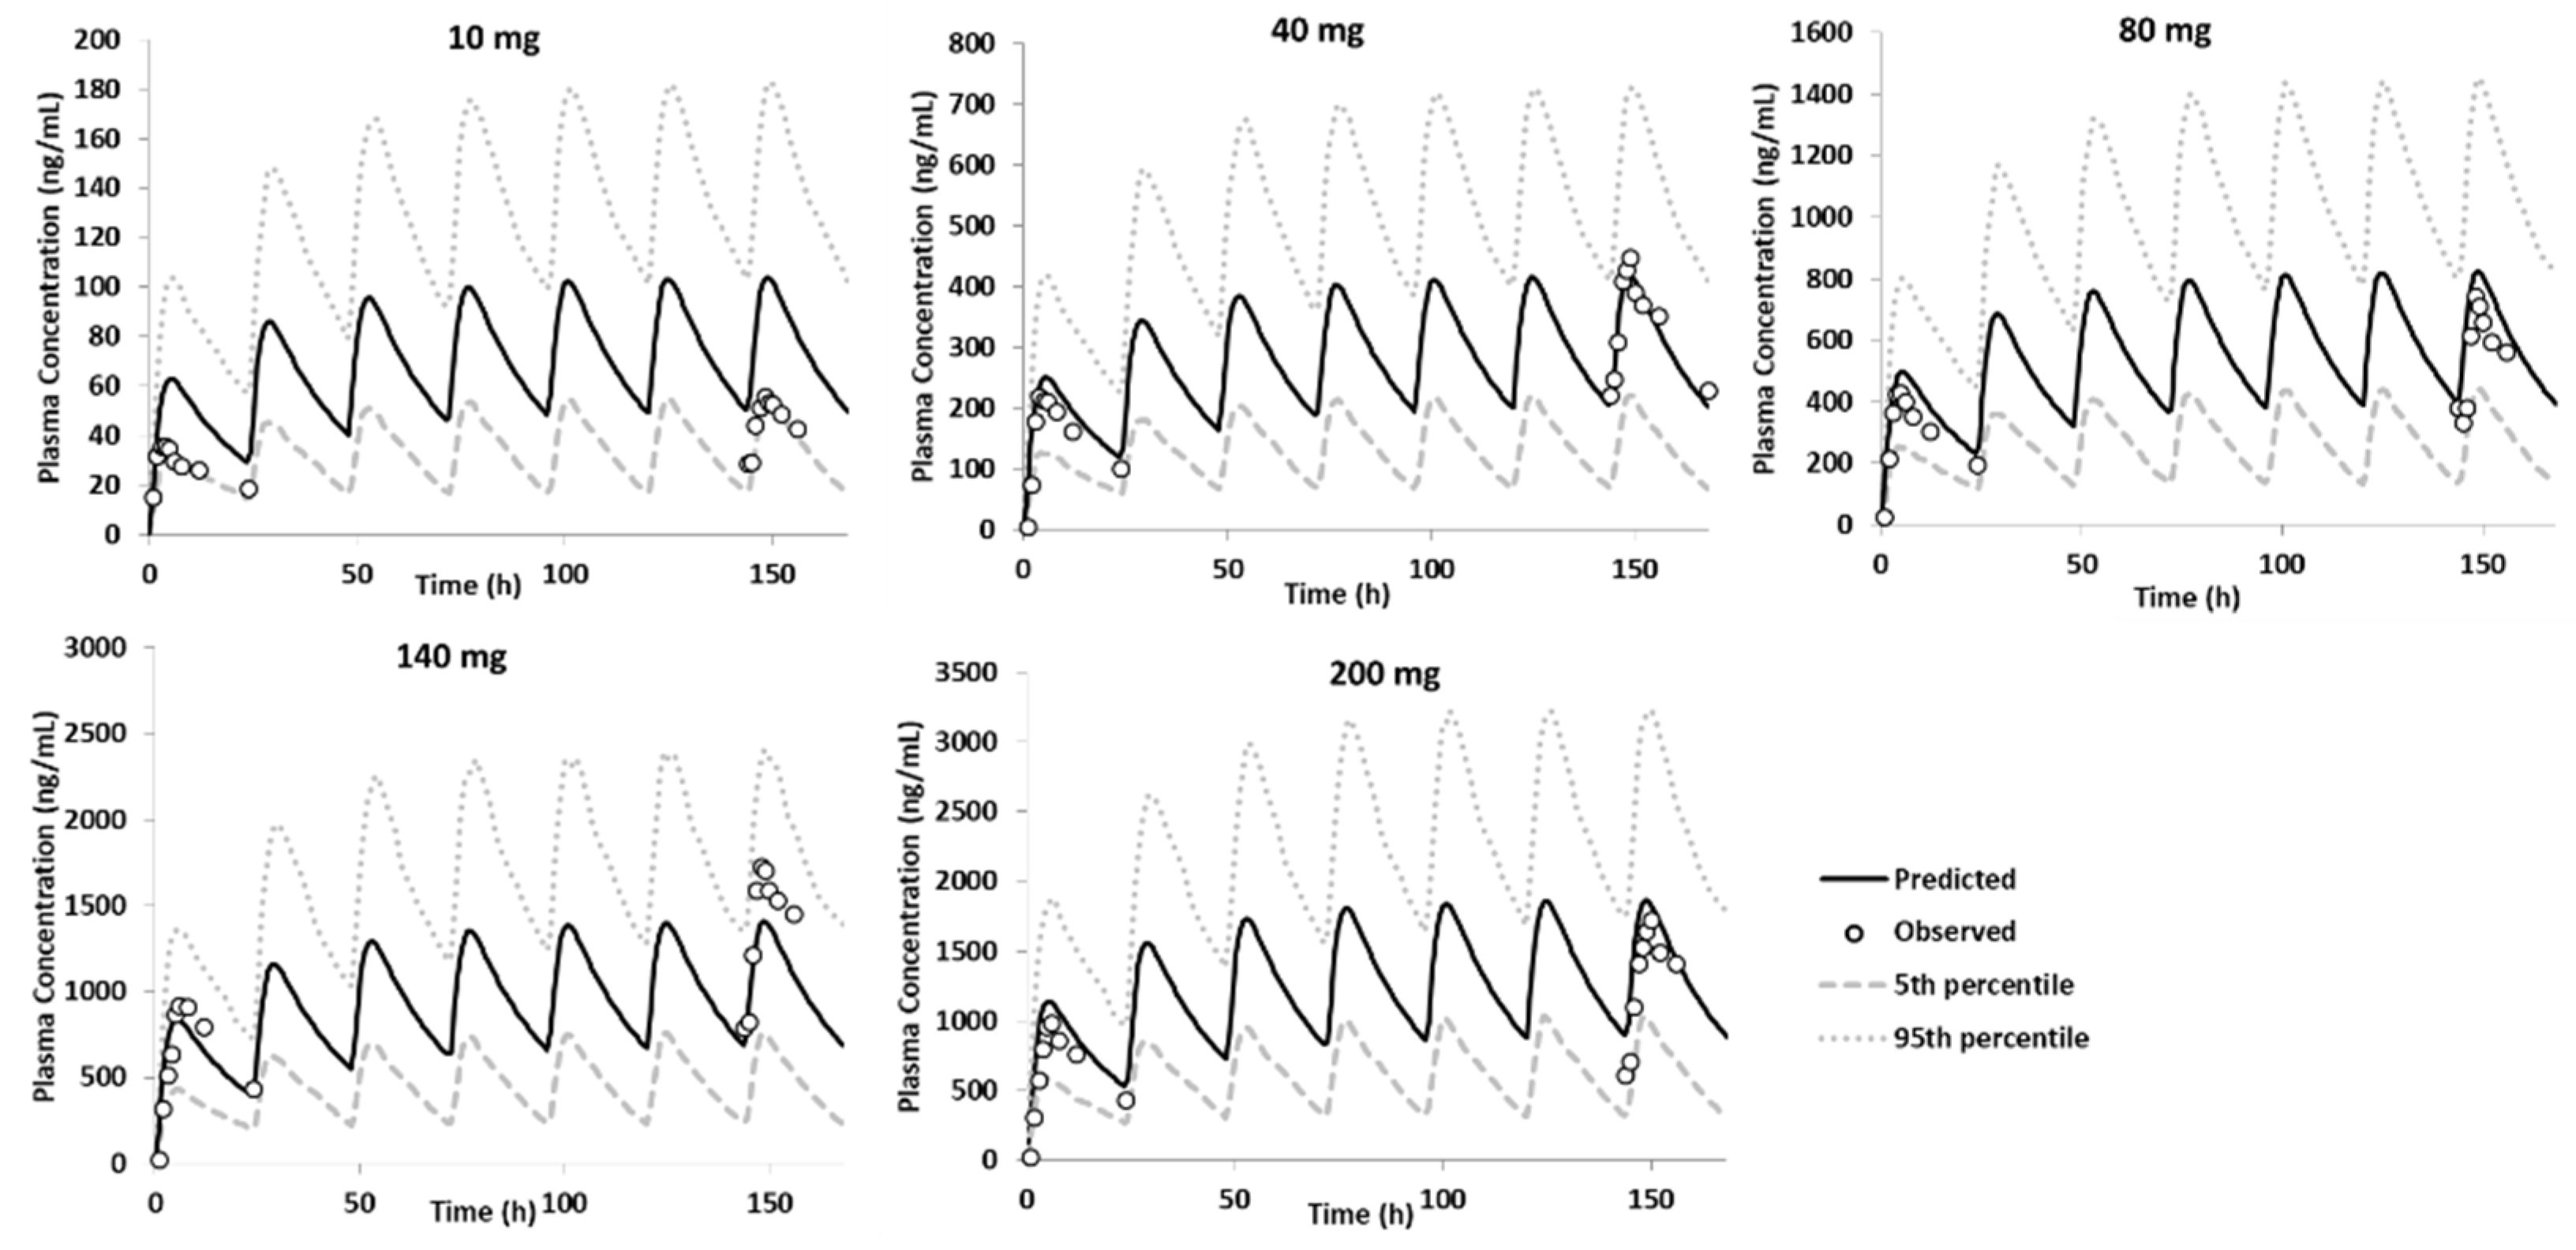
- PBBM model verification was performed using food effect rBA studies as well as FTIH and phase IIa proof-of-concept study at different multiple doses.

2.5.2. Distribution and Elimination
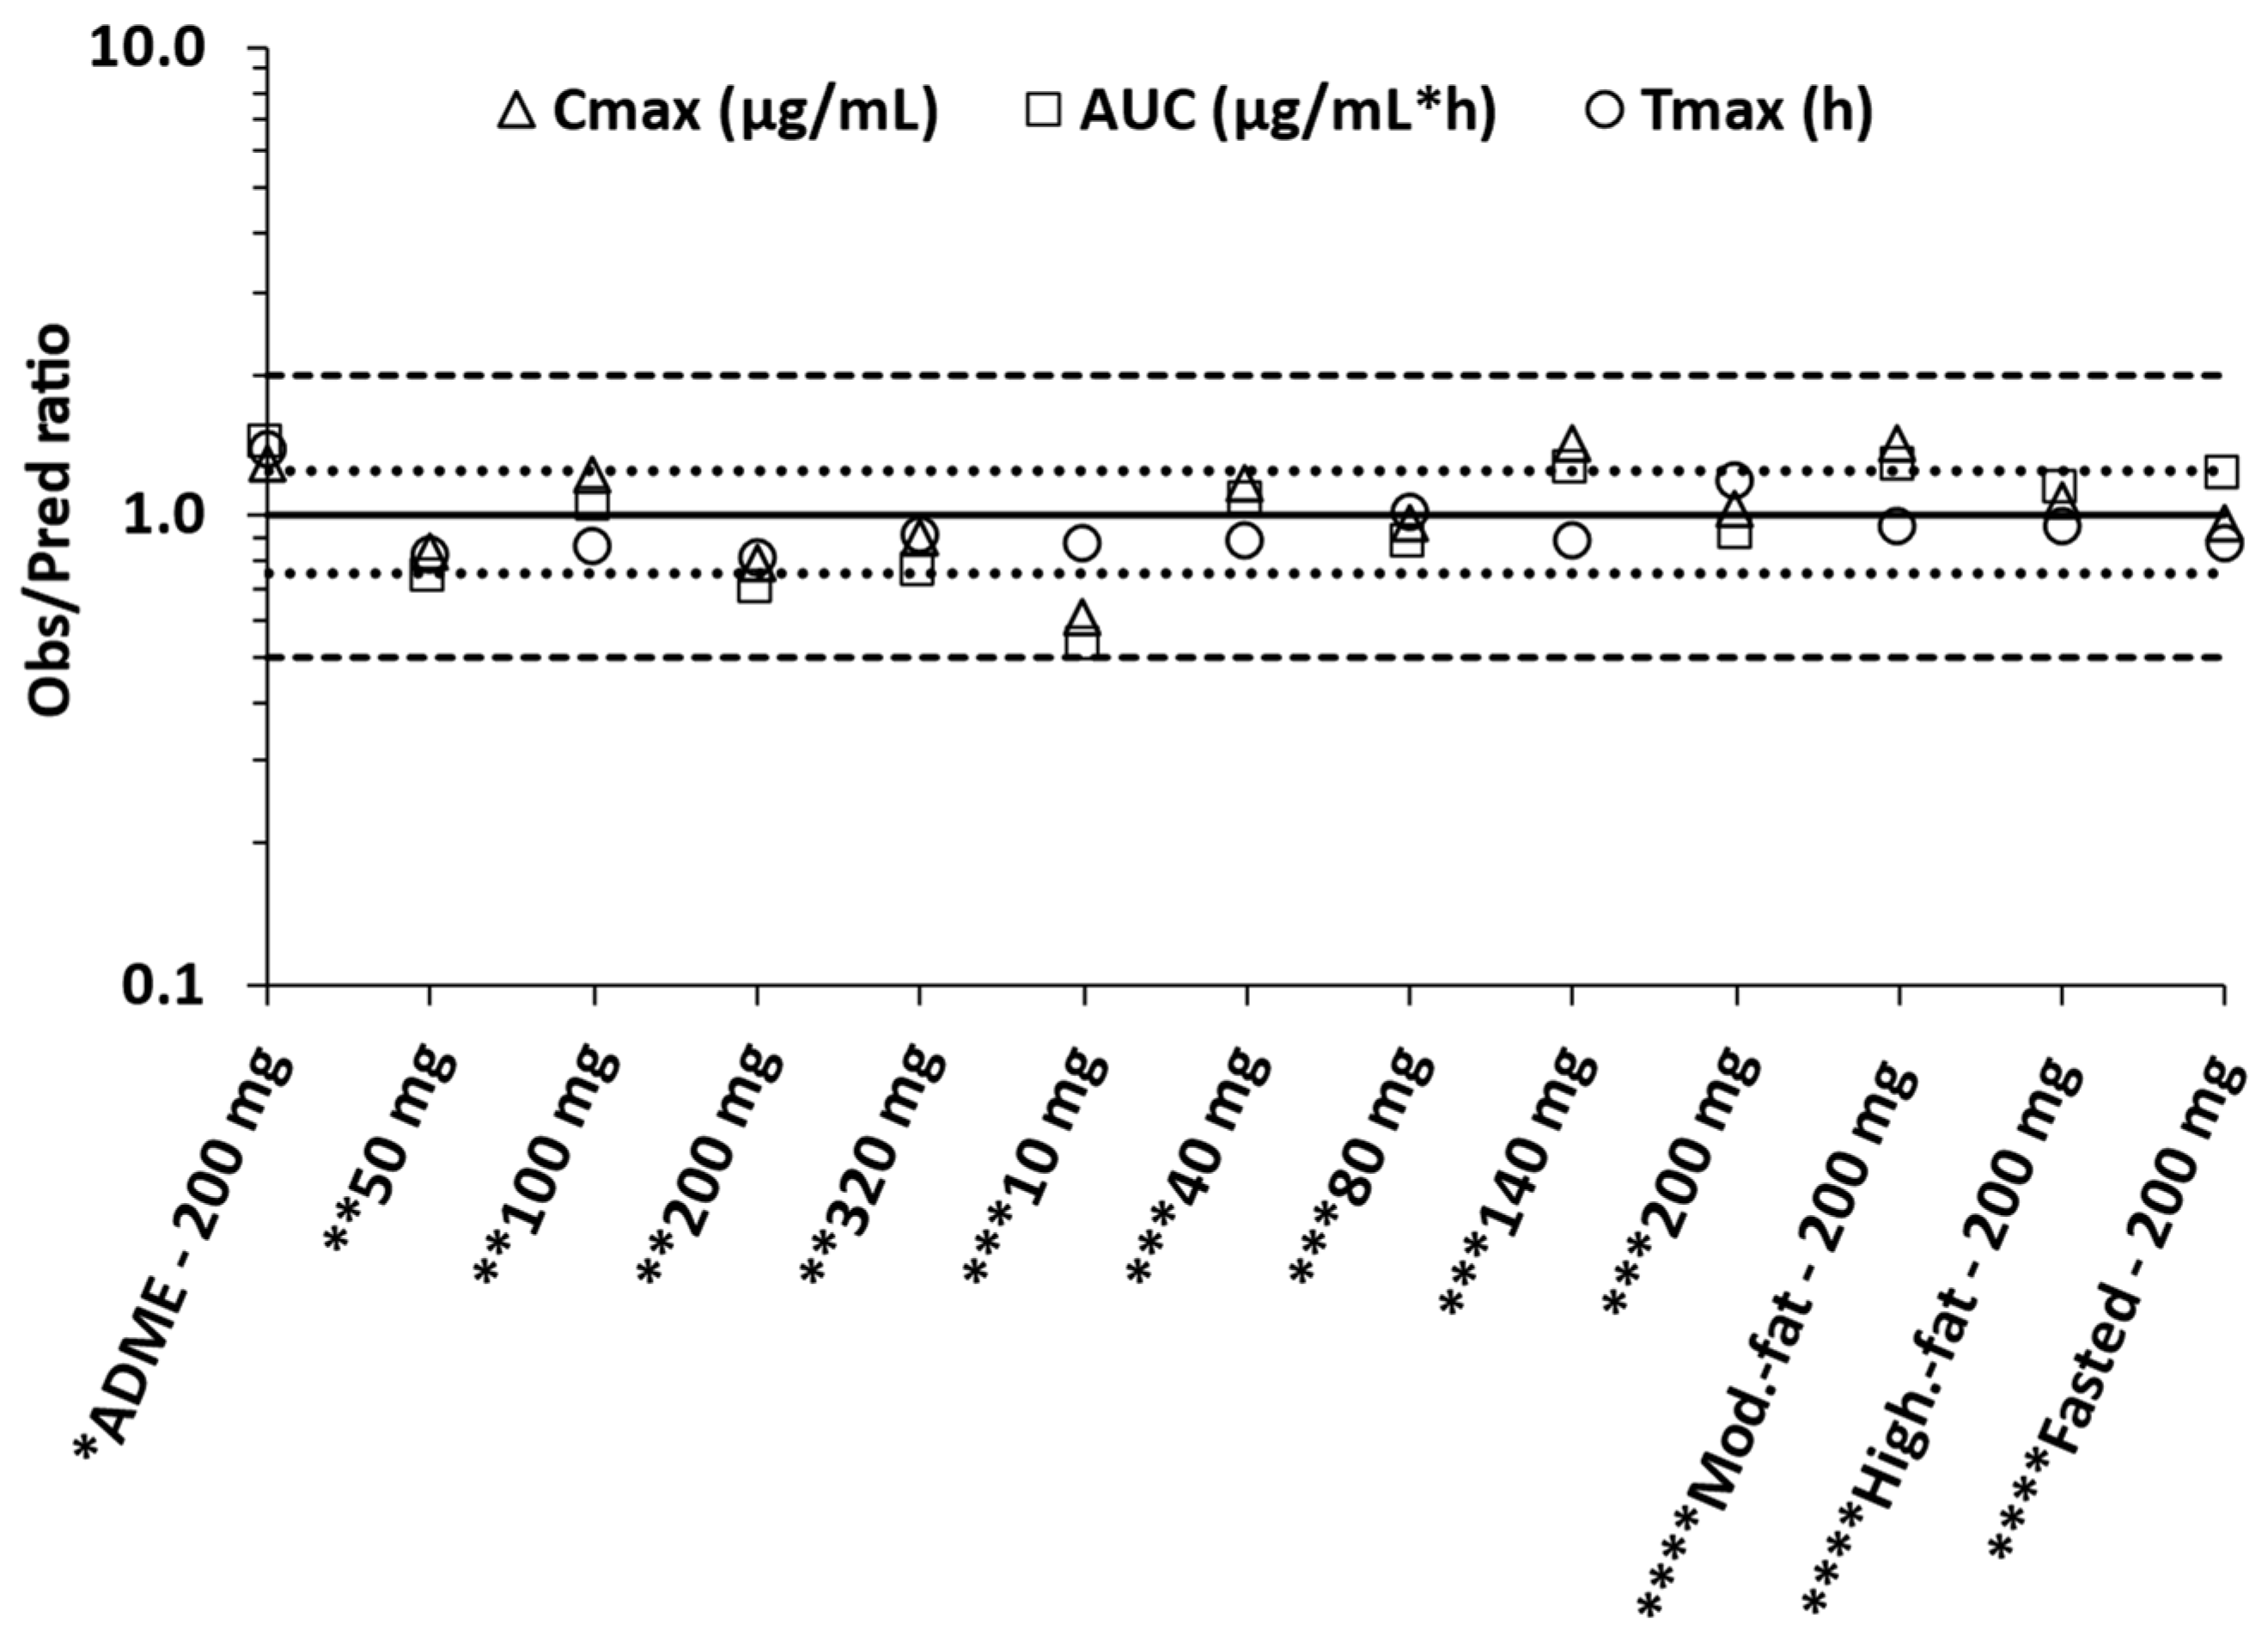
2.6. Prediction Accuracy and Statistical Analysis
3. Results
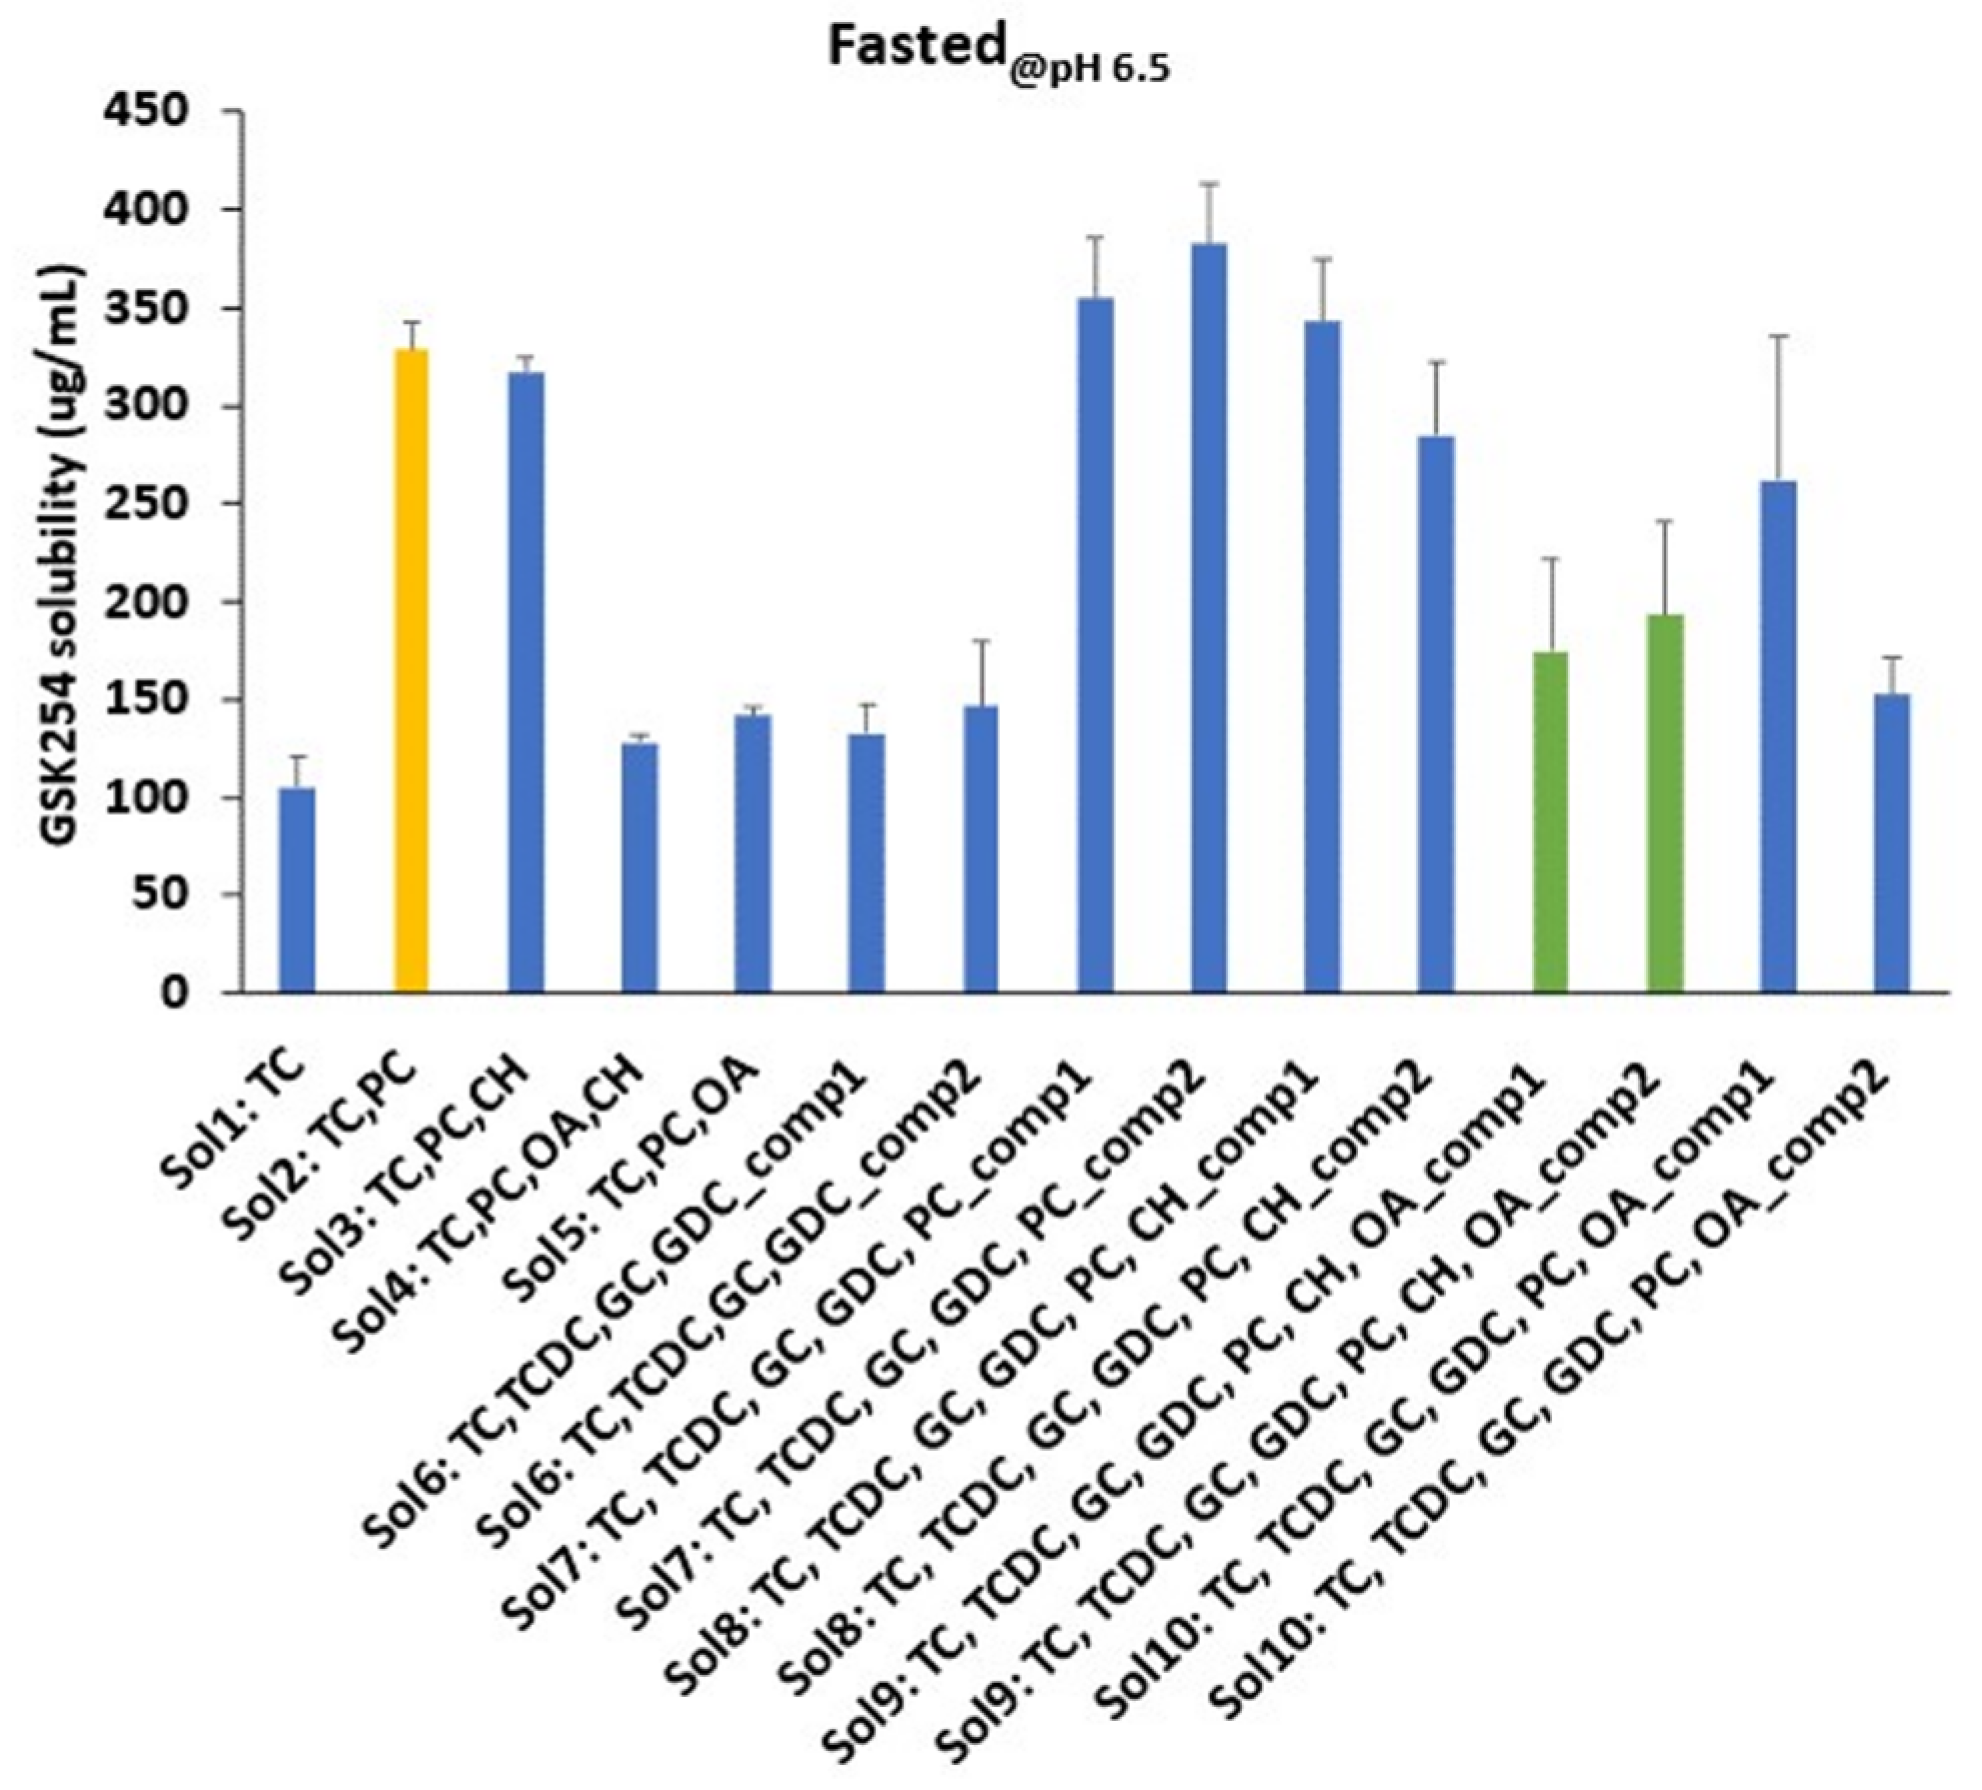
3.1. Impact of Biorelevant Media Composition and pH on the Equilibrium Solubility of GSK254
3.1.1. Fasted
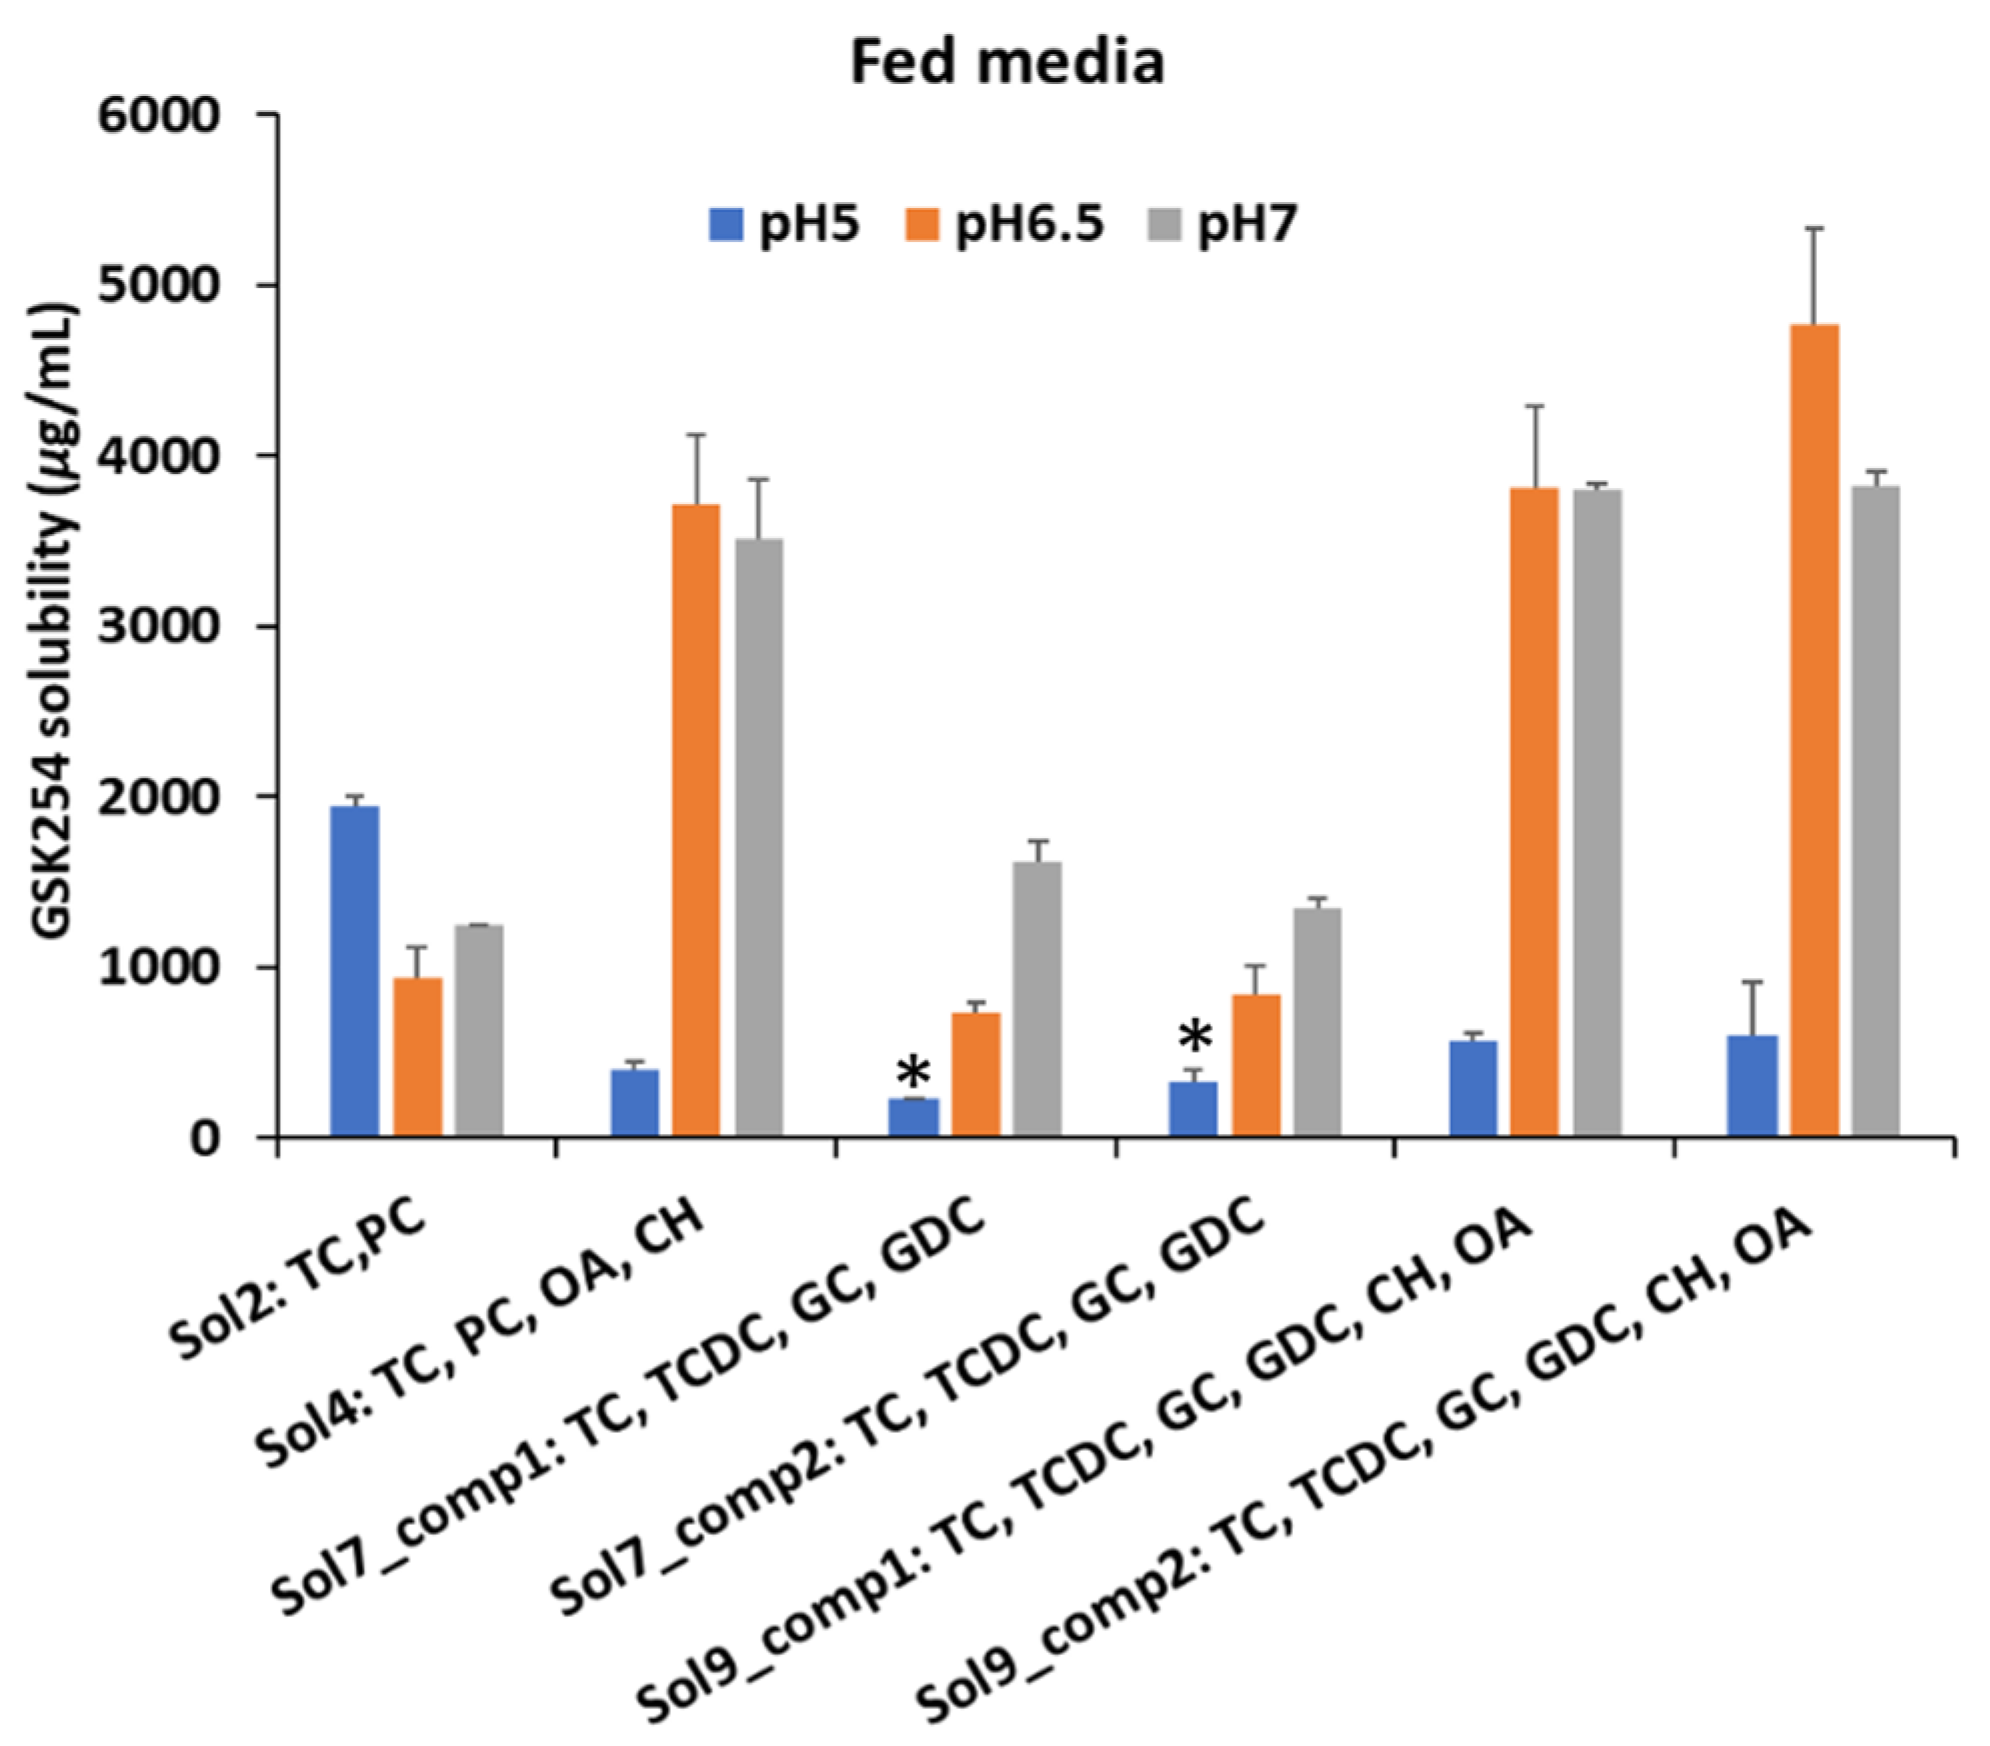
3.1.2. Fed
3.2. Effect of Biorelevant Media on Passive Permeation of GSK254 in MDCK Cells
- The pH affects GSK254 exact permeability (Pexact) with the highest Pexact being observed at 7.4 (neutral state of the drug) in both media (i.e., FaSSIF and FeSSIF)
- The permeability of GSK254 was enhanced by the present of bile salts (see Pexact with DMEM solution, compared with biorelevant media)
- The permeability of GSK254 is bile salt concentration-dependent. This can be seen with the values of Pexact in FaSSIF and FeSSIF @pH 7.4 where Pexact is ~2.3 times higher in FeSSIFv2
- Ionized species of GSK254 do not contribute significantly to permeation. This is observed by comparing the Pexact values in FeSSIF@pH7.4 and FeSSIF@pH5.8. In particular, Pexact was three times lower in FeSSIF@pH5.8.
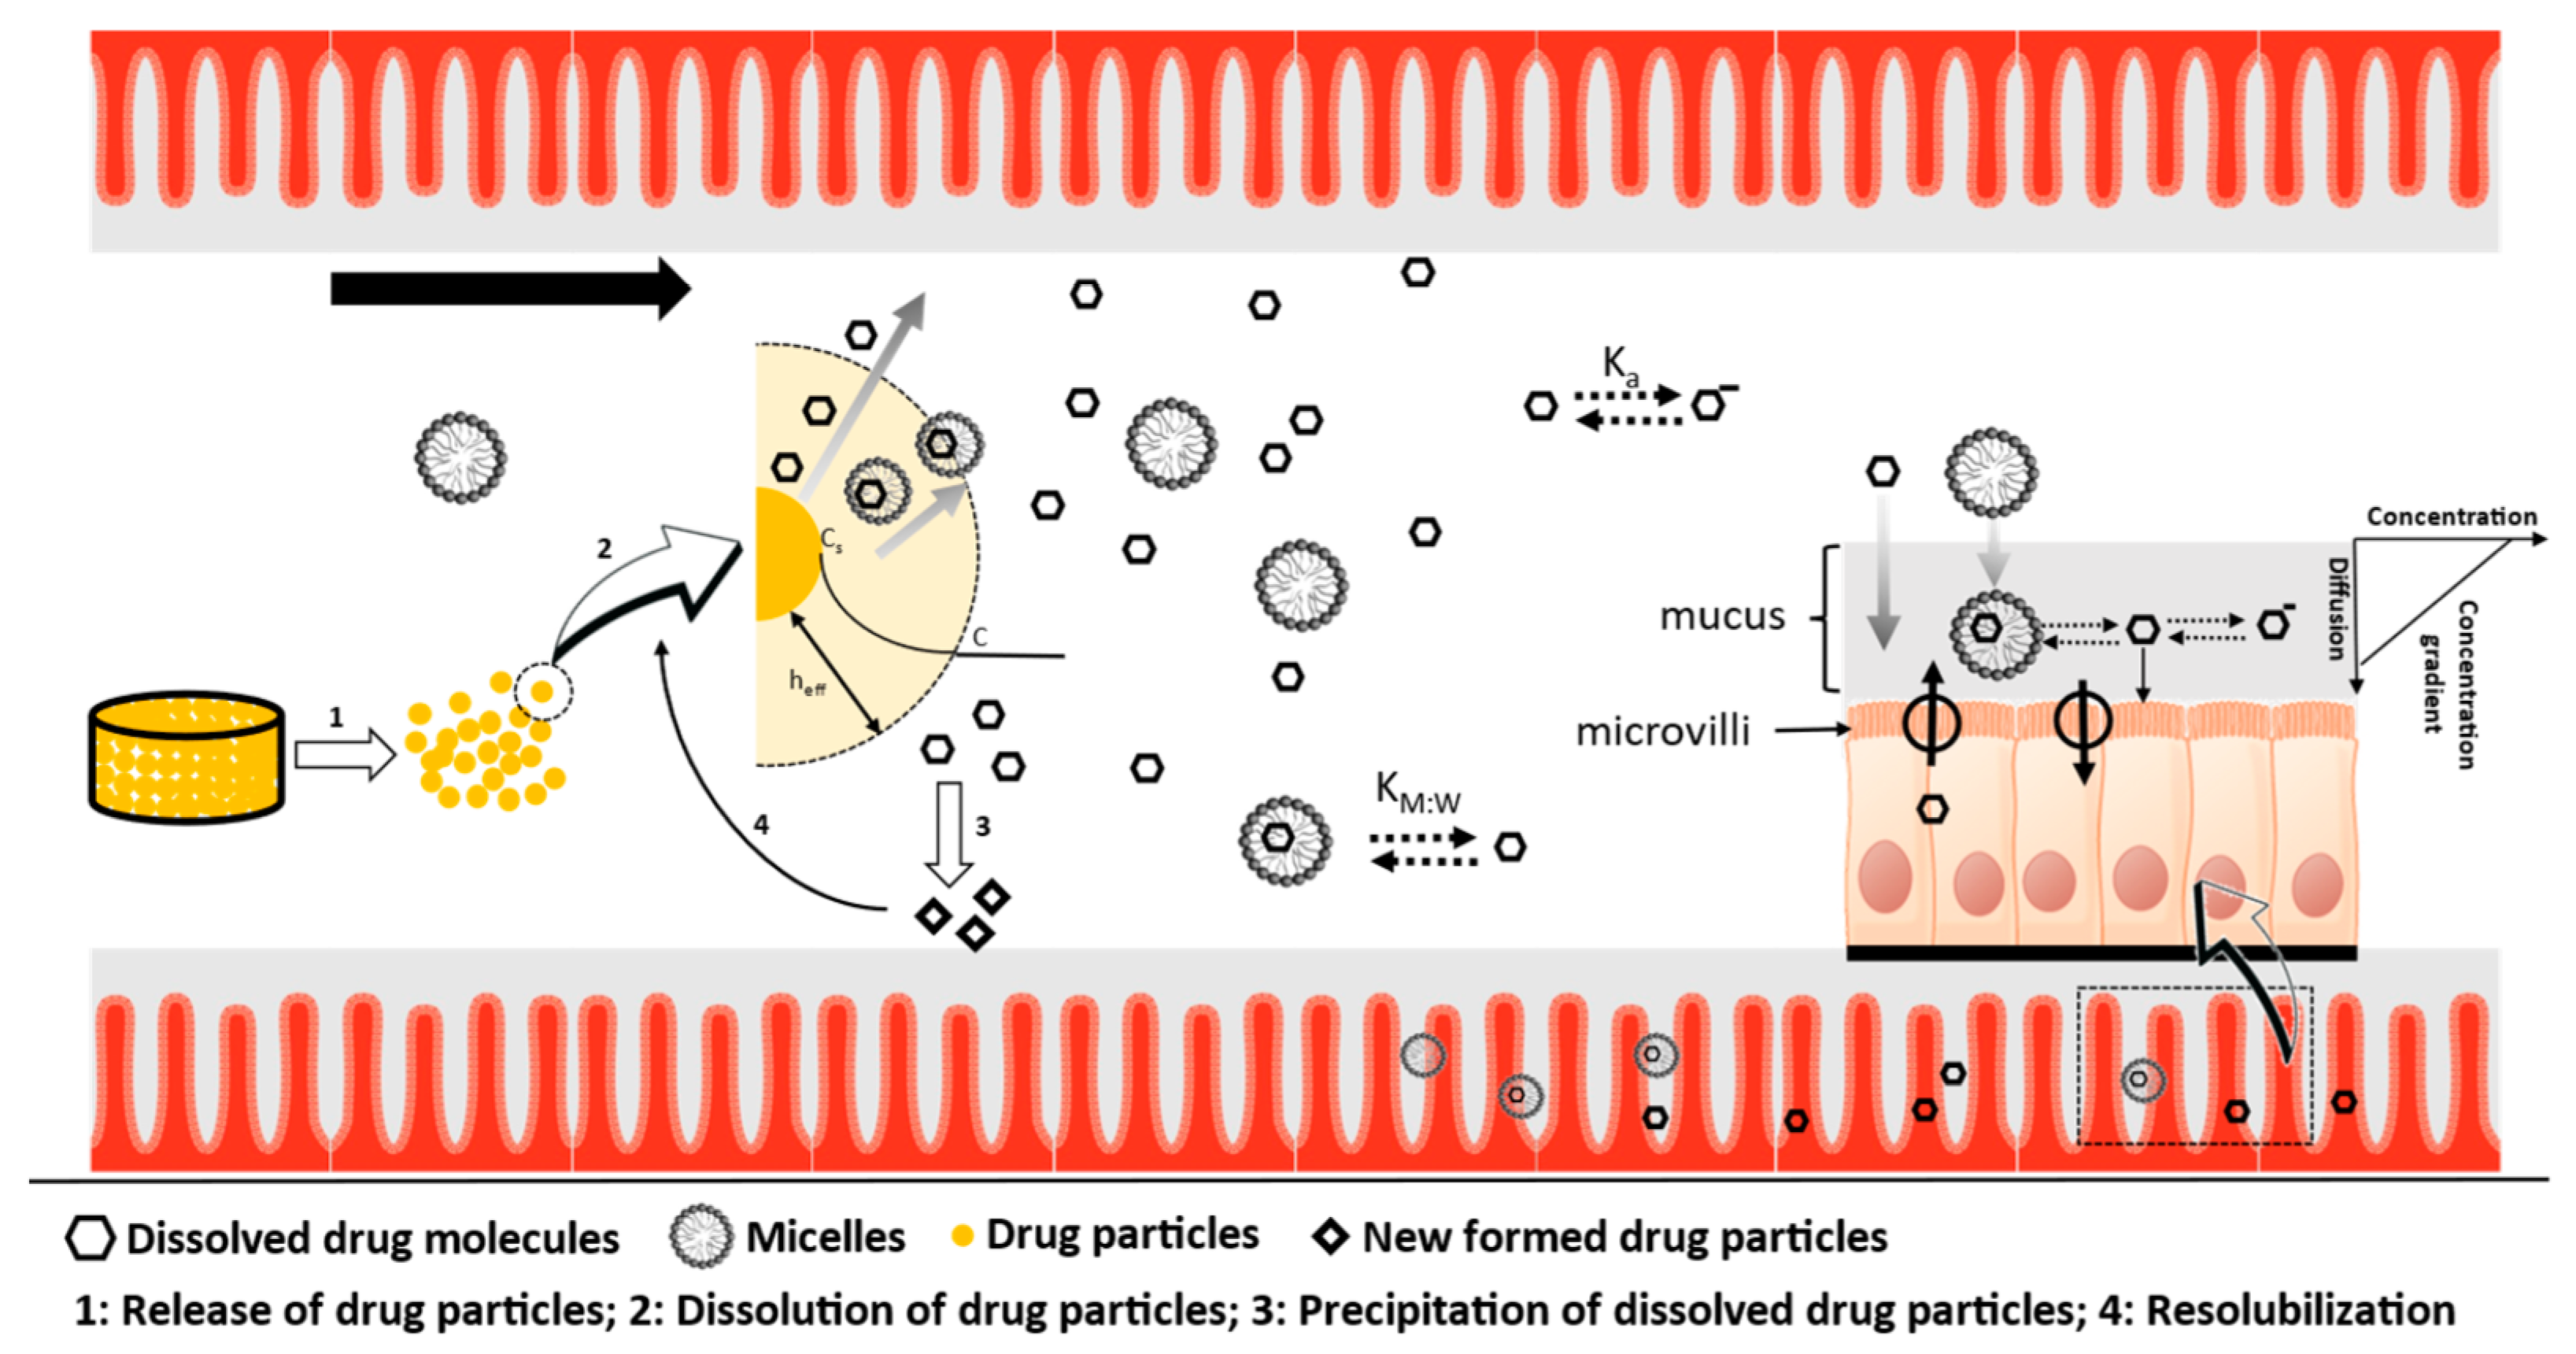
- Since there is no undissolved drug in the donor compartment, the enhanced permeability of GSK254 observed at elevated bile salt concentrations (i.e., in FeSSIF media) alongside the high affinity of the drug to micelles (see solubility measurements) suggests that the drug can potentially permeate whilst bound to micelles or the presence of mixed micelles alters the fluidity of the cell membrane, allowing this high molecular weight drug to permeate more effectively. This is a very crucial finding for the in vivo behaviour of GSK254, as the current assumption is that only the free monomers can be absorbed. Thus, in the fed state, the positive food effect might be caused by the bile salt mediated enhancement solubility and permeability. This last observation from the permeability data will be used to support the assumptions used in PBPK modelling (see Section 3.3).
3.3. PBBM Modelling
3.3.1. Model Development
Distribution and Elimination
Dissolution and Permeability
3.3.2. Model Qualification
3.3.3. Model Verification
4. Discussion
5. Conclusions
Supplementary Materials
Author Contributions
Funding
Institutional Review Board Statement
Informed Consent Statement
Data Availability Statement
Acknowledgments
Conflicts of Interest
References
- Joshi, S.R.; Disala, F.; Igwe, S.; McKenzie, L.; Krishnatry, A.S.; Halliday, F.; Zhan, J.; Greene, T.J.; Xu, J.; Ferron-Brady, G.; et al. Phase I Evaluation of the Safety, Tolerability, and Pharmacokinetics of Gsk3640254, a Next-Generation Hiv-1 Maturation Inhibitor. Pharmacol. Res. Perspect. 2020, 8, e00671. [Google Scholar] [CrossRef] [PubMed]
- Spinner, C.D.; Felizarta, F.; Rizzardini, G.; Philibert, P.; Mitha, E.; Domingo, P.; Stephan, C.J.; DeGrosky, M.; Bainbridge, V.; Zhan, J.; et al. Phase Iia Proof-of-Concept Evaluation of the Antiviral Efficacy, Safety, Tolerability, and Pharmacokinetics of the Next-Generation Maturation Inhibitor Gsk3640254. Clin. Infect. Dis. 2022, 75, 786–794. [Google Scholar] [CrossRef]
- Cheng, L.; Wong, H. Food Effects on Oral Drug Absorption: Application of Physiologically-Based Pharmacokinetic Modeling as a Predictive Tool. Pharmaceutics 2020, 12, 672. [Google Scholar] [CrossRef] [PubMed]
- Takács-Novák, K.; Szőke, V.; Völgyi, G.; Horváth, P.; Ambrus, R.; Szabó-Révész, P. Biorelevant Solubility of Poorly Soluble Drugs: Rivaroxaban, Furosemide, Papaverine and Niflumic Acid. J. Pharm. Biomed. Anal. 2013, 83, 279–285. [Google Scholar] [CrossRef] [PubMed]
- Kang, W.; Kim, K.; Kim, E.-Y.; Kwon, K.-I.; Bang, J.S.; Yoon, Y.-R. Effect of Food on Systemic Exposure to Niflumic Acid Following Postprandial Administration of Talniflumate. Eur. J. Clin. Pharmacol. 2008, 64, 1027–1030. [Google Scholar] [CrossRef]
- De la Cruz Moreno, M.P.; Oth, M.; Deferme, S.; Lammert, F.; Tack, J.; Dressman, J.; Augustijns, P. Characterization of Fasted-State Human Intestinal Fluids Collected from Duodenum and Jejunum. J. Pharm. Pharmacol. 2006, 58, 1079–1089. [Google Scholar] [CrossRef] [PubMed]
- Riethorst, D.; Mols, R.; Duchateau, G.; Tack, J.; Brouwers, J.; Augustijns, P. Characterization of Human Duodenal Fluids in Fasted and Fed State Conditions. J. Pharm. Sci. 2016, 105, 673–681. [Google Scholar] [CrossRef]
- McNeil, N.I.; Ling, K.L.; Wager, J. Mucosal Surface Ph of the Large Intestine of the Rat and of Normal and Inflamed Large Intestine in Man. Gut 1987, 28, 707–713. [Google Scholar] [CrossRef]
- Markopoulos, C.; Thoenen, F.; Preisig, D.; Symillides, M.; Vertzoni, M.; Parrott, N.; Reppas, C.; Imanidis, G. Biorelevant Media for Transport Experiments in the Caco-2 Model to Evaluate Drug Absorption in the Fasted and the Fed State and Their Usefulness. Eur. J. Pharm. Biopharm. 2014, 86, 438–448. [Google Scholar] [CrossRef]
- Riedmaier, A.E.; DeMent, K.; Huckle, J.; Bransford, P.; Stillhart, C.; Lloyd, R.; Alluri, R.; Basu, S.; Chen, Y.; Dhamankar, V.; et al. Use of Physiologically Based Pharmacokinetic (Pbpk) Modeling for Predicting Drug-Food Interactions: An Industry Perspective. AAPS J. 2020, 22, 123. [Google Scholar] [CrossRef]
- Johnson, M.; Pene Dumitrescu, T.; Joshi, S.R.; Mathew, A.; Bainbridge, V.; Zhan, J.; Lataillade, M. Relative Bioavailability and Food Effect of Gsk3640254 Tablet and Capsule Formulations in Healthy Participants. Clin. Pharmacol. Drug Dev. 2022, 11, 632–639. [Google Scholar] [CrossRef]
- Wen, B.; Zhang, Y.; Young, G.C.; Kenworthy, D.; Pereira, A.; Pirhalla, J.; Doyle, J.; Jordon, B.; Zhan, J.; Johnson, M. Investigation of Clinical Absorption, Distribution, Metabolism, and Excretion and Pharmacokinetics of the Hiv-1 Maturation Inhibitor Gsk3640254 Using an Intravenous Microtracer Combined with Enterotracker for Biliary Sampling. Drug Metab. Dispos. 2022, 50, 1442–1453. [Google Scholar] [CrossRef]
- Stamatopoulos, K.; Pathak, S.M.; Marciani, L.; Turner, D.B. Population-Based Pbpk Model for the Prediction of Time-Variant Bile Salt Disposition within Gi Luminal Fluids. Mol. Pharm. 2020, 17, 1310–1323. [Google Scholar] [CrossRef]
- Sugano, K. Theoretical Investigation of Passive Intestinal Membrane Permeability Using Monte Carlo Method to Generate Drug-Like Molecule Population. Int. J. Pharm. 2009, 373, 55–61. [Google Scholar] [CrossRef] [PubMed]
- Pade, D.; Jamei, M.; Rostami-Hodjegan, A.; Turner, D.B. Application of the Mechpeff Model to Predict Passive Effective Intestinal Permeability in the Different Regions of the Rodent Small Intestine and Colon. Biopharm. Drug Dispos. 2017, 38, 94–114. [Google Scholar] [CrossRef]
- Shimizu, H.; Yoshida, K.; Nakada, T.; Kojima, K.; Ogasawara, A.; Nakamaru, Y.; Yamazaki, H. Prediction of Human Distribution Volumes of Compounds in Various Elimination Phases Using Physiologically Based Pharmacokinetic Modeling and Experimental Pharmacokinetics in Animals. Drug Metab. Dispos. 2019, 47, 114–123. [Google Scholar] [CrossRef] [PubMed]
- Armand, M.; Hamosh, M.; Philpott, J.R.; Resnik, A.K.; Rosenstein, B.J.; Hamosh, A.; Perman, J.A.; Hamosh, P. Gastric Function in Children with Cystic Fibrosis: Effect of Diet on Gastric Lipase Levels and Fat Digestion. Pediatr. Res. 2004, 55, 457–465. [Google Scholar] [CrossRef]
- Stamatopoulos, K. Integrating Biopharmaceutics to Predict Oral Absorption Using Pbpk Modelling. In Biopharmaceutics; Wiley: Hoboken, NJ, USA, 2022; pp. 189–203. [Google Scholar]
- Reppas, C.; Karatza, E.; Goumas, C.; Markopoulos, C.; Vertzoni, M. Characterization of Contents of Distal Ileum and Cecum to Which Drugs/Drug Products Are Exposed During Bioavailability/Bioequivalence Studies in Healthy Adults. Pharm. Res. 2015, 32, 3338–3349. [Google Scholar] [CrossRef]
- Barmpatsalou, V.; Dubbelboer, I.R.; Rodler, A.; Jacobson, M.; Karlsson, E.; Pedersen, B.L.; Bergström, C.A.S. Physiological Properties, Composition and Structural Profiling of Porcine Gastrointestinal Mucus. Eur. J. Pharm. Biopharm. 2021, 169, 156–167. [Google Scholar] [CrossRef] [PubMed]
- Arora, S.; Pansari, A.; Kilford, P.; Jamei, M.; Gardner, I.; Turner, D.B. Biopharmaceutic in Vitro in Vivo Extrapolation (Iviv_E) Informed Physiologically-Based Pharmacokinetic Model of Ritonavir Norvir Tablet Absorption in Humans under Fasted and Fed State Conditions. Mol. Pharm. 2020, 17, 2329–2344. [Google Scholar] [CrossRef] [PubMed]
- Pathak, S.M.; Ruff, A.; Kostewicz, E.S.; Patel, N.; Turner, D.B.; Jamei, M. Model-Based Analysis of Biopharmaceutic Experiments to Improve Mechanistic Oral Absorption Modeling: An Integrated in Vitro in Vivo Extrapolation Perspective Using Ketoconazole as a Model Drug. Mol. Pharm. 2017, 14, 4305–4320. [Google Scholar] [CrossRef] [PubMed]
- O’Dwyer, P.J.; Imanidis, G.; Box, K.J.; Reppas, C. On the Usefulness of Two Small-Scale in Vitro Setups in the Evaluation of Luminal Precipitation of Lipophilic Weak Bases in Early Formulation Development. Pharmaceutics 2020, 12, 272. [Google Scholar] [CrossRef]
- Loisios-Konstantinidis, I.; Cristofoletti, R.; Jamei, M.; Turner, D.; Dressman, J. Physiologically Based Pharmacokinetic/Pharmacodynamic Modeling to Predict the Impact of Cyp2c9 Genetic Polymorphisms, Co-Medication and Formulation on the Pharmacokinetics and Pharmacodynamics of Flurbiprofen. Pharmaceutics 2020, 12, 1049. [Google Scholar] [CrossRef] [PubMed]
- Chirumamilla, S.K.; Banala, V.T.; Jamei, M.; Turner, D.B. Mechanistic Pbpk Modelling to Predict the Advantage of the Salt Form of a Drug When Dosed with Acid Reducing Agents. Pharmaceutics 2021, 13, 1169. [Google Scholar] [CrossRef] [PubMed]
- Wagner, C.; Kesisoglou, F.; Pepin, X.J.H.; Parrott, N.; Riedmaier, A.E. Use of Physiologically Based Pharmacokinetic Modeling for Predicting Drug–Food Interactions: Recommendations for Improving Predictive Performance of Low Confidence Food Effect Models. AAPS J. 2021, 23, 85. [Google Scholar] [CrossRef]
- Lin, W.; Chen, Y.; Unadkat, J.D.; Zhang, X.; Wu, D.; Heimbach, T. Applications, Challenges, and Outlook for Pbpk Modeling and Simulation: A Regulatory, Industrial and Academic Perspective. Pharm. Res. 2022, 39, 1701–1731. [Google Scholar] [CrossRef]
- Krag, E.; Phillips, S.F. Active and Passive Bile Acid Absorption in Man. Perfusion Studies of the Ileum and Jejunum. J. Clin. Investig. 1974, 53, 1686–1694. [Google Scholar] [CrossRef]
- McAllister, M.; Flanagan, T.; Cole, S.; Abend, A.; Kotzagiorgis, E.; Limberg, J.; Mead, H.; Mangas-Sanjuan, V.; Dickinson, P.A.; Moir, A.; et al. Developing Clinically Relevant Dissolution Specifications (Crdss) for Oral Drug Products: Virtual Webinar Series. Pharmaceutics 2022, 14, 1010. [Google Scholar] [CrossRef]
- Marciani, L.; Gowland, P.A.; Spiller, R.C.; Manoj, P.; Moore, R.J.; Young, P.; Fillery-Travis, A.J. Effect of Meal Viscosity and Nutrients on Satiety, Intragastric Dilution, and Emptying Assessed by Mri. Am. J. Physiol.-Gastrointest. Liver Physiol. 2001, 280, G1227–G1233. [Google Scholar] [CrossRef]
- Ludden, T.M. Nonlinear Pharmacokinetics. Clin. Pharm. 1991, 20, 429–446. [Google Scholar] [CrossRef] [PubMed]
- Giacomini, K.M.; Huang, S.-M.; Tweedie, D.J.; Benet, L.Z.; Brouwer, K.L.R.; Chu, X.; Dahlin, A.; Evers, R.; Fischer, V.; Hillgren, K.M.; et al. Membrane Transporters in Drug Development. Nat. Rev. Drug Discov. 2010, 9, 215–236. [Google Scholar] [PubMed]


| Time (min) | Mobile Phase A (%) | Mobile Phase B (%) | Flow Rate (mL/min) |
|---|---|---|---|
| 0.00 | 75 | 25 | 1.5 |
| 1.00 | 20 | 80 | 1.0 |
| 1.01 | 75 | 25 | 1.0 |
| 2.00 | 75 | 25 | 1.0 |
| Solution | Total BS (mM) | % | PC (mM) | OA (mg/mL) | CH (mg/mL) | ||||
|---|---|---|---|---|---|---|---|---|---|
| Composition | TC | TCDC | GC | GDC | |||||
| 1 | 3 a 15 b | 100 | - | - | - | - | - | - | |
| 2 | 100 | - | - | - | 0.75 a, 3.75 b | - | - | ||
| 3 | 100 | - | - | - | 0.75 a, 3.75 b | - | 0.027 a, 0.72 b | ||
| 4 | 100 | - | - | - | 0.75 a, 3.75 b | 0.53 a, 6.5 b | 0.027 a, 0.72 b | ||
| 5 | 100 | - | - | - | 0.75 a, 3.75 b | 0.53 a, 6.5 b | - | ||
| 6 | 1 | 14.9 | 15.1 | 45.1 | 24.9 | - | - | - | |
| 2 | 47.1 | 8.8 | 24.6 | 19.5 | - | - | - | ||
| 7 | 1 | 14.9 | 15.1 | 45.1 | 24.9 | 0.75 a, 3.75 b | - | - | |
| 2 | 47.1 | 8.8 | 24.6 | 19.5 | 0.75 a, 3.75 b | - | - | ||
| 8 | 1 | 14.9 | 15.1 | 45.1 | 24.9 | 0.75 a, 3.75 b | - | 0.027 a, 0.72 b | |
| 2 | 47.1 | 8.8 | 24.6 | 19.5 | 0.75 a, 3.75 b | - | 0.027 a, 0.72 b | ||
| 9 | 1 | 14.9 | 15.1 | 45.1 | 24.9 | 0.75 a, 3.75 b | 0.53 a, 6.5 b | 0.027 a, 0.72 b | |
| 2 | 47.1 | 8.8 | 24.6 | 19.5 | 0.75 a, 3.75 b | 0.53 a, 6.5 b | 0.027 a, 0.72 b | ||
| 10 | 1 | 14.9 | 15.1 | 45.1 | 24.9 | 0.75 a, 3.75 b | 0.53 a, 6.5 b | - | |
| 2 | 47.1 | 8.8 | 24.6 | 19.5 | 0.75 a, 3.75 b | 0.53 a, 6.5 b | - | ||
| Parameters | Value | Comments/Reference |
|---|---|---|
| PhysChem and Blood Binding | ||
| Mol Weight (g/mol) | 727.07 | |
| Log P | 5.49 | Measured unpublished data |
| pKa 1 | 4.63 | |
| pKa 2 | 8.65 | |
| B/P | 0.53 | |
| fu | 0.14 | |
| Absorption | ||
| Absorption Model | ADAM | |
| UBL fluid volumes | Yes | |
| fu(Gut) | 0.226 | Based on ADME study |
| Peff,man Type | Regional | |
| Permeability Method | Mechanistic Model | |
| Effective Concentration for Permeation | Total Concentration | Based on MDCK Papp data using FaSSIF/ FeSSIF media |
| MechPeff, Ptrans,0 (10−6 cm/s) | 4565.23 | Predicted by Simcyp |
| Include Ion Transcellular Permeation | No | Based on MDCK Papp data |
| Apply Accessible Surface Area Scalar | Yes | Default |
| Force Unstirred boundary layer pH to bulk pH | No | Default |
| Paracellular Scalar | 0.00039 | Default |
| Peff,man (10−4 cm/s) duodenum | 0.13 | Predicted * |
| Peff,man (10−4 cm/s) jejunum I | 0.14 0.095 | |
| Peff,man (10−4 cm/s) jejunum II | ||
| Peff,man (10−4 cm/s) ileum I | 0.037 | |
| Peff,man (10−4 cm/s) ileum II | 0.037 | |
| Peff,man (10−4 cm/s) ileum III | 0.037 | |
| Peff,man (10−4 cm/s) ileum IV | 0.035 | |
| Peff,man (10−4 cm/s) colon | 0.015 | |
| Colon Abs scalar | 0.001 | GSK254 bioavailability from the colon is negligible based on ADME clinical data [12] |
| Input Form | Solid Formulation | |
| DLM Particle Handling Model | Particle Population Balance | |
| Formulation | IR: DLM Model | |
| Define Disintegration Profile | Not activated | |
| Dissolution Type | Solubility | |
| Solubility Type | Intrinsic (user) | |
| Solubility (mg/mL) | 0.00015 | Fitted using FTIH clinical data |
| Supersaturation Precipitation Model | First Order | |
| FO Precipitation Model | Model 2 | |
| PRC (Precipitation Rate Constant) | Global | |
| PRC (1/h) | 0.0001 | |
| CSR (Critical Supersaturation Ratio) | Global | |
| CSR value | 1000.00 | |
| Reference Concentration for Precipitation Model | Unbound-Unionised | |
| Dispersion Type | Polydispersed | |
| Particle size distribution | Log Normal | Fitting measured data |
| Input Type | Volume Fraction | |
| D10 (µm) | 3.2 | Measured |
| D50 (μm) | 8.1 | |
| D90 (μm) | 23.1 | |
| No. of Bins (Simulation) | 50 | Default |
| Particle density (g/mL) | 1.2 | Measured |
| Heff method selected | Hintz-Johnson | Default |
| Heff cut-off value (µm) | 30 | Default |
| Bile Micelle mediated solubilisation | On | |
| LogKm:w,unionized | 0.019 | Estimated with SIVA 4 |
| LogKm:w,ionized | 4.559 | Estimated with SIVA 4 |
| Segregated transit time model | Activated | |
| MRT of particles and pellets may be shorter than fluid | Activated | |
| Mucus regional thickness | Default values | |
| Distribution related parameters | ||
| Distribution Model | Full PBPK Model | |
| Vss (L/Kg) | 0.34 | Predicted |
| Prediction Method | Method 2 | |
| Kp Scalar | 1.0 | |
| Elimination related parameters | ||
| Clearance Type | Enzyme Kinetics | Determined based on ADME study [12] |
| In vitro metabolic system | Recombinant | |
| Enzyme | CYP3A4 | |
| CLint (µL/min/pmol) | 0.003 | |
| fu mic | 1.0 | |
| Enzyme | UGT1A4 | |
| CLint (µL/min/pmol) | 0.009 | |
| fu mic | 1.0 | |
| Enzyme | UGT2B7 | |
| CLint (µL/min/pmol) | 0.007 | |
| fu mic | 1.000 | |
| ISEF | 1.000 | |
| Additional HLM CLint (μL/min/mg protein) | 0.354 | |
| Biliary CLint (Hep) (µL/min/106) | 0.111 | |
| CL R (L/h) | 0.020 |
| Compound | Drug (µM) | Rate A > B (nmoles/cm2/h) | s.d. | A > B M.B (%) | s.d. | Pexact (nm/s) A > B | s.d. |
|---|---|---|---|---|---|---|---|
| GSK254 + GF120918 (DMEM/DMEM) | 2.67 | 0.00 | 0.0 | 74 | 8.3 | 0.0 | 0.0 |
| GSK254 + GF120918 (FaSSIF pH7.4) | 2.67 | 0.031 | NA | 109 | NA | 29 | NA |
| GSK254 + GF120918 (FaSSIF pH6.5) | 2.67 | 0.015 | 0.0041 | 97 | 2.4 | 16 | 4.5 |
| GSK254 + GF120918 (FeSSIF pH7.4) | 2.67 | 0.055 | NA | 87 | NA | 67 | NA |
| GSK254 + GF120918 (FeSSIF pH5.8) | 2.67 | 0.021 | 0.0068 | 96 | 9.7 | 23 | 6.9 |
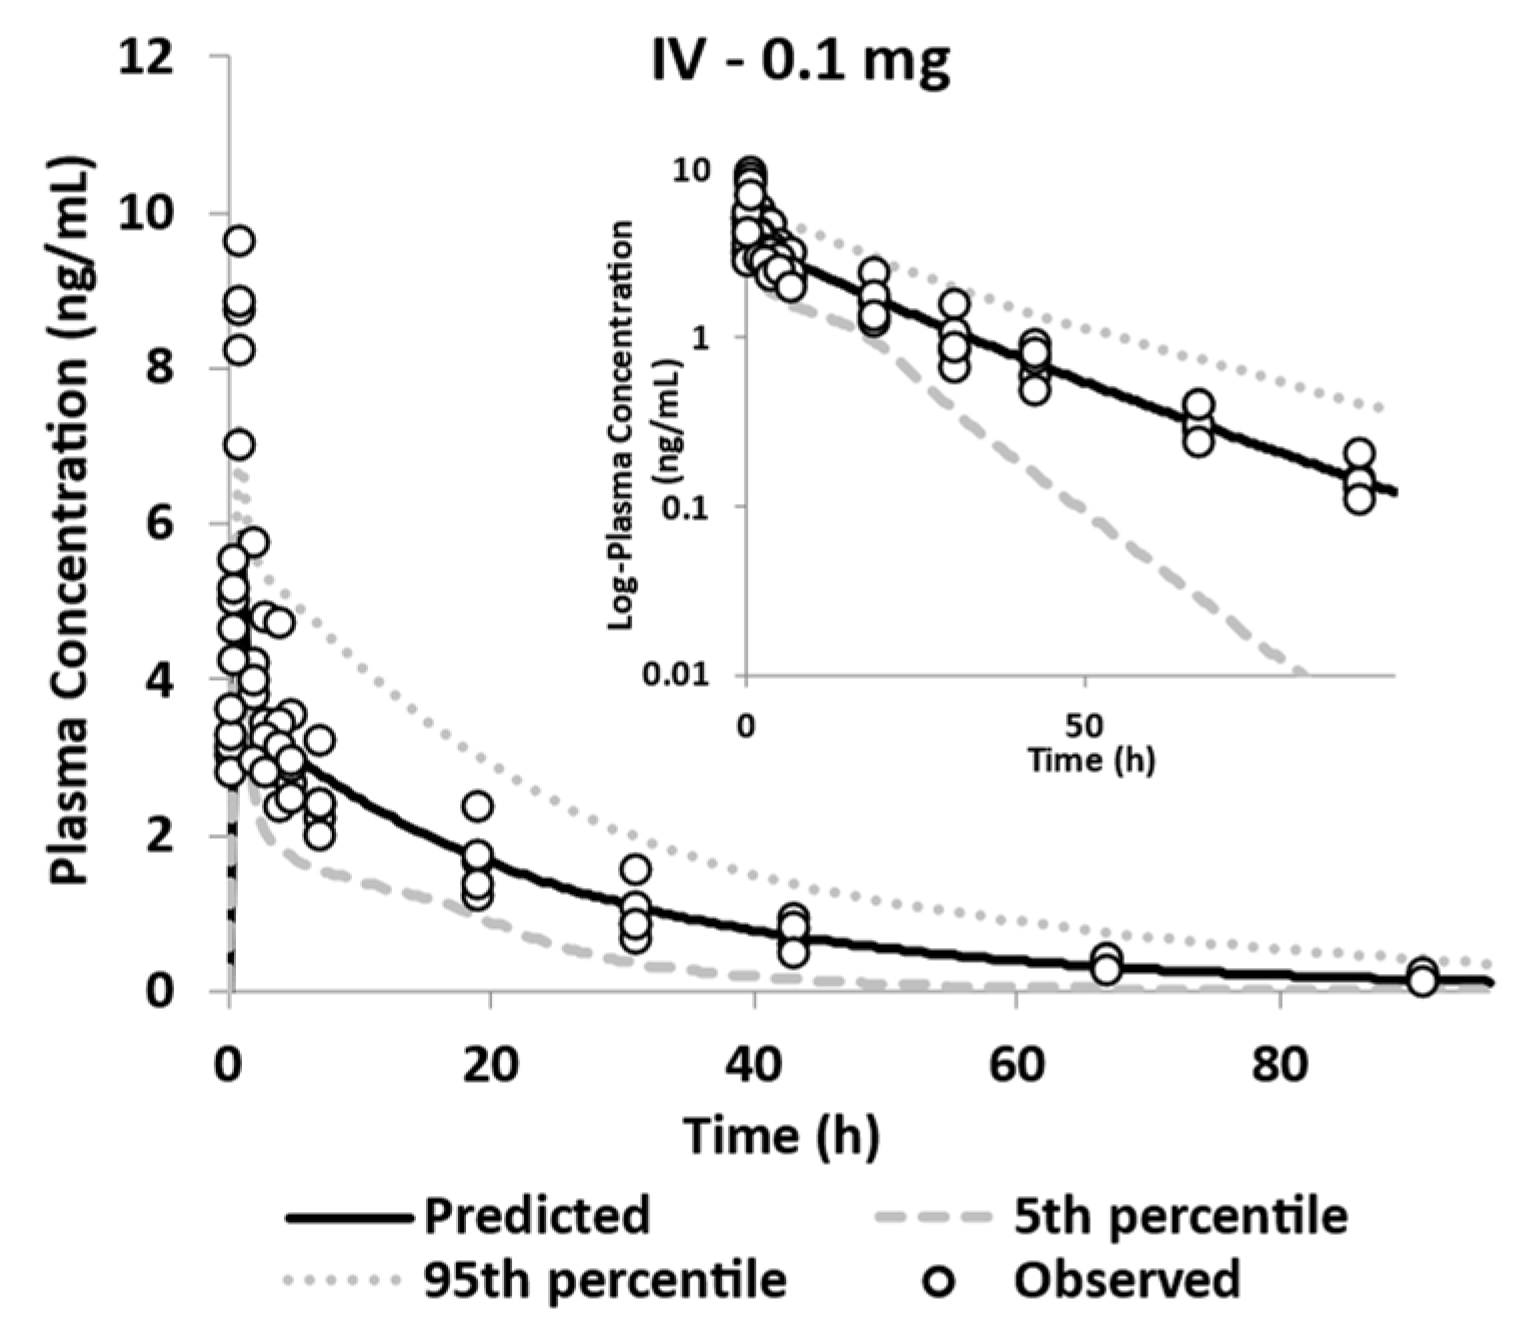
| Geometric Mean (%CVb)-0.1 mg [14C]-GSK254 IV Dose (n = 5) | |||||
|---|---|---|---|---|---|
| Cmax (ng/mL) | AUC(0-t) (ng/mL·h) | Vss (L/kg) | CL (L/h) | T1/2 (h) | |
| Simulated | 5.98 (16) | 87.8 (41) | 0.34 (17) | 1.14 (41) | 17.37 (37) |
| Observed | 8.44 (12.0) | 93.3 (20.4) | 0.36 (0.27) | 1.04 (19.7) | 21.7 (12.6) |
| Pred/Obs | 0.71 | 0.94 | 0.94 | 1.10 | 0.80 |
| Medium | pH | Solubility (mg/mL) | |
|---|---|---|---|
| Experimental | Predicted | ||
| FeSSIF+CH+OA | 6.9 | 3.71 | 2.03 |
| 6.2 | 4.1 | 2.03 | |
| 5 | 0.52 | 2.03 | |
| FeSSIF | 6.99 | 1.24 | 2.03 |
| 6.2 | 0.94 | 2.03 | |
| 4.8 | 1.94 | 2.03 | |
| FaSSIF | 6.5 | 0.36 | 0.71 |
| FaSSIF+CH+OA | 6.5 | 0.17 | 0.71 |
| LogKM:W | Media Set | Solubility (mg/mL) | |||
|---|---|---|---|---|---|
| Observed | Predicted | Pred/Obs | |||
| Neutral | 1.05 × 10⁻⁶ | FaSSIF@pH6.5 | 0.36 | 0.65 | 1.81 |
| Ion | 5.149 | FeSSIF@pH4.8 | 1.94 | 1.84 | 0.95 |
| Neutral | 0.019 | FaSSIF+CH+OA@pH6.5 | 0.17 | 0.2 | 1.18 |
| Ion | 4.559 | FeSSIF+CH+OA@pH4.8 | 0.52 | 0.51 | 0.98 |
| Study | Dose (mg) | State | Cmax (μg/mL) * | Tmax (h) ** | AUC (μg/mL h) * | |||
|---|---|---|---|---|---|---|---|---|
| Obs. | Pred. | Obs. | Pred. | Obs. | Pred. | |||
| ADME-study [12] | 200 | a Fed | 1.3 (7.6) | 1.0 (40) | 7 (4.5–9.0) | 5.0 (3.1–7.9) | 41.2 (14.5) b | 28.7 (44) |
| FTIH [1] *** | 50 | 0.41 (31.6) (95%CI: 0.30–0.57) | 0.49 (43) (95%CI: 0.44–0.54) | 3.8 (2.5–5) | 4.57(2.45–7.25) | 6.3 (34.0) (95%CI: 4.4–8.9) c | 8.4 (49) (95%CI: 7.4–9.4) | |
| 100 | 1.18 (10.3) (95%CI: 1.1–1.3) | 0.96 (43) (95%CI: 0.9–1.1) | 4.0 (1.5–4.5) | 4.60 (2.4–7.25) | 17.5 (13.8) (95%CI: 15.2–20.2)c | 16.5 (48) (95%CI: 14.6–18.5) | ||
| 200 | 1.40 (30.8) (95%CI: 1.2–1.6) | 1.77 (42) (95%CI: 1.6–1.96) | 3.8 (1.5–5.5) | 4.62 (2.5–6.9) | 21.5 (34.2) (95%CI: 18.7–24.7) c | 30.5 (47) (95%CI: 27.1–34.2) | ||
| 320 | 2.16 (20.4) (95%CI: 1.7–2.7) | 2.4 (42) (95%CI: 2.2–2.7) | 4.3 (1.5–6.0) | 4.70 (2.6–6.7) | 32.0 (35.4) (95%CI: 22.3–45.8) c | 41.7 (47) (95%CI: 37.1–46.8) | ||
| Phase IIa [2] **** | 10 | 0.06 (41.3) (95%CI: 0.04–0.08) | 0.098 (41) (95%CI: 0.089–0.11) | 4.02 (1.87–5.00) | 4.55 (2.45–7.3) | 0.91 (44.7) (95%CI: 0.58–1.42) | 1.7(47) (95%CI: 1.5–1.9) | |
| 40 | 0.47 (20.6) (95%CI: 0.38–0.58) | 0.4 (42) (95%CI: 0.35–0.44) | 4.06 (2.00–8.00) | 4.55 (2.4–7.25) | 7.46 (26.8) (95%CI: 5.66–9.84) | 6.8 (47) (95%CI: 6.1–7.6) | ||
| 80 | 0.75 (23.7) (95%CI: 0.59–0.96) | 0.78 (41) (95%CI: 0.7–0.9) | 4.58 (4.00–5.18) | 4.5 (2.5–7.25) | 11.80 (26.7) (95%CI: 8.98–15.6) | 13.4 (46) (95%CI: 12–15) | ||
| 140 | 1.86 (26.0) (95%CI: 1.42–2.43) | 1.3 (41) (95%CI: 1.2–1.5) | 4.08 (2.92–5.2) | 4.60 (2.55–7.0) | 29.3 (27.9) (95%CI: 22.0–39.0) | 23 (46) (95%CI: 20.5–25.8) | ||
| 200 | 1.86 (19.5) (95%CI: 1.51–2.27) | 1.8 (40) (95%CI: 1.6–1.95) | 5.48 (3.00–6.20) | 4.6 (2.6–6.9) | 27.9 (18.4) (95%CI: 23.1–33.8) | 30.3 (45) (95%CI: 27.2–33.9 | ||
| Food Effect [11] | 200 | Moderate-fat | 1.43 (35.6) (95%CI: 1.2–1.7) | 1.0 (42) (95%CI: 0.96–1.1) | 5.00 (2.00–8.00) | 5.25 (3.0–8.4) | 41.0 (42.2) (95%CI: 34–49.6) b | 31.9 (48) (95%CI: 29.2–35) |
| High-fat | 1.08 (38.6) (95%CI: 0.91–1.28) | 5.00 (1.50–12.0) | 36.9 (35.9) (95%CI: 31.5–43.3) b | |||||
| Fasted | 0.35 (84.4) (95%CI: 0.23–0.55) | 0.36 (40) (95%CI: 0.33–0.39) | 4.0 (2.03–24.0) | 4.53 (1.9–6.3) | 13.5 (58.2) (95%CI: 9.1–19.8) b | 10.9 (47) (95%CI: 10.0–12) | ||
| AAFE | 1.23 | 1.15 | 1.30 | |||||
Disclaimer/Publisher’s Note: The statements, opinions and data contained in all publications are solely those of the individual author(s) and contributor(s) and not of MDPI and/or the editor(s). MDPI and/or the editor(s) disclaim responsibility for any injury to people or property resulting from any ideas, methods, instructions or products referred to in the content. |
© 2023 by the authors. Licensee MDPI, Basel, Switzerland. This article is an open access article distributed under the terms and conditions of the Creative Commons Attribution (CC BY) license (https://creativecommons.org/licenses/by/4.0/).
Share and Cite
Stamatopoulos, K.; Ferrini, P.; Nguyen, D.; Zhang, Y.; Butler, J.M.; Hall, J.; Mistry, N. Integrating In Vitro Biopharmaceutics into Physiologically Based Biopharmaceutic Model (PBBM) to Predict Food Effect of BCS IV Zwitterionic Drug (GSK3640254). Pharmaceutics 2023, 15, 521. https://doi.org/10.3390/pharmaceutics15020521
Stamatopoulos K, Ferrini P, Nguyen D, Zhang Y, Butler JM, Hall J, Mistry N. Integrating In Vitro Biopharmaceutics into Physiologically Based Biopharmaceutic Model (PBBM) to Predict Food Effect of BCS IV Zwitterionic Drug (GSK3640254). Pharmaceutics. 2023; 15(2):521. https://doi.org/10.3390/pharmaceutics15020521
Chicago/Turabian StyleStamatopoulos, Konstantinos, Paola Ferrini, Dung Nguyen, Ying Zhang, James M. Butler, Jon Hall, and Nena Mistry. 2023. "Integrating In Vitro Biopharmaceutics into Physiologically Based Biopharmaceutic Model (PBBM) to Predict Food Effect of BCS IV Zwitterionic Drug (GSK3640254)" Pharmaceutics 15, no. 2: 521. https://doi.org/10.3390/pharmaceutics15020521