
Gold Nanoparticles Induced Size Dependent Cytotoxicity on Human Alveolar Adenocarcinoma Cells by Inhibiting the Ubiquitin Proteasome System

 , , , and
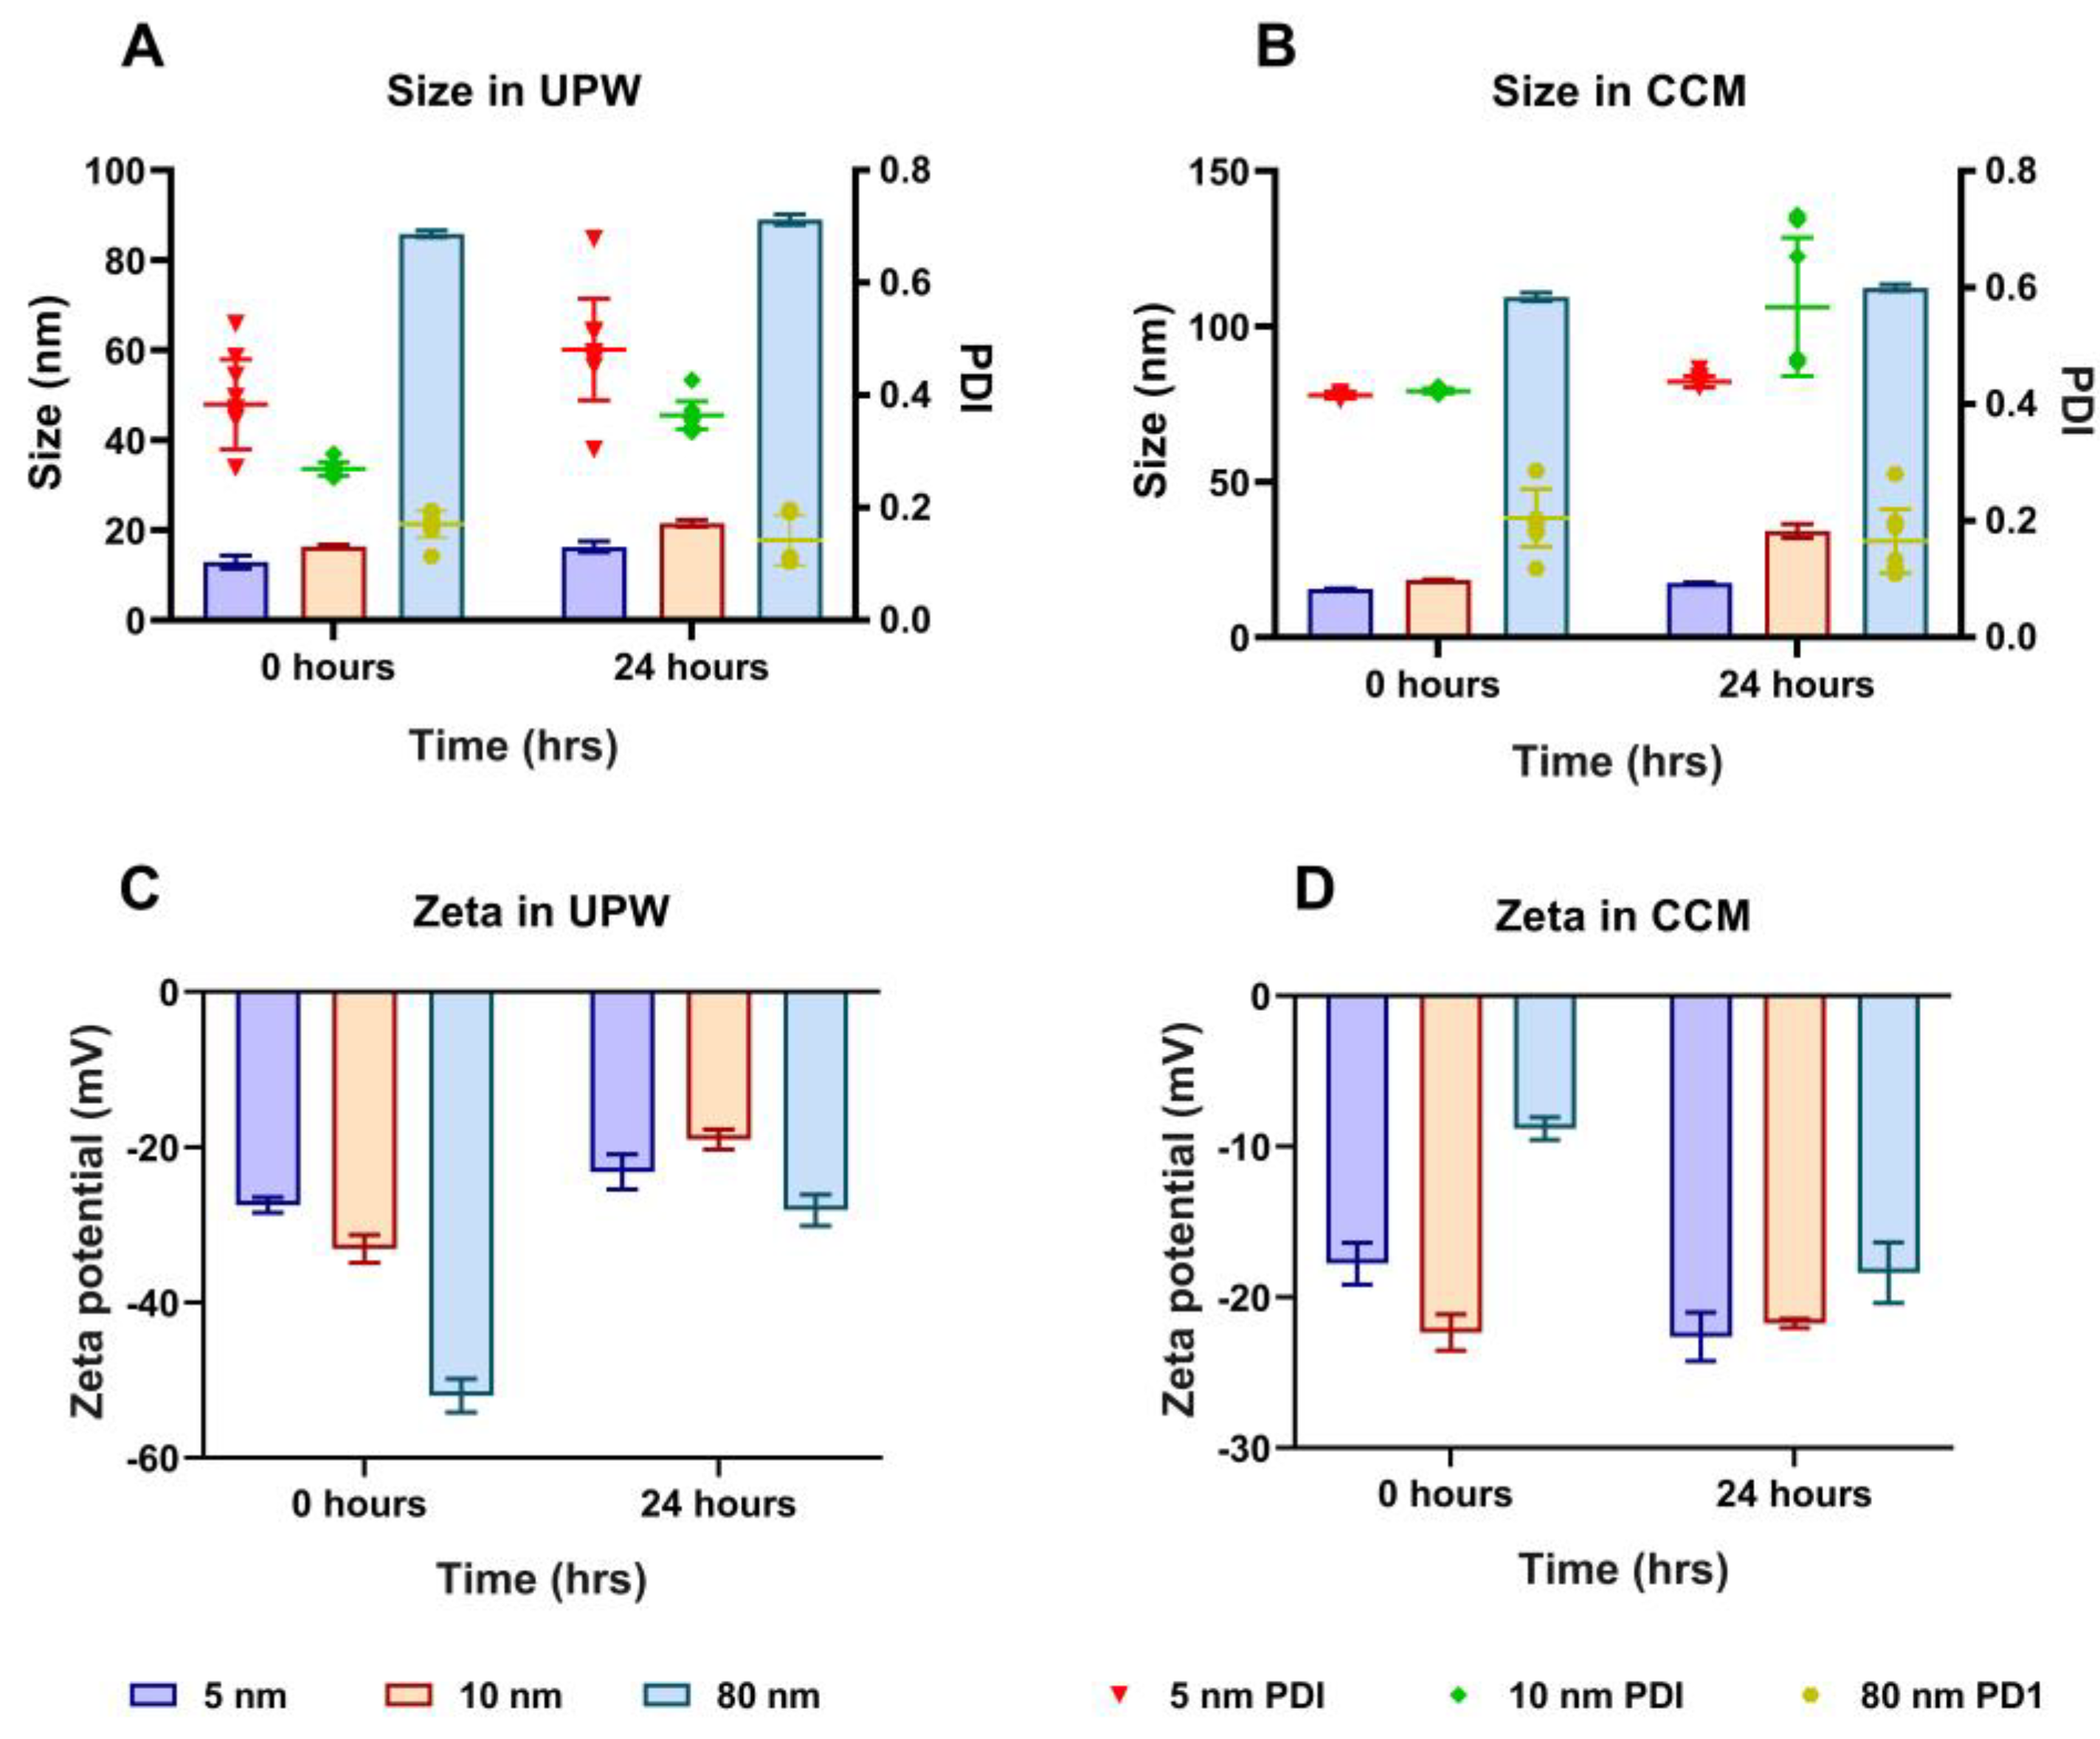
Abstract
:1. Introduction
2. Materials and Methods
2.1. Materials and Reagents
2.2. Physicochemical Characterisation of Different Sizes of AuNPs
2.3. Cell Culture of A549 Cells
2.4. Cell Viability Assays of Different Sizes of AuNPs
2.4.1. MTT Assay
2.4.2. LDH Release Assay
2.5. Cellular Uptake of Different Sizes of AuNPs
2.5.1. Inductively Coupled Plasma Mass Spectrometry
2.5.2. Flow Cytometry
2.5.3. Transmission Electron Microscopy
2.6. Cellular Uptake Mechanisms of Different Sizes of AuNPs using Pharmacological Inhibitors
2.6.1. Inductively Coupled Plasma Mass Spectrometry
2.6.2. Flow Cytometry
2.7. Detection of Reactive Oxygen Species Generation
2.8. Annexin-V/PI Apoptosis Assay
2.9. Western Blotting
2.10. Statistical Analysis
3. Results
3.1. Physicochemical Characterisation of Different Sizes of AuNPs
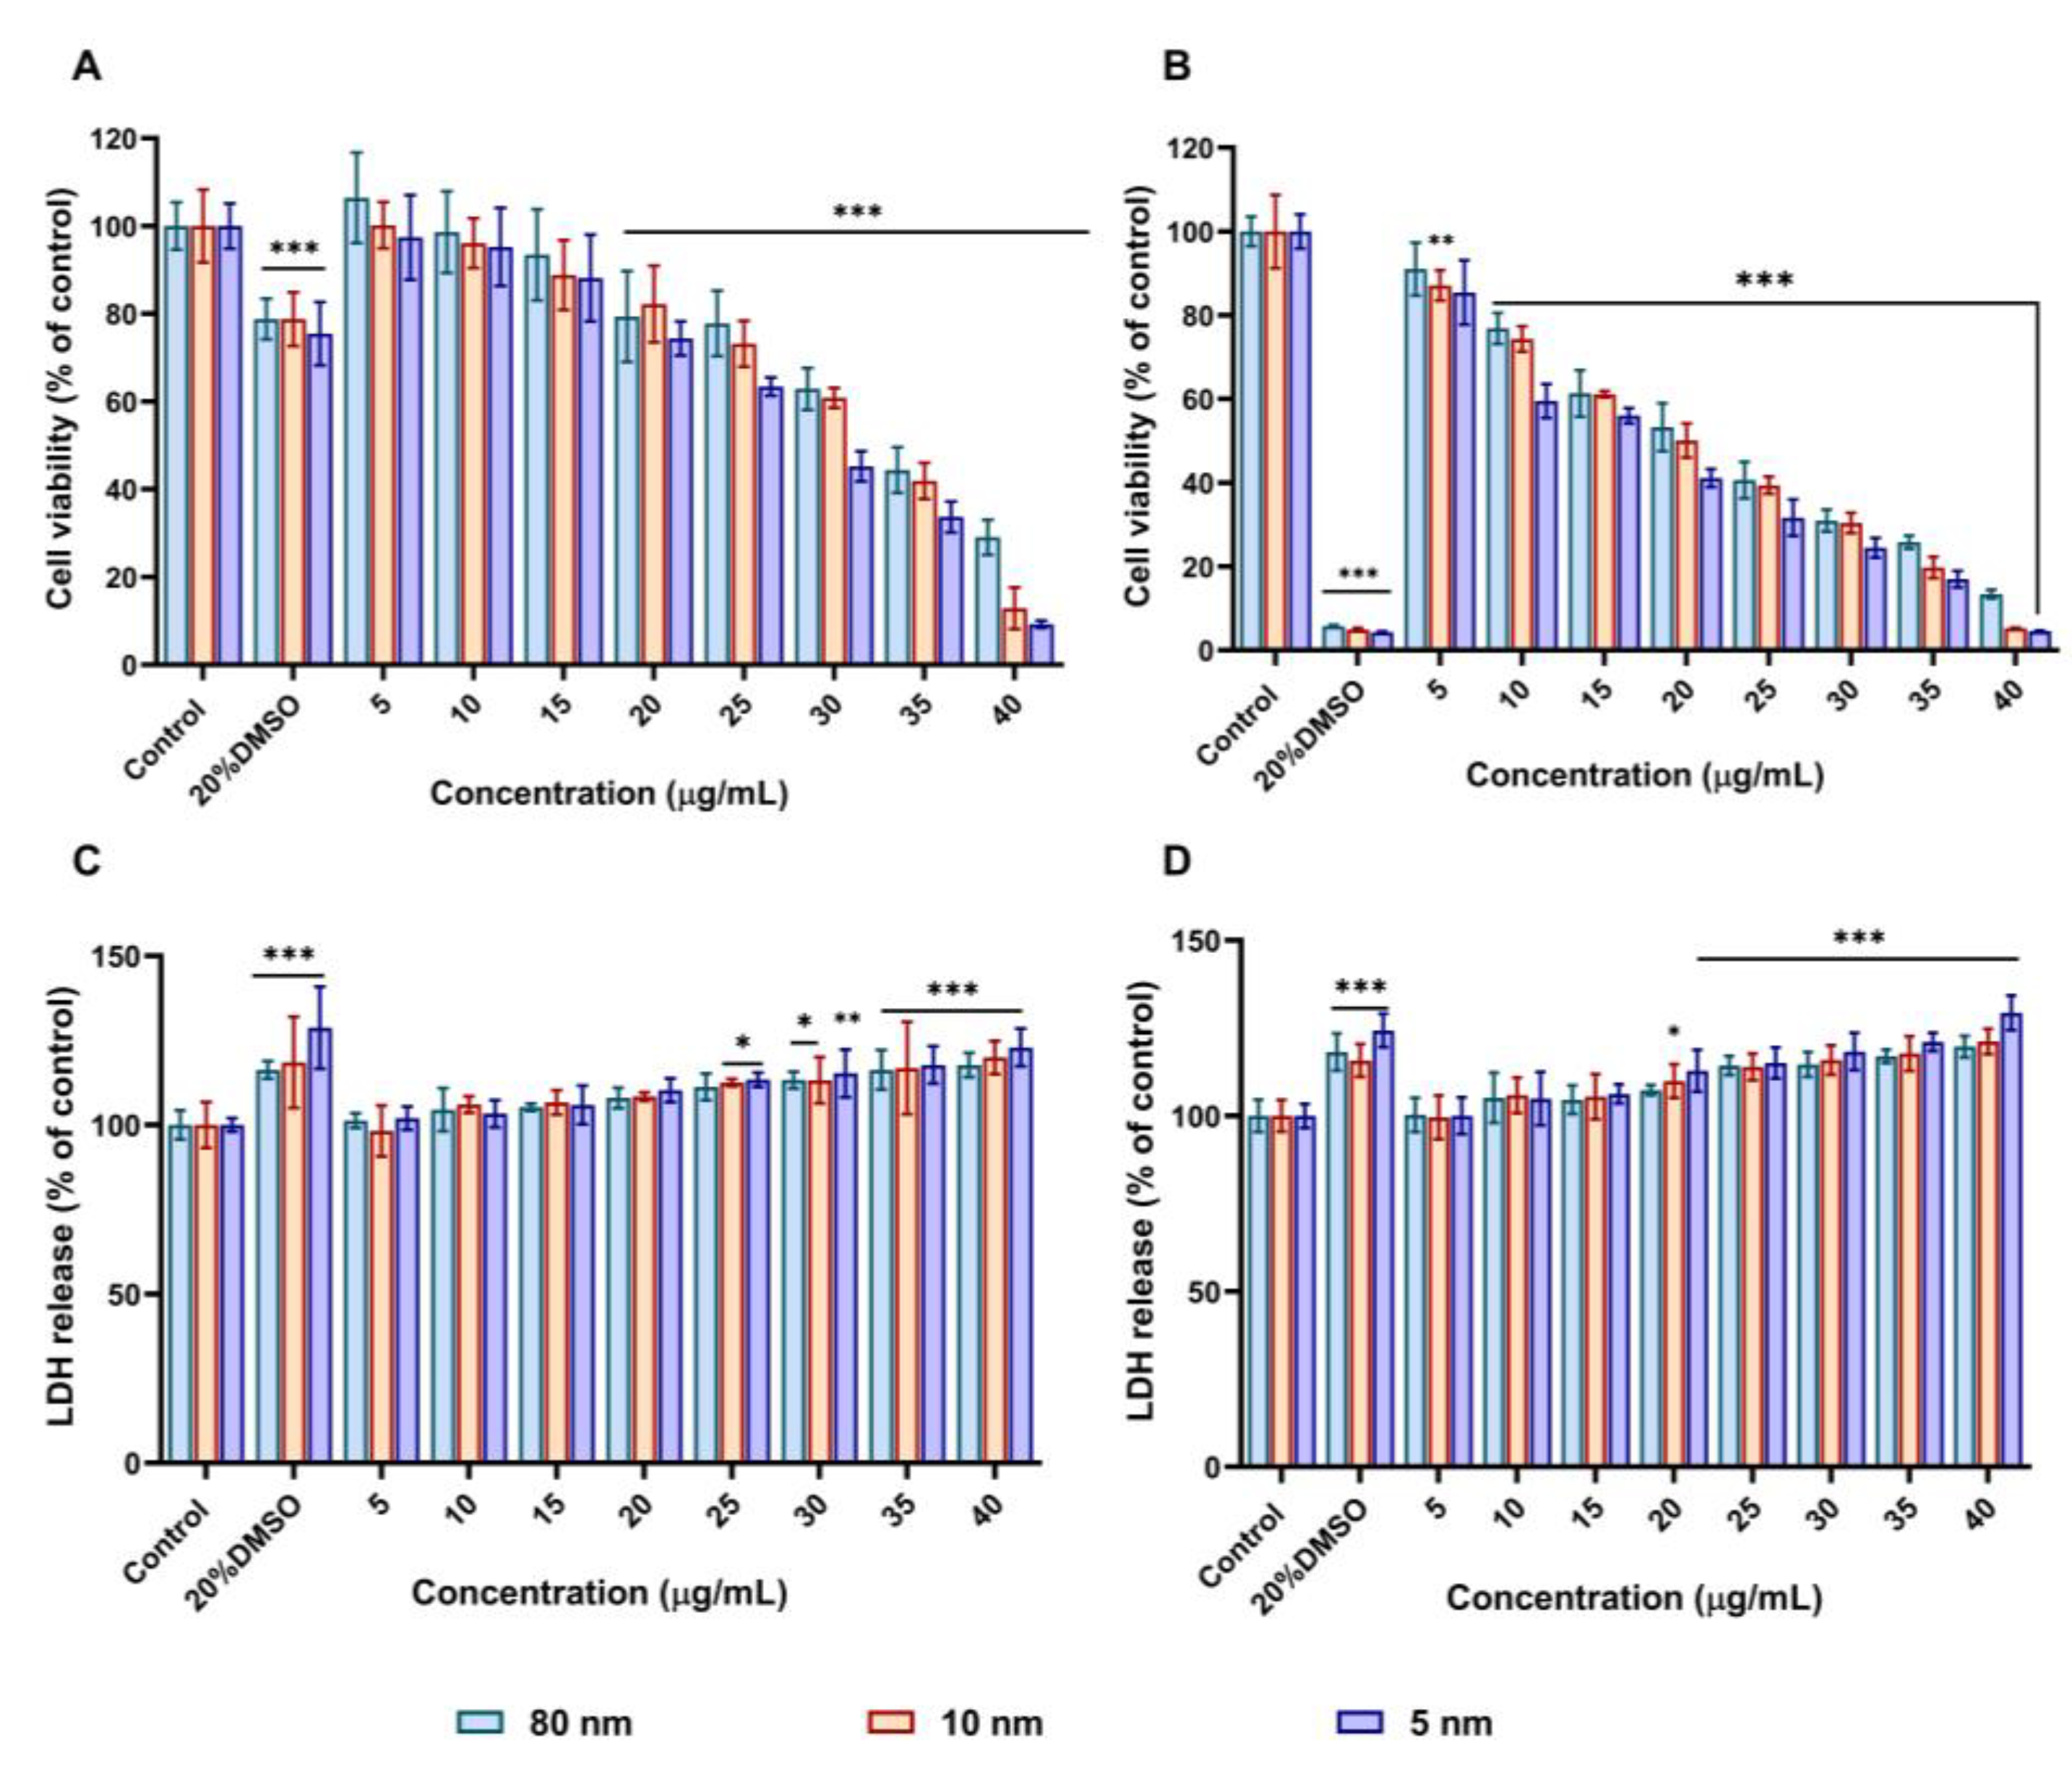
3.2. AuNPs Decreased Cell Viability and Increased LDH Release in A549
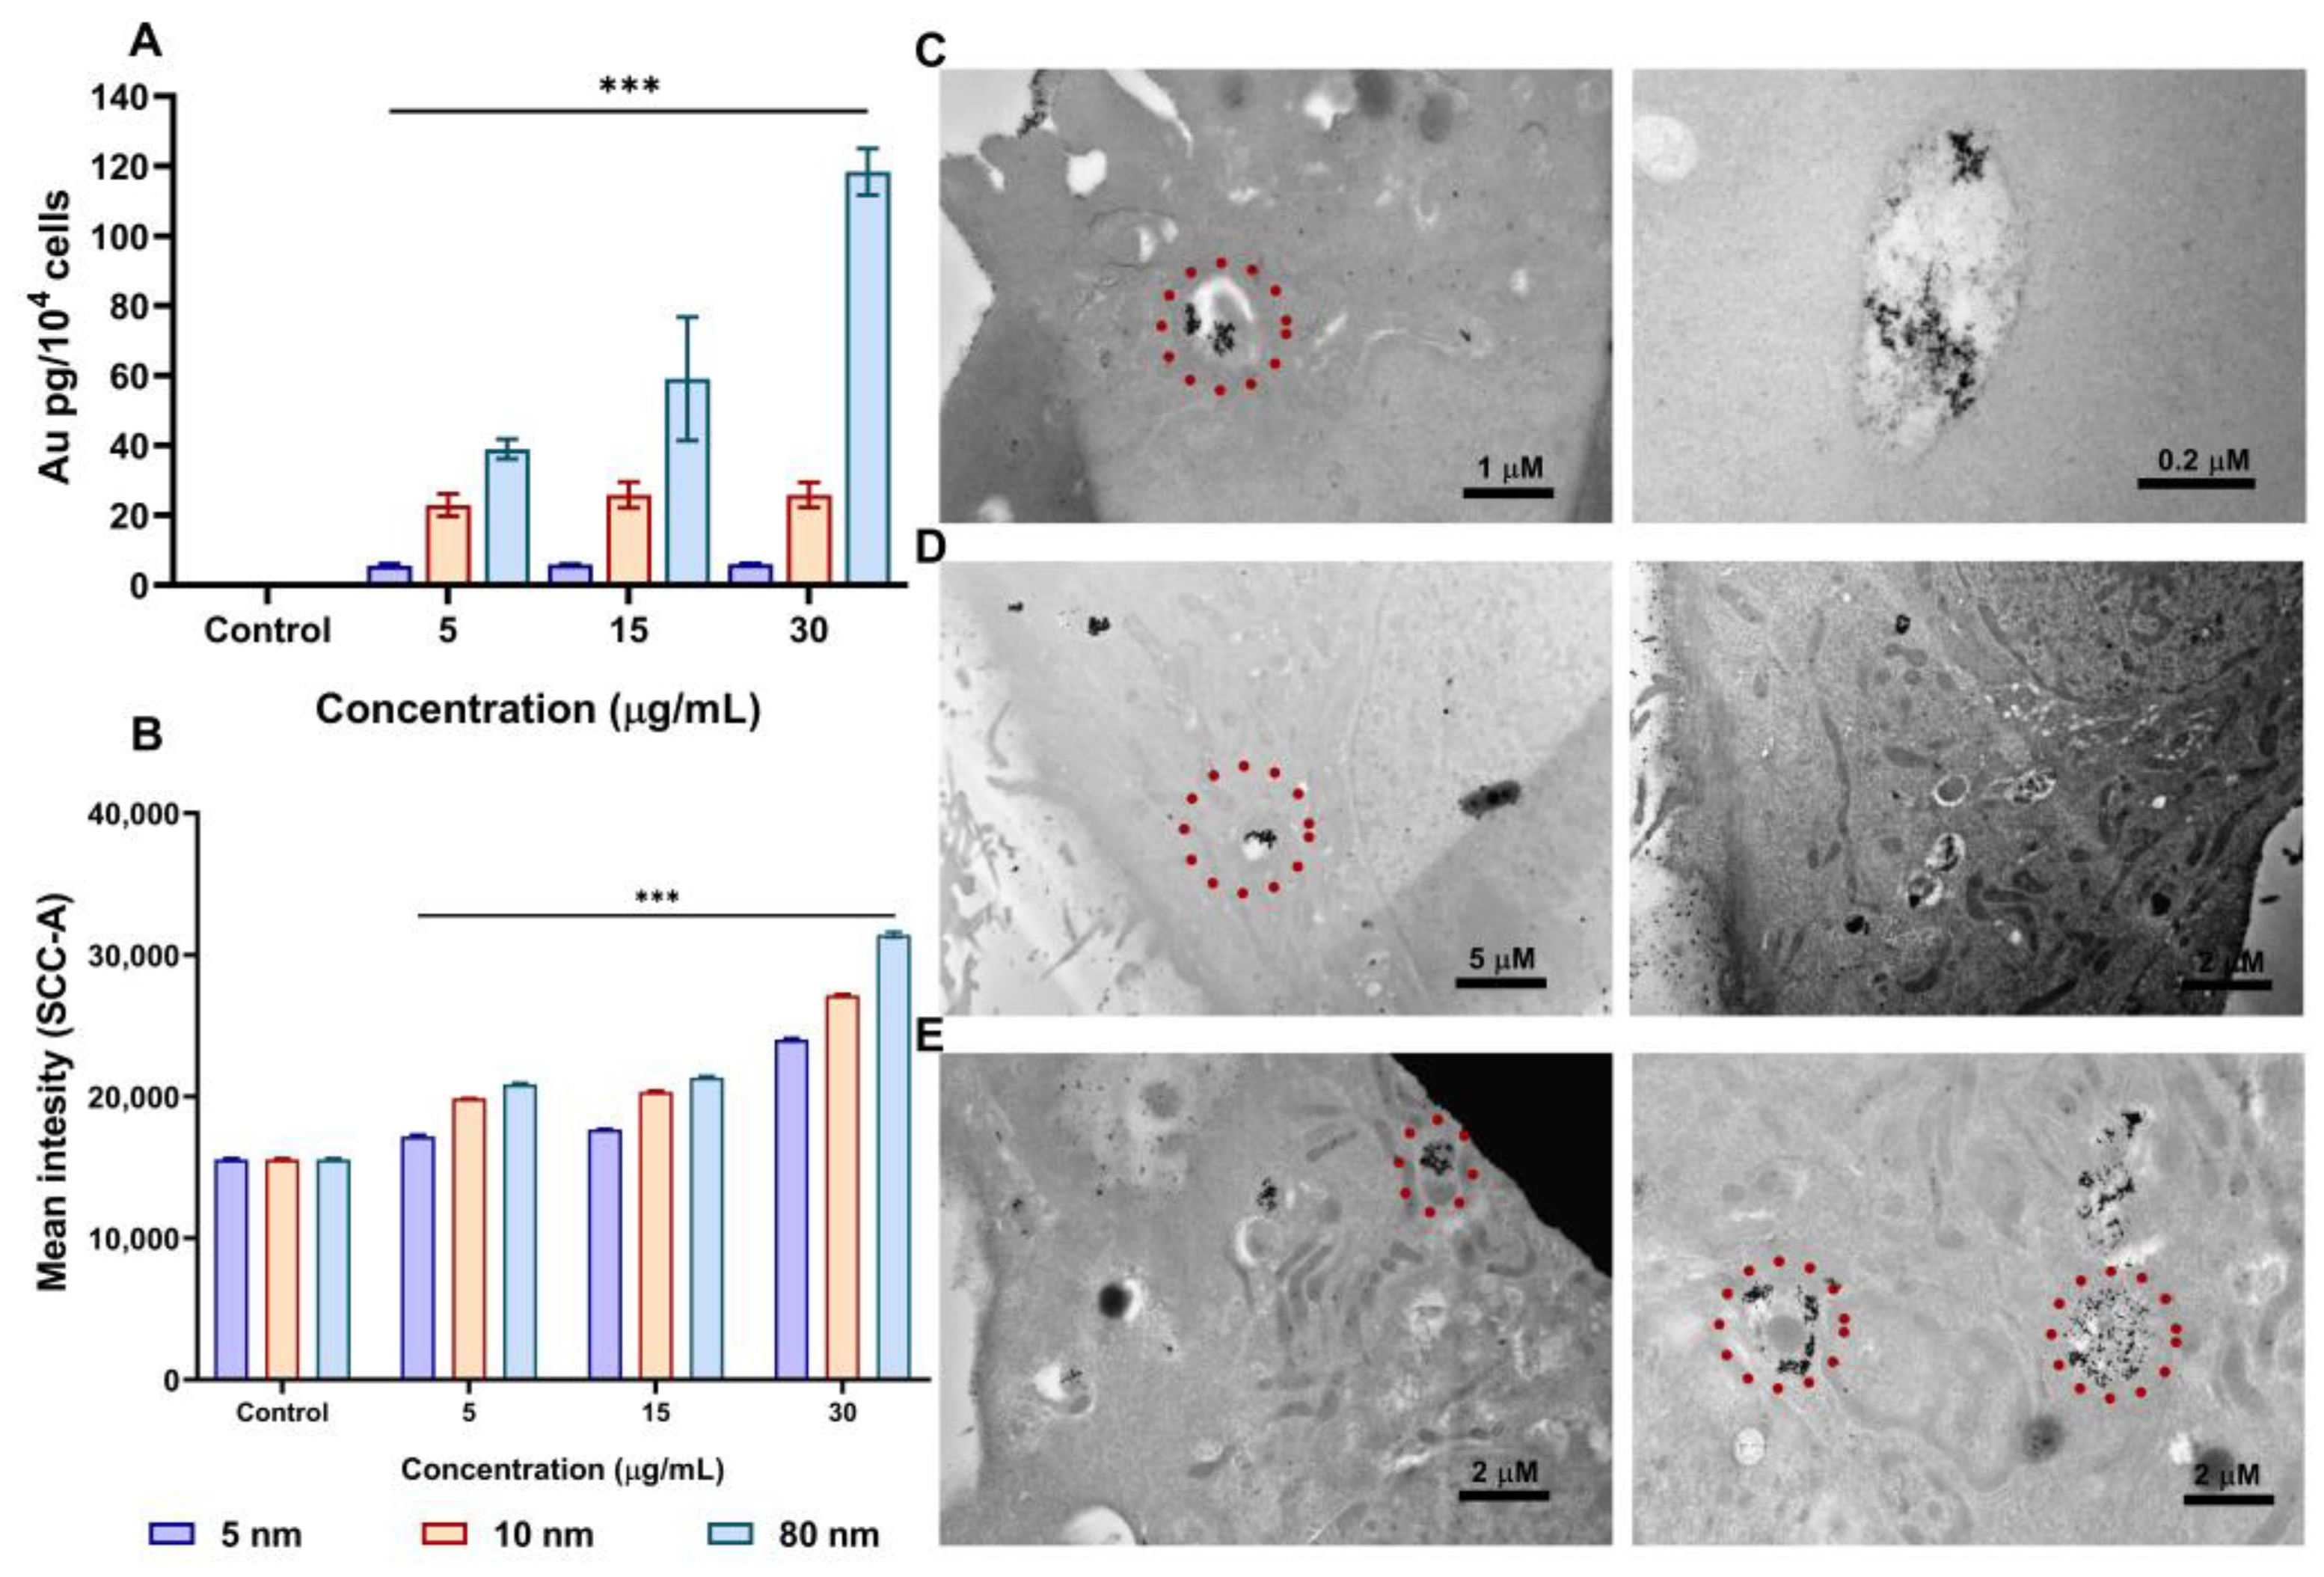
3.3. AuNPs Uptake in A549 cells by ICP-MS, Flow Cytometry, and Transmission Electron Microscopy (TEM)
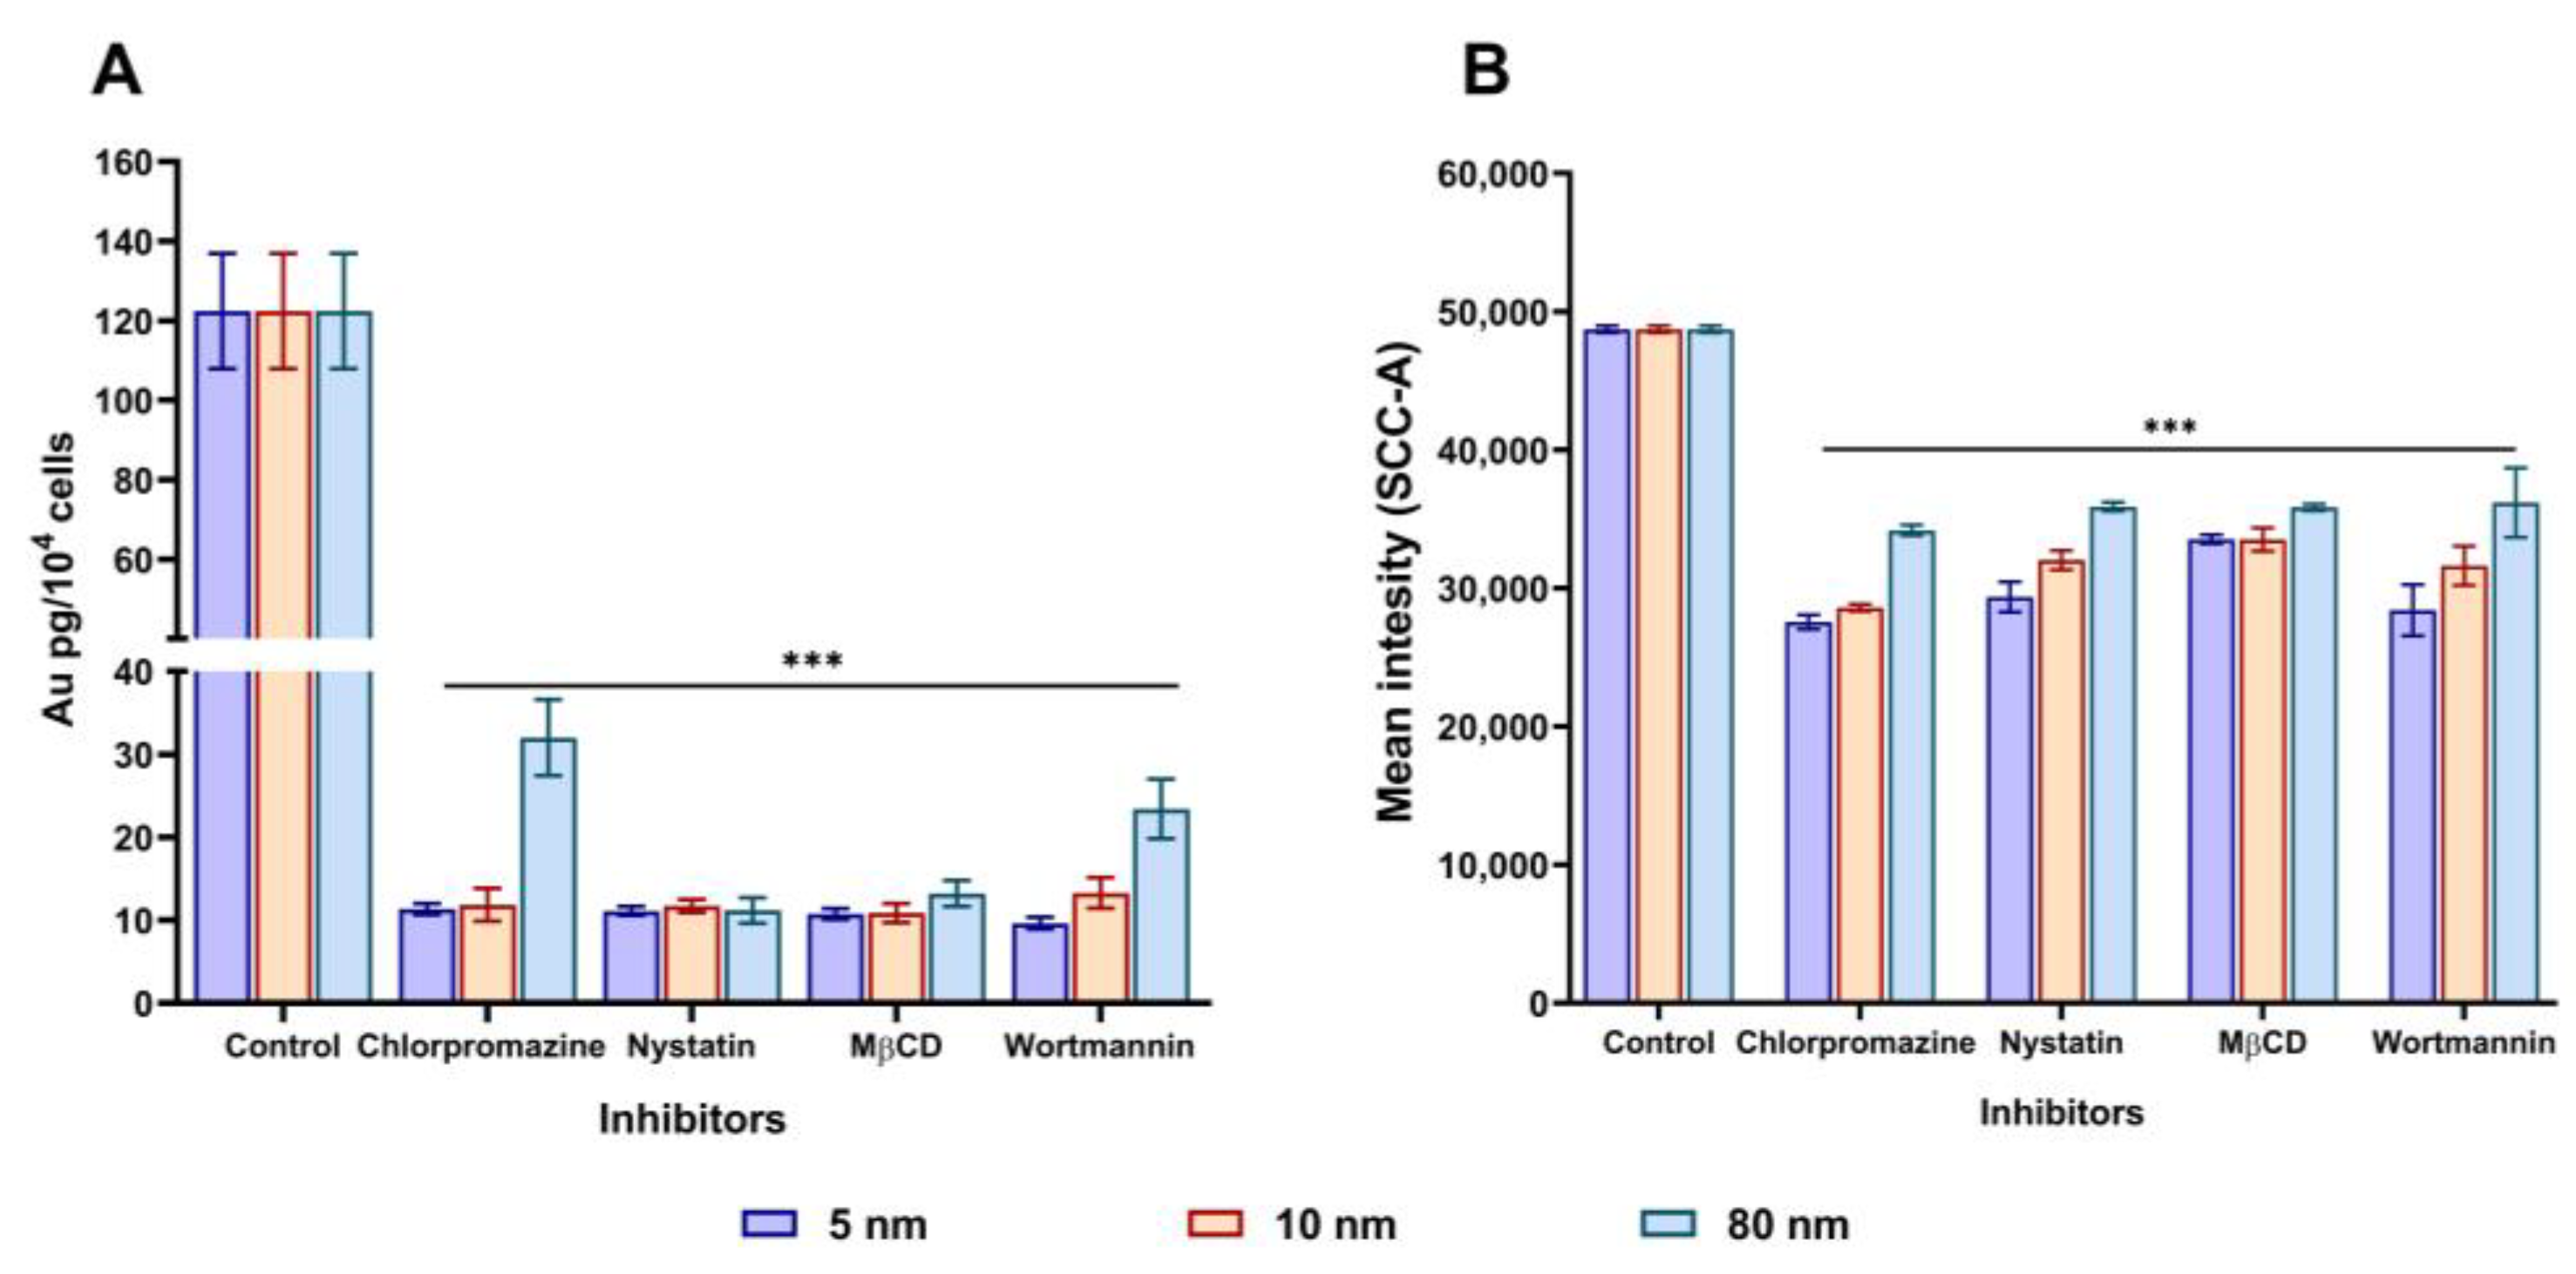
3.4. Assessment of the Uptake Mechanism(s) of Different Sizes of AuNPs in A549 Cells
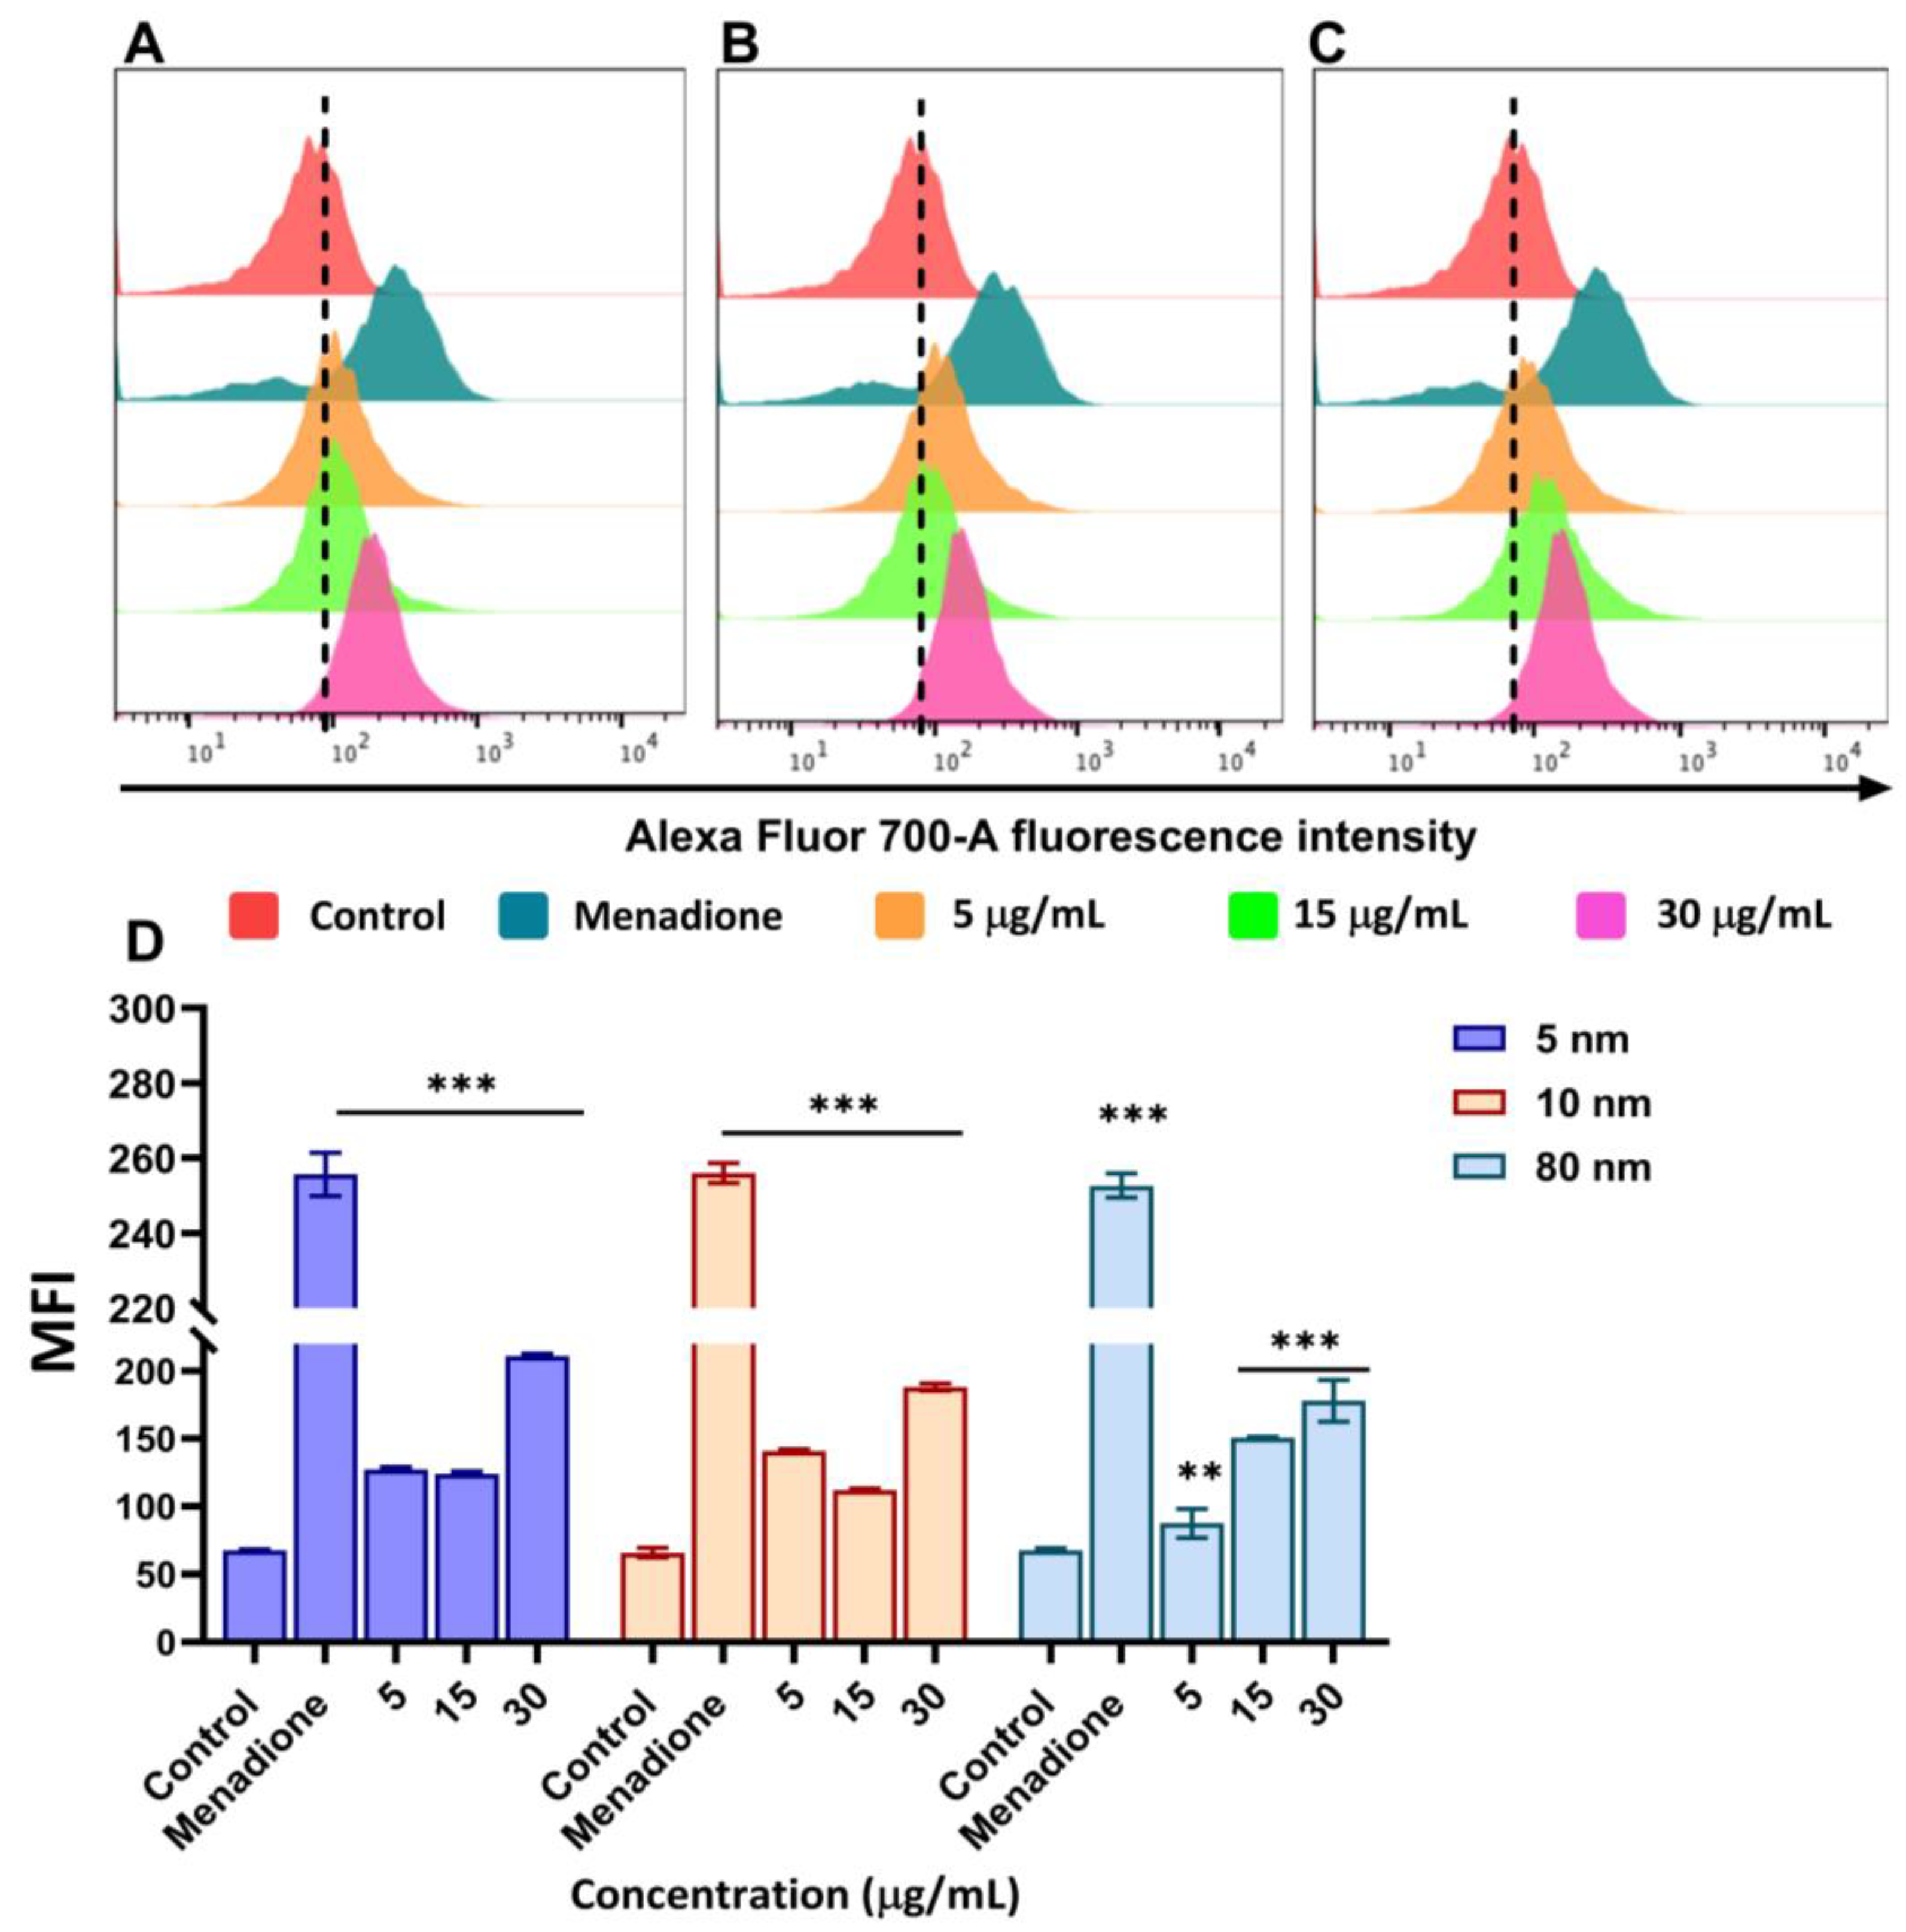
3.5. Upregulation of ROS Production Caused by Different Sizes of AuNPs
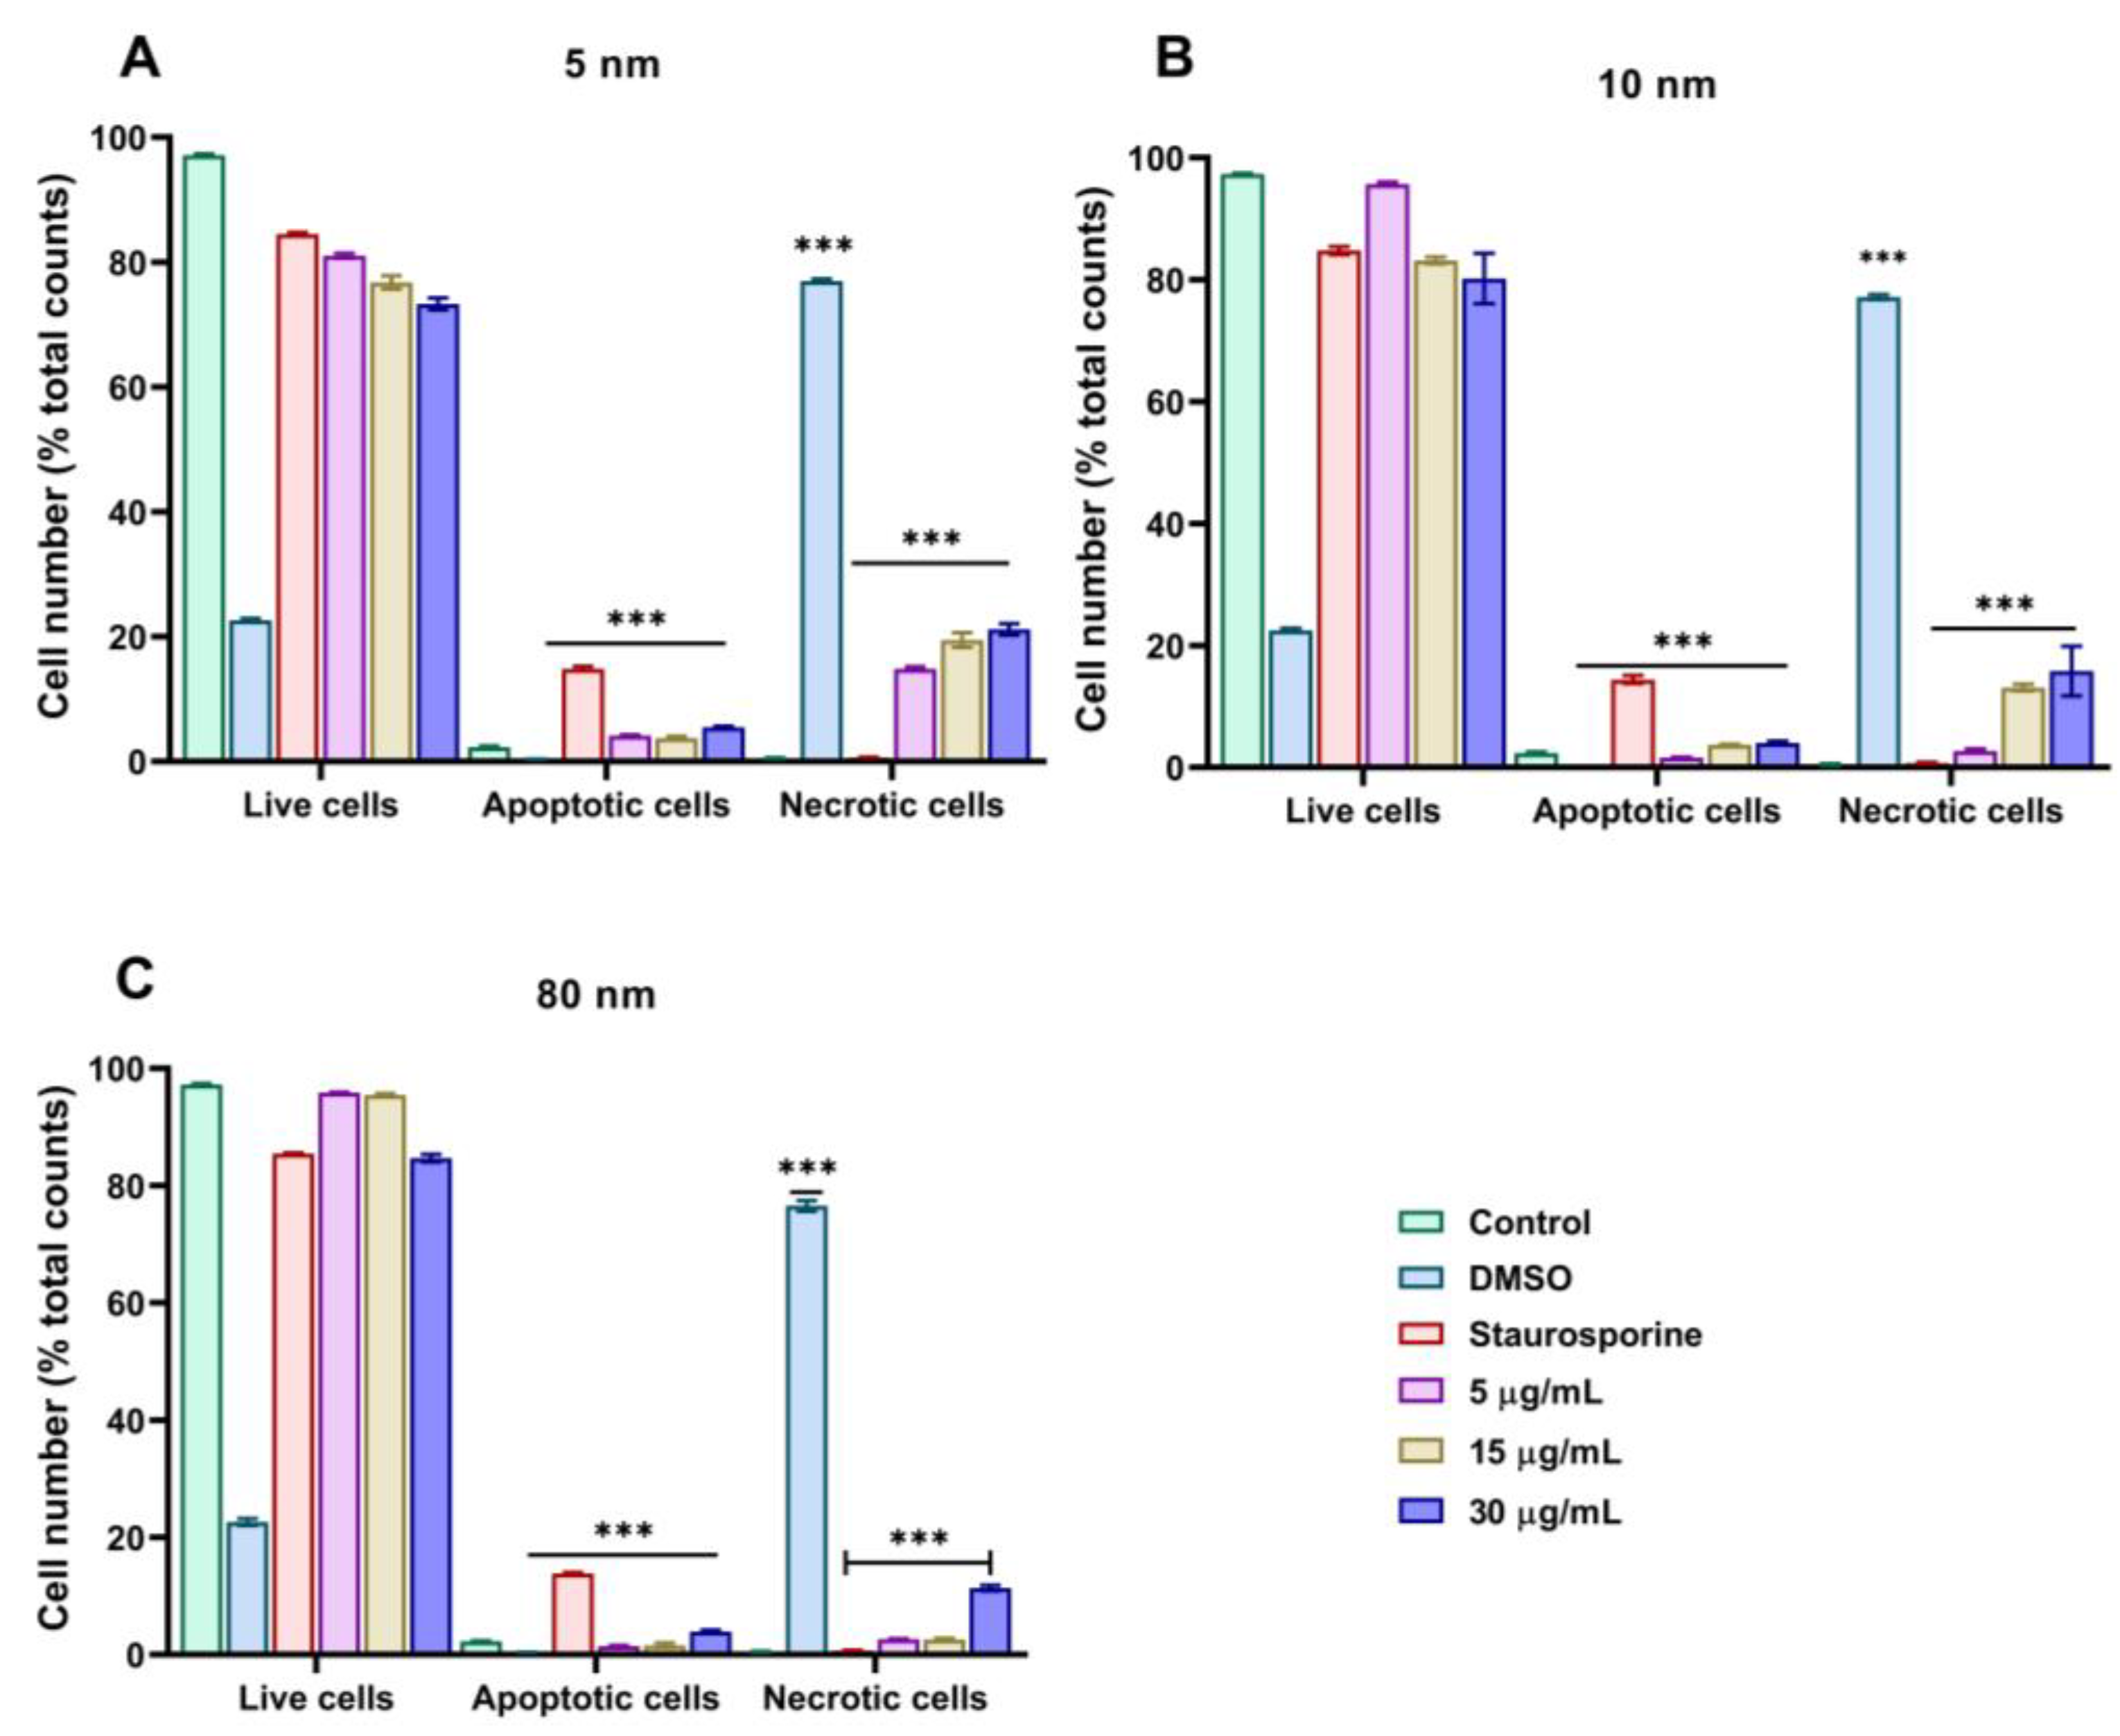
3.6. Mechanism of Cell Death of Different Sizes of AuNPs Assessed by Annexin-V/PI
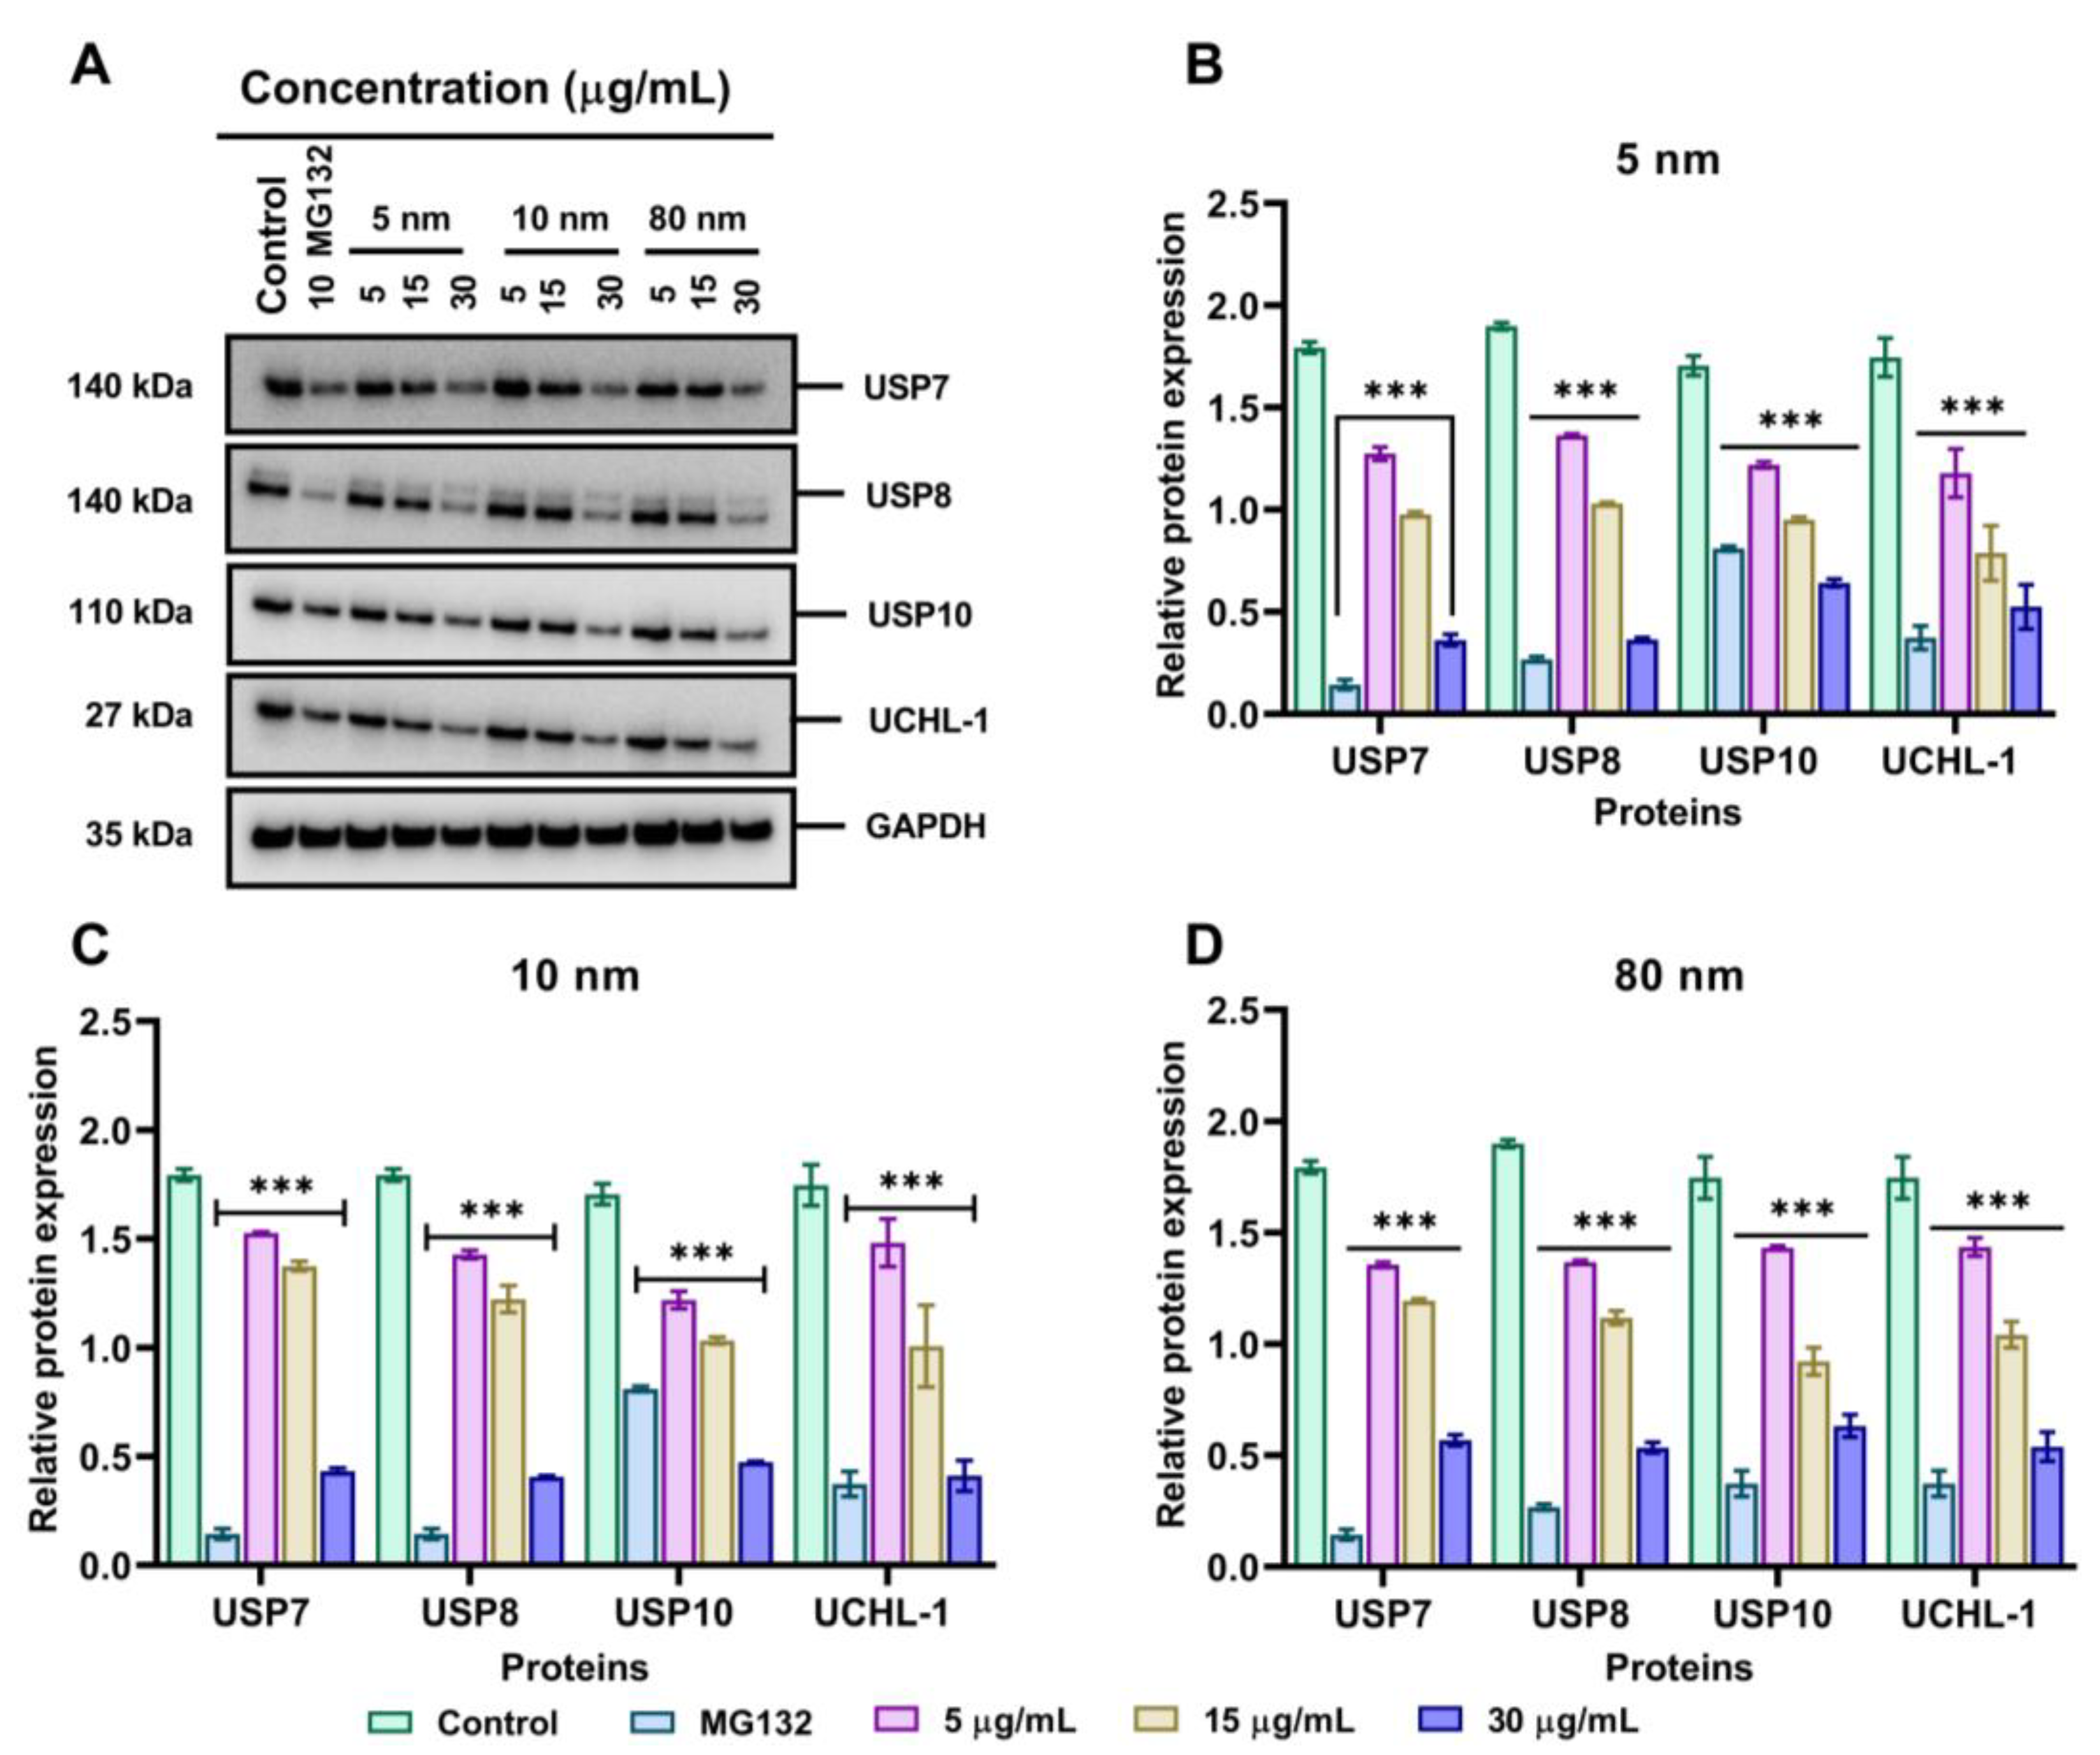
3.7. Effects of Different Sizes of AuNPs on 19S Proteasome DUBs Enzymes
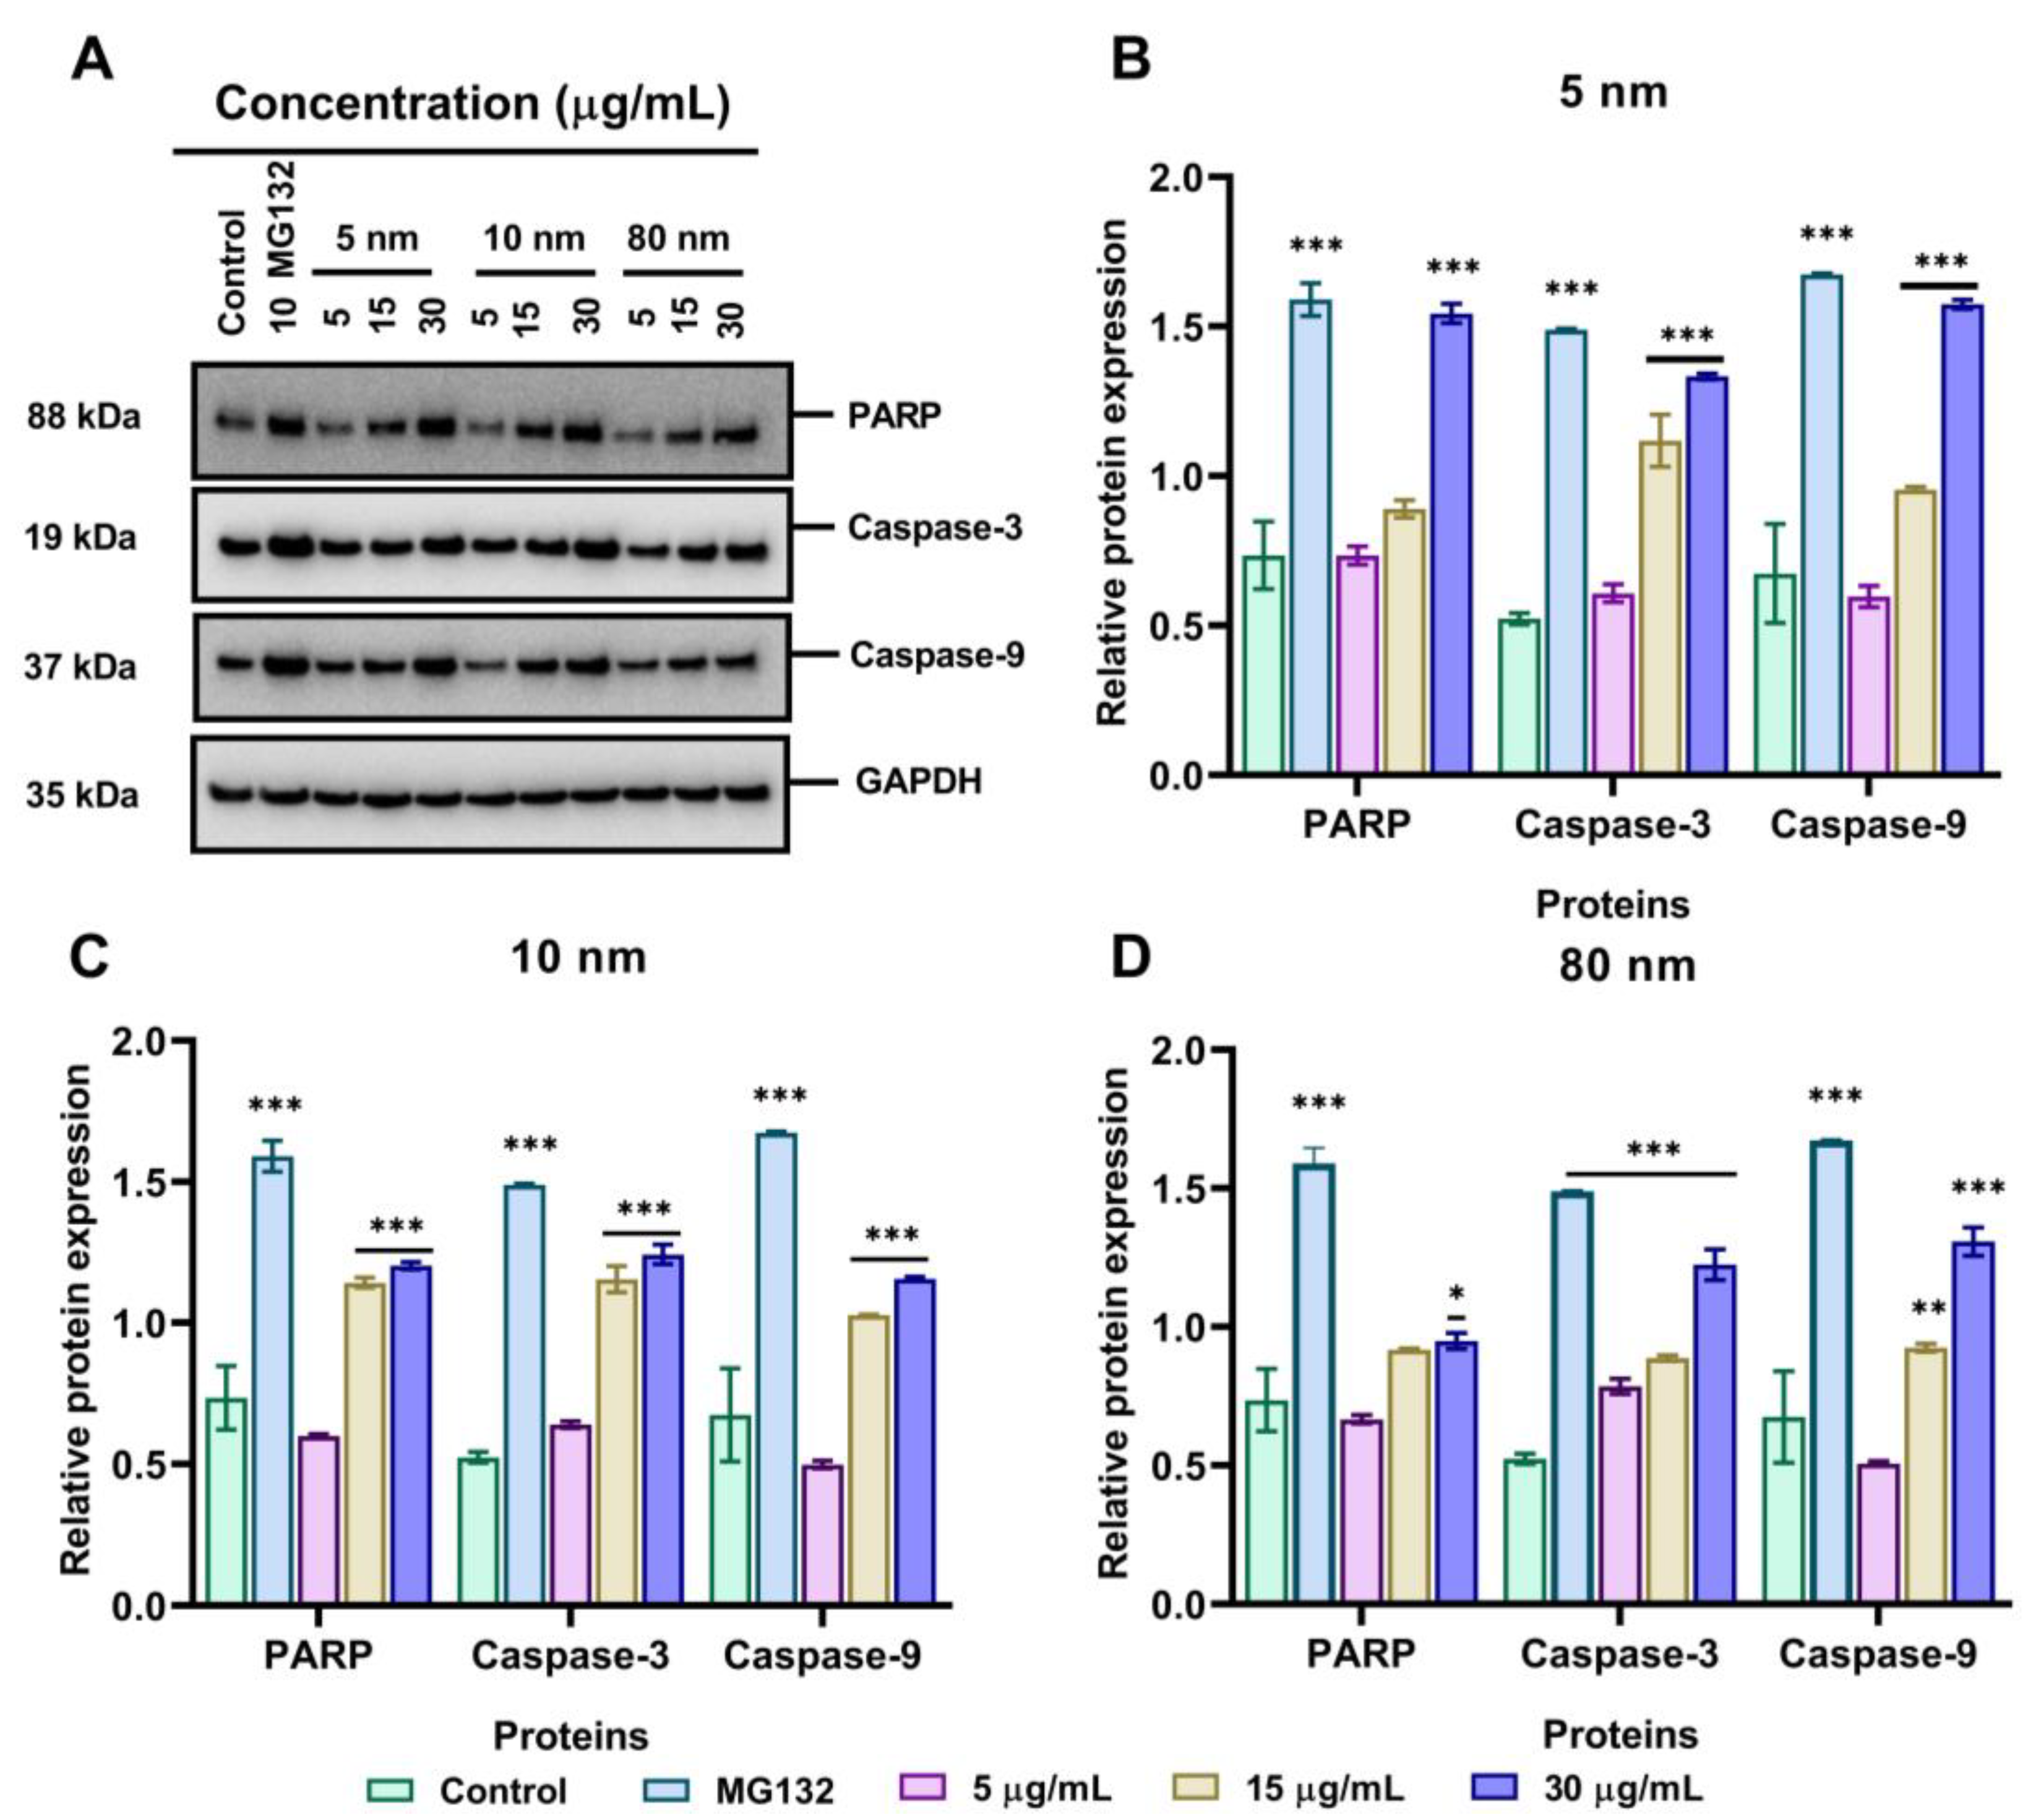
3.8. Effects of Different Sizes of AuNPs on the Expression Level of Apoptosis-Related Proteins
4. Discussion
5. Conclusions
Supplementary Materials
Author Contributions
Funding
Data Availability Statement
Acknowledgments
Conflicts of Interest
References
- Peng, J.; Liang, X. Progress in research on gold nanoparticles in cancer management. Medicine 2019, 98, e1531120192019-98. [Google Scholar]
- Vines, J.B.; Yoon, J.H.; Ryu, N.E.; Lim, D.J.; Park, H. Gold Nanoparticles for Photothermal Cancer Therapy. Front. Chem. 2019, 7, 167. [Google Scholar] [PubMed] [Green Version]
- Jain, S.; Hirst, D.G.; O’Sullivan, J.M. Gold nanoparticles as novel agents for cancer therapy. Br. J. Radiol. 2012, 85, 101–113. [Google Scholar] [CrossRef] [Green Version]
- Sztandera, K.; Gorzkiewicz, M.; Klajnert-Maculewicz, B. Gold Nanoparticles in Cancer Treatment. Mol. Pharm. 2019, 16, 1–23. [Google Scholar] [CrossRef] [PubMed]
- Kong, F.Y.; Zhang, J.W.; Li, R.F.; Wang, Z.X.; Wang, W.J.; Wang, W. Unique Roles of Gold Nanoparticles in Drug Delivery, Targeting and Imaging Applications. Molecules 2017, 22, 1445. [Google Scholar] [CrossRef] [PubMed] [Green Version]
- Singh, P.; Pandit, S.; Mokkapati, V.; Garg, A.; Ravikumar, V.; Mijakovic, I. Gold Nanoparticles in Diagnostics and Therapeutics for Human Cancer. Int. J. Mol. Sci. 2018, 19, 1979. [Google Scholar] [CrossRef]
- Abu-Dief, A.M.; Salaheldeen, M.; El-Dabea, T. Recent Advances in Development of Gold Nanoparticles for Drug Delivery Systems. J. Mod. Nanotechnol. 2021, 1. [Google Scholar] [CrossRef]
- Afzal, O.; Altamimi, A.S.A.; Nadeem, M.S.; Alzarea, S.I.; Almalki, W.H.; Tariq, A.; Mubeen, B.; Murtaza, B.N.; Iftikhar, S.; Riaz, N.; et al. Nanoparticles in Drug Delivery: From History to Therapeutic Applications. Nanomaterials 2022, 12, 4494. [Google Scholar] [CrossRef]
- Pradhan, D.; Biswasroy, P.; Goyal, A.; Ghosh, G.; Rath, G. Recent Advancement in Nanotechnology-Based Drug Delivery System Against Viral Infections. AAPS PharmSciTech. 2021, 22, 47. [Google Scholar] [CrossRef]
- Dykman, L.A. Gold nanoparticles for preparation of antibodies and vaccines against infectious diseases. Expert. Rev. Vaccines 2020, 19, 465–477. [Google Scholar] [CrossRef] [Green Version]
- Mateu Ferrando, R.; Lay, L.; Polito, L. Gold nanoparticle-based platforms for vaccine development. Drug. Discov. Today Technol. 2020, 38, 57–67. [Google Scholar] [CrossRef]
- Sportelli, M.C.; Izzi, M.; Kukushkina, E.A.; Hossain, S.I.; Picca, R.A.; Ditaranto, N.; Cioffi, N. Can Nanotechnology and Materials Science Help the Fight against SARS-CoV-2? Nanomaterials 2020, 10, 802. [Google Scholar] [CrossRef] [Green Version]
- Carnovale, C.; Bryant, G.; Shukla, R.; Bansal, V. Identifying Trends in Gold Nanoparticle Toxicity and Uptake: Size, Shape, Capping Ligand, and Biological Corona. ACS Omega 2019, 4, 242–256. [Google Scholar] [CrossRef] [Green Version]
- Sani, A.; Cao, C.; Cui, D. Toxicity of gold nanoparticles (AuNPs): A review. Biochem. Biophys. Rep. 2021, 26, 100991. [Google Scholar] [CrossRef] [PubMed]
- Alaqad, K.; Saleh, T.A. Gold and Silver Nanoparticles: Synthesis Methods, Characterization Routes and Applications towards Drugs. J. Environ. Anal. Toxicol. 2016, 6, 525–2161. [Google Scholar] [CrossRef]
- Alkilany, A.M.; Murphy, C.J. Toxicity and cellular uptake of gold nanoparticles: What we have learned so far? J. Nanopart. Res. 2010, 12, 2313–2333. [Google Scholar] [CrossRef] [Green Version]
- Chueh, P.J.; Liang, R.Y.; Lee, Y.H.; Zeng, Z.M.; Chuang, S.M. Differential cytotoxic effects of gold nanoparticles in different mammalian cell lines. J. Hazard. Mater. 2014, 264, 303–312. [Google Scholar] [CrossRef] [PubMed]
- Muthukumarasamyvel, T.; Rajendran, G.; Santhana Panneer, D.; Kasthuri, J.; Kathiravan, K.; Rajendiran, N. Role of Surface Hydrophobicity of Dicationic Amphiphile-Stabilized Gold Nanoparticles on A549 Lung Cancer Cells. ACS Omega 2017, 2, 3527–3538. [Google Scholar] [CrossRef] [PubMed] [Green Version]
- Zheng, Y.; Zhang, J.; Zhang, R.; Luo, Z.; Wang, C.; Shi, S. Gold nano particles synthesized from Magnolia officinalis and anticancer activity in A549 lung cancer cells. Artif. Cells. Nanomed. Biotechnol. 2019, 47, 3101–3109. [Google Scholar] [CrossRef] [PubMed] [Green Version]
- Ashokkumar, T.; Prabhu, D.; Geetha, R.; Govindaraju, K.; Manikandan, R.; Arulvasu, C.; Singaravelu, G. Apoptosis in liver cancer (HepG2) cells induced by functionalized gold nanoparticles. Colloids Surf. B Biointerfaces 2014, 123, 549–556. [Google Scholar] [CrossRef]
- Ramalingam, V.; Revathidevi, S.; Shanmuganayagam, T.; Muthulakshmi, L.; Rajaram, R. Biogenic gold nanoparticles induce cell cycle arrest through oxidative stress and sensitize mitochondrial membranes in A549 lung cancer cells. RSC Adv. 2016, 6, 20598–20608. [Google Scholar] [CrossRef]
- Prasad, A.; Khatua, A.; Mohanta, Y.K.; Saravanan, M.; Meena, R.; Ghosh, I. Low-dose exposure to phytosynthesized gold nanoparticles combined with glutamine deprivation enhances cell death in the cancer cell line HeLa via oxidative stress-mediated mitochondrial dysfunction and G0/G1 cell cycle arrest. Nanoscale 2022, 14, 10399–10417. [Google Scholar] [CrossRef] [PubMed]
- Oladimeji, O.; Akinyelu, J.; Daniels, A.; Singh, M. Modified Gold Nanoparticles for Efficient Delivery of Betulinic Acid to Cancer Cell Mitochondria. Int. J. Mol. Sci. 2021, 22, 5072. [Google Scholar] [CrossRef]
- Henson, J.C.; Brickell, A.; Kim, J.W.; Jensen, H.; Mehta, J.L.; Jensen, M. PEGylated Gold Nanoparticle Toxicity in Cardiomyocytes: Assessment of Size, Concentration, and Time Dependency. IEEE Trans. Nanobioscience 2022, 21, 387–394. [Google Scholar] [CrossRef]
- Llewellyn, S.V.; Parak, W.J.; Huhn, J.; Burgum, M.J.; Evans, S.J.; Chapman, K.E.; Jenkins, G.J.S.; Doak, S.H.; Clift, M.J.D. Deducing the cellular mechanisms associated with the potential genotoxic impact of gold and silver engineered nanoparticles upon different lung epithelial cell lines in vitro. Nanotoxicology 2022, 16, 52–72. [Google Scholar] [CrossRef]
- Talarska, P.; Boruczkowski, M.; Zurawski, J. Current Knowledge of Silver and Gold Nanoparticles in Laboratory Research-Application, Toxicity, Cellular Uptake. Nanomaterials 2021, 11, 2454. [Google Scholar] [CrossRef]
- Eldridge, A.G.; O’Brien, T. Therapeutic strategies within the ubiquitin proteasome system. Cell. Death. Differ. 2010, 17, 4–13. [Google Scholar] [CrossRef] [Green Version]
- Sha, Z.; Zhao, J.; Goldberg, A.L. Measuring the Overall Rate of Protein Breakdown in Cells and the Contributions of the Ubiquitin-Proteasome and Autophagy-Lysosomal Pathways. Methods Mol. Biol. 2018, 1844, 261–276. [Google Scholar] [CrossRef]
- Chen, X.; Yang, Q.; Xiao, L.; Tang, D.; Dou, Q.P.; Liu, J. Metal-based proteasomal deubiquitinase inhibitors as potential anticancer agents. Cancer Metastasis Rev. 2017, 36, 655–668. [Google Scholar] [CrossRef] [Green Version]
- Fang, S.; Weissman, A.M. A field guide to ubiquitylation. Cell. Mol. Life Sci. 2004, 61, 1546–1561. [Google Scholar] [CrossRef]
- Wang, M.; Zhang, Y.; Wang, T.; Zhang, J.; Zhou, Z.; Sun, Y.; Wang, S.; Shi, Y.; Luan, X.; Zhang, Y.; et al. The USP7 Inhibitor P5091 Induces Cell Death in Ovarian Cancers with Different P53 Status. Cell. Physiol. Biochem. 2017, 43, 1755–1766. [Google Scholar] [CrossRef] [PubMed]
- Cartel, M.; Mouchel, P.L.; Gotanegre, M.; David, L.; Bertoli, S.; Mansat-De Mas, V.; Besson, A.; Sarry, J.E.; Manenti, S.; Didier, C. Inhibition of ubiquitin-specific protease 7 sensitizes acute myeloid leukemia to chemotherapy. Leukemia 2021, 35, 417–432. [Google Scholar] [CrossRef]
- Zhao, C.; Chen, X.; Zang, D.; Lan, X.; Liao, S.; Yang, C.; Zhang, P.; Wu, J.; Li, X.; Liu, N.; et al. A novel nickel complex works as a proteasomal deubiquitinase inhibitor for cancer therapy. Oncogene 2016, 35, 5916–5927. [Google Scholar] [CrossRef] [PubMed]
- Das, T.; Shin, S.C.; Song, E.J.; Kim, E.E. Regulation of Deubiquitinating Enzymes by Post-Translational Modifications. Int. J. Mol. Sci. 2020, 21, 4028. [Google Scholar] [CrossRef] [PubMed]
- Ding, Y.; Chen, X.; Wang, B.; Yu, B.; Ge, J. Deubiquitinase inhibitor b-AP15 activates endoplasmic reticulum (ER) stress and inhibits Wnt/Notch1 signaling pathway leading to the reduction of cell survival in hepatocellular carcinoma cells. Eur. J. Pharmacol. 2018, 825, 10–18. [Google Scholar] [CrossRef]
- Huang, H.; Liu, N.; Liao, Y.; Liu, N.; Cai, J.; Xia, X.; Guo, Z.; Li, Y.; Wen, Q.; Yin, Q.; et al. Platinum-containing compound platinum pyrithione suppresses ovarian tumor proliferation through proteasome inhibition. J. Exp. Clin. Cancer Res. 2017, 36, 79. [Google Scholar] [CrossRef] [Green Version]
- Xia, X.; Liao, Y.; Guo, Z.; Li, Y.; Jiang, L.; Zhang, F.; Huang, C.; Liu, Y.; Wang, X.; Liu, N.; et al. Targeting proteasome-associated deubiquitinases as a novel strategy for the treatment of estrogen receptor-positive breast cancer. Oncogenesis 2018, 7, 75. [Google Scholar] [CrossRef] [Green Version]
- Crawford, L.J.; Walker, B.; Irvine, A.E. Proteasome inhibitors in cancer therapy. J. Cell. Commun. Signal. 2011, 5, 101–110. [Google Scholar] [CrossRef] [Green Version]
- Jurisic, V.; Radenkovic, S.; Konjevic, G. The Actual Role of LDH as Tumor Marker, Biochemical and Clinical Aspects. Adv. Exp. Med. Biol. 2015, 867, 115–124. [Google Scholar] [CrossRef]
- Zucker, R.M.; Daniel, K.M.; Massaro, E.J.; Karafas, S.J.; Degn, L.L.; Boyes, W.K. Detection of silver nanoparticles in cells by flow cytometry using light scatter and far-red fluorescence. Cytom. A 2013, 83, 962–972. [Google Scholar]
- Ali-Boucetta, H.; Al-Jamal, K.T.; Müller, K.H.; Li, S.; Porter, A.E.; Eddaoudi, A.; Prato, M.; Bianco, A.; Kostarelos, K. Cellular uptake and cytotoxic impact of chemically functionalized and polymer-coated carbon nanotubes. Small 2011, 7, 3230–3238. [Google Scholar] [CrossRef] [PubMed]
- Wu, Y.; Ali, M.R.K.; Dansby, K.; El-Sayed, M.A. Improving the Flow Cytometry-based Detection of the Cellular Uptake of Gold Nanoparticles. Anal. Chem. 2019, 91, 14261–14267. [Google Scholar] [CrossRef]
- Ivanov, M.R.; Bednar, H.R.; Haes, A.J. Investigations of the mechanism of gold nanoparticle stability and surface functionalization in capillary electrophoresis. Acs. Nano. 2009, 3, 386–394. [Google Scholar] [CrossRef] [Green Version]
- Kuhn, D.A.; Vanhecke, D.; Michen, B.; Blank, F.; Gehr, P.; Petri-Fink, A.; Rothen-Rutishauser, B. Different endocytotic uptake mechanisms for nanoparticles in epithelial cells and macrophages. Beilstein J Nanotechnol. 2014, 5, 1625–1636. [Google Scholar] [CrossRef] [PubMed] [Green Version]
- Liu, Z.; Wu, Y.; Guo, Z.; Liu, Y.; Shen, Y.; Zhou, P.; Lu, X. Effects of internalized gold nanoparticles with respect to cytotoxicity and invasion activity in lung cancer cells. PLoS ONE 2014, 9, e9917520142014-9. [Google Scholar]
- Subtil, A.; Gaidarov, I.; Kobylarz, K.; Lampson, M.A.; Keen, J.H.; McGraw, T.E. Acute cholesterol depletion inhibits clathrin-coated pit budding. Proc. Natl. Acad. Sci. USA 1999, 96, 6775–6780. [Google Scholar] [CrossRef] [Green Version]
- Ray, P.D.; Huang, B.W.; Tsuji, Y. Reactive oxygen species (ROS) homeostasis and redox regulation in cellular signaling. Cell. Signal. 2012, 24, 981–990. [Google Scholar] [CrossRef] [Green Version]
- Enea, M.; Pereira, E.; de Almeida, M.P.; Araujo, A.M.; de Lourdes Bastos, M.; Carmo, H. Gold Nanoparticles Induce Oxidative Stress and Apoptosis in Human Kidney Cells. Nanomaterials 2020, 10, 995. [Google Scholar] [CrossRef]
- Yang, J.; Meng, C.; Weisberg, E.; Case, A.; Lamberto, I.; Magin, R.S.; Adamia, S.; Wang, J.; Gray, N.; Liu, S.; et al. Inhibition of the deubiquitinase USP10 induces degradation of SYK. Br. J. Cancer 2020, 122, 1175–1184. [Google Scholar] [CrossRef]
- Harrigan, J.A.; Jacq, X.; Martin, N.M.; Jackson, S.P. Deubiquitylating enzymes and drug discovery: Emerging opportunities. Nat. Rev. Drug. Discov. 2018, 17, 57–78. [Google Scholar] [CrossRef]
- Dreaden, E.C.; Alkilany, A.M.; Huang, X.; Murphy, C.J.; El-Sayed, M.A. The golden age: Gold nanoparticles for biomedicine. Chem. Soc. Rev. 2012, 41, 2740–2779. [Google Scholar] [CrossRef] [PubMed] [Green Version]
- Yang, X.; Yang, M.; Pang, B.; Vara, M.; Xia, Y. Gold Nanomaterials at Work in Biomedicine. Chem. Rev. 2015, 115, 10410–10488. [Google Scholar] [CrossRef] [PubMed]
- Falagan-Lotsch, P.; Grzincic, E.M.; Murphy, C.J. One low-dose exposure of gold nanoparticles induces long-term changes in human cells. Proc. Natl. Acad. Sci. USA 2016, 113, 13318–13323. [Google Scholar] [CrossRef]
- Lima, T.; Bernfur, K.; Vilanova, M.; Cedervall, T. Understanding the Lipid and Protein Corona Formation on Different Sized Polymeric Nanoparticles. Sci. Rep. 2020, 10, 1129. [Google Scholar] [CrossRef] [PubMed] [Green Version]
- Sabuncu, A.C.; Grubbs, J.; Qian, S.; Abdel-Fattah, T.M.; Stacey, M.W.; Beskok, A. Probing nanoparticle interactions in cell culture media. Colloids Surf. B Biointerfaces 2012, 95, 96–102. [Google Scholar] [CrossRef] [PubMed] [Green Version]
- Kumar, D.; Mutreja, I.; Chitcholtan, K.; Sykes, P. Cytotoxicity and cellular uptake of different sized gold nanoparticles in ovarian cancer cells. Nanotechnology 2017, 28, 475101. [Google Scholar] [CrossRef]
- Senut, M.C.; Zhang, Y.; Liu, F.; Sen, A.; Ruden, D.M.; Mao, G. Size-Dependent Toxicity of Gold Nanoparticles on Human Embryonic Stem Cells and Their Neural Derivatives. Small 2016, 12, 631–646. [Google Scholar] [CrossRef] [Green Version]
- Avalos, A.; Haza, A.I.; Mateo, D.; Morales, P. Effects of silver and gold nanoparticles of different sizes in human pulmonary fibroblasts. Toxicol. Mech. Methods 2015, 25, 287–295. [Google Scholar] [CrossRef]
- Pan, Y.; Leifert, A.; Ruau, D.; Neuss, S.; Bornemann, J.; Schmid, G.; Brandau, W.; Simon, U.; Jahnen-Dechent, W. Gold nanoparticles of diameter 1.4 nm trigger necrosis by oxidative stress and mitochondrial damage. Small 2009, 5, 2067–2076. [Google Scholar] [CrossRef]
- Augustine, R.; Hasan, A.; Primavera, R.; Wilson, R.J.; Thakor, A.S.; Kevadiya, B.D. Cellular uptake and retention of nanoparticles: Insights on particle properties and interaction with cellular components. Mater. Today Commun. 2020, 25, 101692. [Google Scholar] [CrossRef]
- Engstrom, A.M.; Faase, R.A.; Marquart, G.W.; Baio, J.E.; Mackiewicz, M.R.; Harper, S.L. Size-Dependent Interactions of Lipid-Coated Gold Nanoparticles: Developing a Better Mechanistic Understanding Through Model Cell Membranes and in vivo Toxicity. Int. J. Nanomed. 2020, 15, 4091–4104. [Google Scholar] [CrossRef] [PubMed]
- Lee, Y.J.; Ahn, E.Y.; Park, Y. Shape-dependent cytotoxicity and cellular uptake of gold nanoparticles synthesized using green tea extract. Nanoscale Res. Lett. 2019, 14, 129. [Google Scholar] [CrossRef] [PubMed] [Green Version]
- Chithrani, B.D.; Ghazani, A.A.; Chan, W.C. Determining the size and shape dependence of gold nanoparticle uptake into mammalian cells. Nano. Lett. 2006, 6, 662–668. [Google Scholar] [CrossRef] [PubMed]
- Foroozandeh, P.; Aziz, A.A. Insight into Cellular Uptake and Intracellular Trafficking of Nanoparticles. Nanoscale Res. Lett. 2018, 13, 339. [Google Scholar] [CrossRef] [PubMed] [Green Version]
- Uboldi, C.; Bonacchi, D.; Lorenzi, G.; Hermanns, M.I.; Pohl, C.; Baldi, G.; Unger, R.E.; Kirkpatrick, C.J. Gold nanoparticles induce cytotoxicity in the alveolar type-II cell lines A549 and NCIH441. Part. Fibre. Toxicol. 2009, 6, 18. [Google Scholar] [CrossRef] [PubMed] [Green Version]
- Xie, X.; Liao, J.; Shao, X.; Li, Q.; Lin, Y. The Effect of shape on Cellular Uptake of Gold Nanoparticles in the forms of Stars, Rods, and Triangles. Sci. Rep. 2017, 7, 3827. [Google Scholar] [CrossRef] [PubMed] [Green Version]
- Martinez-Torres, A.C.; Lorenzo-Anota, H.Y.; Garcia-Juarez, M.G.; Zarate-Trivino, D.G.; Rodriguez-Padilla, C. Chitosan gold nanoparticles induce different ROS-dependent cell death modalities in leukemic cells. Int. J. Nanomed. 2019, 14, 7173–7190. [Google Scholar] [CrossRef] [Green Version]
- Schlinkert, P.; Casals, E.; Boyles, M.; Tischler, U.; Hornig, E.; Tran, N.; Zhao, J.; Himly, M.; Riediker, M.; Oostingh, G.J.; et al. The oxidative potential of differently charged silver and gold nanoparticles on three human lung epithelial cell types. J. Nanobiotechnology 2015, 13, 1. [Google Scholar] [CrossRef] [Green Version]
- Mohammadinejad, R.; Moosavi, M.A.; Tavakol, S.; Vardar, D.O.; Hosseini, A.; Rahmati, M.; Dini, L.; Hussain, S.; Mandegary, A.; Klionsky, D.J. Necrotic, apoptotic and autophagic cell fates triggered by nanoparticles. Autophagy 2019, 15, 4–33. [Google Scholar] [CrossRef] [Green Version]
- Sun, H.; Jia, J.; Jiang, C.; Zhai, S. Gold Nanoparticle-Induced Cell Death and Potential Applications in Nanomedicine. Int. J. Mol. Sci. 2018, 19, 754. [Google Scholar] [CrossRef] [Green Version]
- Xia, Q.; Huang, J.; Feng, Q.; Chen, X.; Liu, X.; Li, X.; Zhang, T.; Xiao, S.; Li, H.; Zhong, Z.; et al. Size- and cell type-dependent cellular uptake, cytotoxicity and in vivo distribution of gold nanoparticles. Int. J. Nanomed. 2019, 14, 6957–6970. [Google Scholar] [CrossRef] [Green Version]
- Cardoso, F.; Ross, J.S.; Picart, M.J.; Sotiriou, C.; Durbecq, V. Targeting the ubiquitin-proteasome pathway in breast cancer. Clin. Breast. Cancer 2004, 5, 148–157. [Google Scholar] [CrossRef]
- Chen, X.; Yang, Q.; Chen, J.; Zhang, P.; Huang, Q.; Zhang, X.; Yang, L.; Xu, D.; Zhao, C.; Wang, X.; et al. Inhibition of Proteasomal Deubiquitinase by Silver Complex Induces Apoptosis in Non-Small Cell Lung Cancer Cells. Cell. Physiol. Biochem. 2018, 49, 780–797. [Google Scholar] [CrossRef]
- Dang, L.; Wen, F.; Yang, Y.; Liu, D.; Wu, K.; Qi, Y.; Li, X.; Zhao, J.; Zhu, D.; Zhang, C.; et al. Proteasome inhibitor MG132 inhibits the proliferation and promotes the cisplatin-induced apoptosis of human esophageal squamous cell carcinoma cells. Int. J. Mol. Med. 2014, 33, 1083–1088. [Google Scholar] [CrossRef] [PubMed] [Green Version]
- Guo, N.; Peng, Z. MG132, a proteasome inhibitor, induces apoptosis in tumor cells. Asia Pac. J. Clin. Oncol. 2013, 9, 6–11. [Google Scholar] [CrossRef] [PubMed]
- Jayaweera, S.P.E.; Wanigasinghe Kanakanamge, S.P.; Rajalingam, D.; Silva, G.N. Carfilzomib: A Promising Proteasome Inhibitor for the Treatment of Relapsed and Refractory Multiple Myeloma. Front. Oncol. 2021, 11, 740796. [Google Scholar] [CrossRef] [PubMed]
- Wu, J.; Xie, H. Effects of titanium dioxide nanoparticles on alpha-synuclein aggregation and the ubiquitin-proteasome system in dopaminergic neurons. Artif. Cells. Nanomed. Biotechnol. 2016, 44, 690–694. [Google Scholar] [CrossRef]
- Khan, O.M.; Almagro, J.; Nelson, J.K.; Horswell, S.; Encheva, V.; Keyan, K.S.; Clurman, B.E.; Snijders, A.P.; Behrens, A. Proteasomal degradation of the tumour suppressor FBW7 requires branched ubiquitylation by TRIP12. Nat. Commun. 2021, 12, 2043. [Google Scholar] [CrossRef]
- Pandit, B.; Gartel, A.L. Proteasome inhibitors induce p53-independent apoptosis in human cancer cells. Am. J. Pathol. 2011, 178, 355–360. [Google Scholar] [CrossRef]
- Di Bucchianico, S.; Fabbrizi, M.R.; Cirillo, S.; Uboldi, C.; Gilliland, D.; Valsami-Jones, E.; Migliore, L. Aneuploidogenic effects and DNA oxidation induced in vitro by differently sized gold nanoparticles. Int. J. Nanomed. 2014, 9, 2191–2204. [Google Scholar] [CrossRef] [Green Version]
- Ramalingam, V.; Revathidevi, S.; Shanmuganayagam, T.S.; Muthulakshmi, L.; Rajaram, R. Gold nanoparticle induces mitochondria-mediated apoptosis and cell cycle arrest in nonsmall cell lung cancer cells. Gold. Bulletin. 2017, 50, 177–189. [Google Scholar] [CrossRef]
- Jawaid, P.; Rehman, M.U.; Zhao, Q.L.; Misawa, M.; Ishikawa, K.; Hori, M.; Shimizu, T.; Saitoh, J.I.; Noguchi, K.; Kondo, T. Small size gold nanoparticles enhance apoptosis-induced by cold atmospheric plasma via depletion of intracellular GSH and modification of oxidative stress. Cell. Death Discov. 2020, 6, 83. [Google Scholar] [CrossRef] [PubMed]


Disclaimer/Publisher’s Note: The statements, opinions and data contained in all publications are solely those of the individual author(s) and contributor(s) and not of MDPI and/or the editor(s). MDPI and/or the editor(s) disclaim responsibility for any injury to people or property resulting from any ideas, methods, instructions or products referred to in the content. |
© 2023 by the authors. Licensee MDPI, Basel, Switzerland. This article is an open access article distributed under the terms and conditions of the Creative Commons Attribution (CC BY) license (https://creativecommons.org/licenses/by/4.0/).
Share and Cite
Ibrahim, B.; Akere, T.H.; Chakraborty, S.; Valsami-Jones, E.; Ali-Boucetta, H. Gold Nanoparticles Induced Size Dependent Cytotoxicity on Human Alveolar Adenocarcinoma Cells by Inhibiting the Ubiquitin Proteasome System. Pharmaceutics 2023, 15, 432. https://doi.org/10.3390/pharmaceutics15020432
Ibrahim B, Akere TH, Chakraborty S, Valsami-Jones E, Ali-Boucetta H. Gold Nanoparticles Induced Size Dependent Cytotoxicity on Human Alveolar Adenocarcinoma Cells by Inhibiting the Ubiquitin Proteasome System. Pharmaceutics. 2023; 15(2):432. https://doi.org/10.3390/pharmaceutics15020432
Chicago/Turabian StyleIbrahim, Bashiru, Taiwo Hassan Akere, Swaroop Chakraborty, Eugenia Valsami-Jones, and Hanene Ali-Boucetta. 2023. "Gold Nanoparticles Induced Size Dependent Cytotoxicity on Human Alveolar Adenocarcinoma Cells by Inhibiting the Ubiquitin Proteasome System" Pharmaceutics 15, no. 2: 432. https://doi.org/10.3390/pharmaceutics15020432