
Parent-Metabolite Pharmacokinetic Modeling of Formononetin and Its Active Metabolites in Rats after Oral Administration of Formononetin Formulations


Abstract
:1. Introduction
2. Materials and Methods
2.1. Chemicals and Reagents
2.2. Animal Study Design
2.3. Analytical Methodology
2.4. Plasma Protein Binding Assay
2.5. Pharmacokinetic Evazluation and Model Development
2.6. Statistical Analysis
3. Results and Discussion
3.1. Analytical Method Validation
3.2. Plasma Protein Binding Assay Result
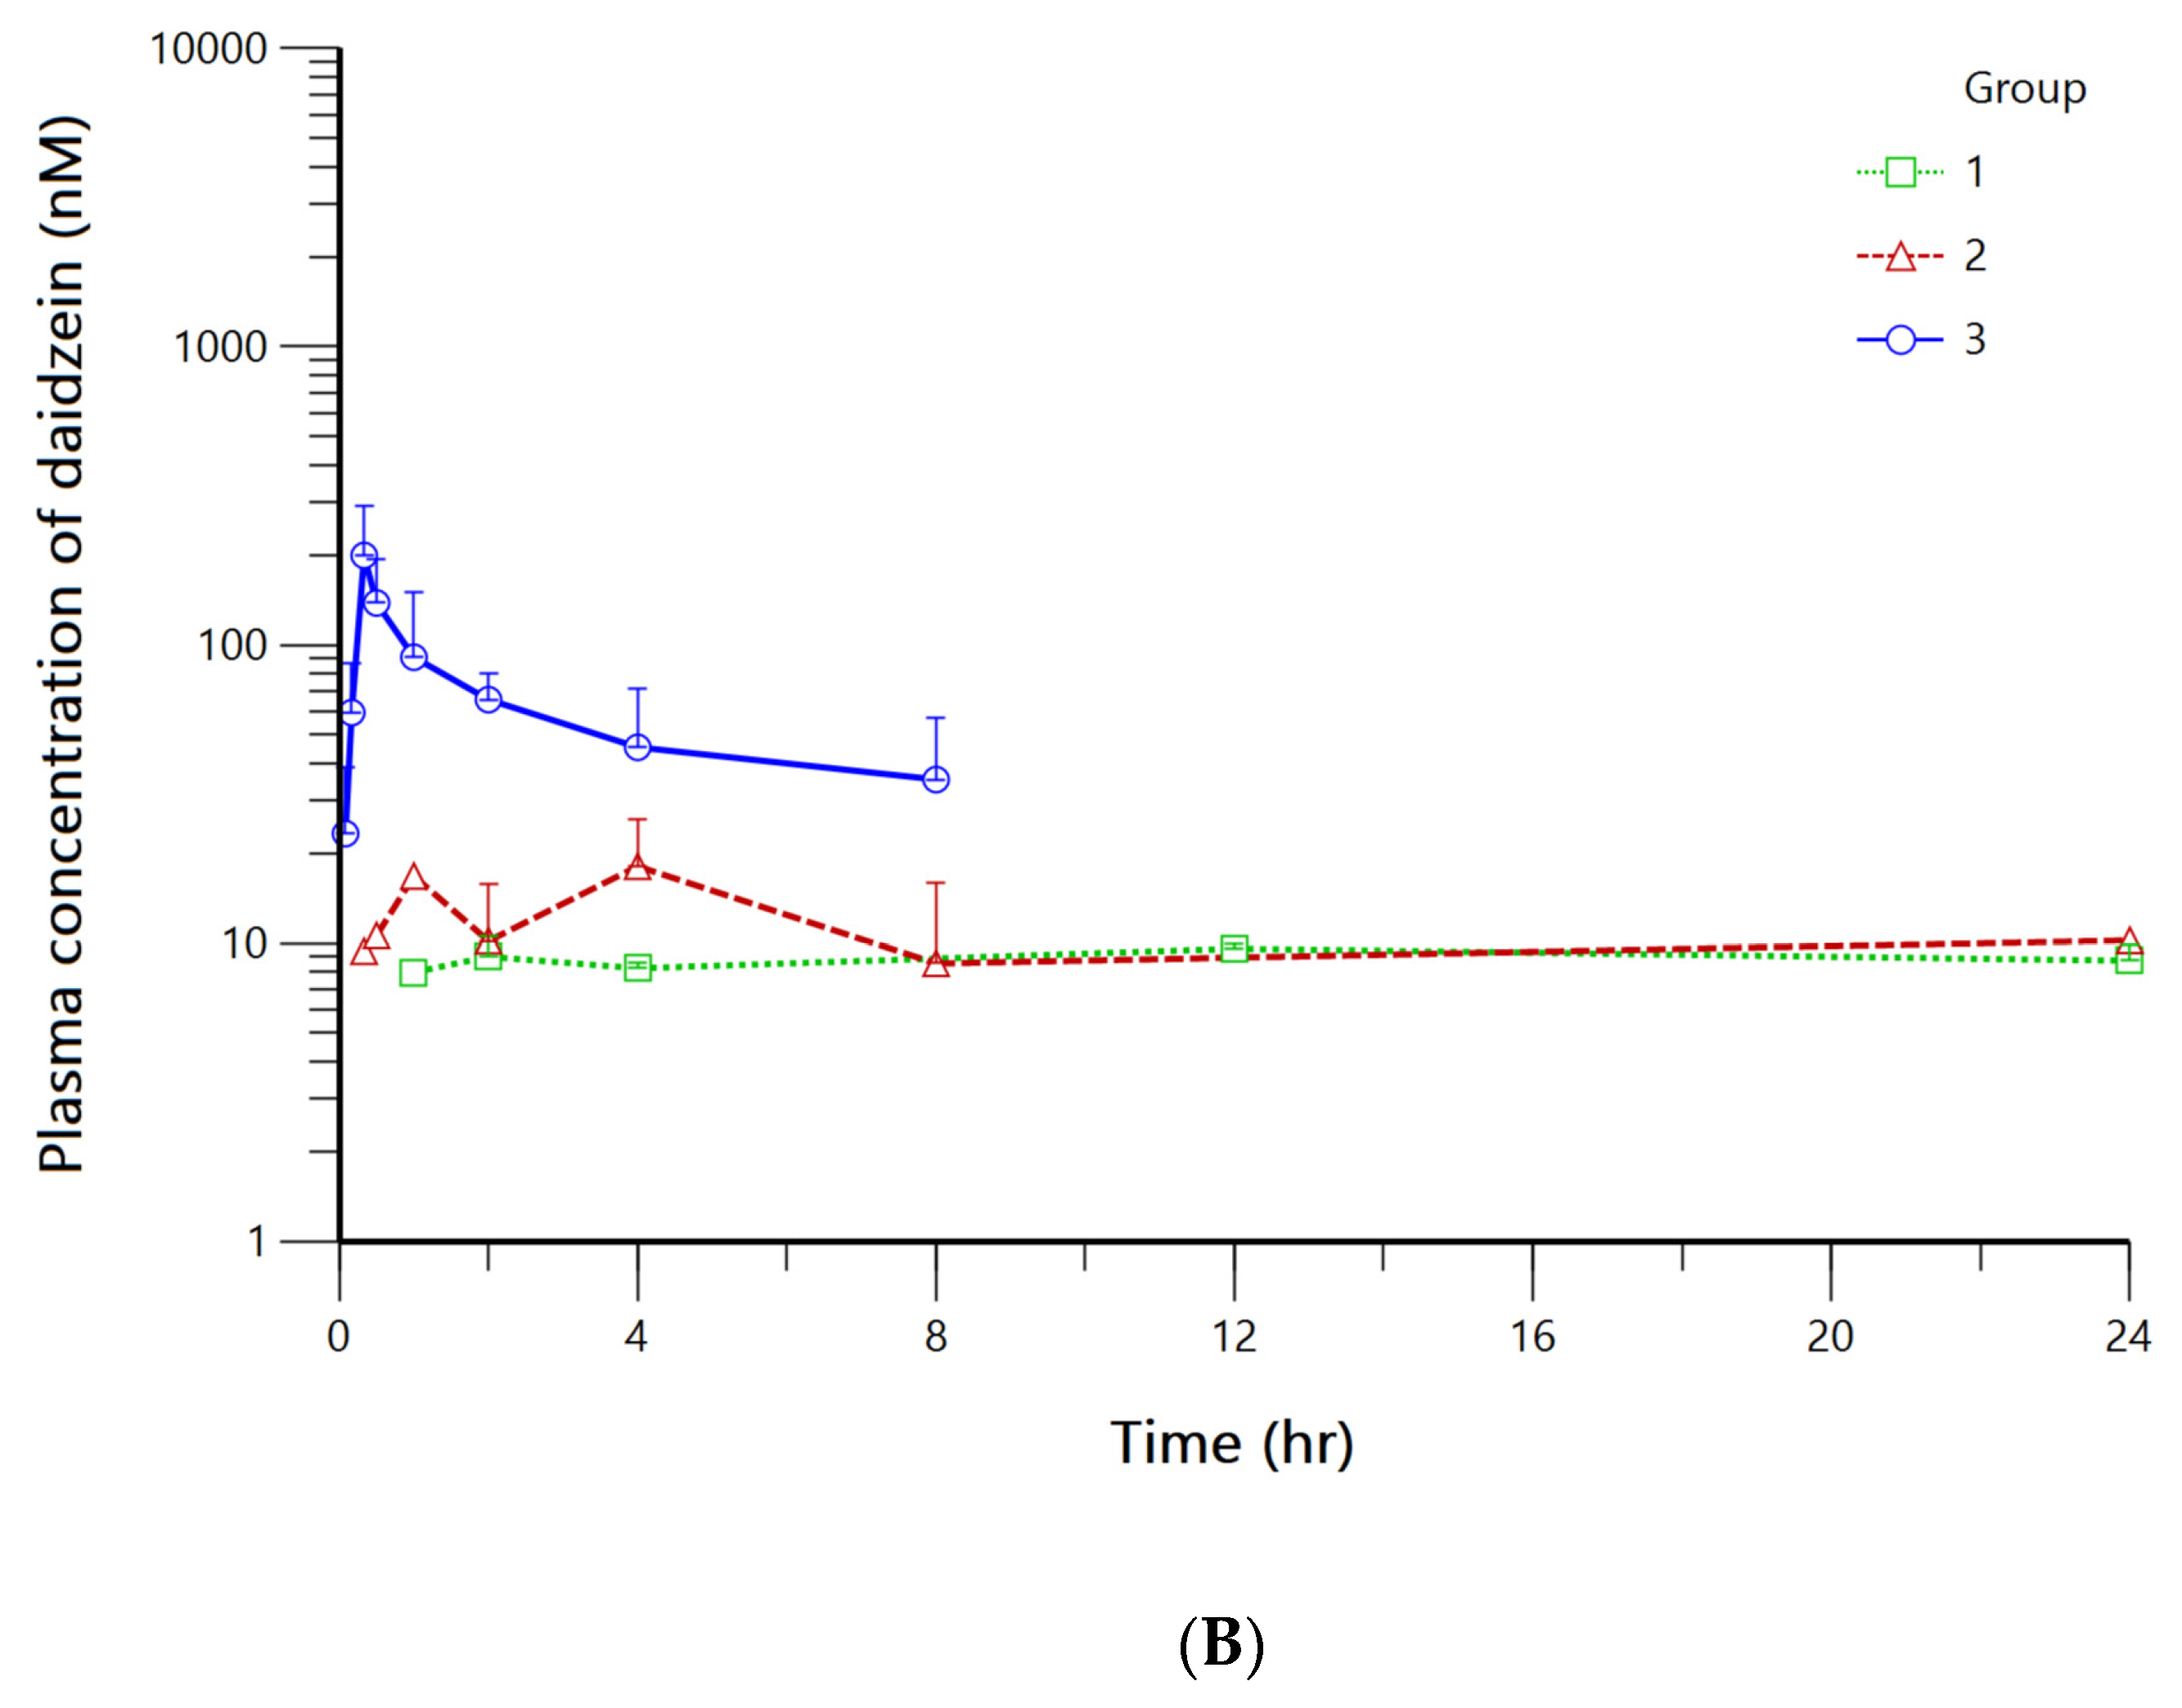
3.3. Pharmacokinetic Evaluation of FMN and Its Metabolites
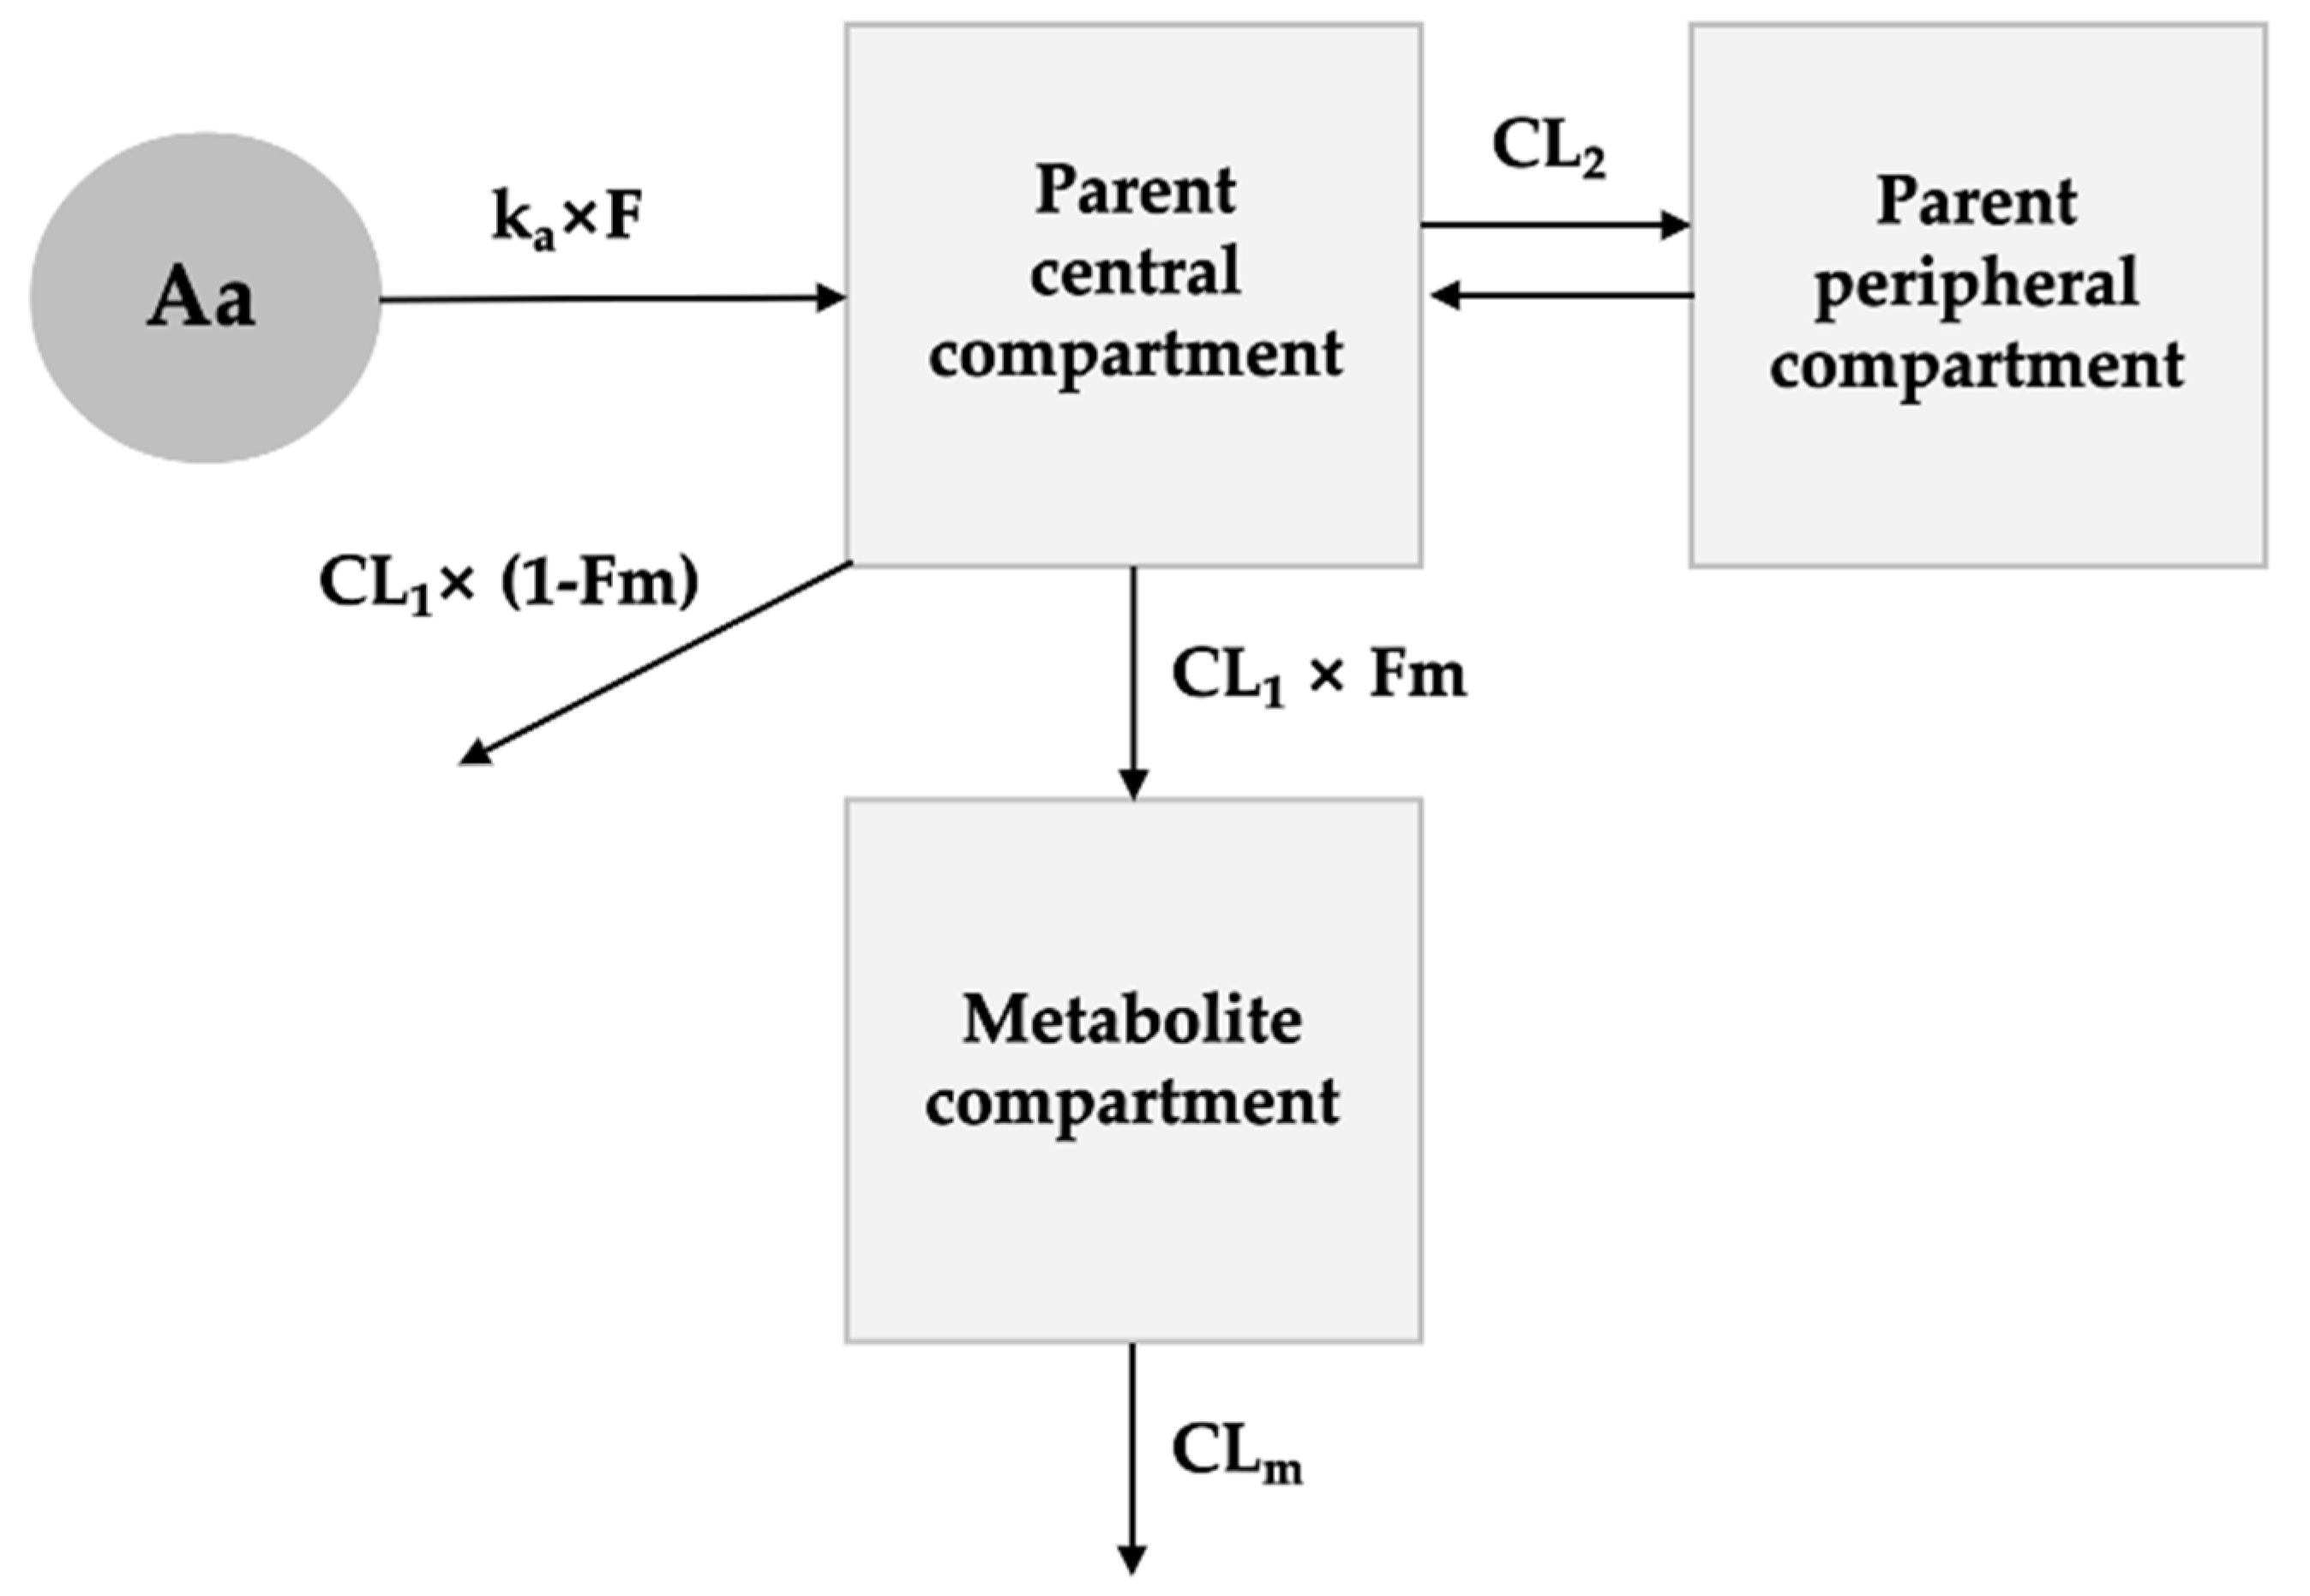
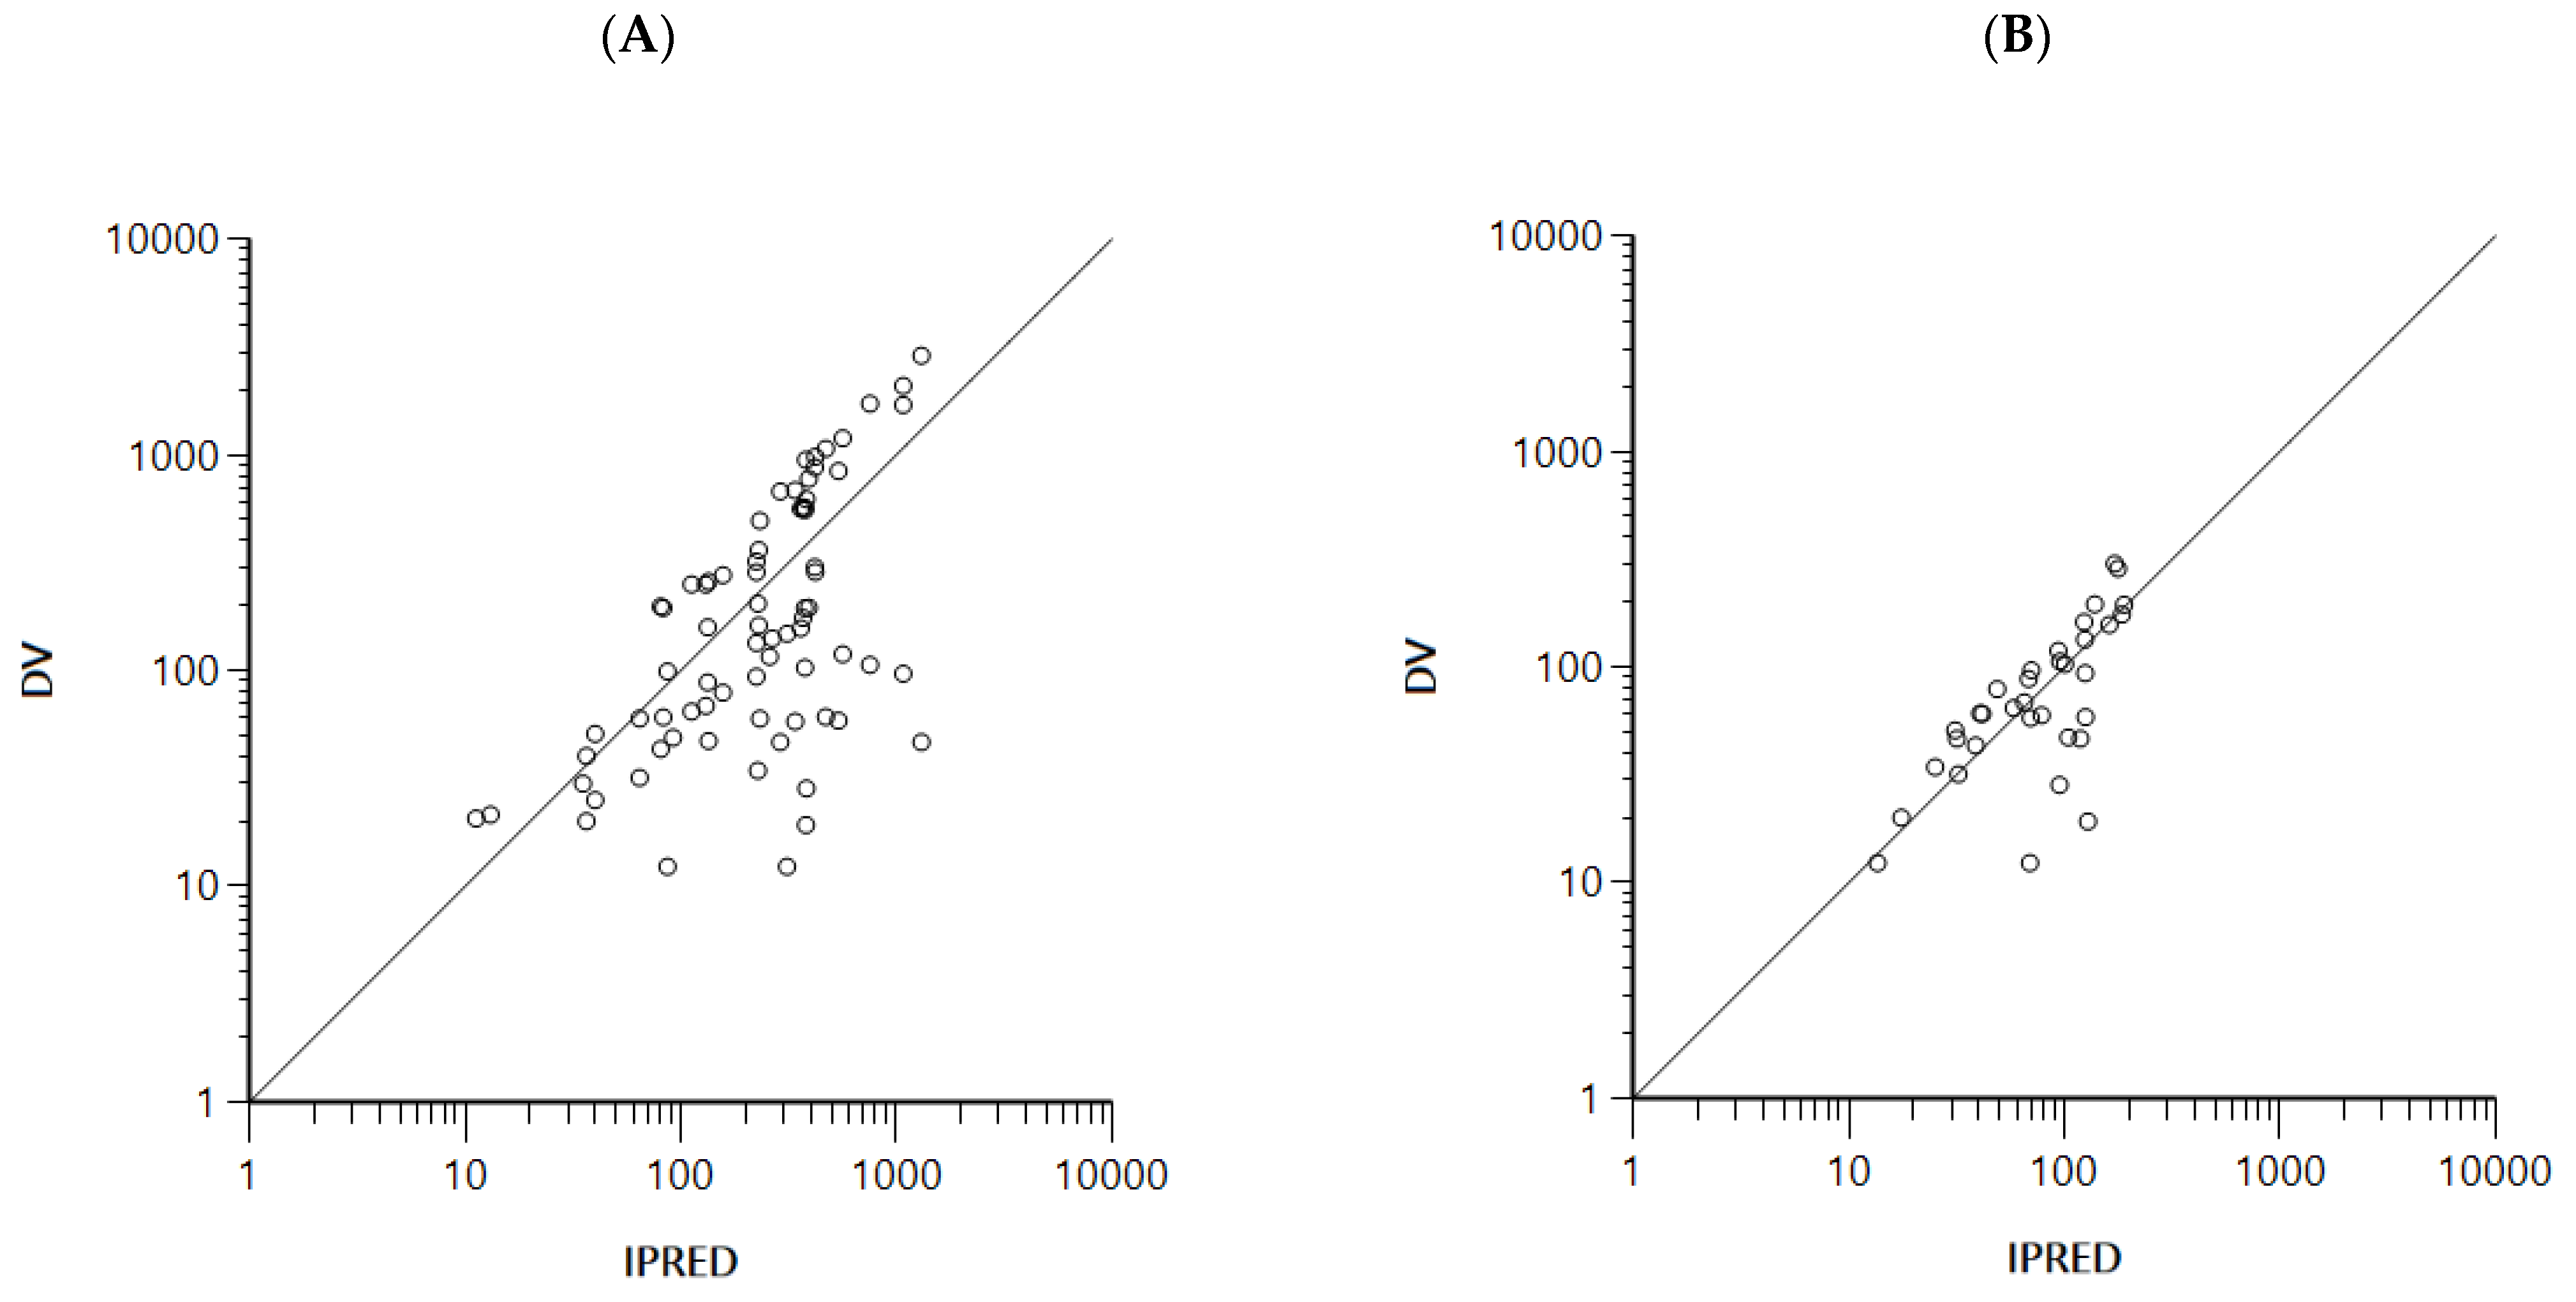
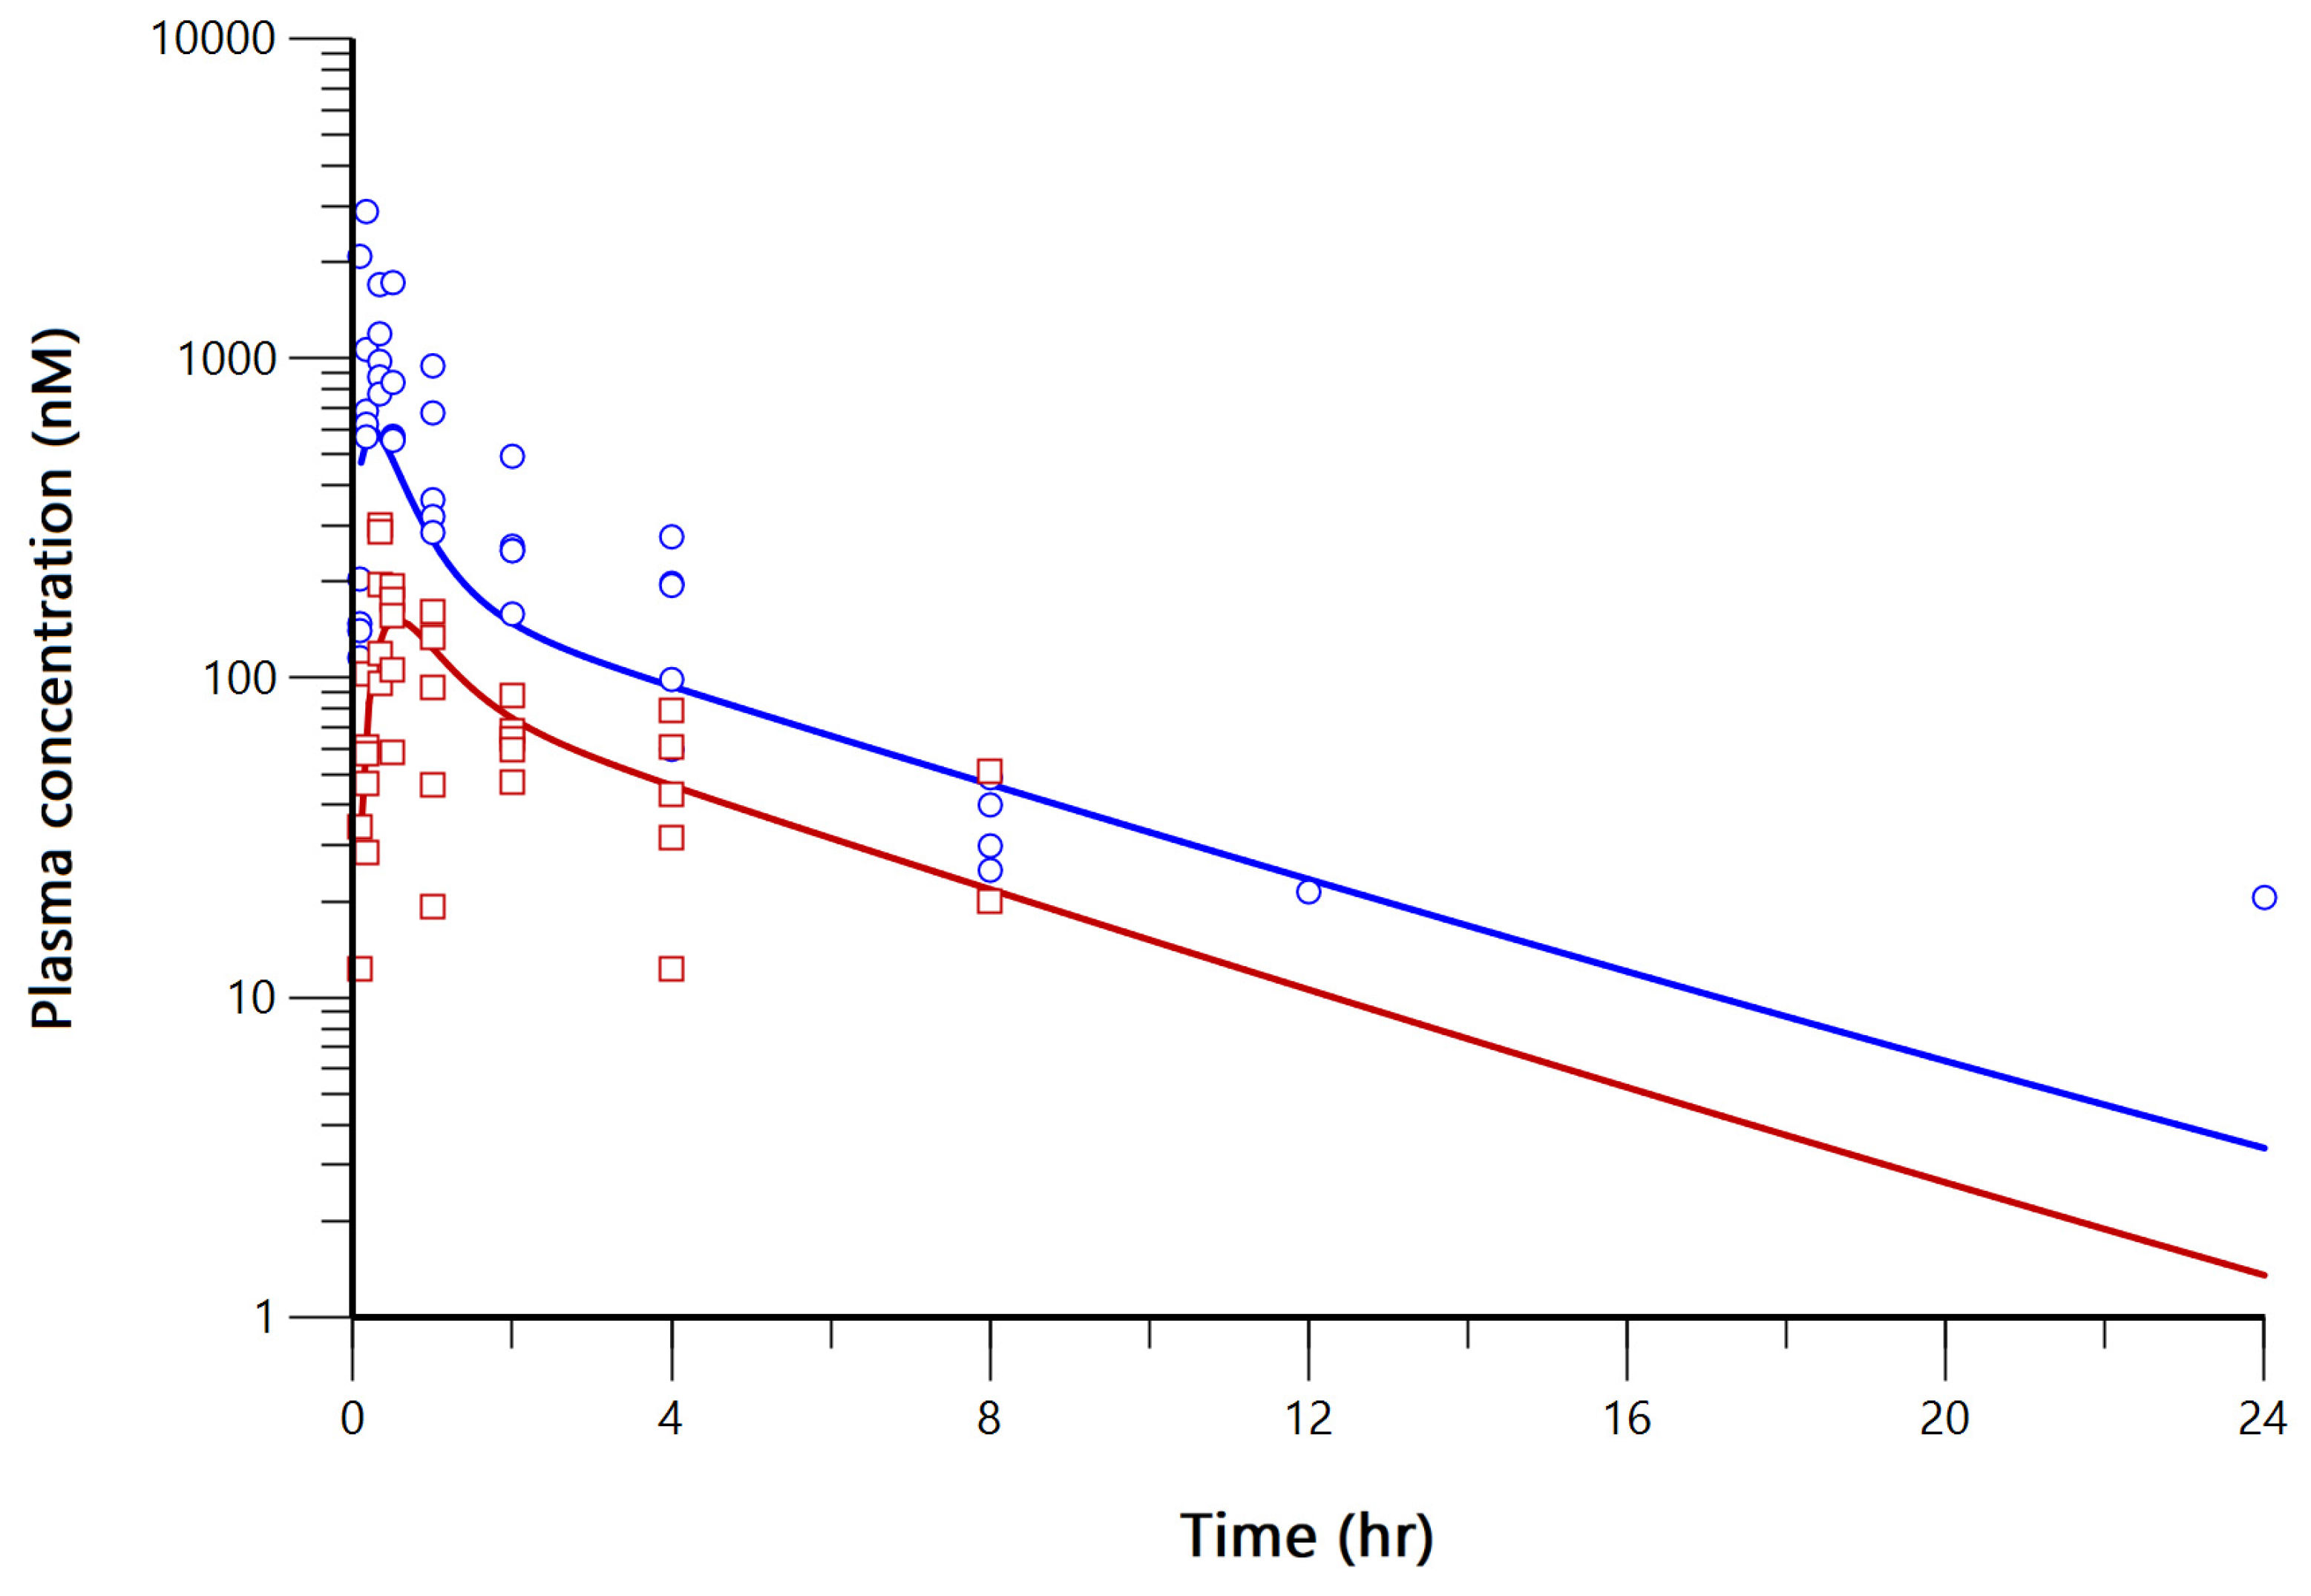
3.4. Parent-Metabolite PK Model Devleopment
4. Conclusions
Author Contributions
Funding
Institutional Review Board Statement
Informed Consent Statement
Data Availability Statement
Acknowledgments
Conflicts of Interest
Abbreviations
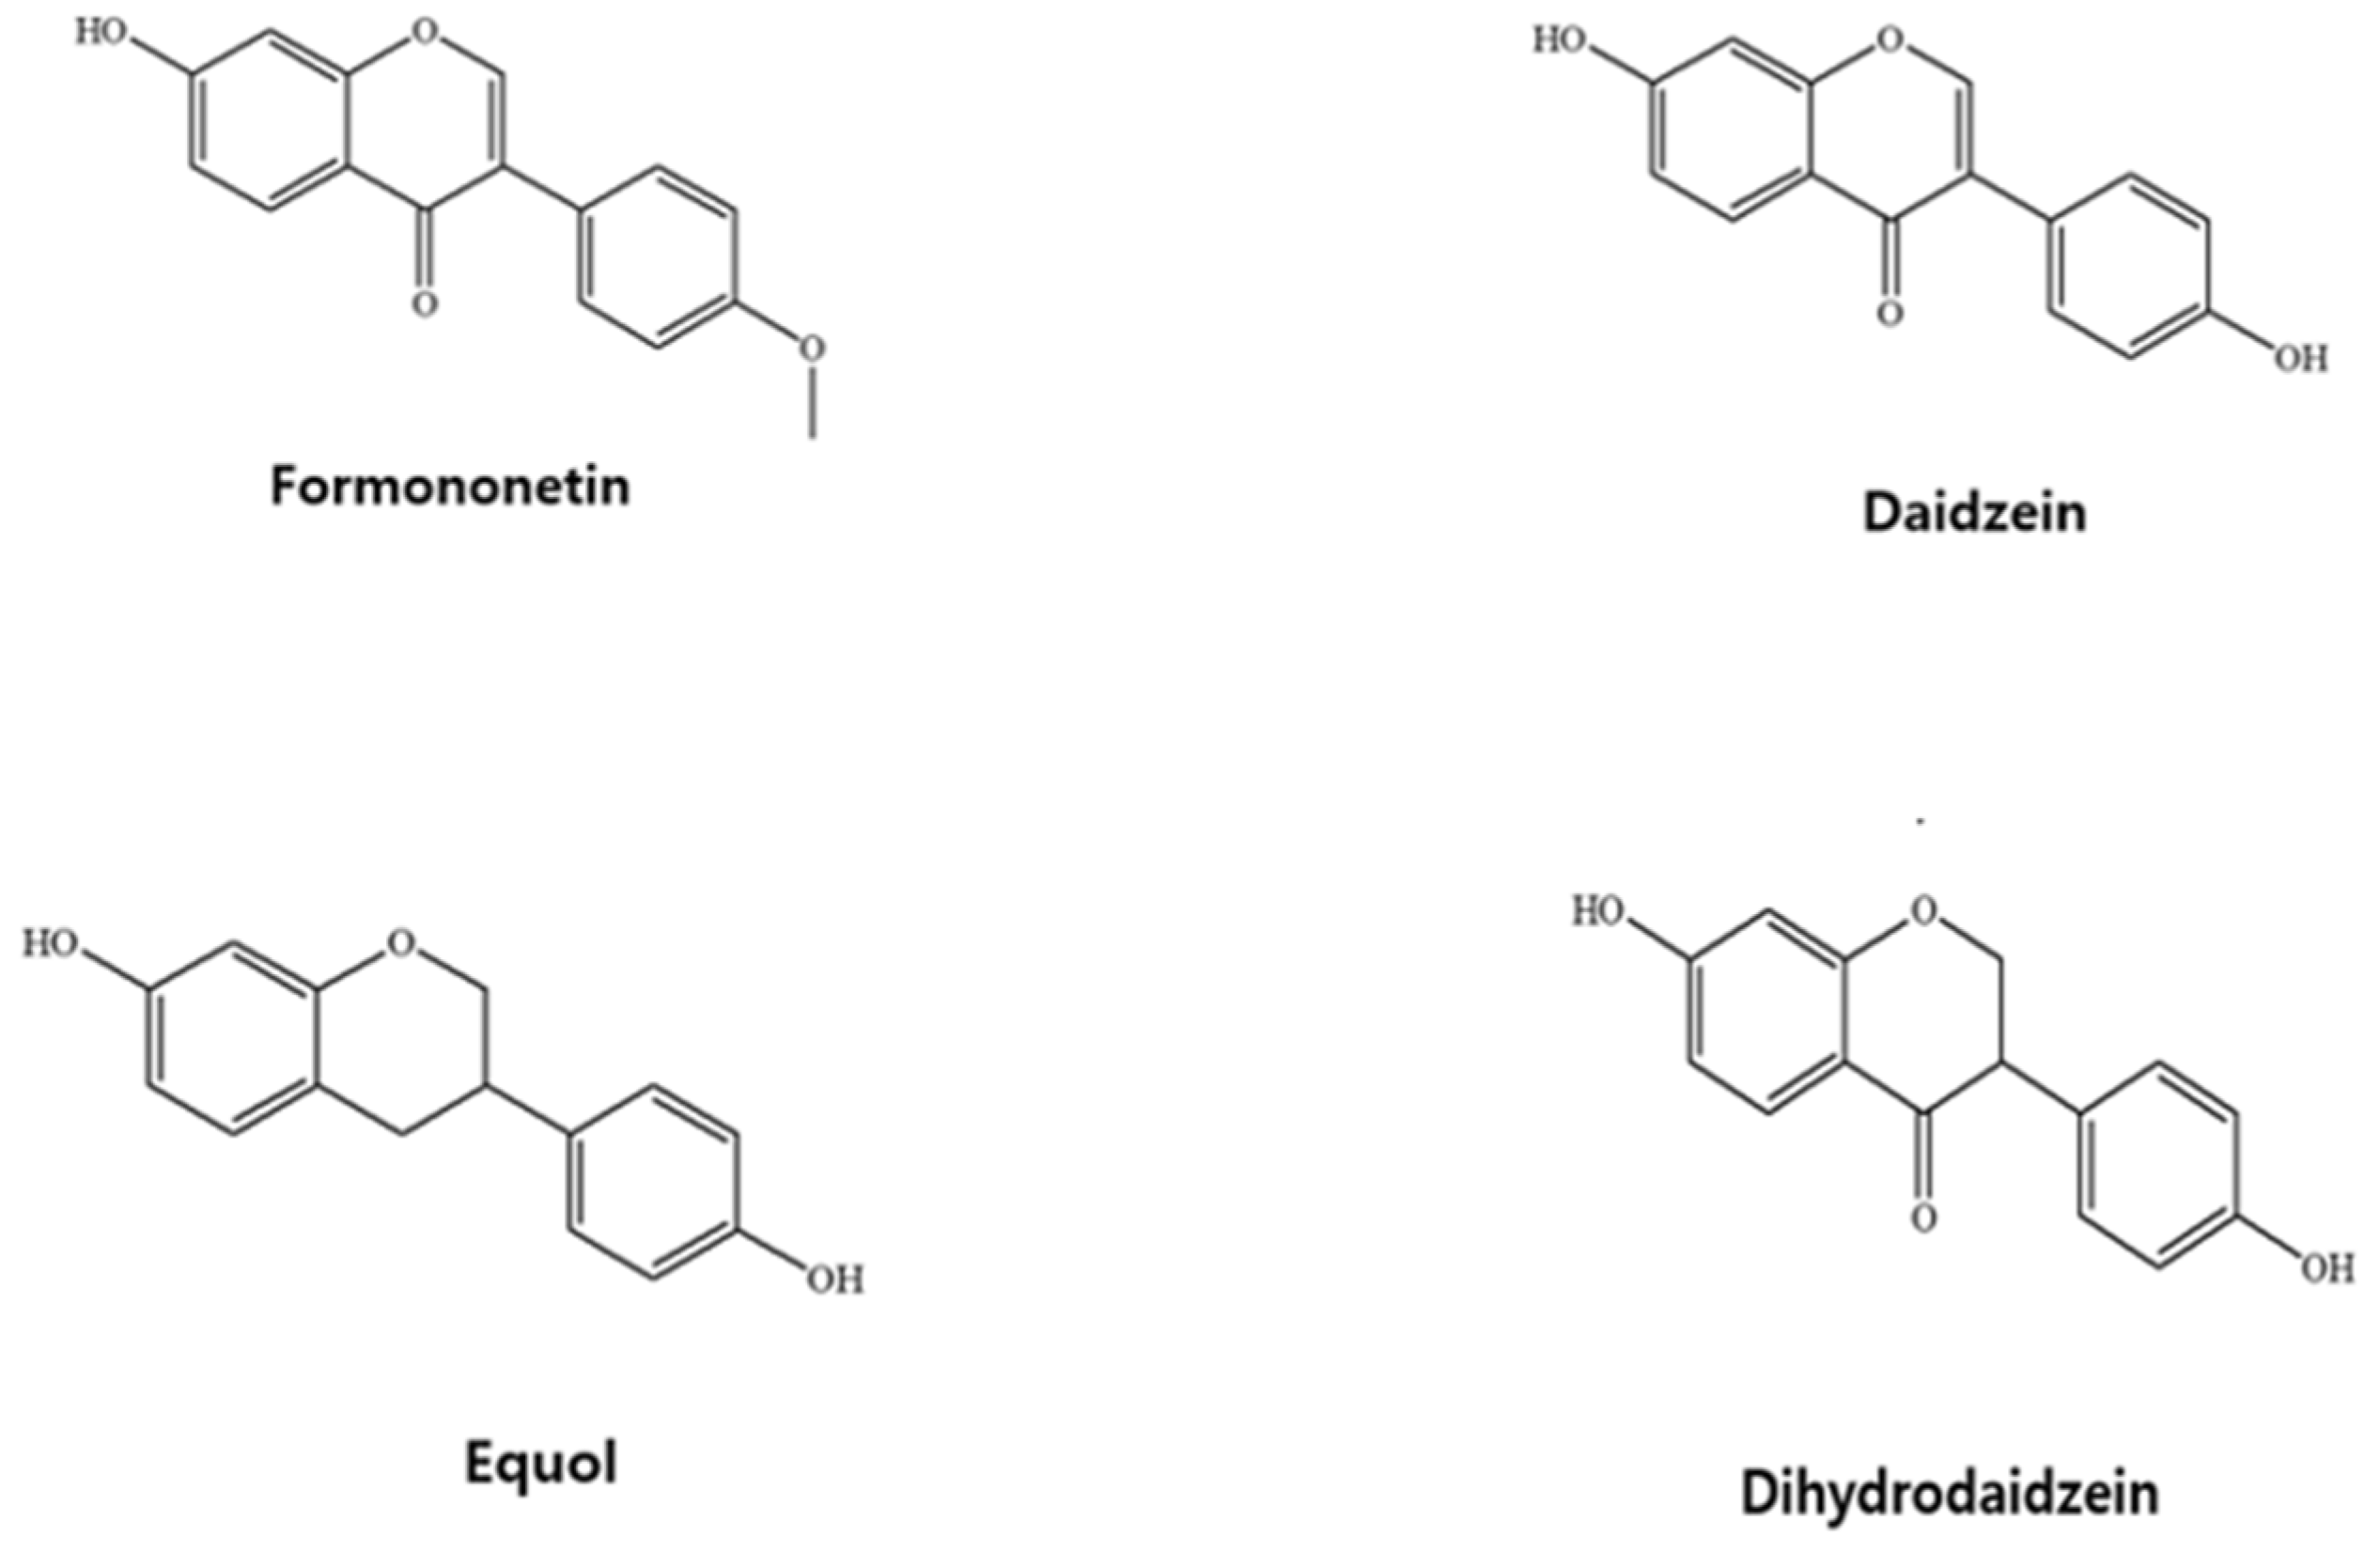
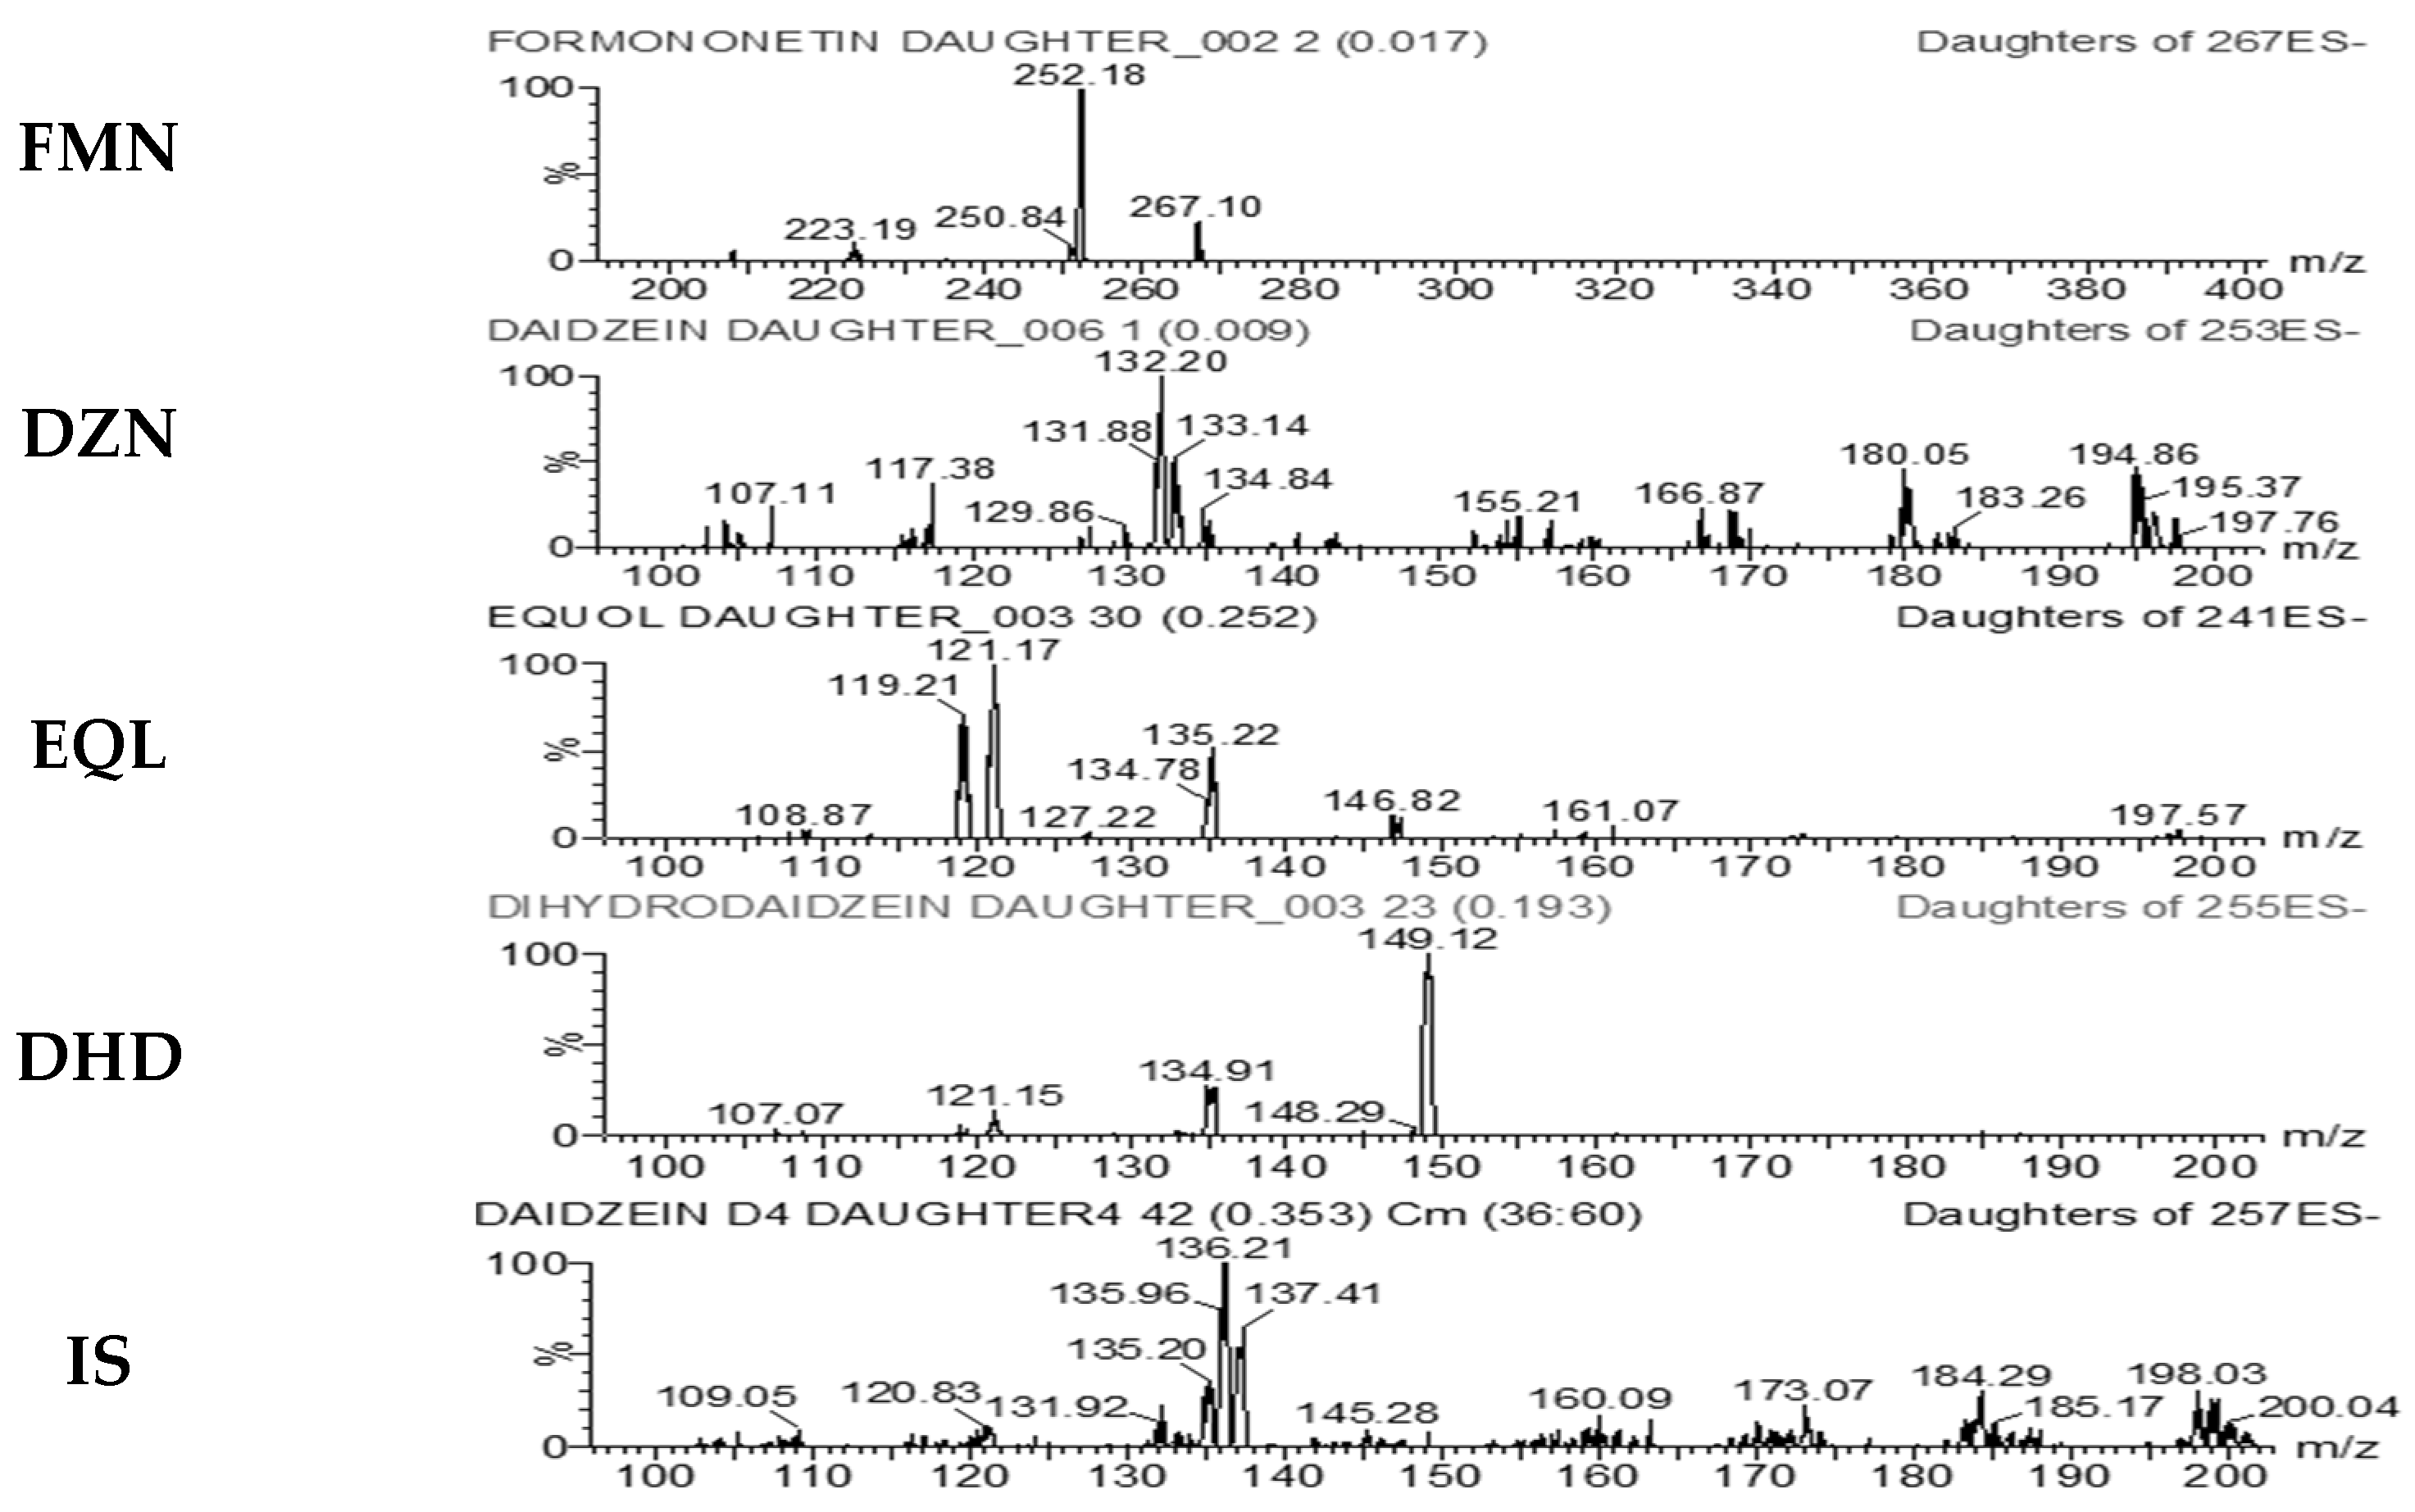
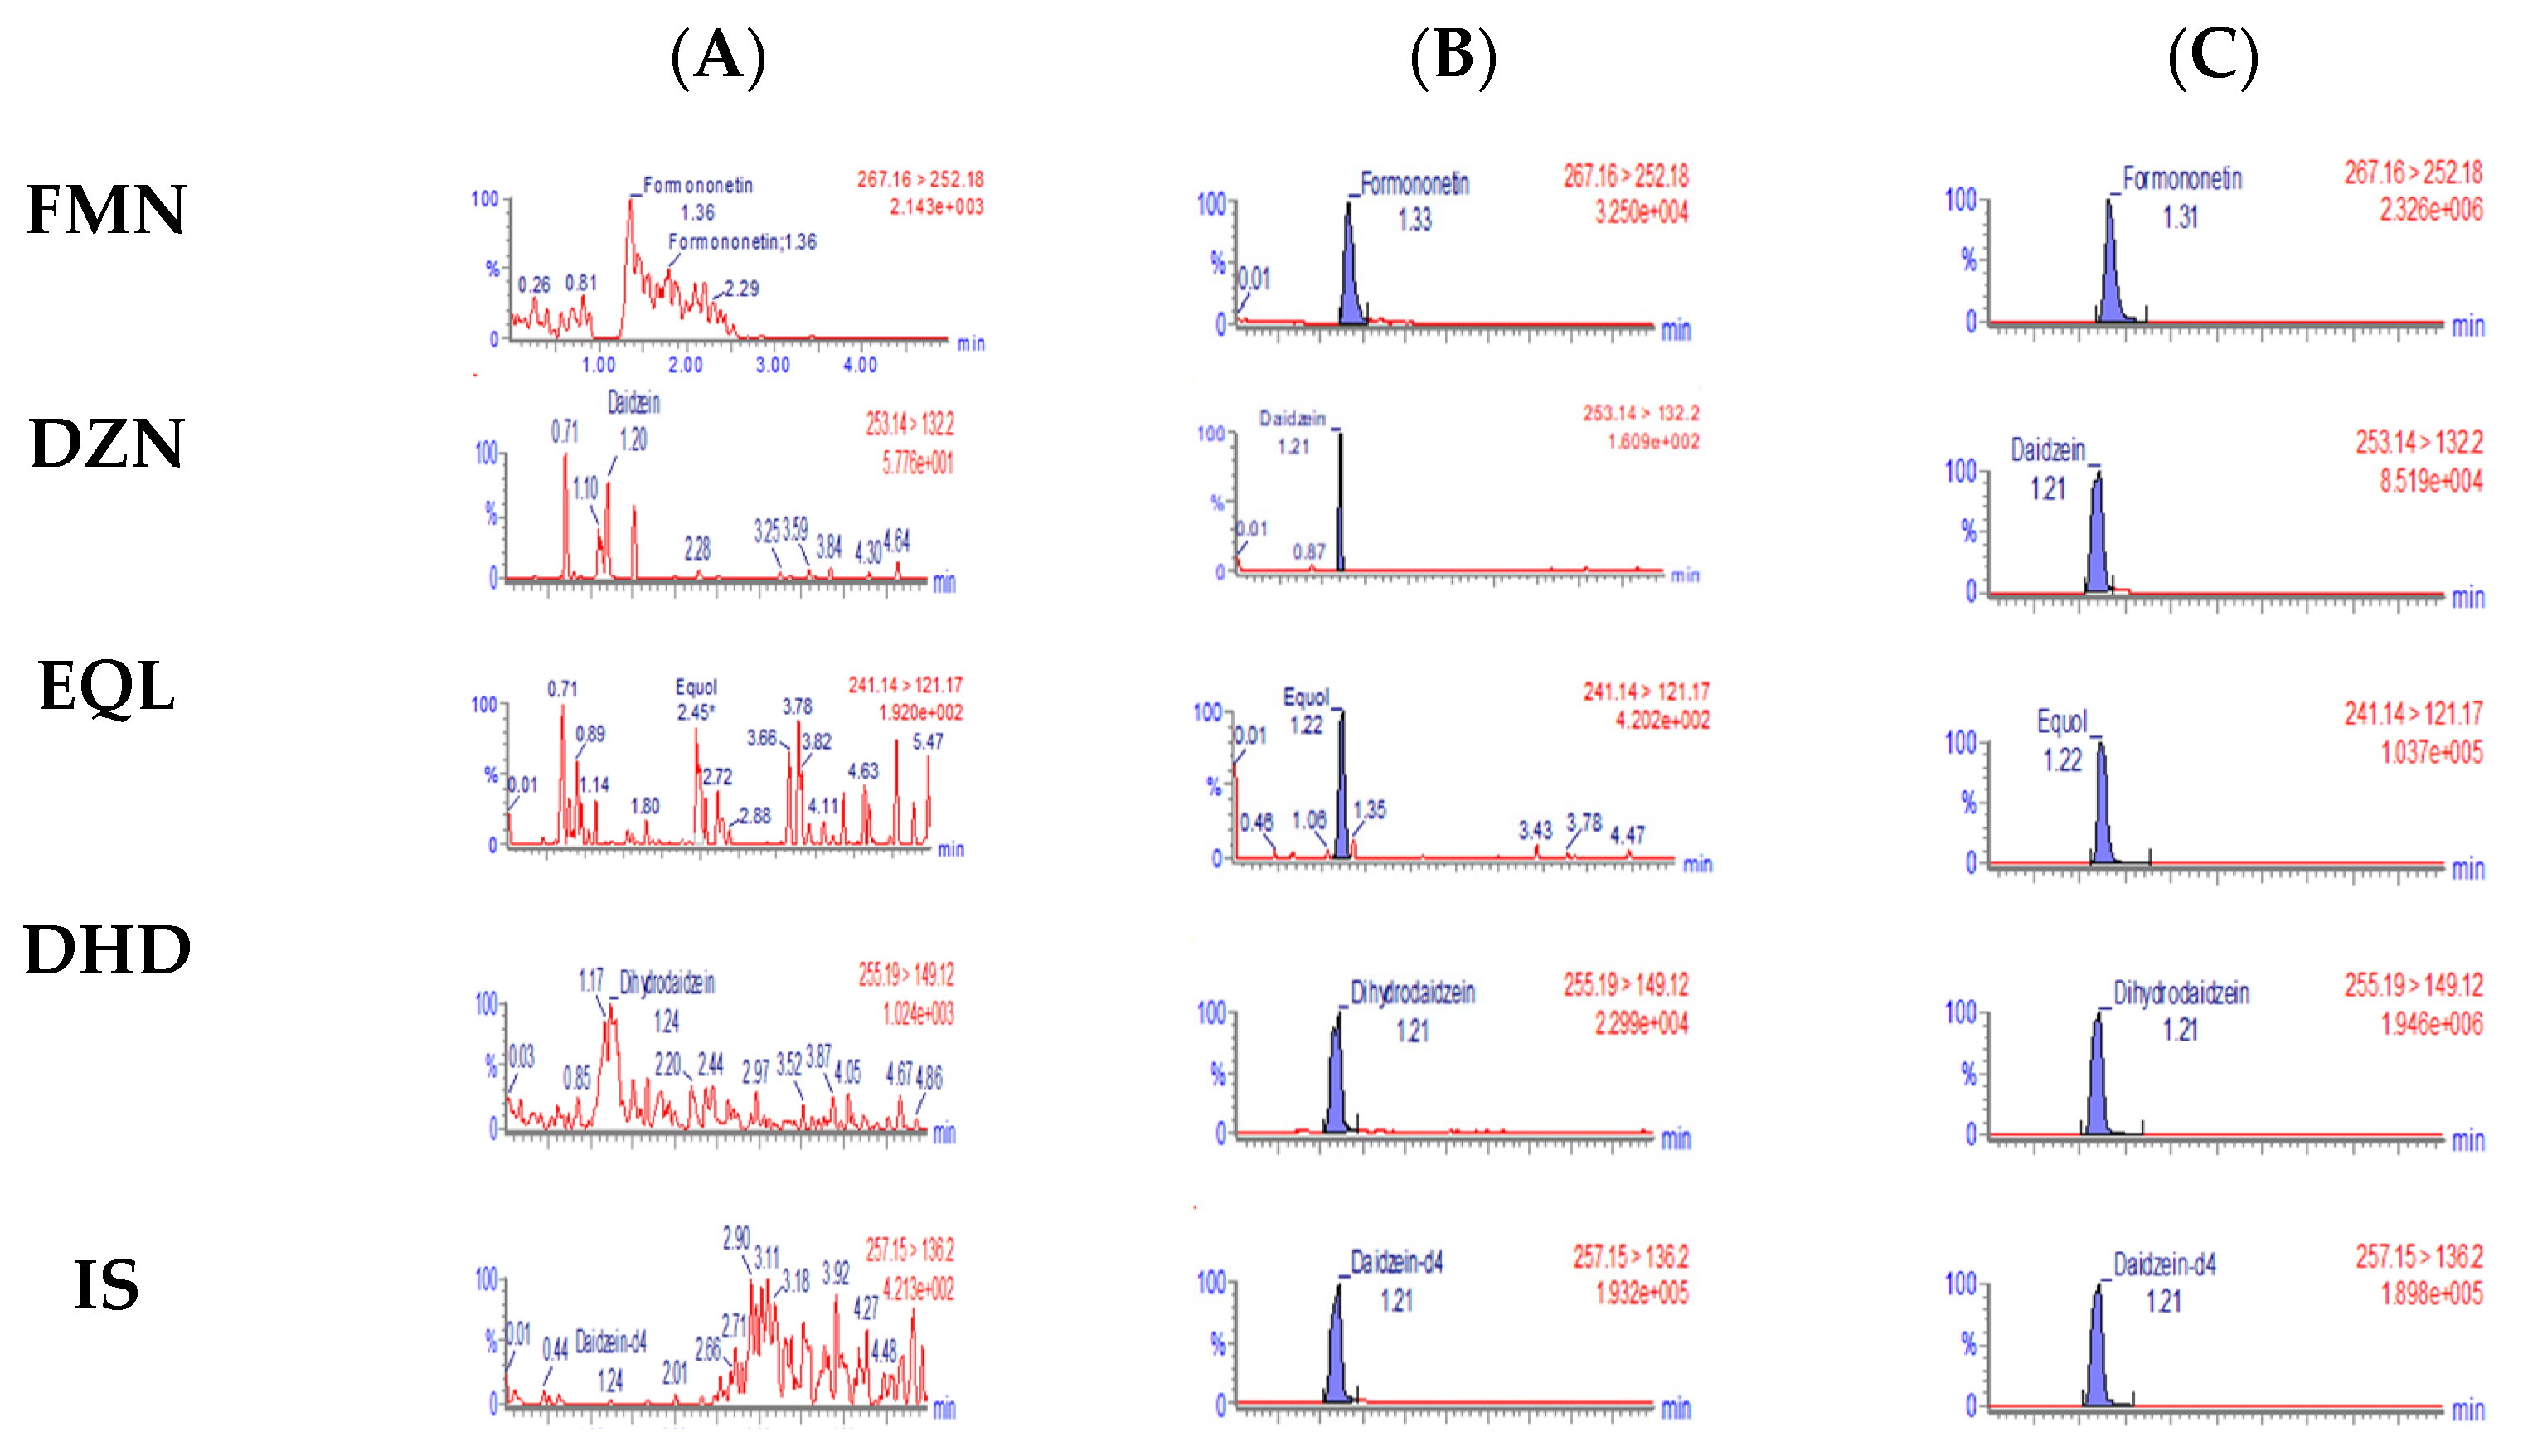
| FMN | Formononetin |
| DZN | Daidzein |
| DHD | Dihydrodaidzein |
| EQL | Equol |
| IS | Internal Standard |
| QC | Quality control |
| PK | pharmacokinetics |
| SD | Standard deviation |
References
- das Neves, M.V.; da Silva, T.M.; Lima Ede, O.; da Cunha, E.V.; Oliveira Ede, J. Isoflavone formononetin from red propolis acts as a fungicide against Candida sp. Braz. J. Microbiol. 2016, 47, 159–166. [Google Scholar] [CrossRef] [PubMed] [Green Version]
- Oza, M.J.; Kulkarni, Y.A. Formononetin attenuates kidney damage in type 2 diabetic rats. Life Sci. 2019, 219, 109–121. [Google Scholar] [CrossRef] [PubMed]
- Oza, M.J.; Kulkarni, Y.A. Formononetin Treatment in Type 2 Diabetic Rats Reduces Insulin Resistance and Hyperglycemia. Front. Pharmacol. 2018, 9, 739. [Google Scholar] [CrossRef] [Green Version]
- Wang, J.; Wang, L.; Zhou, J.; Qin, A.; Chen, Z. The protective effect of formononetin on cognitive impairment in streptozotocin (STZ)-induced diabetic mice. Biomed. Pharmacother. = Biomed. Pharmacother. 2018, 106, 1250–1257. [Google Scholar] [CrossRef]
- Wang, W.S.; Zhao, C.S. Formononetin exhibits anticancer activity in gastric carcinoma cell and regulating miR-542-5p. Kaohsiung J. Med. Sci. 2021, 37, 215–225. [Google Scholar] [CrossRef]
- Jin, Y.M.; Xu, T.M.; Zhao, Y.H.; Wang, Y.C.; Cui, M.H. In vitro and in vivo anti-cancer activity of formononetin on human cervical cancer cell line HeLa. Tumour Biol. J. Int. Soc. Oncodevelopmental Biol. Med. 2014, 35, 2279–2284. [Google Scholar] [CrossRef]
- Tay, K.C.; Tan, L.T.; Chan, C.K.; Hong, S.L.; Chan, K.G.; Yap, W.H.; Pusparajah, P.; Lee, L.H.; Goh, B.H. Formononetin: A Review of Its Anticancer Potentials and Mechanisms. Front. Pharmacol. 2019, 10, 820. [Google Scholar] [CrossRef] [Green Version]
- Liu, X.; Xu, D.; Liao, C.; Fang, Y.; Guo, B. Development of a promising drug delivery for formononetin: Cyclodextrin-modified single-walled carbon nanotubes. J. Drug Deliv. Sci. Technol. 2018, 43, 461–468. [Google Scholar] [CrossRef]
- Guo, B.; Xu, D.; Liu, X.; Liao, C.; Li, S.; Huang, Z.; Li, X.; Yi, J. Characterization and cytotoxicity of PLGA nanoparticles loaded with formononetin cyclodextrin complex. J. Drug Deliv. Sci. Technol. 2017, 41, 375–383. [Google Scholar] [CrossRef]
- Guo, B.; Liao, C.; Liu, X.; Yi, J. Preliminary study on conjugation of formononetin with multiwalled carbon nanotubes for inducing apoptosis via ROS production in HeLa cells. Drug Des. Dev. Ther. 2018, 12, 2815–2826. [Google Scholar] [CrossRef]
- Kuminek, G.; Cao, F.; Bahia de Oliveira da Rocha, A.; Goncalves Cardoso, S.; Rodriguez-Hornedo, N. Cocrystals to facilitate delivery of poorly soluble compounds beyond-rule-of-5. Adv. Drug Deliv. Rev. 2016, 101, 143–166. [Google Scholar] [CrossRef] [PubMed] [Green Version]
- Saffoon, N.; Uddin, R.; Huda, N.H.; Sutradhar, K.B. Enhancement of Oral Bioavailability and Solid Dispersion: A Review. J. Appl. Pharm. Sci. 2011, 01, 13–20. [Google Scholar]
- Tolleson, W.H.; Doerge, D.R.; Churchwell, M.I.; Marques, M.M.; Roberts, D.W. Metabolism of biochanin A and formononetin by human liver microsomes in vitro. J. Agric. Food Chem. 2002, 50, 4783–4790. [Google Scholar] [CrossRef] [PubMed]
- Ju, Y.H.; Fultz, J.; Allred, K.F.; Doerge, D.R.; Helferich, W.G. Effects of dietary daidzein and its metabolite, equol, at physiological concentrations on the growth of estrogen-dependent human breast cancer (MCF-7) tumors implanted in ovariectomized athymic mice. Carcinogenesis 2006, 27, 856–863. [Google Scholar] [CrossRef] [PubMed] [Green Version]
- Singh, S.P.; Wahajuddin; Tewari, D.; Pradhan, T.; Jain, G.K. PAMPA permeability, plasma protein binding, blood partition, pharmacokinetics and metabolism of formononetin, a methoxylated isoflavone. Food Chem. Toxicol. 2011, 49, 1056–1062. [Google Scholar] [CrossRef] [PubMed]
- Prasain, J.K.; Arabshahi, A.; Moore, D.R., 2nd; Greendale, G.A.; Wyss, J.M.; Barnes, S. Simultaneous determination of 11 phytoestrogens in human serum using a 2 min liquid chromatography/tandem mass spectrometry method. J. Chromatography. B Anal. Technol. Biomed. Life Sci. 2010, 878, 994–1002. [Google Scholar] [CrossRef] [Green Version]
- Guo, P.; Dong, L.; Yan, W.; Wei, J.; Wang, C.; Zhang, Z. Simultaneous determination of linarin, naringenin and formononetin in rat plasma by LC-MS/MS and its application to a pharmacokinetic study after oral administration of Bushen Guchi Pill. Biomed. Chromatogr. BMC 2015, 29, 246–253. [Google Scholar] [CrossRef]
- Baltas, N.; Karaoglu, S.A.; Tarakci, C.; Kolayli, S. Effect of propolis in gastric disorders: Inhibition studies on the growth of Helicobacter pylori and production of its urease. J. Enzyme Inhib. Med. Chem. 2016, 31, 46–50. [Google Scholar] [CrossRef] [Green Version]
- Li, J.; Bai, Y.; Bai, Y.; Zhu, R.; Liu, W.; Cao, J.; An, M.; Tan, Z.; Chang, Y.X. Pharmacokinetics of Caffeic Acid, Ferulic Acid, Formononetin, Cryptotanshinone, and Tanshinone IIA after Oral Administration of Naoxintong Capsule in Rat by HPLC-MS/MS. Evid.-Based Complement. Altern. Med. eCAM 2017, 2017, 9057238. [Google Scholar] [CrossRef]
- Zhang, R.; Wang, S.; Lu, M.; Zhang, Z.; Tian, X.; Lv, D. Simultaneous determination and pharmacokinetic study of three isoflavones from Trifolium pratense extract in rat plasma by LC-MS/MS. Biomed. Chromatogr. BMC 2015, 29, 210–219. [Google Scholar] [CrossRef]
- Liu, X.H.; Zhao, J.B.; Guo, L.; Yang, Y.L.; Hu, F.; Zhu, R.J.; Feng, S.L. Simultaneous determination of calycosin-7-O-beta-D-glucoside, ononin, calycosin, formononetin, astragaloside IV, and astragaloside II in rat plasma after oral administration of Radix Astragali extraction for their pharmacokinetic studies by ultra-pressure liquid chromatography with tandem mass spectrometry. Cell Biochem. Biophys. 2014, 70, 677–686. [Google Scholar] [CrossRef] [PubMed]
- Luo, L.Y.; Fan, M.X.; Zhao, H.Y.; Li, M.X.; Wu, X.; Gao, W.Y. Pharmacokinetics and Bioavailability of the Isoflavones Formononetin and Ononin and Their in Vitro Absorption in Ussing Chamber and Caco-2 Cell Models. J. Agric. Food Chem. 2018, 66, 2917–2924. [Google Scholar] [CrossRef] [PubMed]
- Song, M.S.; Wang, D.; Row, K.H. Protein Binding Study of Isoflavones by High-Performance Frontal Analysis. Chromatographia 2004, 59, 437–441. [Google Scholar] [CrossRef]
- Mould, D.R.; Upton, R.N. Basic concepts in population modeling, simulation, and model-based drug development-part 2: Introduction to pharmacokinetic modeling methods. CPT Pharmacomet. Syst. Pharmacol. 2013, 2, e38. [Google Scholar] [CrossRef] [PubMed]
- Raju, K.S.R.; Rashid, M.; Gundeti, M.; Taneja, I.; Malik, M.Y.; Singh, S.K.; Chaturvedi, S.; Challagundla, M.; Singh, S.P.; Gayen, J.R.; et al. LC-ESI-MS/MS method for the simultaneous determination of isoformononetin, daidzein, and equol in rat plasma: Application to a preclinical pharmacokinetic study. J. Chromatography B Anal. Technol. Biomed. Life Sci. 2019, 1129, 121776. [Google Scholar] [CrossRef]
- Teede, H.J.; McGrath, B.P.; DeSilva, L.; Cehun, M.; Fassoulakis, A.; Nestel, P.J. Isoflavones reduce arterial stiffness: A placebo-controlled study in men and postmenopausal women. Arterioscler. Thromb. Vasc. Biol. 2003, 23, 1066–1071. [Google Scholar] [CrossRef]


| FMN | |||
| Theoretical concentration (ng/mL) | Mean measured concentration (n = 5, ng/mL) | Precision (%CV) | Accuracy (%) |
| Inter-day | |||
| 2 | 2.06 | 2.12 | 103.00 |
| 6 | 5.93 | 7.76 | 98.91 |
| 80 | 81.87 | 4.21 | 102.34 |
| 160 | 166.67 | 8.72 | 104.17 |
| Intra-day | |||
| 2 | 2.01 | 13.43 | 100.90 |
| 6 | 5.40 | 6.16 | 90.06 |
| 80 | 78.41 | 13.19 | 98.01 |
| 160 | 158.98 | 0.67 | 99.36 |
| DZN | |||
| Theoretical concentration (ng/mL) | Mean measured concentration (n = 5, ng/mL) | Precision (%CV) | Accuracy (%) |
| Inter-day | |||
| 2 | 1.93 | 9.34 | 96.61 |
| 6 | 5.60 | 6.72 | 93.33 |
| 80 | 83.91 | 2.61 | 104.88 |
| 160 | 164.02 | 1.10 | 102.51 |
| Intra-day | |||
| 2 | 2.13 | 9.19 | 106.33 |
| 6 | 5.87 | 13.03 | 97.83 |
| 80 | 84.99 | 5.78 | 106.24 |
| 160 | 165.27 | 4.17 | 103.29 |
| DHD | |||
| Theoretical concentration (ng/mL) | Mean measured concentration (n = 5, ng/mL) | Precision (%CV) | Accuracy (%) |
| Inter-day | |||
| 2 | 1.95 | 1.28 | 97.72 |
| 6 | 5.93 | 5.85 | 98.83 |
| 80 | 80.88 | 2.65 | 101.10 |
| 160 | 156.42 | 0.68 | 97.76 |
| Intra-day | |||
| 2 | 1.98 | 4.55 | 99.17 |
| 6 | 5.55 | 3.37 | 92.50 |
| 80 | 78.46 | 6.13 | 98.08 |
| 160 | 155.25 | 3.70 | 97.03 |
| EQL | |||
| Theoretical concentration (ng/mL) | Mean measured concentration (n = 5, ng/mL) | Precision (%CV) | Accuracy (%) |
| Inter-day | |||
| 2 | 2.13 | 6.31 | 106.33 |
| 6 | 6.09 | 1.41 | 101.54 |
| 80 | 76.49 | 3.50 | 95.61 |
| 160 | 156.33 | 2.25 | 97.71 |
| Intra-day | |||
| 2 | 2.07 | 7.21 | 103.50 |
| 6 | 6.11 | 13.76 | 101.78 |
| 80 | 73.83 | 14.94 | 92.29 |
| 160 | 156.55 | 10.36 | 97.85 |
| Compound | 50 ng/mL | 150 ng/mL | 500 ng/mL | 1000 ng/mL |
|---|---|---|---|---|
| FMN | 88.44 ± 2.29 | 93.36 ± 4.85 | 85.51 ± 1.71 | 91.80 ± 1.31 |
| DZN | 95.44 ± 1.60 | 96.58 ± 1.82 | 94.31 ± 0.37 | 94.69 ± 0.53 |
| EQL | - | 98.69 ± 0.53 | 98.62 ± 0.41 | 97.80 ± 1.29 |
| DHD | 88.15 ± 0.53 | 87.39 ± 1.31 | 88.02 ± 0.90 | 86.83 ± 1.50 |
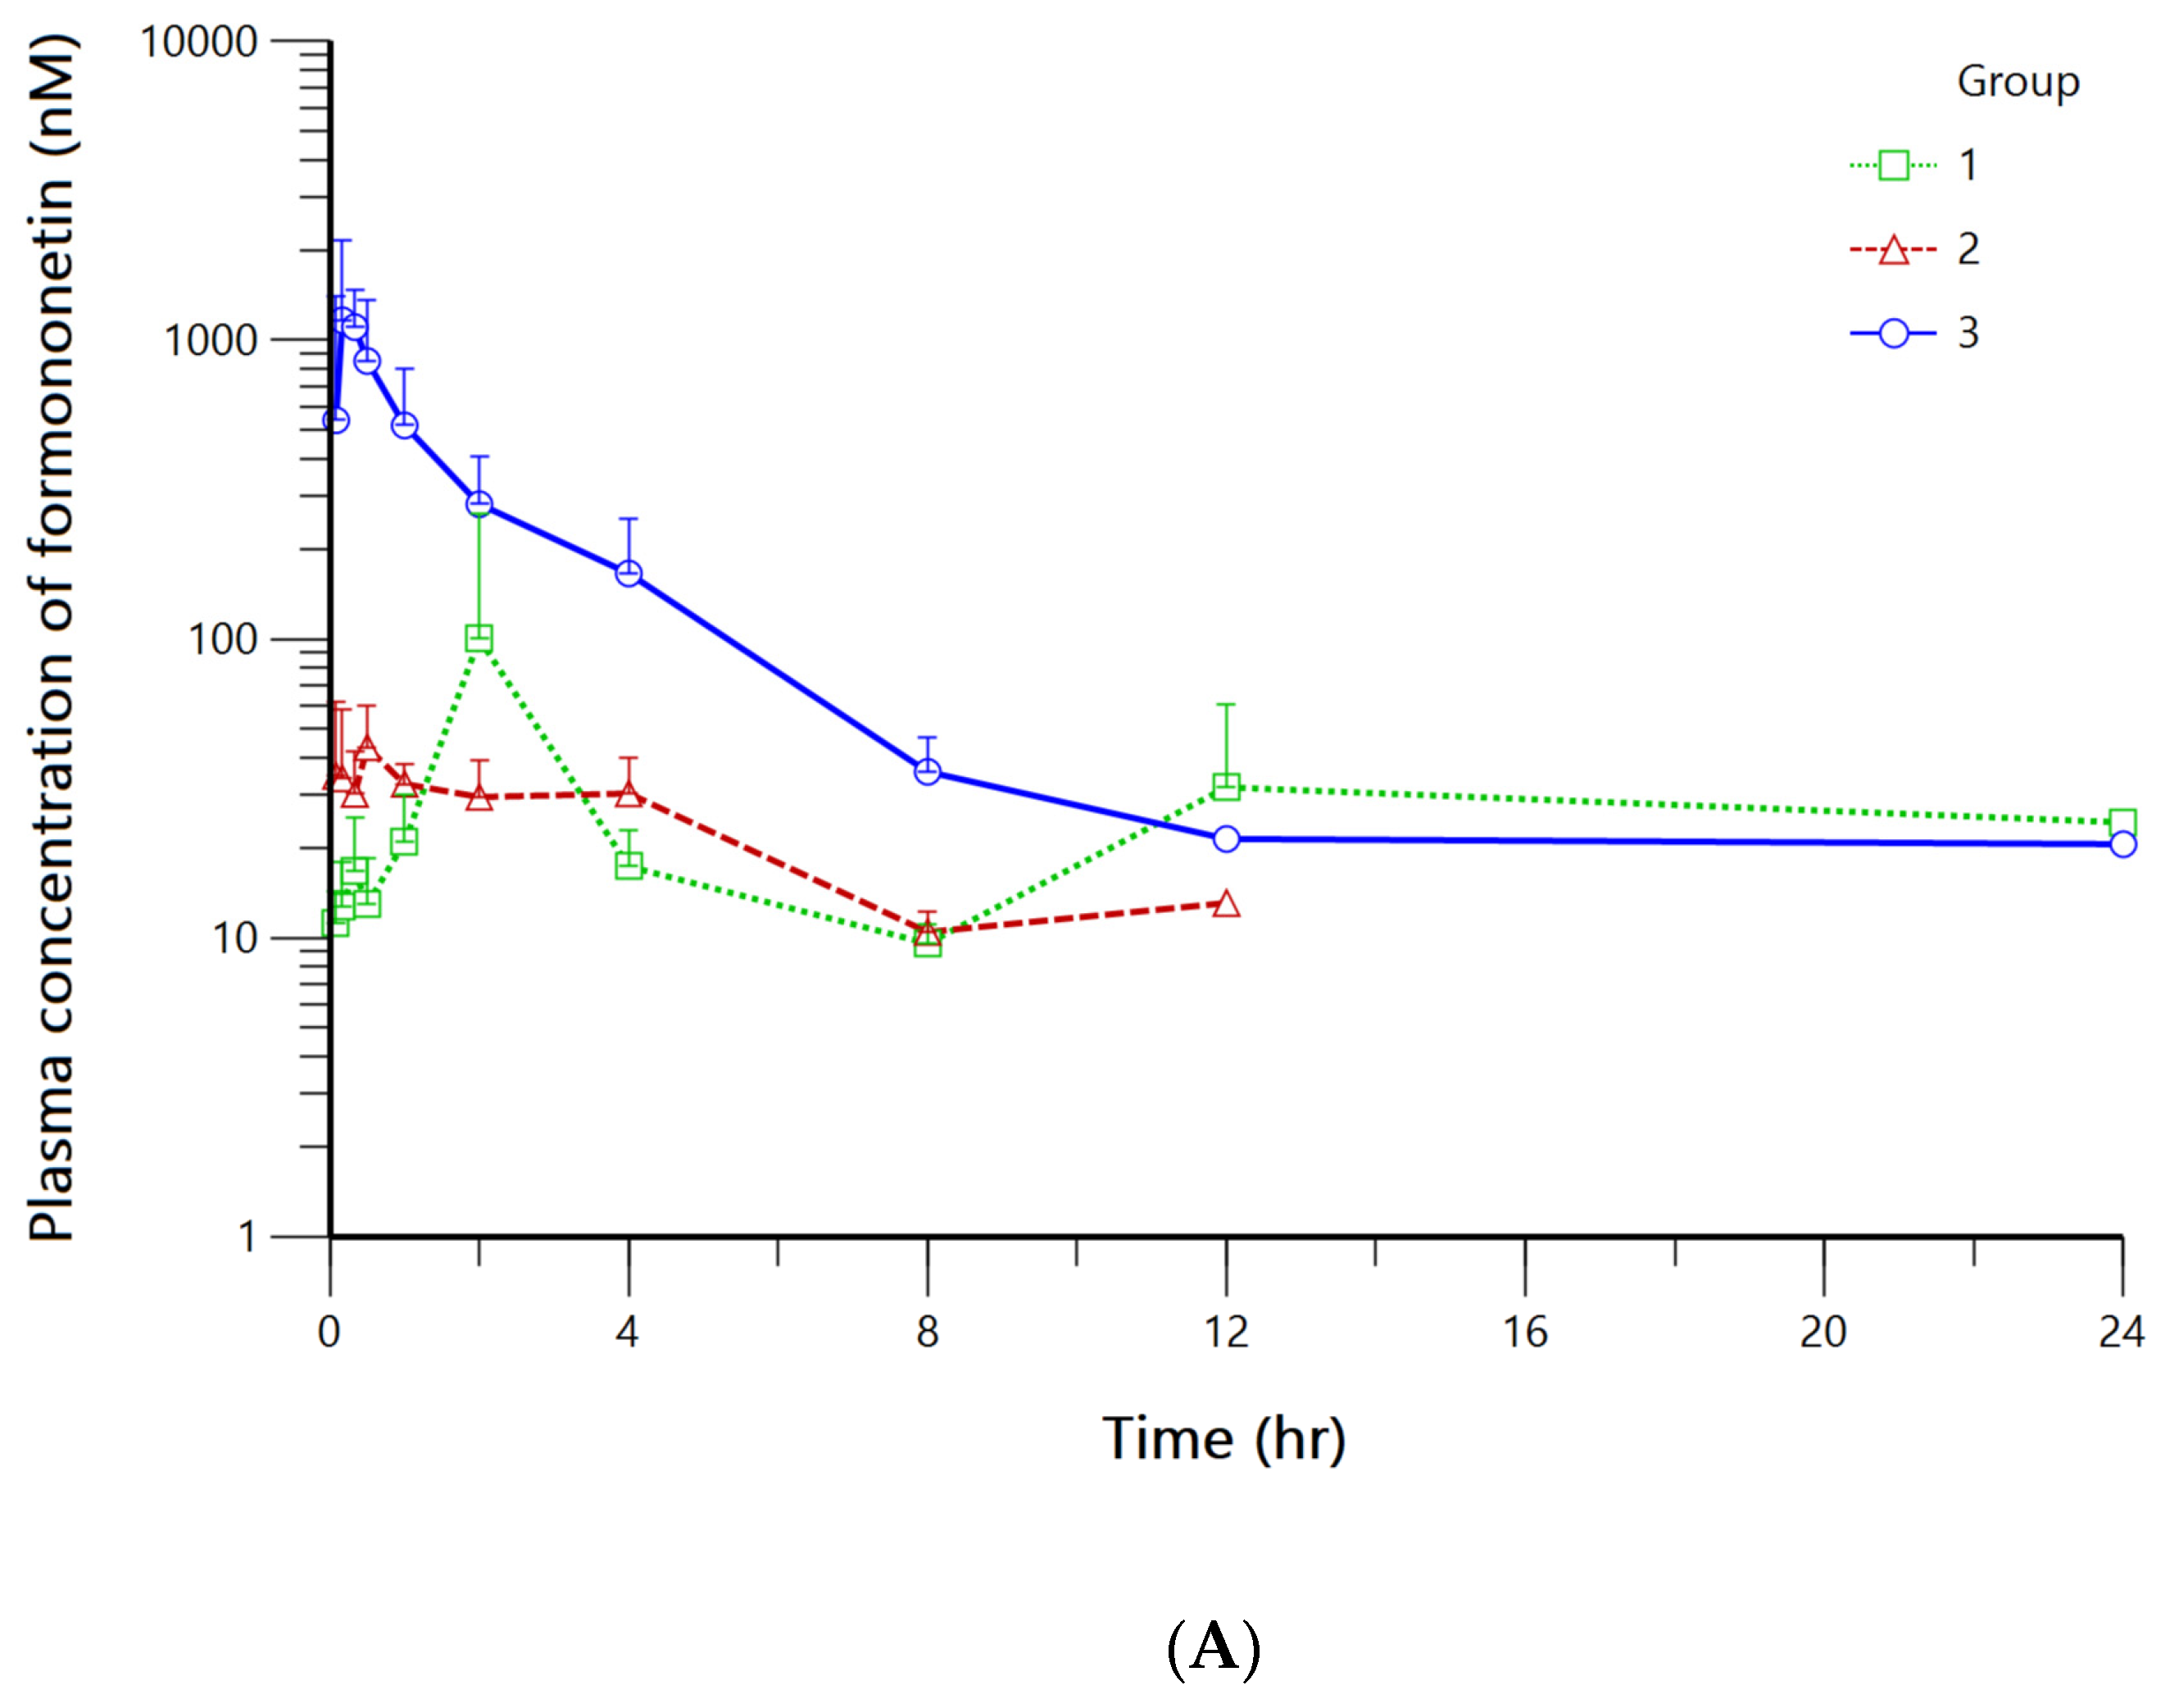
| Group | ID | Half-Life | Tmax | Cmax | AUClast | AUCinf | Vd/F | CL/F |
|---|---|---|---|---|---|---|---|---|
| (hr) | (hr) | (nmol/L) | (hr × nmol/L) | (hr × nmol/L) | (L) | (L/hr) | ||
| 1 | 1 | - | 2.00 | 31.39 | 303.60 | - | - | - |
| 2 | - | 2.00 | 390.77 | 613.56 | - | - | - | |
| 3 | - | 2.00 | 23.71 | 184.49 | - | - | - | |
| 4 | - | 12.00 | 73.96 | 291.14 | - | - | - | |
| 5 | - | 2.00 | 30.31 | 447.80 | - | - | - | |
| Mean | - | 4.00 | 110.03 | 368.12 | - | - | - | |
| SD | - | 4.47 | 158.20 | 166.13 | - | - | - | |
| 2 | 6 | 3.89 | 0.17 | 48.09 | 225.00 | 294.69 | 325.45 | 57.99 |
| 7 | 5.96 | 0.08 | 62.63 | 237.73 | 316.02 | 455.13 | 52.96 | |
| 8 | - | 4.00 | 46.15 | 253.12 | - | - | - | |
| 9 | 4.83 | 0.08 | 62.67 | 163.43 | 236.90 | 471.02 | 67.56 | |
| 10 | 3.93 | 0.50 | 72.17 | 201.05 | 266.28 | 336.36 | 59.30 | |
| Mean | 4.65 | 0.97 | 58.34 | 216.07 | 278.47 | 396.99 | 59.45 | |
| SD | 0.97 | 1.70 | 10.98 | 35.07 | 34.40 | 76.72 | 6.06 | |
| 3 | 11 | 4.34 | 0.33 | 1195.61 | 3563.43 | 3648.51 | 28.84 | 4.60 |
| 12 | 2.14 | 0.33 | 775.35 | 1741.27 | 1873.23 | 27.08 | 8.78 | |
| 13 | 1.81 | 0.17 | 2886.70 | 2638.59 | 2701.55 | 16.21 | 6.21 | |
| 14 | 2.01 | 0.33 | 876.75 | 1549.70 | 1644.38 | 28.92 | 9.95 | |
| 15 | 2.67 | 0.33 | 980.87 | 1404.79 | 1470.06 | 44.20 | 11.47 | |
| Mean | 2.60 | 0.30 | 1343.06 | 2179.56 | 2267.55 | 29.05 | 8.20 | |
| SD | 1.03 | 0.08 | 876.85 | 910.34 | 904.88 | 9.98 | 2.79 |
| Group | ID | Half Life | Tmax | Cmax | AUClast | AUCinf |
|---|---|---|---|---|---|---|
| (hr) | (hr) | (nmol/L) | (hr × nmol/L) | (hr × nmol/L) | ||
| 1 | 1 | - | 2.00 | 10.11 | 102.75 | - |
| 2 | - | - | - | - | - | |
| 3 | - | 12.00 | 9.87 | 194.29 | - | |
| 4 | - | - | - | - | - | |
| 5 | - | 24.00 | 9.52 | 199.56 | - | |
| Mean | - | 12.67 | 9.83 | 165.53 | - | |
| SD | - | 11.02 | 0.30 | 54.44 | - | |
| 2 | 6 | - | 4.00 | 27.10 | 154.04 | - |
| 7 | - | 4.00 | 13.21 | 31.46 | - | |
| 8 | - | 4.00 | 14.00 | 274.84 | - | |
| 9 | - | - | - | - | - | |
| 10 | - | 2.00 | 4.51 | 28.06 | - | |
| Mean | - | 3.50 | 14.71 | 122.10 | - | |
| SD | - | 1.00 | 9.31 | 117.48 | - | |
| 3 | 11 | - | 0.33 | 118.89 | 231.05 | - |
| 12 | 3.40 | 0.33 | 195.43 | 488.82 | 585.86 | |
| 13 | - | 0.50 | 106.11 | 303.33 | - | |
| 14 | 4.60 | 0.33 | 301.39 | 376.39 | 786.20 | |
| 15 | 1.36 | 0.33 | 286.20 | 358.81 | 415.60 | |
| Mean | 3.12 | 0.37 | 201.61 | 351.68 | 595.89 | |
| SD | 1.64 | 0.08 | 90.98 | 95.34 | 185.50 |
| Model | Description | −2LL | AIC | BIC | No. of Parameters |
|---|---|---|---|---|---|
| Structural model (FMN) | |||||
| P1 | One-compartment model without lag time | 603.86 | 613.86 | 622.43 | 5 |
| P2 | One-compartment model with lag time | 603.86 | 615.86 | 626.14 | 6 |
| P3 * | Two-compartment model without lag time | 558.62 | 572.62 | 584.62 | 7 |
| P4 | Two-compartment model with lag time | 612.74 | 628.74 | 642.45 | 8 |
| P5 | Two-compartment model without lag time with nonlinear elimination | 558.62 | 576.62 | 592.04 | 9 |
| Structural model (FMN + DZN) | |||||
| M1 * | Two-compartment model with metabolite compartment | 1394.32 | 1416.32 | 1445.93 | 11 |
| M2 | Two-compartment model with metabolite compartment and nonlinear elimination | 1394.32 | 1420.32 | 1455.31 | 13 |
| M3 | Two-compartment model with two-compartment metabolite | 1388.51 | 1414.51 | 1449.50 | 13 |
| M4 | Two-compartment model with two-compartment metabolite and nonlinear elimination | 1388.51 | 1418.51 | 1458.88 | 15 |
| IIV model | |||||
| M1-1 | IIV on ka, F, V1, V2, CL1, CL2, Vm, CLm, Fm | 1418.79 | 1458.79 | 1512.62 | 20 |
| M1-2 | IIV on ka, F, V1, V2, CL1, CL2, Vm, Fm | 1375.43 | 1413.43 | 1464.57 | 19 |
| M1-3 | IIV on ka, F, V1, CL1, CL2, Vm, Fm | 1379.96 | 1415.96 | 1464.41 | 18 |
| M1-4 * | IIV on ka, F, V1, CL1, CL2, Vm | 1358.82 | 1392.82 | 1438.57 | 17 |
| M1-5 | IIV on F, V1, CL1, CL2, Vm | 1359.07 | 1391.07 | 1434.13 | 16 |
| M1-6 | IIV on F, V1, CL1, Vm | 1359.24 | 1389.24 | 1429.81 | 15 |
| M1-7 | IIV on F, V1, Vm | 1360.70 | 1388.70 | 1426.37 | 14 |
| M1-8 | IIV on V1, Vm | 1369.55 | 1395.55 | 1430.54 | 13 |
| M1-9 | IIV on V1 | 1379.75 | 1403.75 | 1436.04 | 12 |
| Error model | |||||
| M1-4-1 | Proportional | 1358.82 | 1392.82 | 1438.57 | 17 |
| M1-4-2 | Additive | 1992.30 | 2026.30 | 2072.05 | 17 |
| M1-4-3 † | Log-additive | 1358.82 | 1392.82 | 1438.57 | 17 |
| M1-4-4 | Additive + proportional | 1358.87 | 1396.87 | 1448.01 | 19 |
| Parameters (Unit) | Description | Estimate | CV (%) | Bootstrap Results | |
|---|---|---|---|---|---|
| 2.5% CI | 97.5% CI | ||||
| Fixed effect | |||||
| F | Fraction of FMN dose absorbed | 0.31 | 20.34 | 0.19 | 0.45 |
| Fm | Fraction of CL1 into metabolite compartment | 0.89 | 10.56 | 0.61 | 0.99 |
| ka (1/hr) | First-order absorption rate constant | 7.12 | 50.47 | 2.74 | 20.79 |
| V1 (L) | Volume of distribution of central compartment | 25.04 | 15.01 | 16.62 | 36.41 |
| V2 (L) | Volume of distribution of peripheral compartment | 48.31 | 40.19 | 27.08 | 88.12 |
| Vm (L) | Volume of distribution of metabolite compartment | 10.46 | 41.77 | 4.29 | 33.04 |
| CL1 (L/hr) | Total clearance of FMN | 19.85 | 15.35 | 12.62 | 26.14 |
| CL2 (L/hr) | Inter-compartmental clearance of FMN | 38.68 | 53.50 | 9.43 | 80.12 |
| CLm (L/hr) | Total clearance of DZN | 41.54 | 29.24 | 21.53 | 62.86 |
| Random effects | |||||
| ωV1 | IIV of V1 | 0.18 | 42.43 | 0.00 | 0.45 |
| ωCL1 | IIV of CL1 | 0.05 | 22.36 | 0.00 | 0.17 |
| ωka | IIV of ka | 0.25 | 50.00 | 0.00 | 0.38 |
| ωCL2 | IIV of CL2 | 0.11 | 33.17 | 0.00 | 0.33 |
| ωF | IIV of F | 0.03 | 17.32 | 0.00 | 0.08 |
| ωVm | IIV of Vm | 1.20 | 109.54 | 0.00 | 2.54 |
| Residual error | |||||
| ε1 | Proportional error of FMN | 0.75 | 3.53 | 0.63 | 0.89 |
| ε2 | Proportional error of DZN | 0.42 | 21.55 | 0.27 | 0.63 |
Disclaimer/Publisher’s Note: The statements, opinions and data contained in all publications are solely those of the individual author(s) and contributor(s) and not of MDPI and/or the editor(s). MDPI and/or the editor(s) disclaim responsibility for any injury to people or property resulting from any ideas, methods, instructions or products referred to in the content. |
© 2022 by the authors. Licensee MDPI, Basel, Switzerland. This article is an open access article distributed under the terms and conditions of the Creative Commons Attribution (CC BY) license (https://creativecommons.org/licenses/by/4.0/).
Share and Cite
Kim, J.H.; Kang, D.W.; Cho, S.-j.; Cho, H.-Y. Parent-Metabolite Pharmacokinetic Modeling of Formononetin and Its Active Metabolites in Rats after Oral Administration of Formononetin Formulations. Pharmaceutics 2023, 15, 45. https://doi.org/10.3390/pharmaceutics15010045
Kim JH, Kang DW, Cho S-j, Cho H-Y. Parent-Metabolite Pharmacokinetic Modeling of Formononetin and Its Active Metabolites in Rats after Oral Administration of Formononetin Formulations. Pharmaceutics. 2023; 15(1):45. https://doi.org/10.3390/pharmaceutics15010045
Chicago/Turabian StyleKim, Ju Hee, Dong Wook Kang, Seok-jin Cho, and Hea-Young Cho. 2023. "Parent-Metabolite Pharmacokinetic Modeling of Formononetin and Its Active Metabolites in Rats after Oral Administration of Formononetin Formulations" Pharmaceutics 15, no. 1: 45. https://doi.org/10.3390/pharmaceutics15010045