
Nano-Hydroxyapatite/PLGA Mixed Scaffolds as a Tool for Drug Development and to Study Metastatic Prostate Cancer in the Bone
 , , ,
, , ,
Abstract
: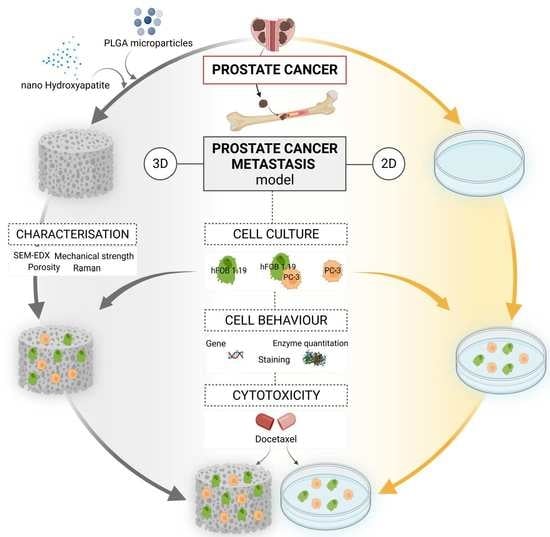
1. Introduction
2. Materials and Methods
2.1. Scaffold Fabrication Process
2.2. Scaffold Characterisation
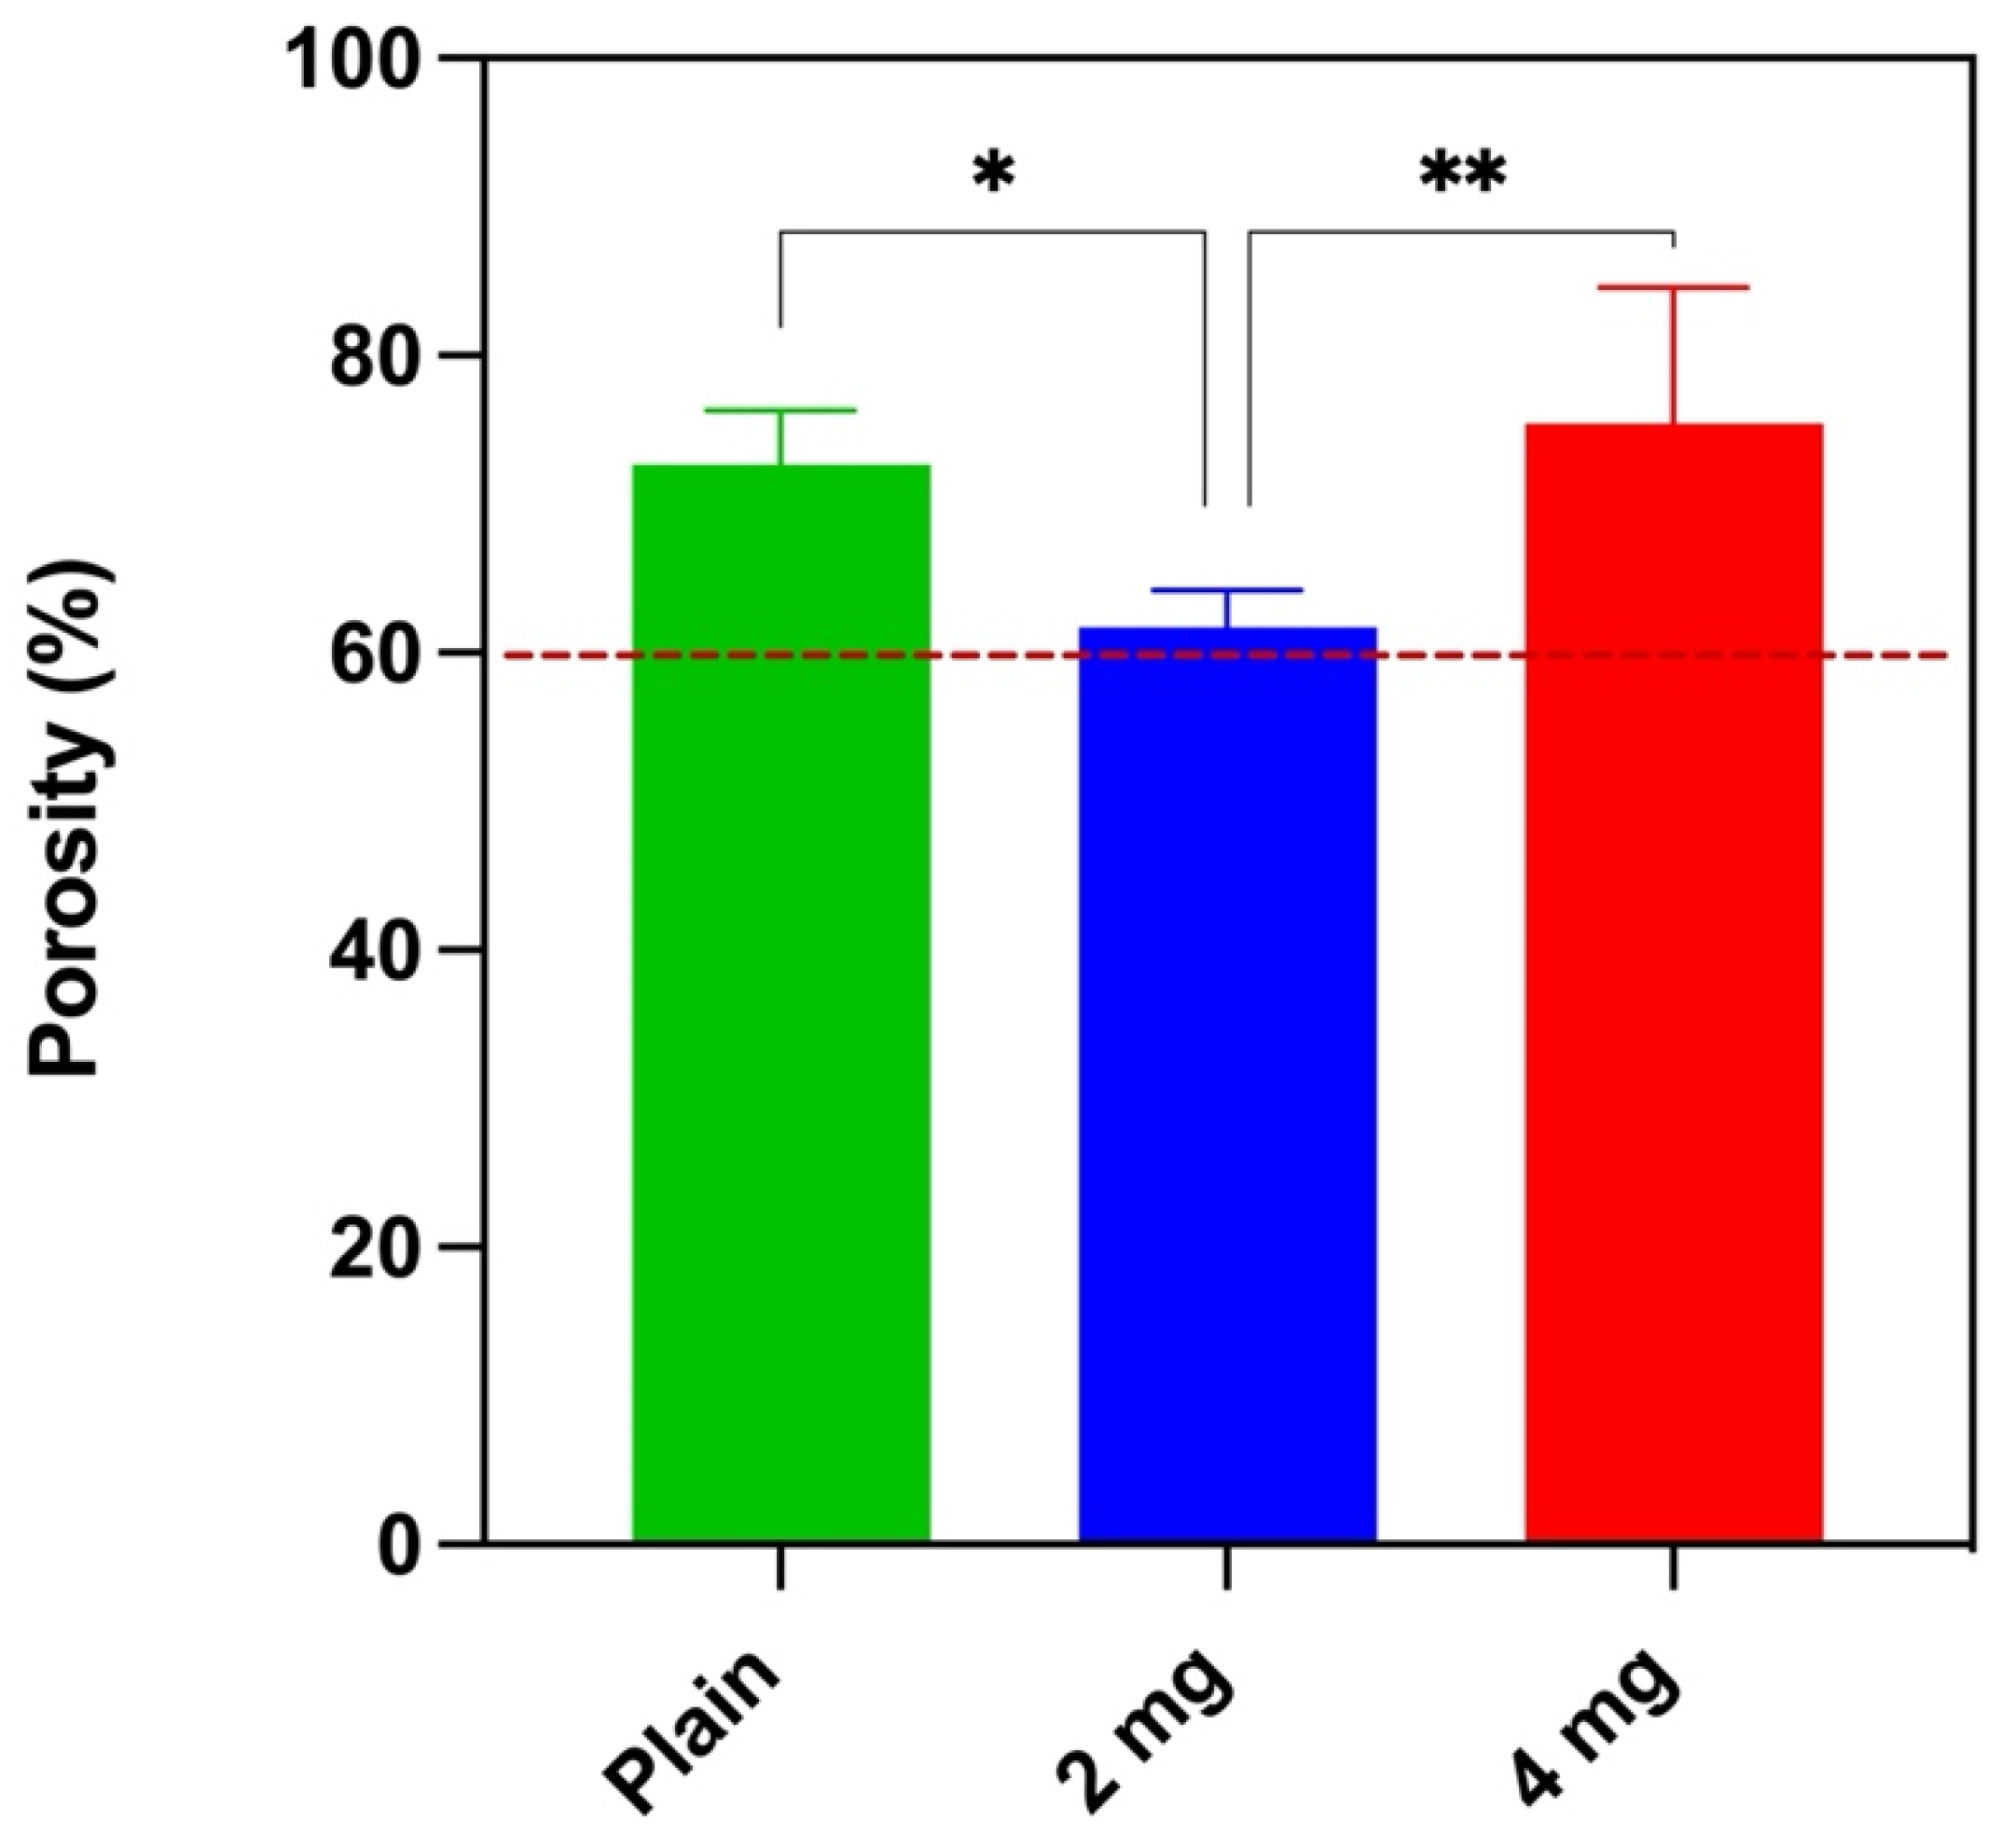
2.2.1. Porosity Measurements
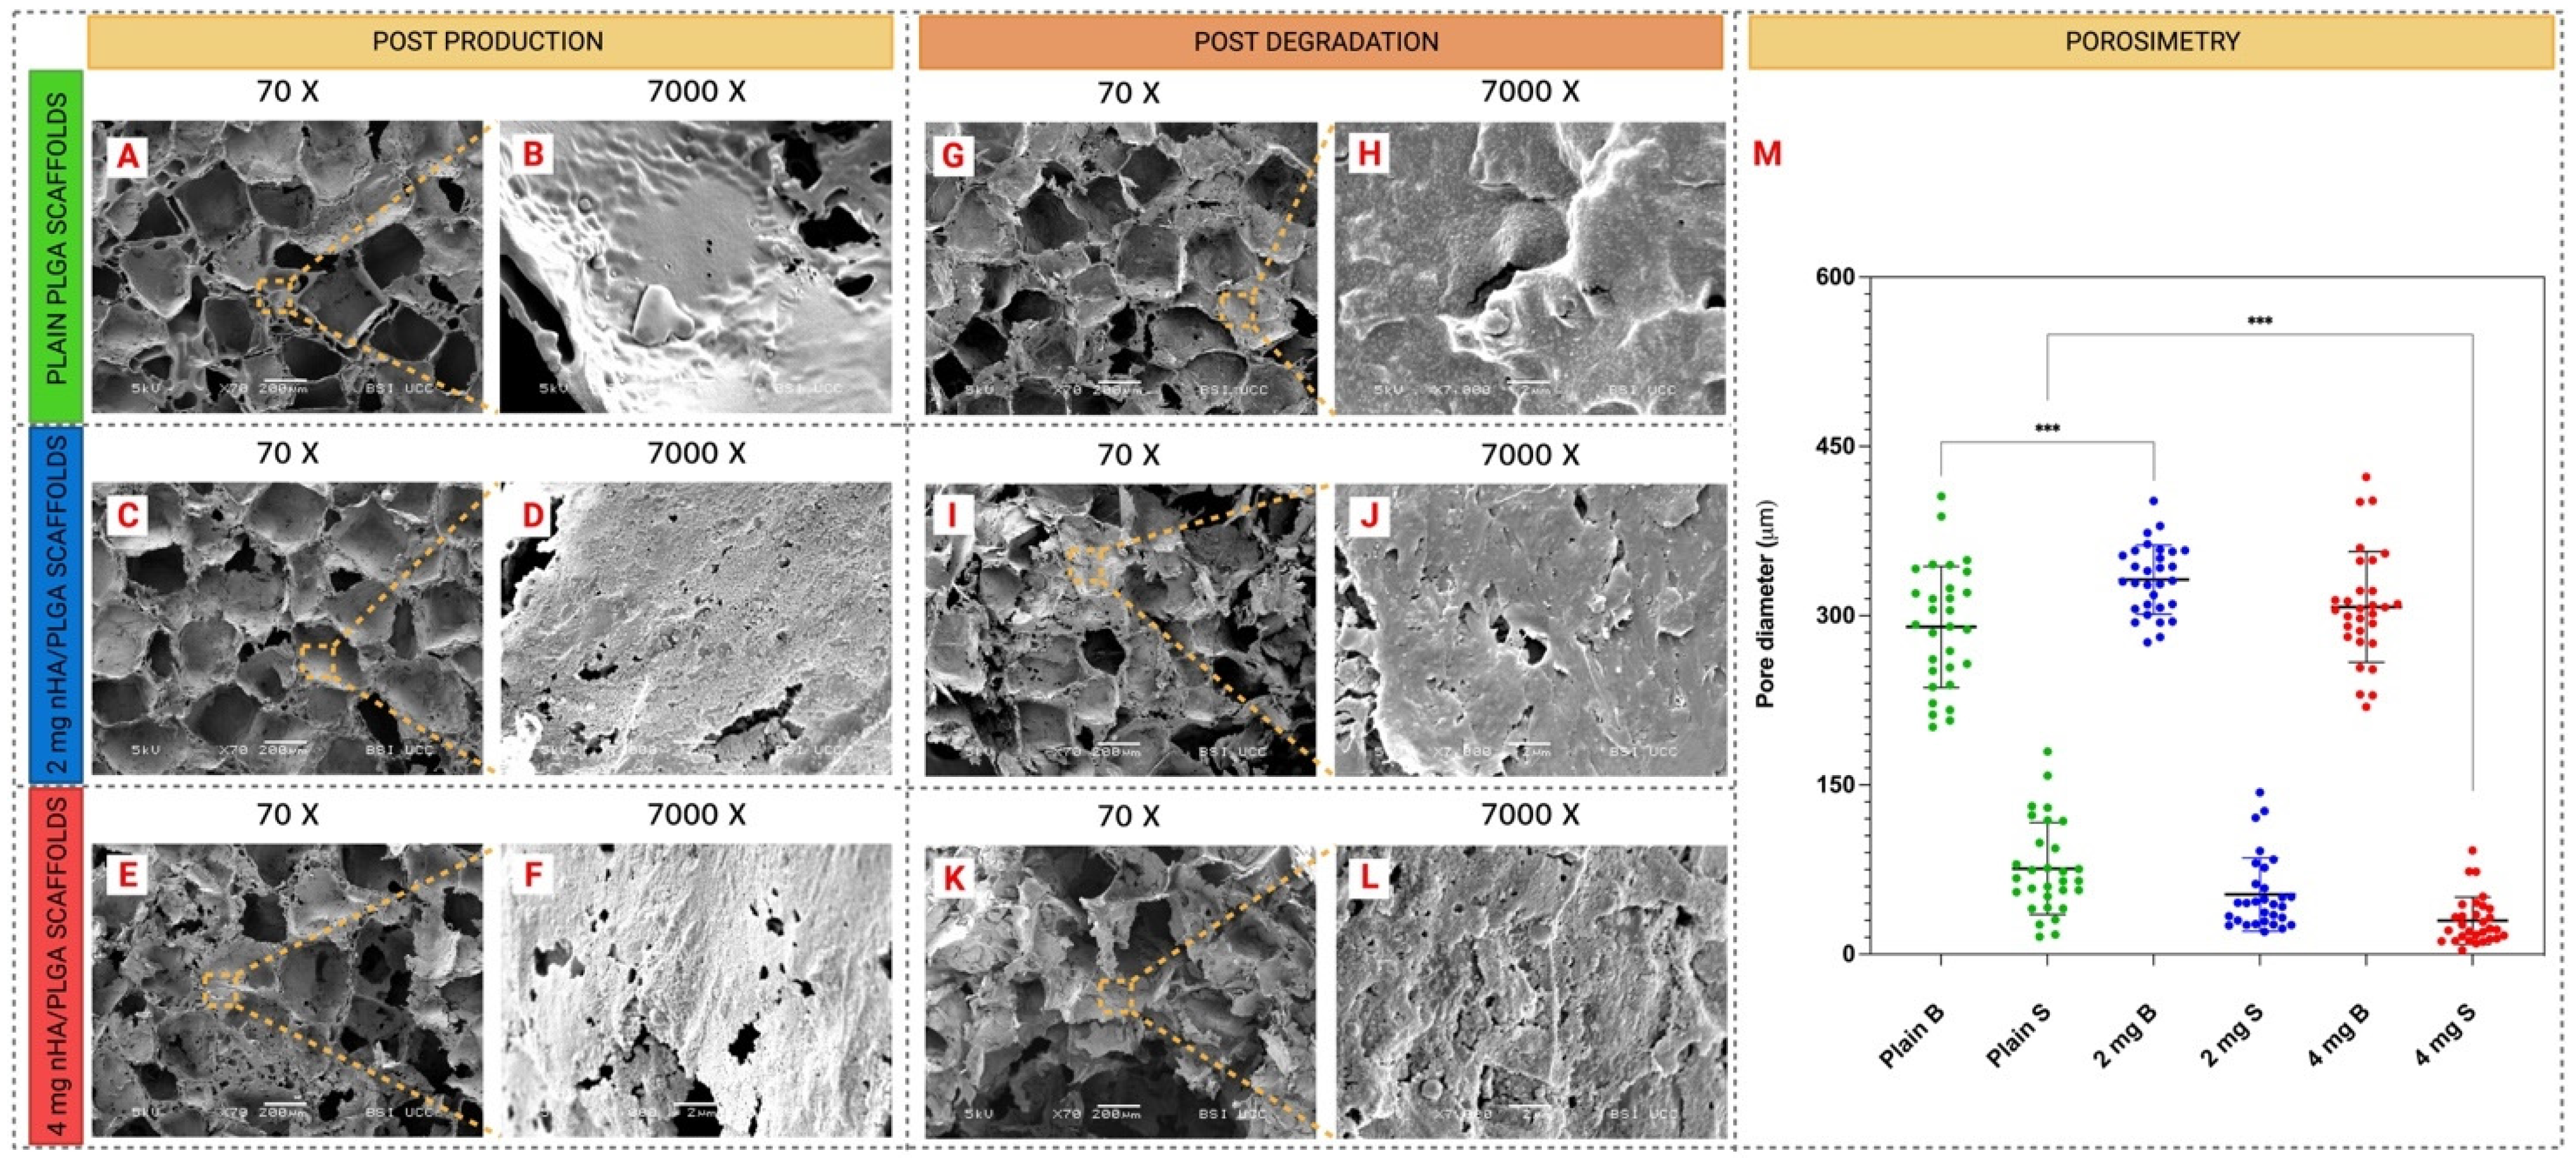
2.2.2. Scanning Electron Microscopy (SEM) Characterization
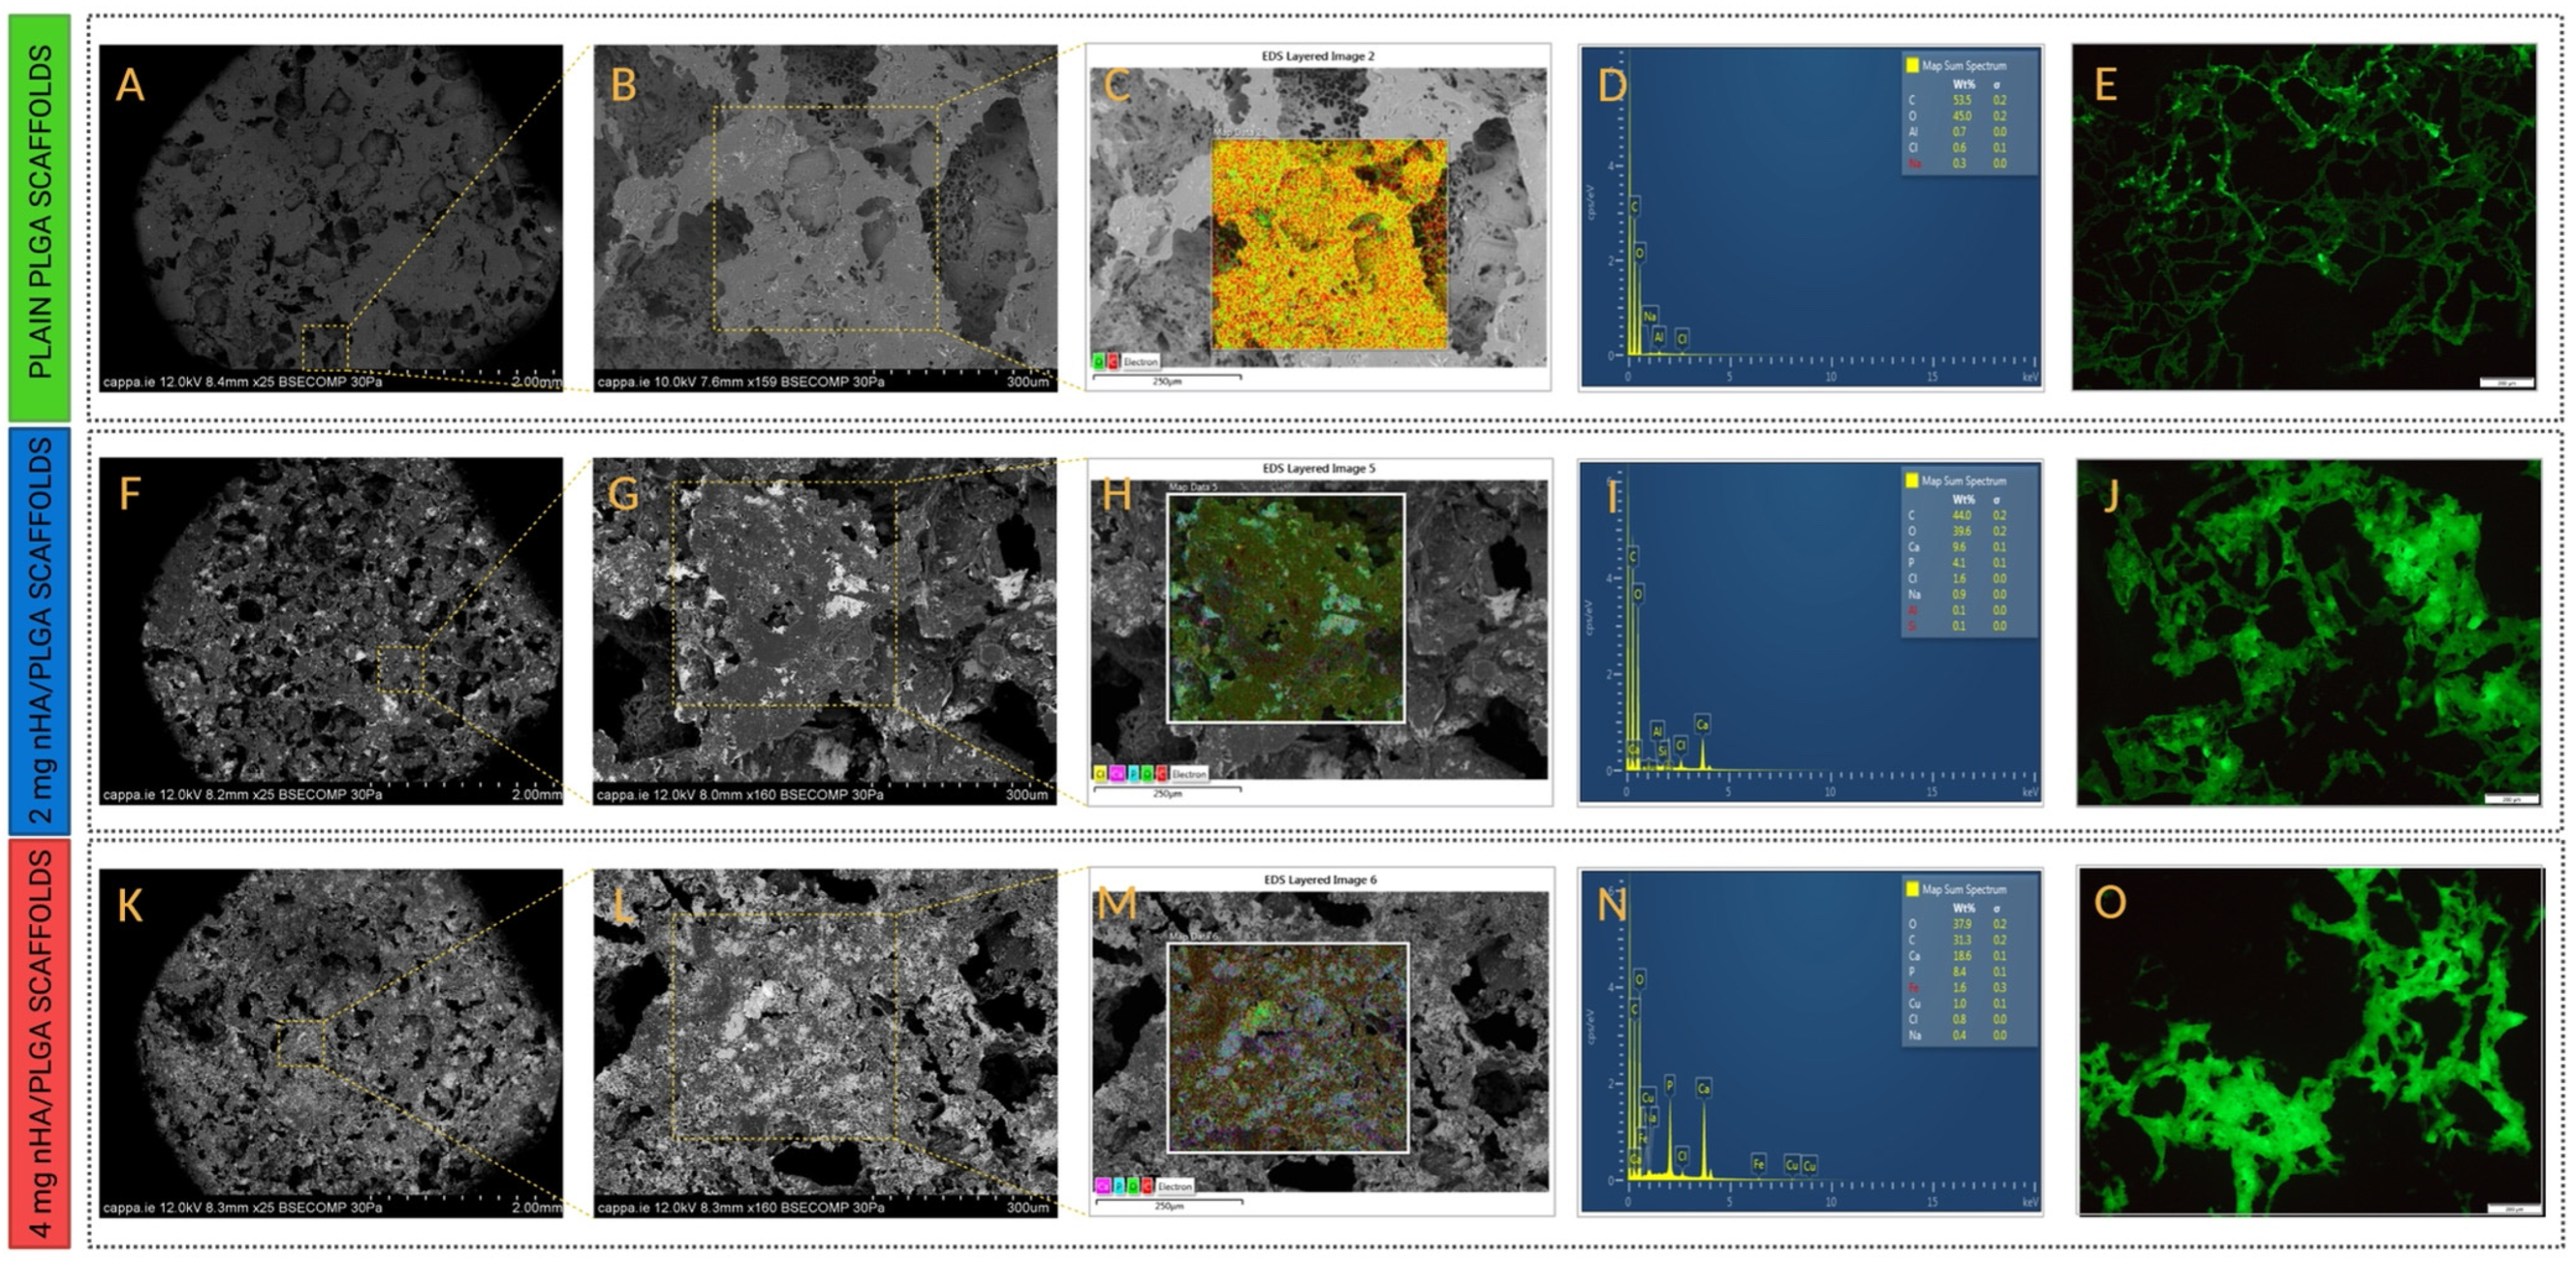
2.2.3. Energy Dispersive X-ray (EDS) Elemental Analysis
2.2.4. Scaffold Composition Analysis by Fluorescence Imaging with Calcein
2.2.5. Mechanical Characterization
2.2.6. Scaffold Degradation Behaviour
2.3. Cell Culture
2.3.1. Cell Proliferation in 2D and 3D
2.3.2. Cell Distribution in 2D and 3D Using Fluorescence Imaging
2.3.3. Determination of Phosphatase Enzyme Activity
2.4. Gene Expression (RT-qPCR)
2.5. Histological Analysis
2.6. Docetaxel Drug Response
2.7. Statistical Analysis
3. Results
3.1. Scaffold Fabrication
3.2. Scaffold Characterisation
3.2.1. Porosity Measurements
3.2.2. Scanning Electron Microscopy (SEM) Characterization
3.2.3. Energy Dispersive X-ray (EDS) Elemental Analysis
3.2.4. Calcium Distribution Using Calcein Staining
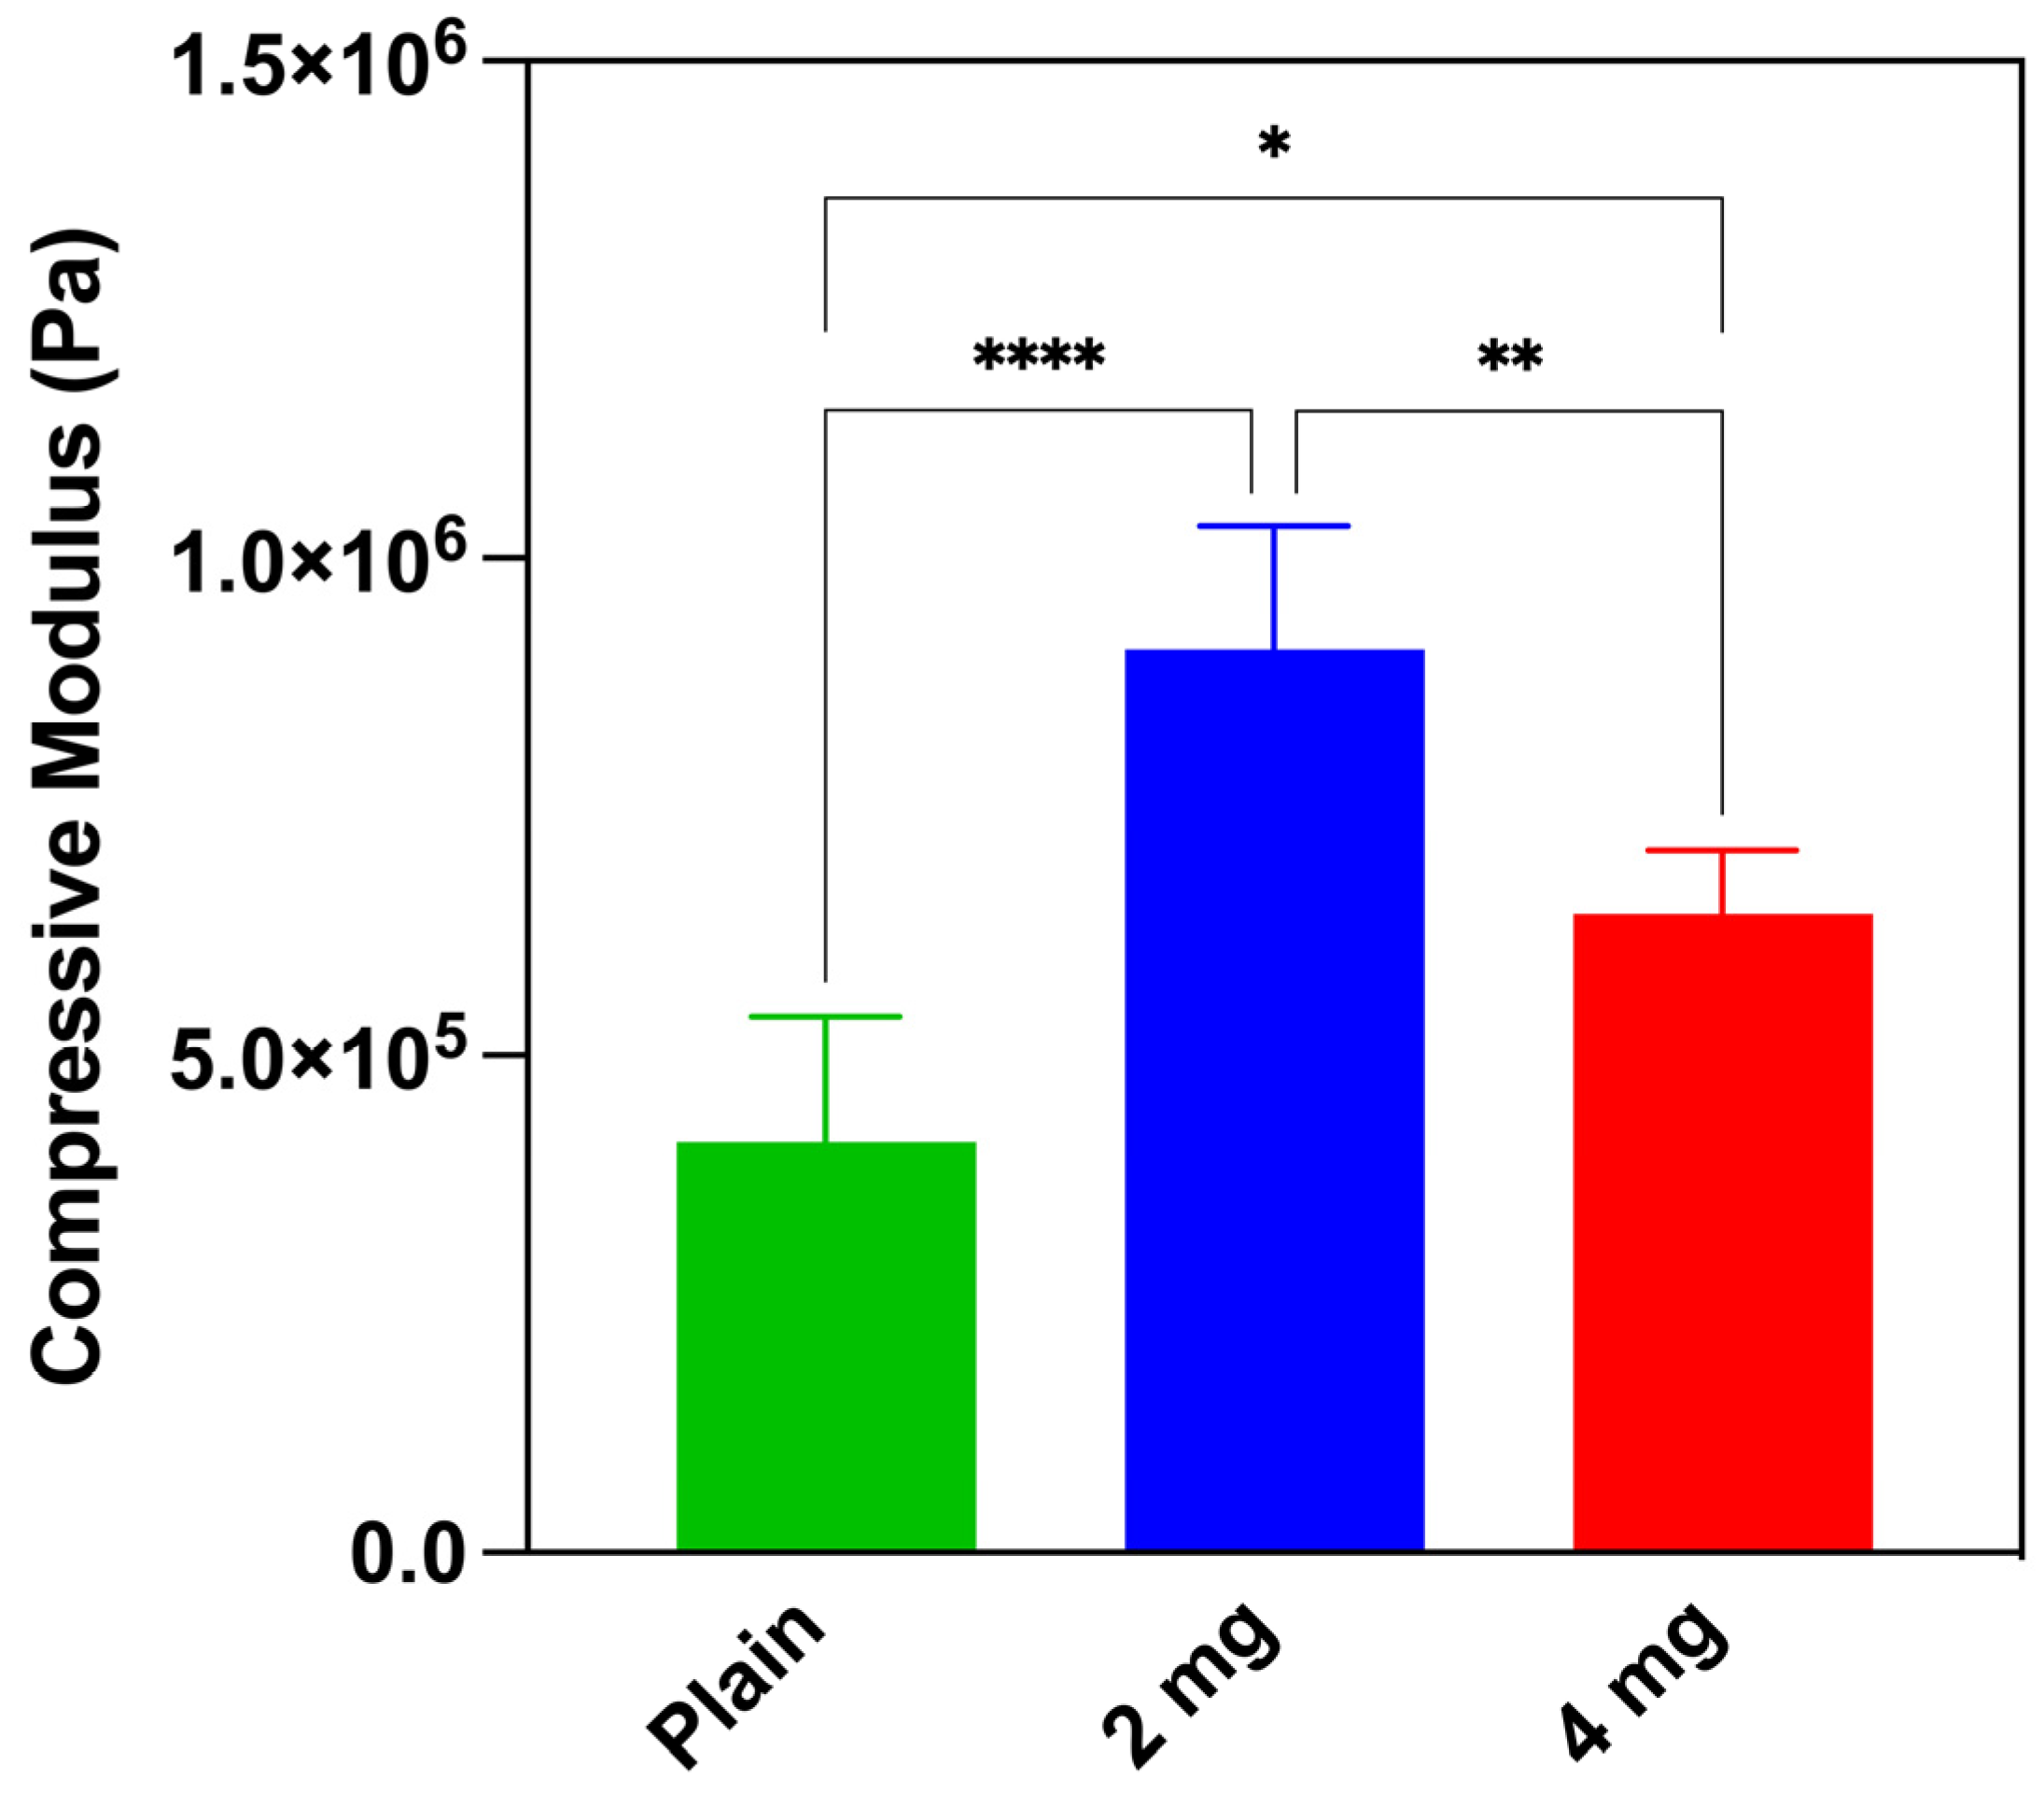
3.2.5. Mechanical Characterization
3.2.6. Scaffold Degradation Behaviour
3.3. Cell Behaviour in 2D and 3D
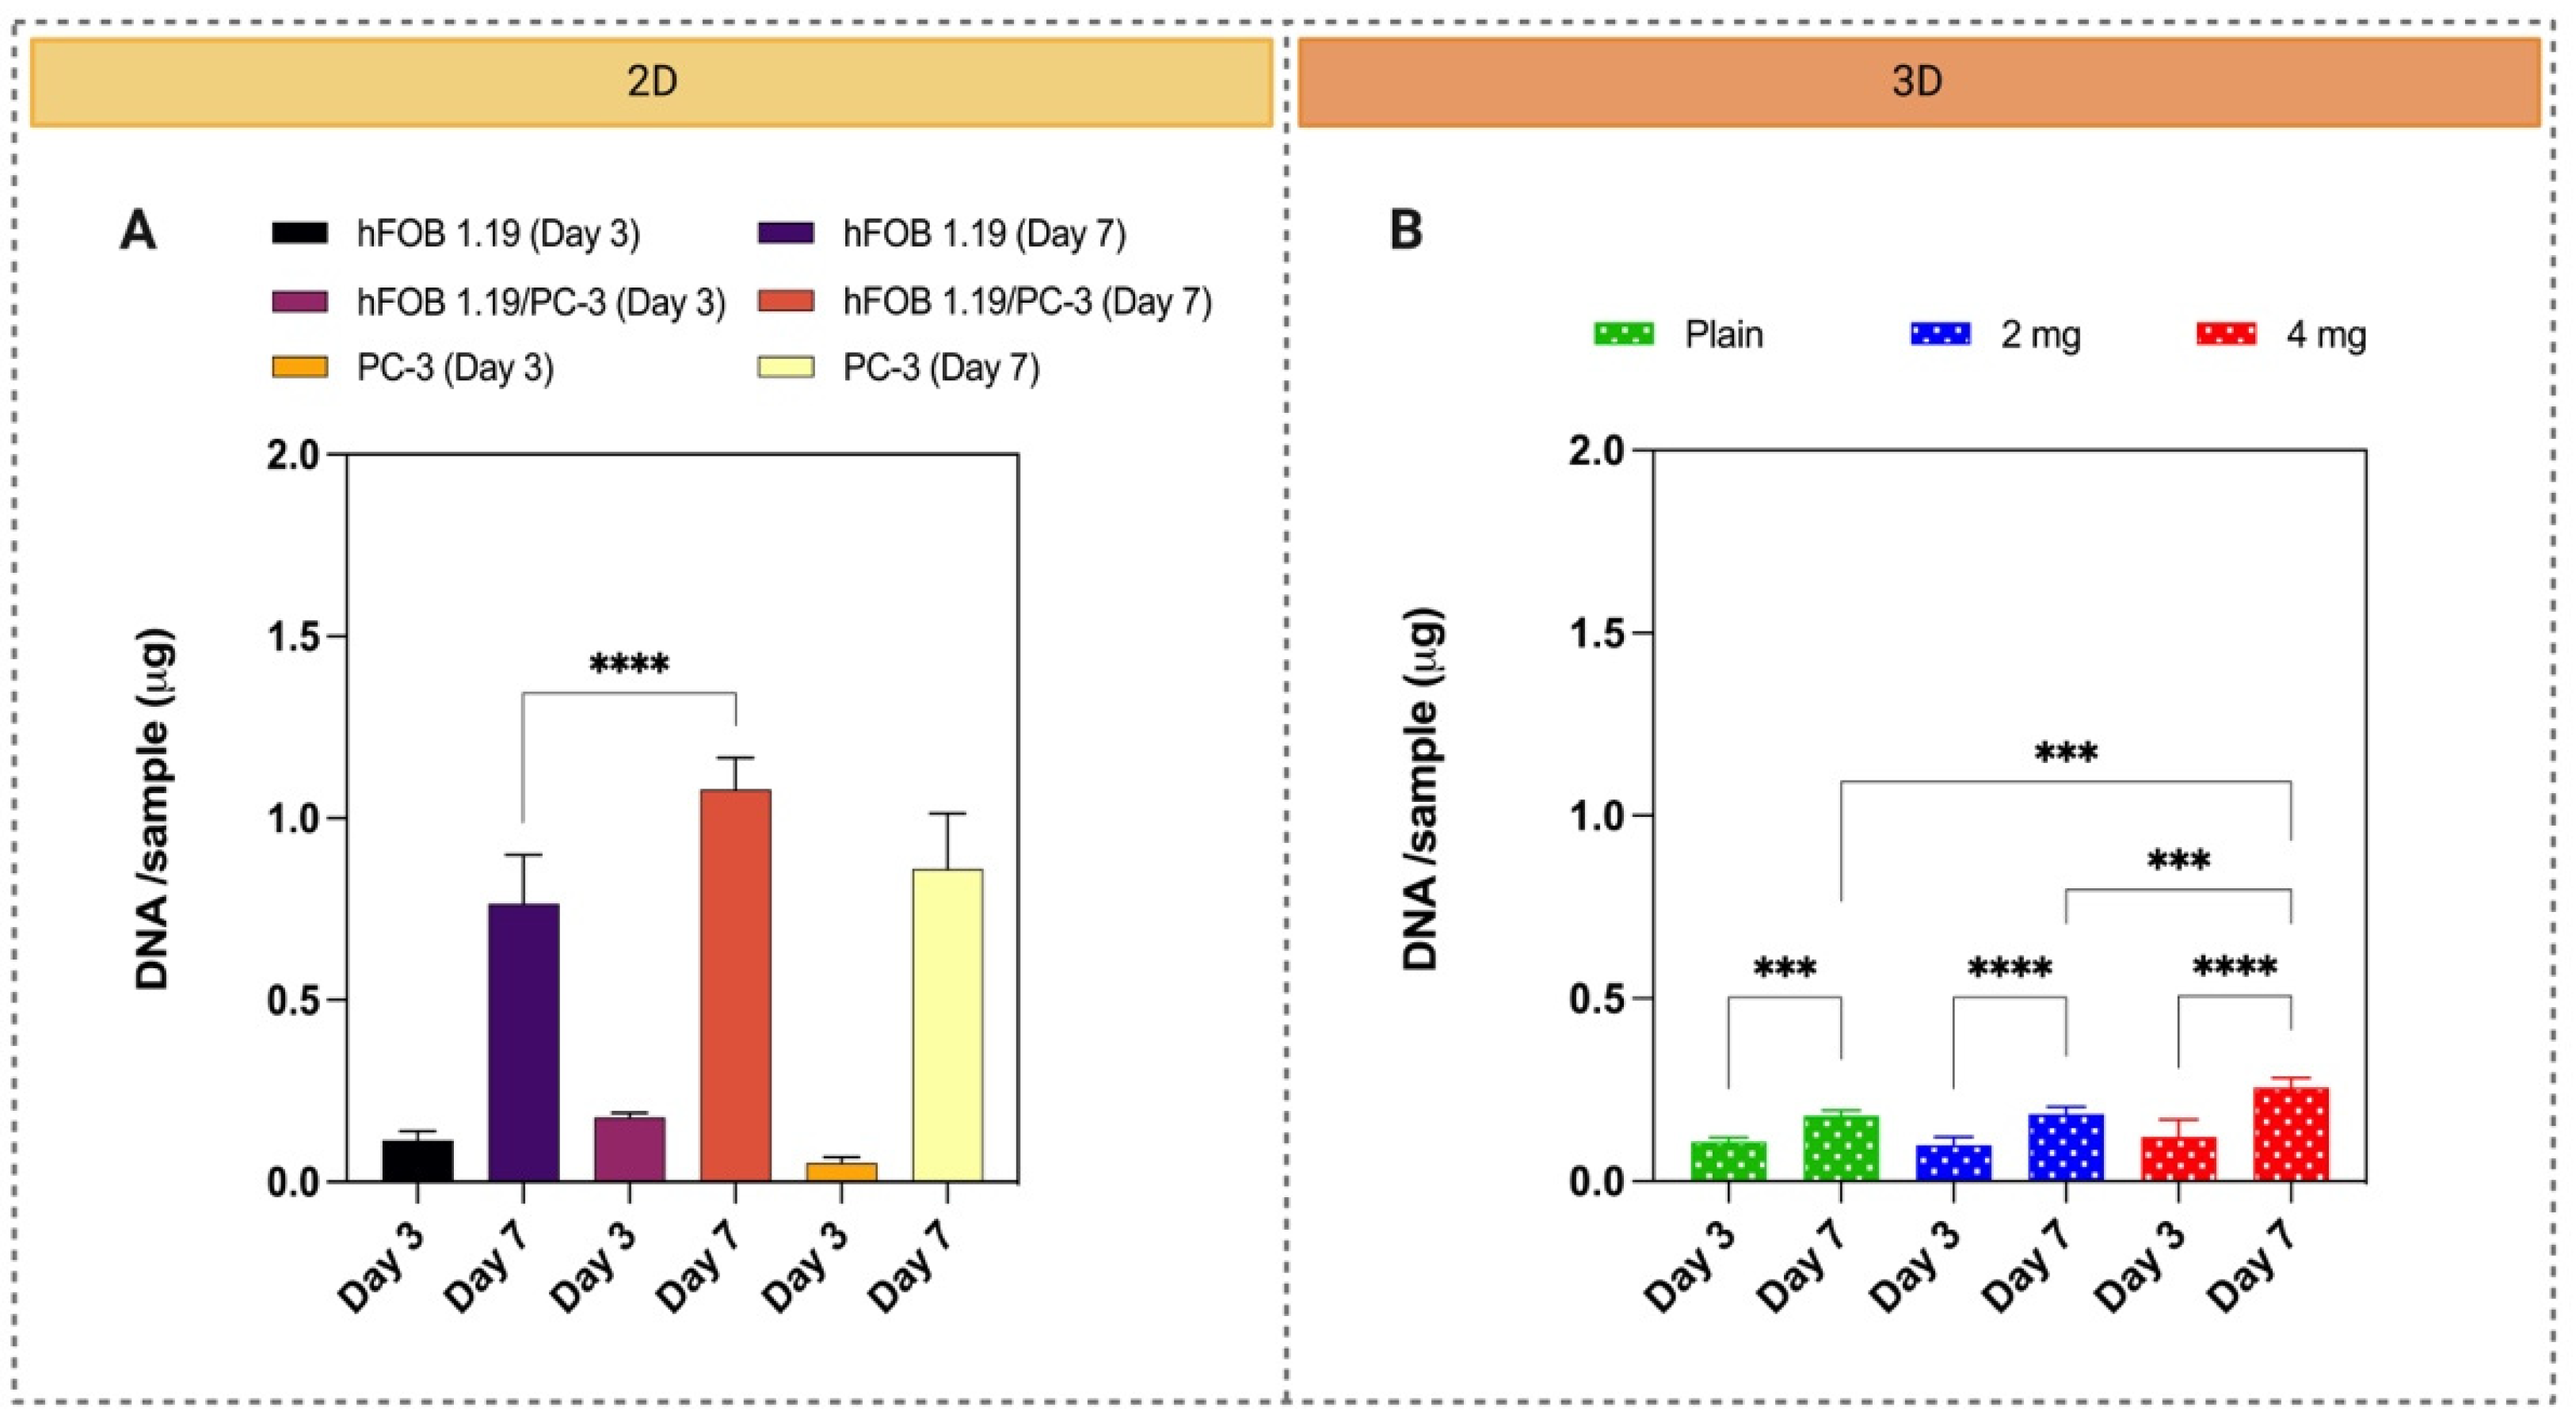
3.3.1. Cell Viability in 2D and 3D
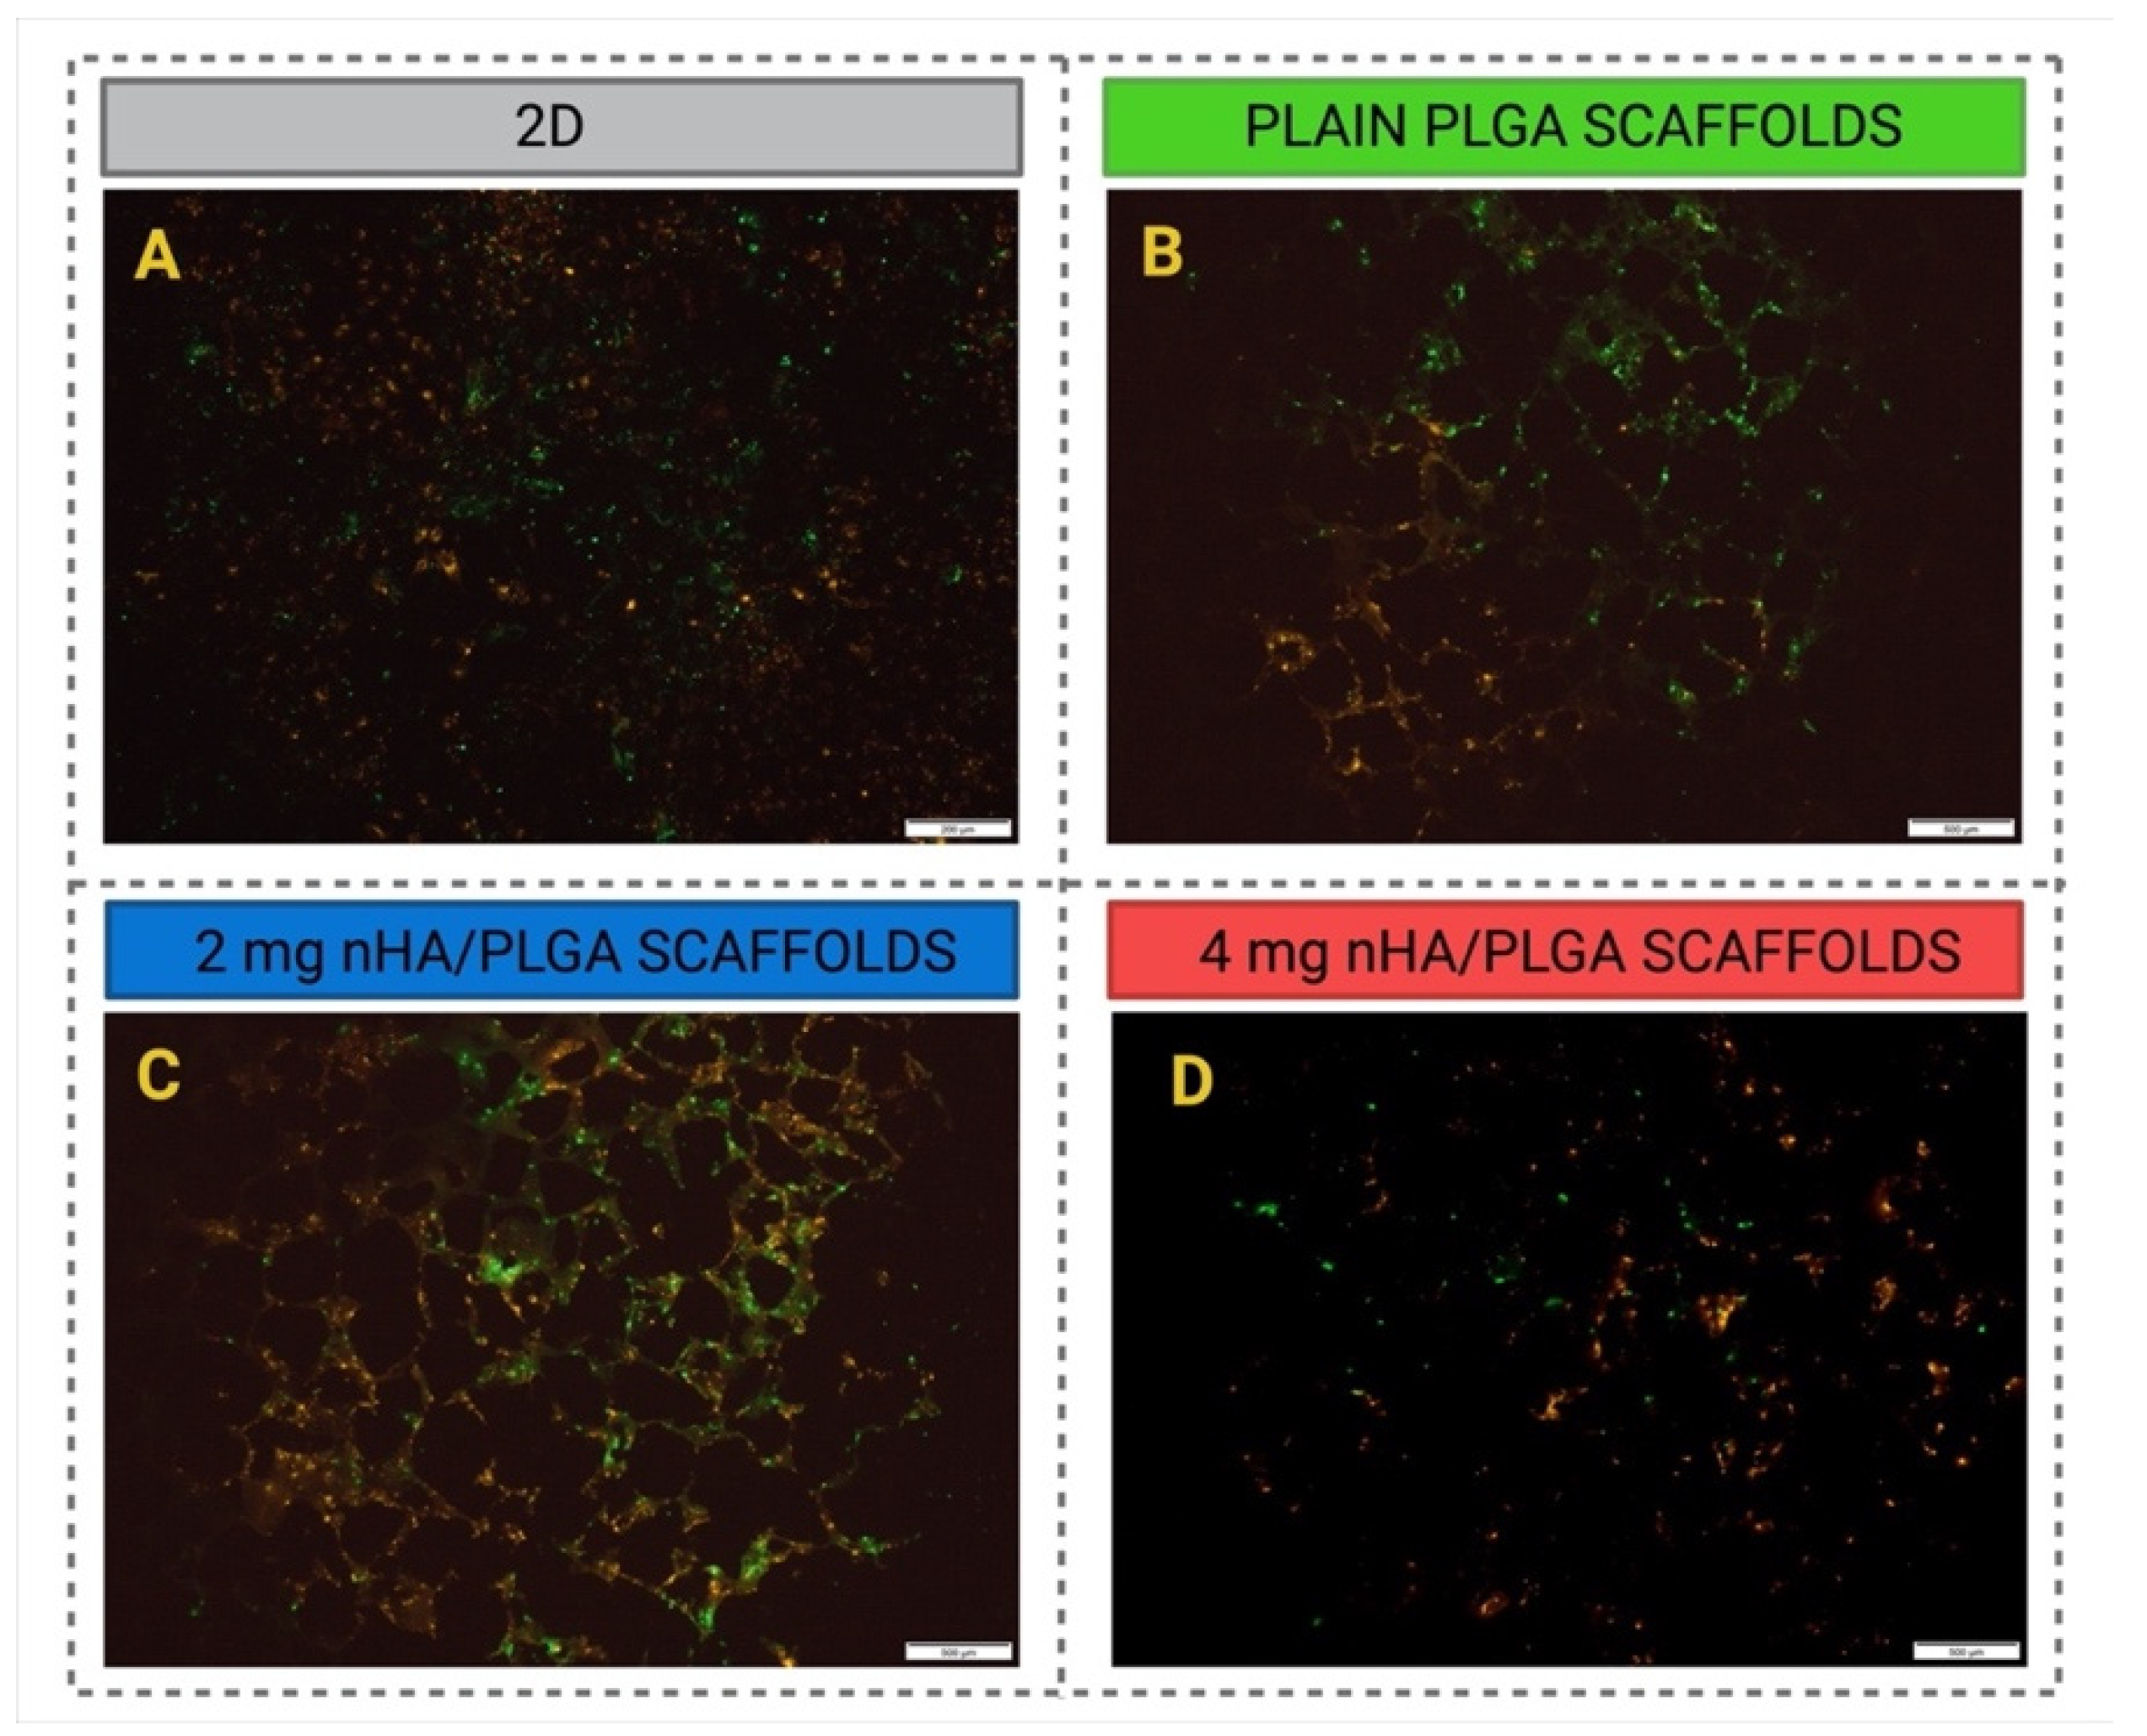
3.3.2. Cell Distribution in 2D and 3D Using Fluorescence Imaging
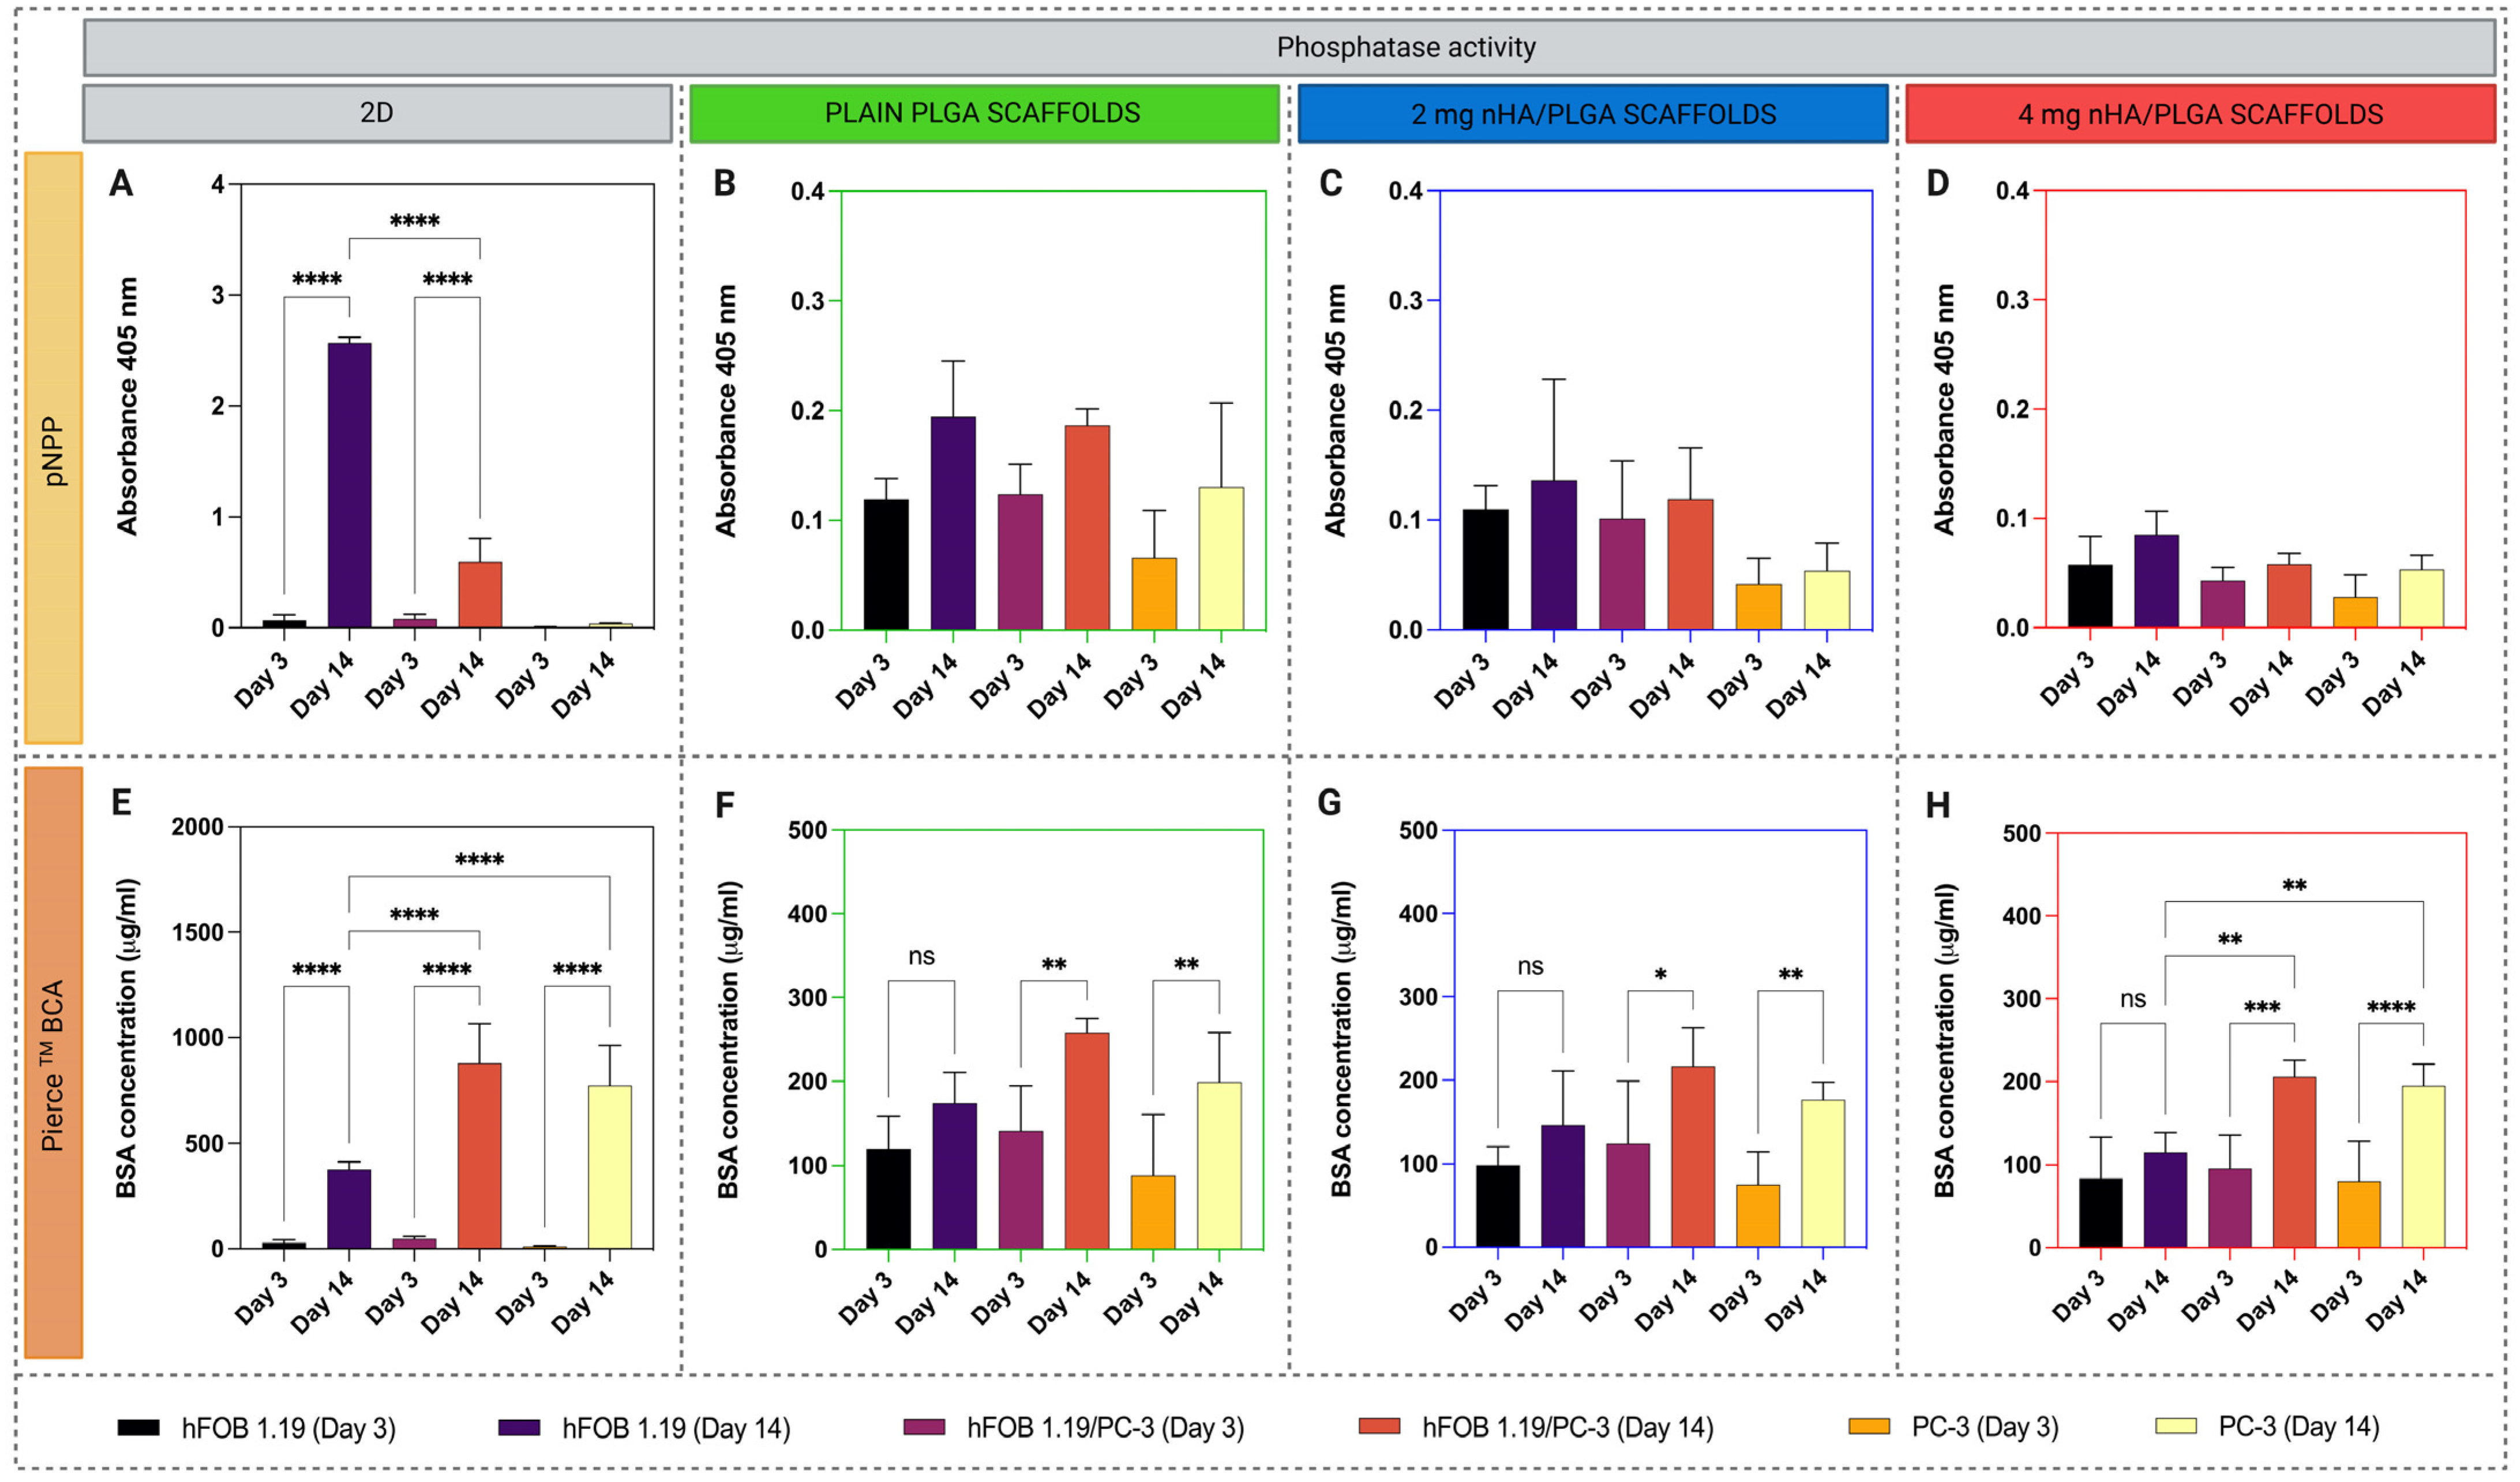
3.3.3. Determination of Phosphatase Activity
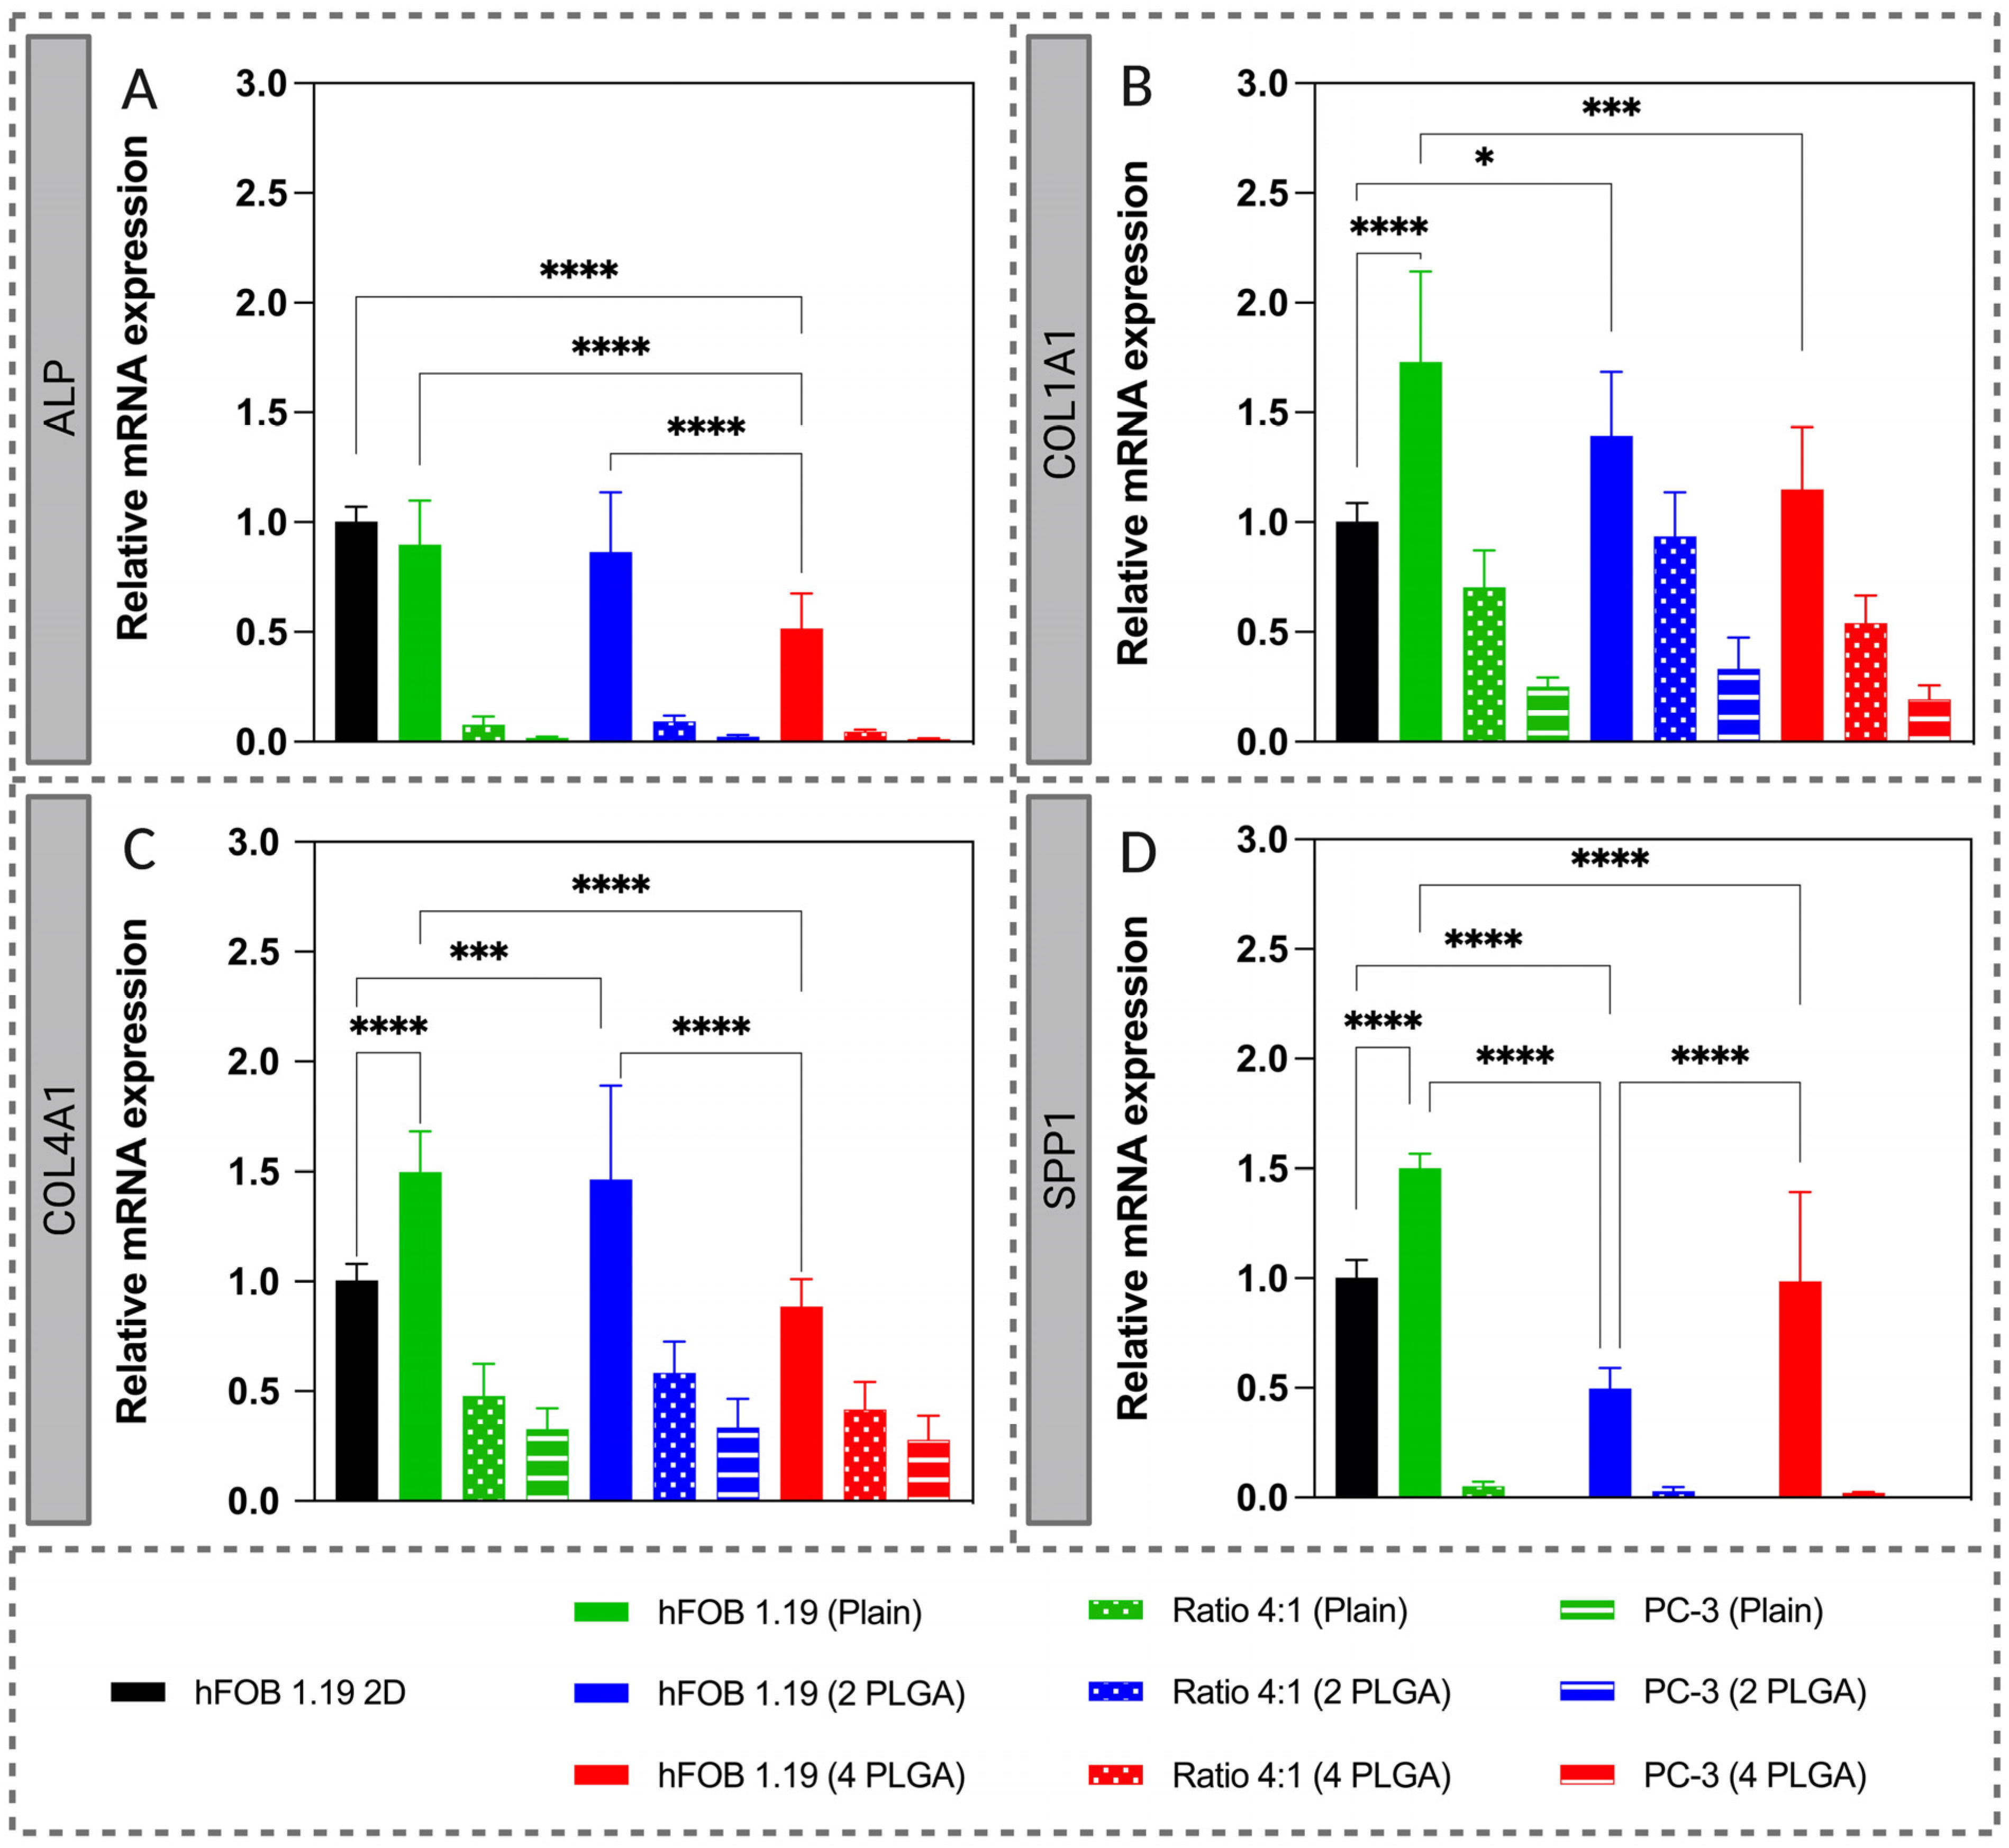
3.4. Gene Expression (RT-qPCR)
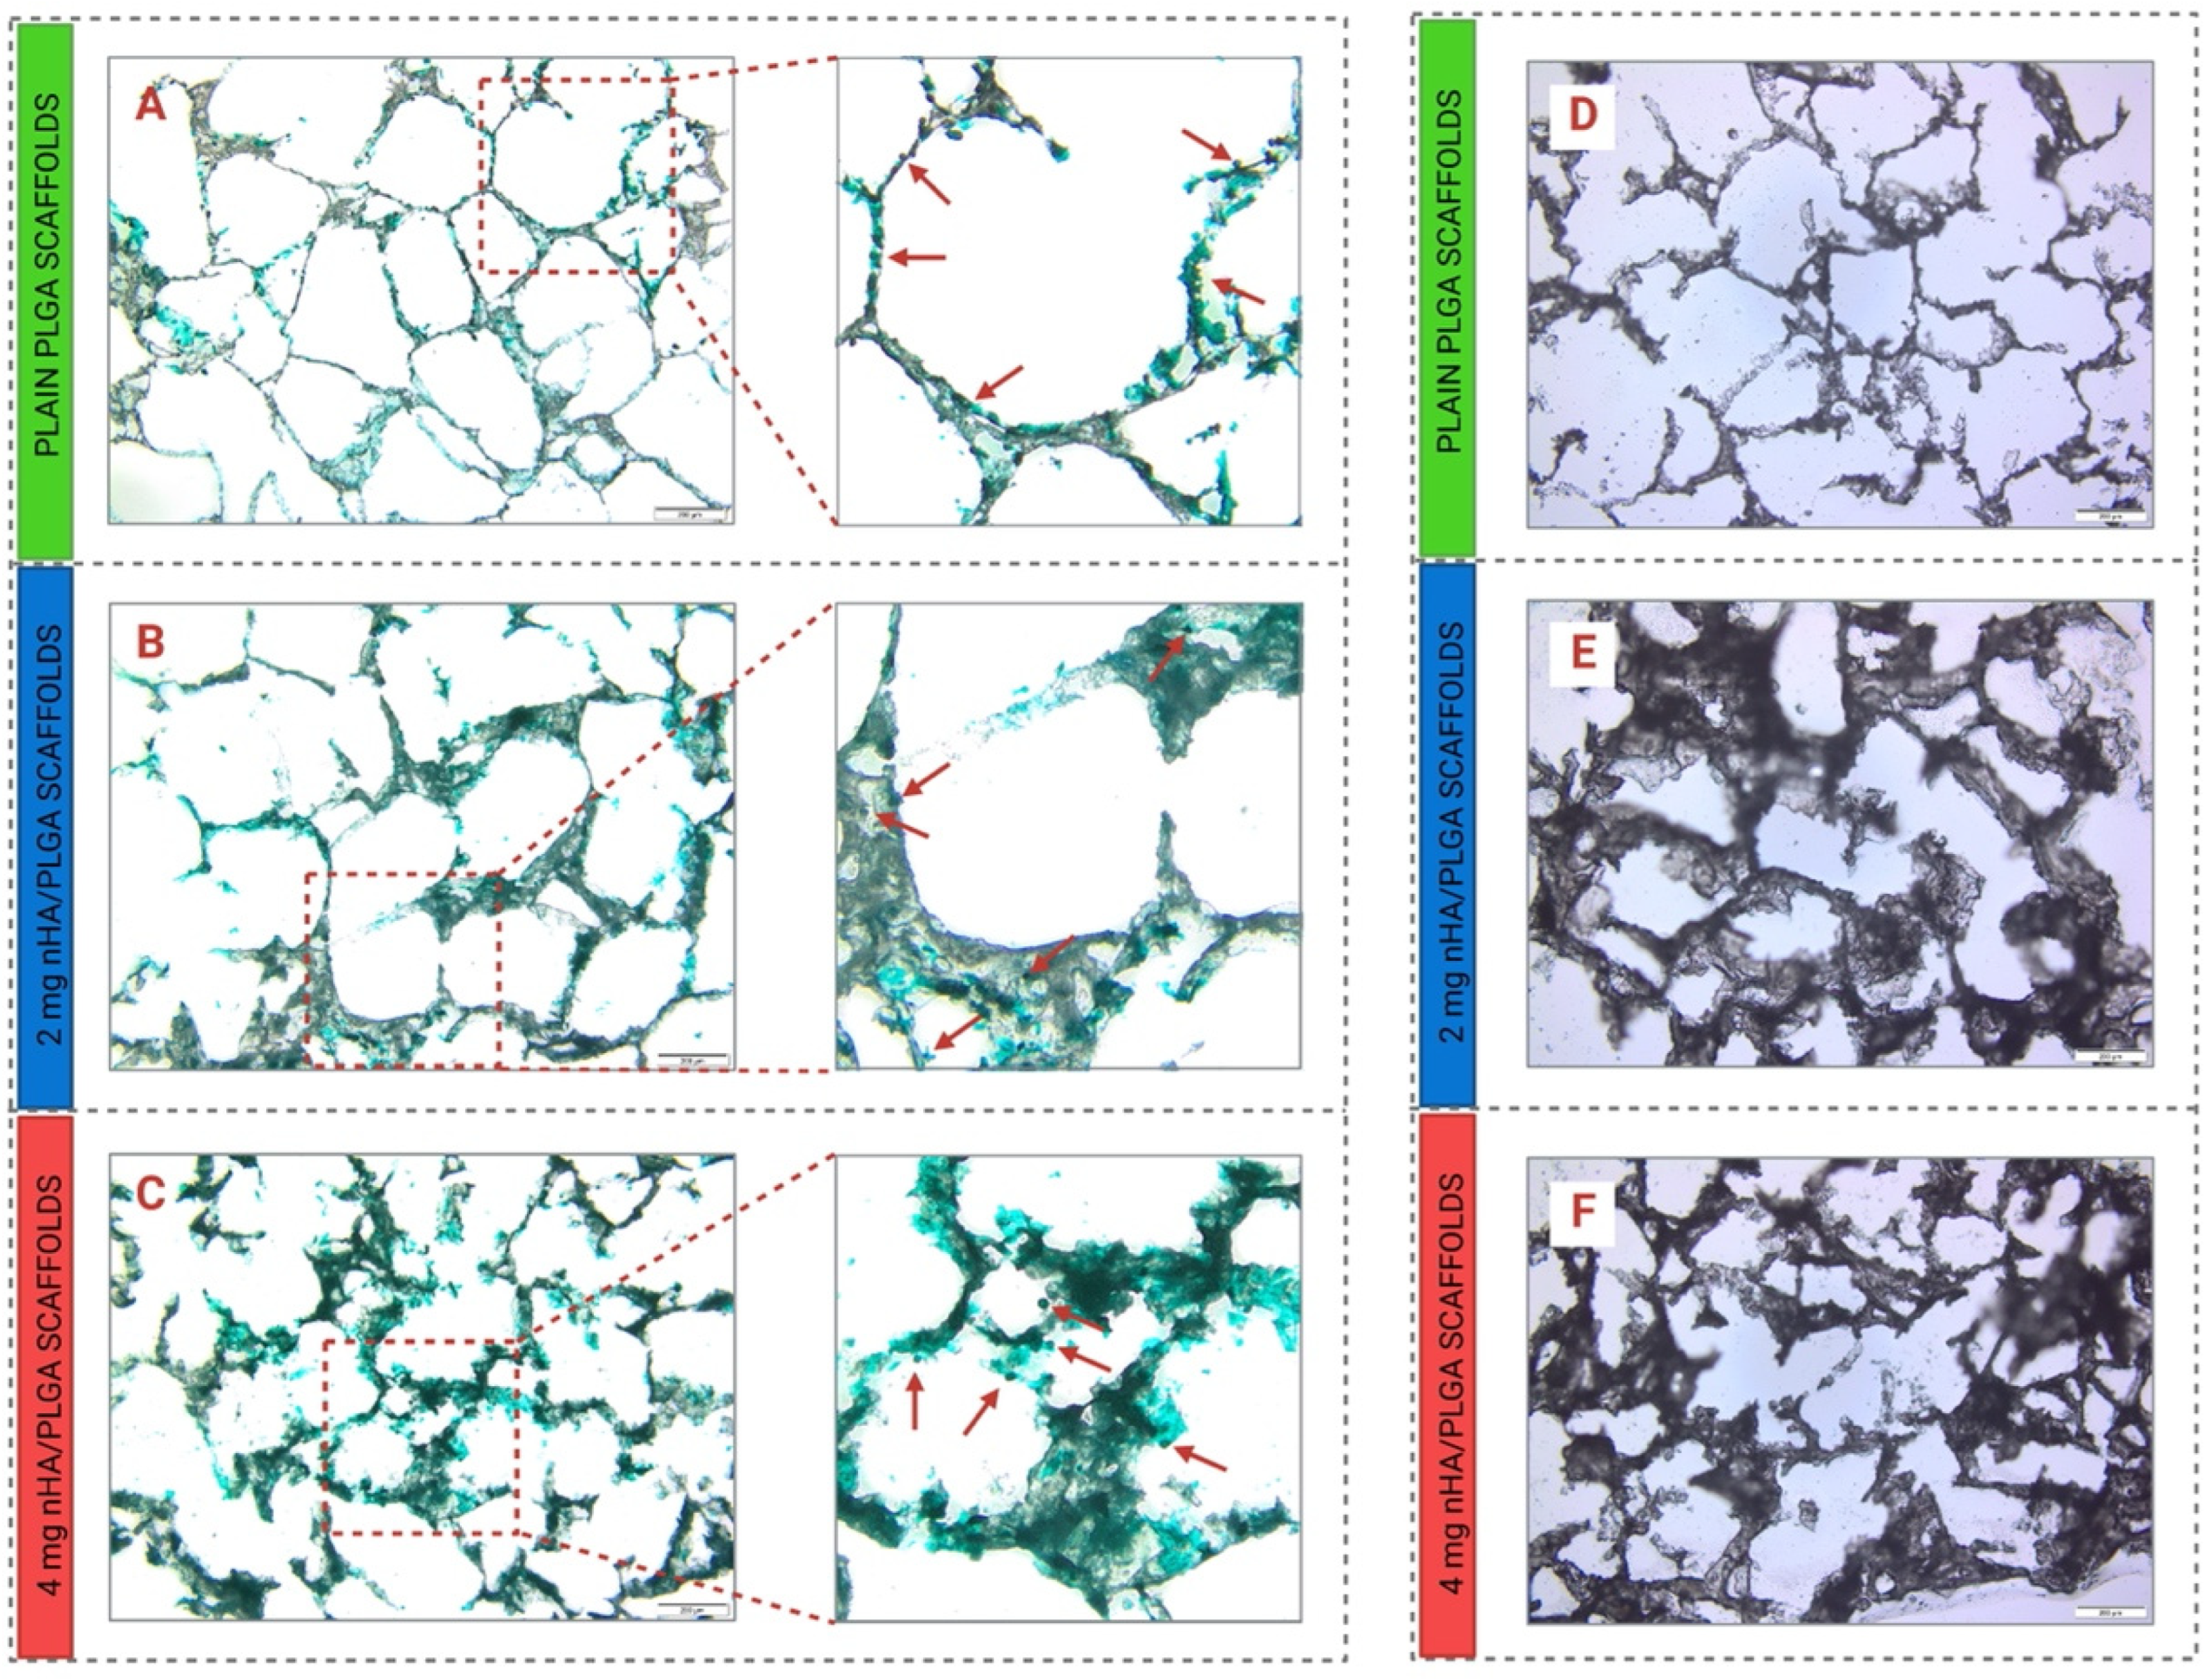
3.5. Histological Analysis
3.6. Docetaxel Drug Response
4. Discussion
5. Conclusions
Supplementary Materials
Author Contributions
Funding
Data Availability Statement
Acknowledgments
Conflicts of Interest
References
- Sung, H.; Ferlay, J.; Siegel, R.L.; Laversanne, M.; Soerjomataram, I.; Jemal, A.; Bray, F. Global Cancer Statistics 2020: GLOBOCAN Estimates of Incidence and Mortality Worldwide for 36 Cancers in 185 Countries. CA. Cancer J. Clin. 2021, 71, 209–249. [Google Scholar] [CrossRef]
- American Cancer Society Key Statistics for Prostate Cancer. Available online: https://www.cancer.org/cancer/prostate-cancer/about/key-statistics.html (accessed on 27 January 2021).
- Kang, J.; La Manna, F.; Bonollo, F.; Sampson, N.; Alberts, I.L.; Mingels, C.; Afshar-Oromieh, A.; Thalmann, G.N.; Karkampouna, S. Tumor microenvironment mechanisms and bone metastatic disease progression of prostate cancer. Cancer Lett. 2022, 530, 156–169. [Google Scholar] [CrossRef]
- Wong, S.K.; Mohamad, N.V.; Giaze, T.R.; Chin, K.Y.; Mohamed, N.; Ima-Nirwana, S. Prostate cancer and bone metastases: The underlying mechanisms. Int. J. Mol. Sci. 2019, 20, 2587. [Google Scholar] [CrossRef] [Green Version]
- Ihle, C.L.; Provera, M.D.; Straign, D.M.; Smith, E.E.; Edgerton, S.M.; Van Bokhoven, A.; Lucia, M.S.; Owens, P. Distinct tumor microenvironments of lytic and blastic bone metastases in prostate cancer patients. J. Immunother. Cancer 2019, 7, 1–9. [Google Scholar] [CrossRef] [Green Version]
- Keller, E.T.; Brown, J. Prostate cancer bone metastases promote both osteolytic and osteoblastic activity. J. Cell. Biochem. 2004, 91, 718–729. [Google Scholar] [CrossRef] [Green Version]
- Macedo, F.; Ladeira, K.; Pinho, F.; Saraiva, N.; Bonito, N.; Pinto, L.; Gonçalves, F. Bone metastases: An overview. Oncol. Rev. 2017, 11, 321. [Google Scholar] [CrossRef] [Green Version]
- Forde, P.F.; Ryan, K.B. Biomaterial-mediated drug delivery in primary and metastatic cancers of the bone. In Orthopedic Biomaterials: Advances and Applications; Springer International Publishing: Cham, Switzerland, 2018; pp. 569–604. ISBN 9783319736648. [Google Scholar]
- Lam, T.; Birzniece, V.; McLean, M.; Gurney, H.; Hayden, A.; Cheema, B.S. The Adverse Effects of Androgen Deprivation Therapy in Prostate Cancer and the Benefits and Potential Anti-oncogenic Mechanisms of Progressive Resistance Training. Sport. Med.-Open 2020, 6, 13. [Google Scholar] [CrossRef] [Green Version]
- Karantanos, T.; Corn, P.G.; Thompson, T.C. Prostate cancer progression after androgen deprivation therapy: Mechanisms of castrate resistance and novel therapeutic approaches. Oncogene 2013, 32, 5501–5511. [Google Scholar] [CrossRef]
- Sandhu, S.; Moore, C.M.; Chiong, E.; Beltran, H.; Bristow, R.G.; Williams, S.G. Prostate cancer. Lancet 2021, 398, 1075–1090. [Google Scholar] [CrossRef]
- Kaya, E.; Feuer, D. Prostate cancer: Palliative care and pain relief. Prostate Cancer Prostatic Dis. 2004, 7, 311–315. [Google Scholar] [CrossRef]
- Holm, M.; Doveson, S.; Lindqvist, O.; Wennman-Larsen, A.; Fransson, P. Quality of life in men with metastatic prostate cancer in their final years before death—A retrospective analysis of prospective data. BMC Palliat. Care 2018, 17, 126. [Google Scholar] [CrossRef] [PubMed]
- Powers, E.; Karachaliou, G.S.; Kao, C.; Harrison, M.R.; Hoimes, C.J.; George, D.J.; Armstrong, A.J.; Zhang, T. Novel therapies are changing treatment paradigms in metastatic prostate cancer. J. Hematol. Oncol. 2020, 13, 144. [Google Scholar] [CrossRef]
- Dozzo, A.; Galvin, A.; Shin, J.-W.; Scalia, S.; O’Driscoll, C.M.; Ryan, K.B. Modelling acute myeloid leukemia (AML): What’s new? A transition from the classical to the modern. Drug Deliv. Transl. Res. 2022. [Google Scholar] [CrossRef] [PubMed]
- Burdett, E.; Kasper, F.K.; Mikos, A.G.; Ludwig, J.A. Engineering tumors: A tissue engineering perspective in cancer biology. Tissue Eng. Part B. Rev. 2010, 16, 351–359. [Google Scholar] [CrossRef] [PubMed]
- Costard, L.S.; Hosn, R.R.; Ramanayake, H.; O’Brien, F.J.; Curtin, C.M. Influences of the 3D microenvironment on cancer cell behaviour and treatment responsiveness: A recent update on lung, breast and prostate cancer models. Acta Biomater. 2021, 132, 360–378. [Google Scholar] [CrossRef] [PubMed]
- Chaicharoenaudomrung, N.; Kunhorm, P.; Noisa, P. Three-dimensional cell culture systems as an in vitro platform for cancer and stem cell modeling. World J. Stem Cells 2019, 11, 1065–1083. [Google Scholar] [CrossRef] [PubMed]
- Breslin, S.; O’Driscoll, L. Three-dimensional cell culture: The missing link in drug discovery. Drug Discov. Today 2013, 18, 240–249. [Google Scholar] [CrossRef]
- Nii, T.; Makino, K.; Tabata, Y. Three-Dimensional Culture System of Cancer Cells Combined with Biomaterials for Drug Screening. Cancers 2020, 12, 2754. [Google Scholar] [CrossRef]
- Pozzi, S.; Scomparin, A.; Israeli Dangoor, S.; Rodriguez Ajamil, D.; Ofek, P.; Neufeld, L.; Krivitsky, A.; Vaskovich-Koubi, D.; Kleiner, R.; Dey, P.; et al. Meet me halfway: Are in vitro 3D cancer models on the way to replace in vivo models for nanomedicine development? Adv. Drug Deliv. Rev. 2021, 175, 113760. [Google Scholar] [CrossRef]
- Wang, N.; Reeves, K.J.; Brown, H.K.; Fowles, A.C.M.; Docherty, F.E.; Ottewell, P.D.; Croucher, P.I.; Holen, I.; Eaton, C.L. The frequency of osteolytic bone metastasis is determined by conditions of the soil, not the number of seeds; evidence from in vivo models of breast and prostate cancer. J. Exp. Clin. Cancer Res. 2015, 34, 124. [Google Scholar] [CrossRef]
- Nii, T.; Makino, K.; Tabata, Y. A Cancer Invasion Model Combined with Cancer-Associated Fibroblasts Aggregates Incorporating Gelatin Hydrogel Microspheres Containing a p53 Inhibitor. Tissue Eng. Part C Methods 2019, 25, 711–720. [Google Scholar] [CrossRef] [PubMed]
- Ahn, Y.H.; Ren, L.; Kim, S.M.; Seo, S.-H.; Jung, C.-R.; Kim, D.S.; Noh, J.-Y.; Lee, S.Y.; Lee, H.; Cho, M.Y.; et al. A three-dimensional hyaluronic acid-based niche enhances the therapeutic efficacy of human natural killer cell-based cancer immunotherapy. Biomaterials 2020, 247, 119960. [Google Scholar] [CrossRef]
- Fontana, F.; Raimondi, M.; Marzagalli, M.; Sommariva, M.; Gagliano, N.; Limonta, P. Three-Dimensional Cell Cultures as an In Vitro Tool for Prostate Cancer Modeling and Drug Discovery. Int. J. Mol. Sci. 2020, 21, 6806. [Google Scholar] [CrossRef] [PubMed]
- Campbell, J.J.; Husmann, A.; Hume, R.D.; Watson, C.J.; Cameron, R.E. Development of three-dimensional collagen scaffolds with controlled architecture for cell migration studies using breast cancer cell lines. Biomaterials 2017, 114, 34–43. [Google Scholar] [CrossRef] [Green Version]
- Fong, E.L.S.; Wan, X.; Yang, J.; Morgado, M.; Mikos, A.G.; Harrington, D.A.; Navone, N.M.; Farach-Carson, M.C. A 3D in vitro model of patient-derived prostate cancer xenograft for controlled interrogation of in vivo tumor-stromal interactions. Biomaterials 2016, 77, 164–172. [Google Scholar] [CrossRef] [PubMed] [Green Version]
- Florczyk, S.J.; Liu, G.; Kievit, F.M.; Lewis, A.M.; Wu, J.D.; Zhang, M. 3D Porous Chitosan–Alginate Scaffolds: A New Matrix for Studying Prostate Cancer Cell–Lymphocyte Interactions In Vitro. Adv. Healthc. Mater. 2012, 1, 590–599. [Google Scholar] [CrossRef] [Green Version]
- O’Brien, F.J. Biomaterials & scaffolds for tissue engineering. Mater. Today 2011, 14, 88–95. [Google Scholar] [CrossRef]
- Dwivedi, R.; Kumar, S.; Pandey, R.; Mahajan, A.; Nandana, D.; Katti, D.S.; Mehrotra, D. Polycaprolactone as biomaterial for bone scaffolds: Review of literature. J. Oral Biol. Craniofacial Res. 2020, 10, 381–388. [Google Scholar] [CrossRef]
- Pan, Z.; Ding, J. Poly(lactide-co-glycolide) porous scaffolds for tissue engineering and regenerative medicine. Interface Focus 2012, 2, 366–377. [Google Scholar] [CrossRef] [Green Version]
- Sartawi, Z.; Waeber, C.; Schipani, E.; Ryan, K.B. Development of electrospun polymer scaffolds for the localized and controlled delivery of siponimod for the management of critical bone defects. Int. J. Pharm. 2020, 590, 119956. [Google Scholar] [CrossRef]
- Feng, X. Chemical and Biochemical Basis of Cell-Bone Matrix Interaction in Health and Disease. Curr. Chem. Biol. 2009, 3, 189–196. [Google Scholar] [CrossRef] [Green Version]
- Shi, H.; Zhou, Z.; Li, W.; Fan, Y.; Li, Z.; Wei, J. Hydroxyapatite Based Materials for Bone Tissue Engineering: A Brief and Comprehensive Introduction. Crystals 2021, 11, 149. [Google Scholar] [CrossRef]
- Ahern, E.; Doody, T.; Ryan, K.B. Bioinspired nanomaterials for bone tissue engineering. In Bioengineered Nanomaterials; Tiwari, A., Tiwari, A., Eds.; CRC Press, Taylor & Francis Group: Boca Raton, FL, USA, 2014; pp. 369–412. ISBN 978-1-4665-8595-9. [Google Scholar]
- O’ Sullivan, C.; Kennedy, G.; O’ Neill, L.; Crean, A.M.; Ryan, K.B. Chapter 5 Inorganic Biomaterials to Support the Formation and Repair of Bone Tissue. In Biomedical Applications of Inorganic Materials; The Royal Society of Chemistry: London, UK, 2022; pp. 242–304. ISBN 978-1-78801-606-3. [Google Scholar]
- Fitzgerald, K.A.; Guo, J.; Tierney, E.G.; Curtin, C.M.; Malhotra, M.; Darcy, R.; O’Brien, F.J.; O’Driscoll, C.M. The use of collagen-based scaffolds to simulate prostate cancer bone metastases with potential for evaluating delivery of nanoparticulate gene therapeutics. Biomaterials 2015, 66, 53–66. [Google Scholar] [CrossRef] [PubMed]
- Bock, N.; Shokoohmand, A.; Kryza, T.; Röhl, J.; Meijer, J.; Tran, P.A.; Nelson, C.C.; Clements, J.A.; Hutmacher, D.W. Engineering osteoblastic metastases to delineate the adaptive response of androgen-deprived prostate cancer in the bone metastatic microenvironment. Bone Res. 2019, 7, 13. [Google Scholar] [CrossRef] [PubMed] [Green Version]
- Sieh, S.; Lubik, A.A.; Clements, J.A.; Nelson, C.C.; Hutmacher, D.W. Interactions between human osteoblasts and prostate cancer cells in a novel 3D in vitro model. Organogenesis 2010, 6, 181–188. [Google Scholar] [CrossRef] [Green Version]
- Rebello, R.J.; Oing, C.; Knudsen, K.E.; Loeb, S.; Johnson, D.C.; Reiter, R.E.; Gillessen, S.; Van der Kwast, T.; Bristow, R.G. Prostate cancer. Nat. Rev. Dis. Prim. 2021, 7, 9. [Google Scholar] [CrossRef] [PubMed]
- Siegel, R.L.; Miller, K.D.; Jemal, A. Cancer statistics, 2020. CA. Cancer J. Clin. 2020, 70, 7–30. [Google Scholar] [CrossRef] [PubMed]
- Barclay, T.; Petrovsky, N. Chapter Seven-Vaccine Adjuvant Nanotechnologies. In Micro and Nano Technologies; Skwarczynski, M., Toth, I., Eds.; William Andrew Publishing: Norwich, NY, USA, 2017; pp. 127–147. ISBN 978-0-323-39981-4. [Google Scholar]
- Han, Y.; Li, S.; Wang, X.; Bauer, I.; Yin, M. Sonochemical preparation of hydroxyapatite nanoparticles stabilized by glycosaminoglycans. Ultrason. Sonochem. 2007, 14, 286–290. [Google Scholar] [CrossRef]
- Williams, J.M.; Adewunmi, A.; Schek, R.M.; Flanagan, C.L.; Krebsbach, P.H.; Feinberg, S.E.; Hollister, S.J.; Das, S. Bone tissue engineering using polycaprolactone scaffolds fabricated via selective laser sintering. Biomaterials 2005, 26, 4817–4827. [Google Scholar] [CrossRef]
- Tomasko, D.L.; Burley, A.; Feng, L.; Yeh, S.-K.; Miyazono, K.; Nirmal-Kumar, S.; Kusaka, I.; Koelling, K. Development of CO2 for polymer foam applications. J. Supercrit. Fluids 2009, 47, 493–499. [Google Scholar] [CrossRef]
- Han, Y.; Lian, M.; Wu, Q.; Qiao, Z.; Sun, B.; Dai, K. Effect of Pore Size on Cell Behavior Using Melt Electrowritten Scaffolds. Front. Bioeng. Biotechnol. 2021, 9, 629270. [Google Scholar] [CrossRef]
- Murphy, C.M.; Haugh, M.G.; O’Brien, F.J. The effect of mean pore size on cell attachment, proliferation and migration in collagen-glycosaminoglycan scaffolds for bone tissue engineering. Biomaterials 2010, 31, 461–466. [Google Scholar] [CrossRef]
- Loh, Q.L.; Choong, C. Three-dimensional scaffolds for tissue engineering applications: Role of porosity and pore size. Tissue Eng.-Part B Rev. 2013, 19, 485–502. [Google Scholar] [CrossRef] [Green Version]
- Stammeier, J.A.; Purgstaller, B.; Hippler, D.; Mavromatis, V.; Dietzel, M. In-situ Raman spectroscopy of amorphous calcium phosphate to crystalline hydroxyapatite transformation. Methods X 2018, 5, 1241–1250. [Google Scholar] [CrossRef]
- Zhang, B.; Wang, L.; Song, P.; Pei, X.; Sun, H.; Wu, L.; Zhou, C.; Wang, K.; Fan, Y.; Zhang, X. 3D printed bone tissue regenerative PLA/HA scaffolds with comprehensive performance optimizations. Mater. Des. 2021, 201, 109490. [Google Scholar] [CrossRef]
- Ginebra, M.P. 10-Cements as bone repair materials. In Woodhead Publishing Series in Biomaterials; Planell, J.A., Best, S.M., Lacroix, D., Merolli, A.B.T.-B.R.B., Eds.; Woodhead Publishing: Sawston, UK, 2009; pp. 271–308. ISBN 978-1-84569-385-5. [Google Scholar]
- Edmondson, R.; Adcock, A.F.; Yang, L. Influence of Matrices on 3D-Cultured Prostate Cancer Cells’ Drug Response and Expression of Drug-Action Associated Proteins. PLoS ONE 2016, 11, e0158116. [Google Scholar] [CrossRef] [Green Version]
- Bray, L.J.; Binner, M.; Holzheu, A.; Friedrichs, J.; Freudenberg, U.; Hutmacher, D.W.; Werner, C. Multi-parametric hydrogels support 3D in vitro bioengineered microenvironment models of tumour angiogenesis. Biomaterials 2015, 53, 609–620. [Google Scholar] [CrossRef] [Green Version]
- Cruz-Neves, S.; Ribeiro, N.; Graça, I.; Jerónimo, C.; Sousa, S.R.; Monteiro, F.J. Behavior of prostate cancer cells in a nanohydroxyapatite/collagen bone scaffold. J. Biomed. Mater. Res. A 2017, 105, 2035–2046. [Google Scholar] [CrossRef]
- Xu, K.; Wang, Z.; Copland, J.A.; Chakrabarti, R.; Florczyk, S.J. 3D porous chitosan-chondroitin sulfate scaffolds promote epithelial to mesenchymal transition in prostate cancer cells. Biomaterials 2020, 254, 120126. [Google Scholar] [CrossRef]
- Windus, L.C.E.; Glover, T.T.; Avery, V.M. Bone-stromal cells up-regulate tumourigenic markers in a tumour-stromal 3D model of prostate cancer. Mol. Cancer 2013, 12, 112. [Google Scholar] [CrossRef]
- Ardura, J.A.; Álvarez-Carrión, L.; Gutiérrez-Rojas, I.; Alonso, V. Role of Calcium Signaling in Prostate Cancer Progression: Effects on Cancer Hallmarks and Bone Metastatic Mechanisms. Cancers 2020, 12, 1071. [Google Scholar] [CrossRef]
- Curtin, P.; Youm, H.; Salih, E. Three-dimensional cancer-bone metastasis model using ex-vivo co-cultures of live calvarial bones and cancer cells. Biomaterials 2012, 33, 1065–1078. [Google Scholar] [CrossRef] [Green Version]
- Molla, M.S.; Katti, D.R.; Katti, K.S. In vitro design of mesenchymal to epithelial transition of prostate cancer metastasis using 3D nanoclay bone-mimetic scaffolds. J. Tissue Eng. Regen. Med. 2018, 12, 727–737. [Google Scholar] [CrossRef]
- Choudhary, S.; Ramasundaram, P.; Dziopa, E.; Mannion, C.; Kissin, Y.; Tricoli, L.; Albanese, C.; Lee, W.; Zilberberg, J. Human ex vivo 3D bone model recapitulates osteocyte response to metastatic prostate cancer. Sci. Rep. 2018, 8, 1–12. [Google Scholar] [CrossRef] [Green Version]
- Fradet, A.; Sorel, H.; Depalle, B.; Serre, C.M.; Farlay, D.; Turtoi, A.; Bellahcene, A.; Follet, H.; Castronovo, V.; Clézardin, P.; et al. A new murine model of osteoblastic/osteolytic lesions from human androgen-resistant prostate cancer. PLoS ONE 2013, 8, e75092. [Google Scholar] [CrossRef] [Green Version]
- Xu, K.; Ganapathy, K.; Andl, T.; Wang, Z.; Copland, J.A.; Chakrabarti, R.; Florczyk, S.J. 3D porous chitosan-alginate scaffold stiffness promotes differential responses in prostate cancer cell lines. Biomaterials 2019, 217, 119311. [Google Scholar] [CrossRef]
- Morrissey, C.; Lai, J.S.; Brown, L.G.; Wang, Y.C.; Roudier, M.P.; Coleman, I.M.; Gulati, R.; Vakar-Lopez, F.; True, L.D.; Corey, E.; et al. The expression of osteoclastogenesis-associated factors and osteoblast response to osteolytic prostate cancer cells. Prostate 2009, 70, 412–424. [Google Scholar] [CrossRef] [Green Version]
- Shen, Y.; Liu, W.; Lin, K.; Pan, H.; Darvell, B.W.; Peng, S.; Wen, C.; Deng, L.; Lu, W.W.; Chang, J. Interfacial pH: A critical factor for osteoporotic bone regeneration. Langmuir 2011, 27, 2701–2708. [Google Scholar] [CrossRef]
- Ruan, C.; Hu, N.; Ma, Y.; Li, Y.; Liu, J.; Zhang, X.; Pan, H. The interfacial pH of acidic degradable polymeric biomaterials and its effects on osteoblast behavior. Sci. Rep. 2017, 7, 6794. [Google Scholar] [CrossRef] [Green Version]
- Huang, S.; Tang, Y.; Peng, X.; Cai, X.; Wa, Q.; Ren, D.; Li, Q.; Luo, J.; Li, L.; Zou, X.; et al. Acidic extracellular pH promotes prostate cancer bone metastasis by enhancing PC-3 stem cell characteristics, cell invasiveness and VEGF-induced vasculogenesis of BM-EPCs. Oncol. Rep. 2016, 36, 2025–2032. [Google Scholar] [CrossRef]
- Kapałczyńska, M.; Kolenda, T.; Przybyła, W.; Zajączkowska, M.; Teresiak, A.; Filas, V.; Ibbs, M.; Bliźniak, R.; Łuczewski, Ł.; Lamperska, K. 2D and 3D cell cultures—A comparison of different types of cancer cell cultures. Arch. Med. Sci. 2018, 14, 910–919. [Google Scholar] [CrossRef] [PubMed]
- Xu, X.; Sabanayagam, C.R.; Harrington, D.A.; Farach-Carson, M.C.; Jia, X. A hydrogel-based tumor model for the evaluation of nanoparticle-based cancer therapeutics. Biomaterials 2014, 35, 3319–3330. [Google Scholar] [CrossRef] [PubMed]


| Target Gene | Fragment Size/bp | Dye |
|---|---|---|
| ALP | 79 | FAM-MGB |
| COL1A1 | 66 | FAM-MGB |
| COL4A1 | 75 | FAM-MGB |
| OPN | 84 | FAM-MGB |
| ACTB | 171 | VIC-MGB |
Disclaimer/Publisher’s Note: The statements, opinions and data contained in all publications are solely those of the individual author(s) and contributor(s) and not of MDPI and/or the editor(s). MDPI and/or the editor(s) disclaim responsibility for any injury to people or property resulting from any ideas, methods, instructions or products referred to in the content. |
© 2023 by the authors. Licensee MDPI, Basel, Switzerland. This article is an open access article distributed under the terms and conditions of the Creative Commons Attribution (CC BY) license (https://creativecommons.org/licenses/by/4.0/).
Share and Cite
Dozzo, A.; Chullipalliyalil, K.; McAuliffe, M.; O’Driscoll, C.M.; Ryan, K.B. Nano-Hydroxyapatite/PLGA Mixed Scaffolds as a Tool for Drug Development and to Study Metastatic Prostate Cancer in the Bone. Pharmaceutics 2023, 15, 242. https://doi.org/10.3390/pharmaceutics15010242
Dozzo A, Chullipalliyalil K, McAuliffe M, O’Driscoll CM, Ryan KB. Nano-Hydroxyapatite/PLGA Mixed Scaffolds as a Tool for Drug Development and to Study Metastatic Prostate Cancer in the Bone. Pharmaceutics. 2023; 15(1):242. https://doi.org/10.3390/pharmaceutics15010242
Chicago/Turabian StyleDozzo, Annachiara, Krishnakumar Chullipalliyalil, Michael McAuliffe, Caitriona M. O’Driscoll, and Katie B. Ryan. 2023. "Nano-Hydroxyapatite/PLGA Mixed Scaffolds as a Tool for Drug Development and to Study Metastatic Prostate Cancer in the Bone" Pharmaceutics 15, no. 1: 242. https://doi.org/10.3390/pharmaceutics15010242