
Microemulsions as Lipid Nanosystems Loaded into Thermoresponsive In Situ Microgels for Local Ocular Delivery of Prednisolone
 ,
,  , , and
Abstract
:1. Introduction
2. Materials and Methods
2.1. Materials
2.2. Preparation of Prednisolone Microemulsions (PRD-MEs)
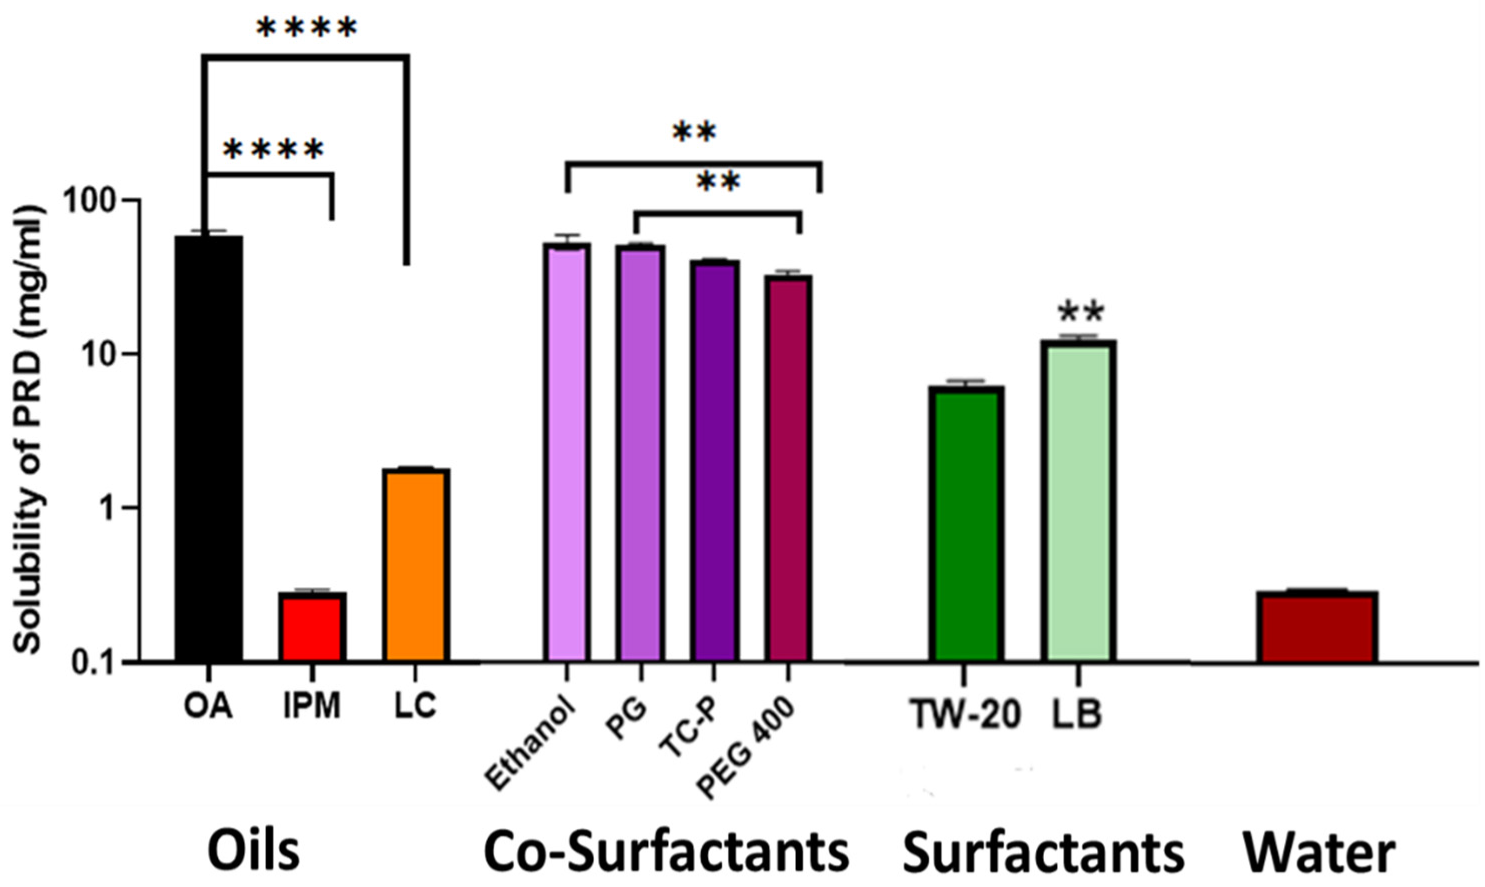
2.2.1. Solubility of Prednisolone
2.2.2. Preparation of Pseudoternary Systems
2.2.3. Preparation of PRD-MEs
2.3. Characterization of PRD-MEs
2.3.1. Droplet Size, Polydispersity Index, and Zeta Potential
2.3.2. Thermodynamic STABILITY Studies
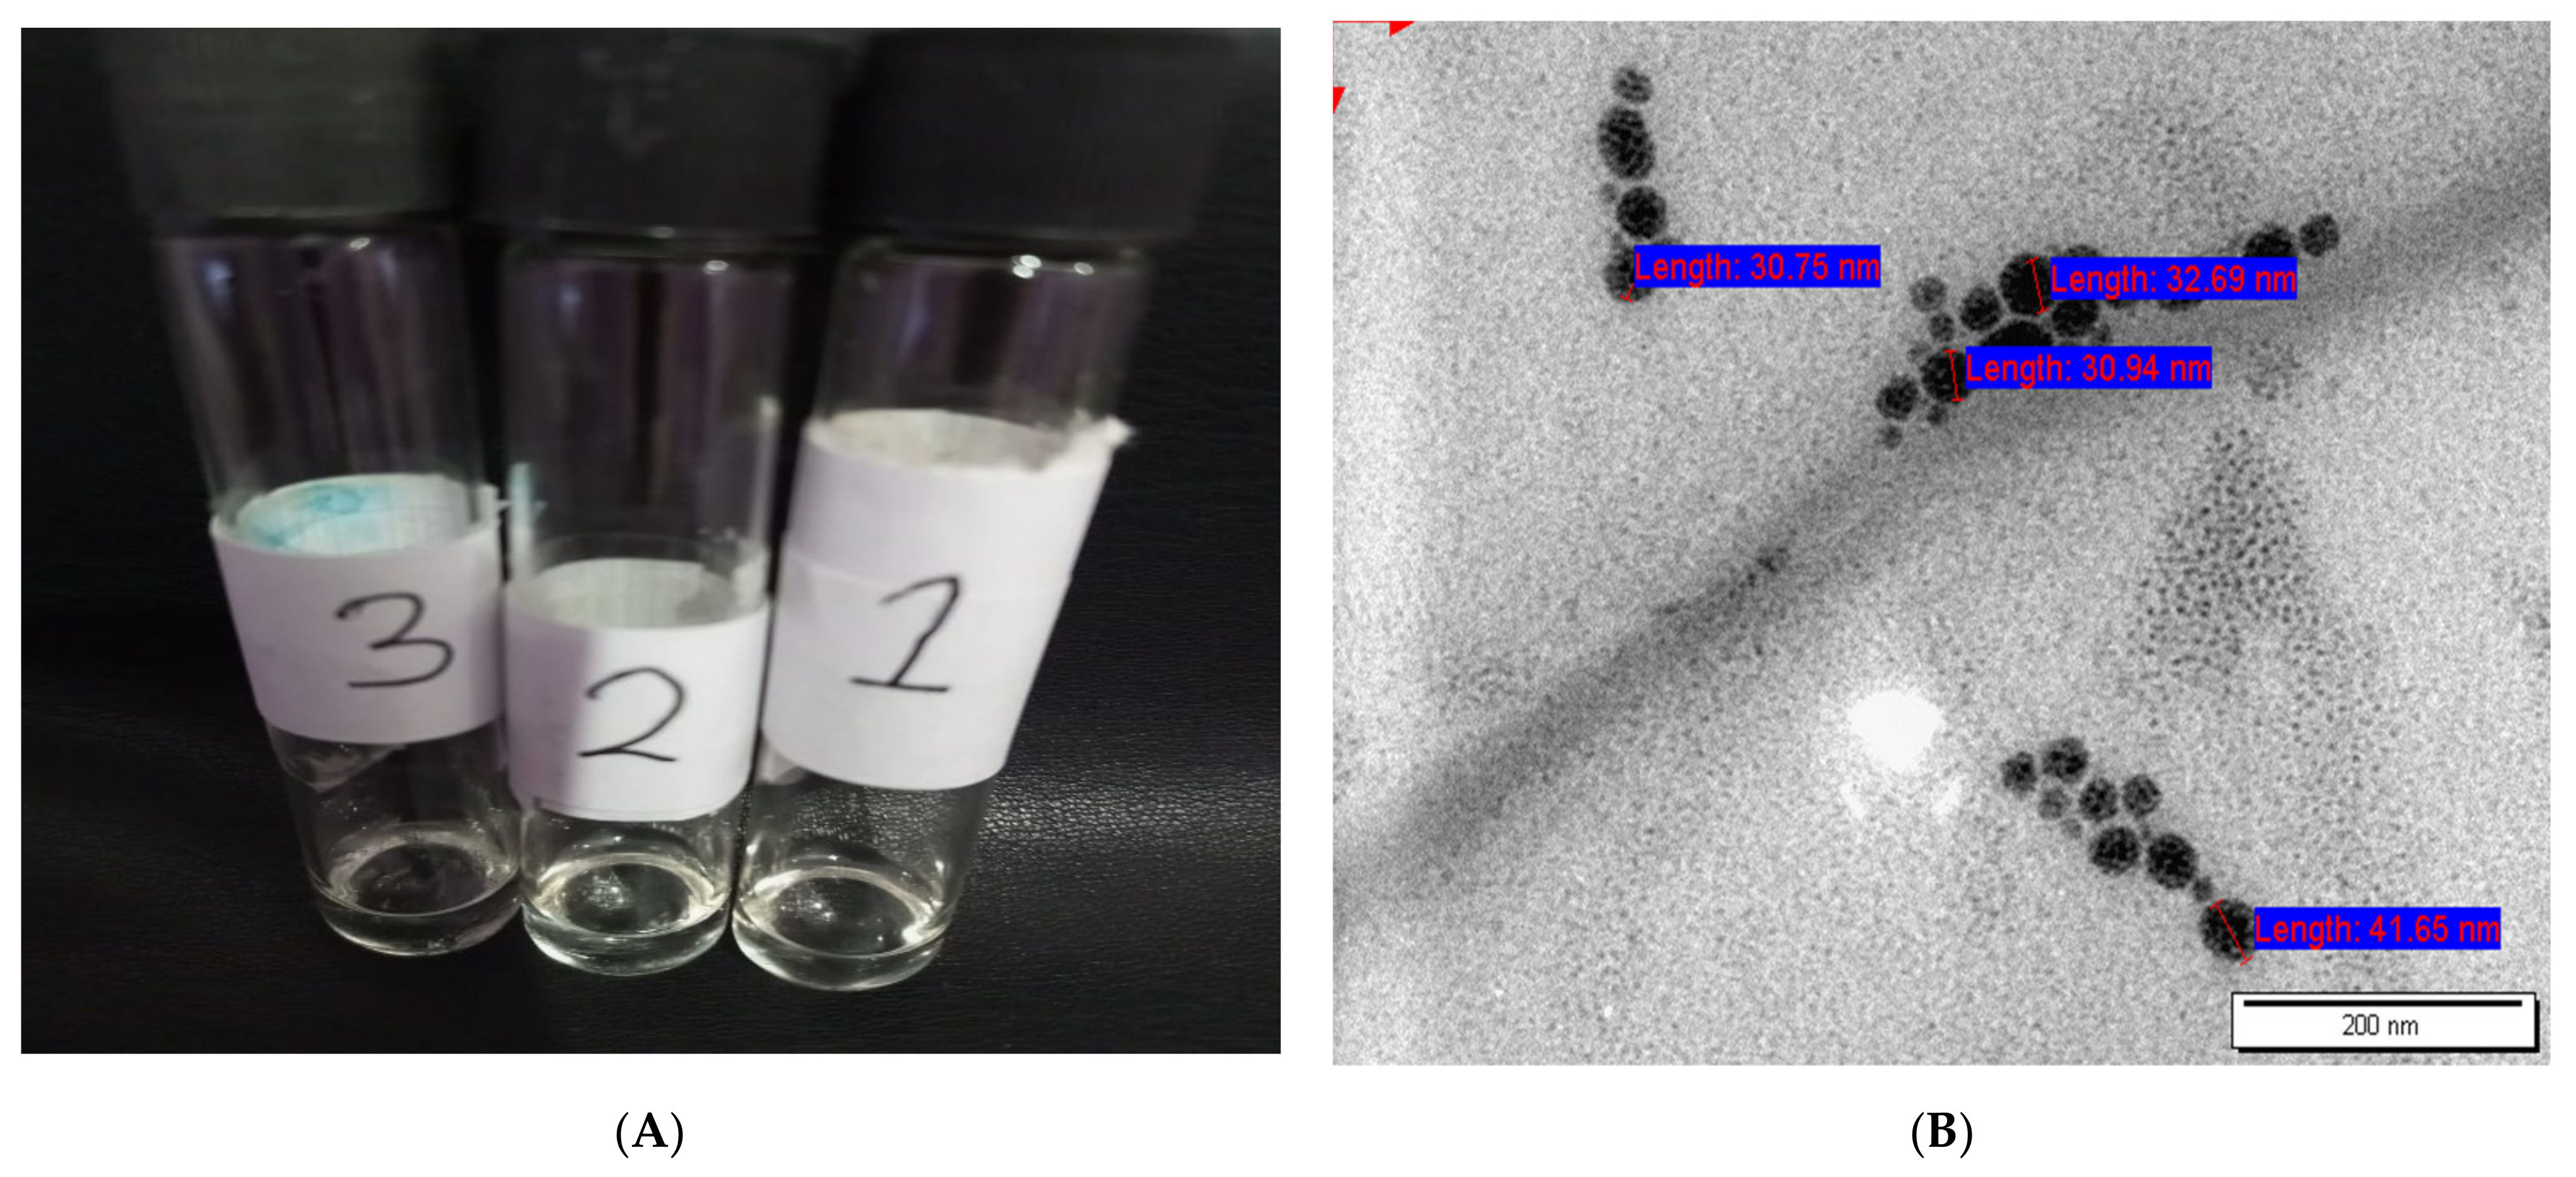
2.3.3. Transmission Electron Microscope (TEM)
2.4. Preparation of PRD Microgels
2.4.1. Preparation of F127/F68 Hydrogels
2.4.2. Preparation of PRD Microgels
2.5. Characterization of PRD Microgels
2.5.1. Clarity, pH, and Surface Tension
2.5.2. Size and Zeta Potential
2.5.3. Sol–Gel Transition Temperature (Tsol→gel) and Gelation Time (T(gel))
2.5.4. Physicochemical Characterization of PRD Microgels
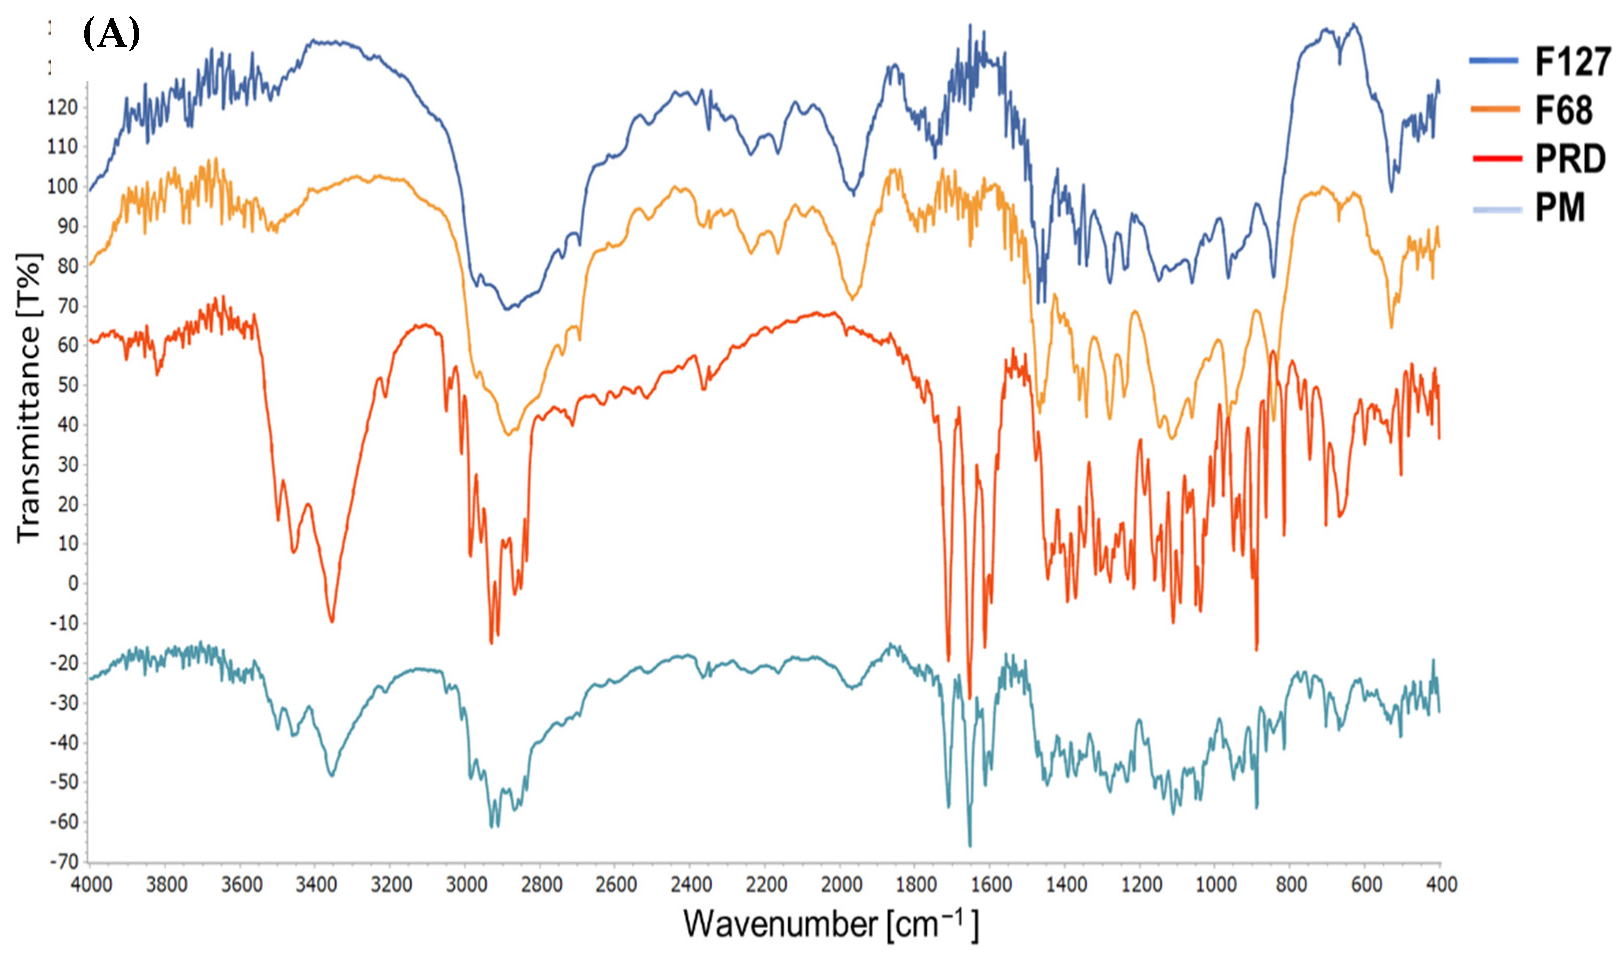
Fourier Transform Infra-Red (FTIR)
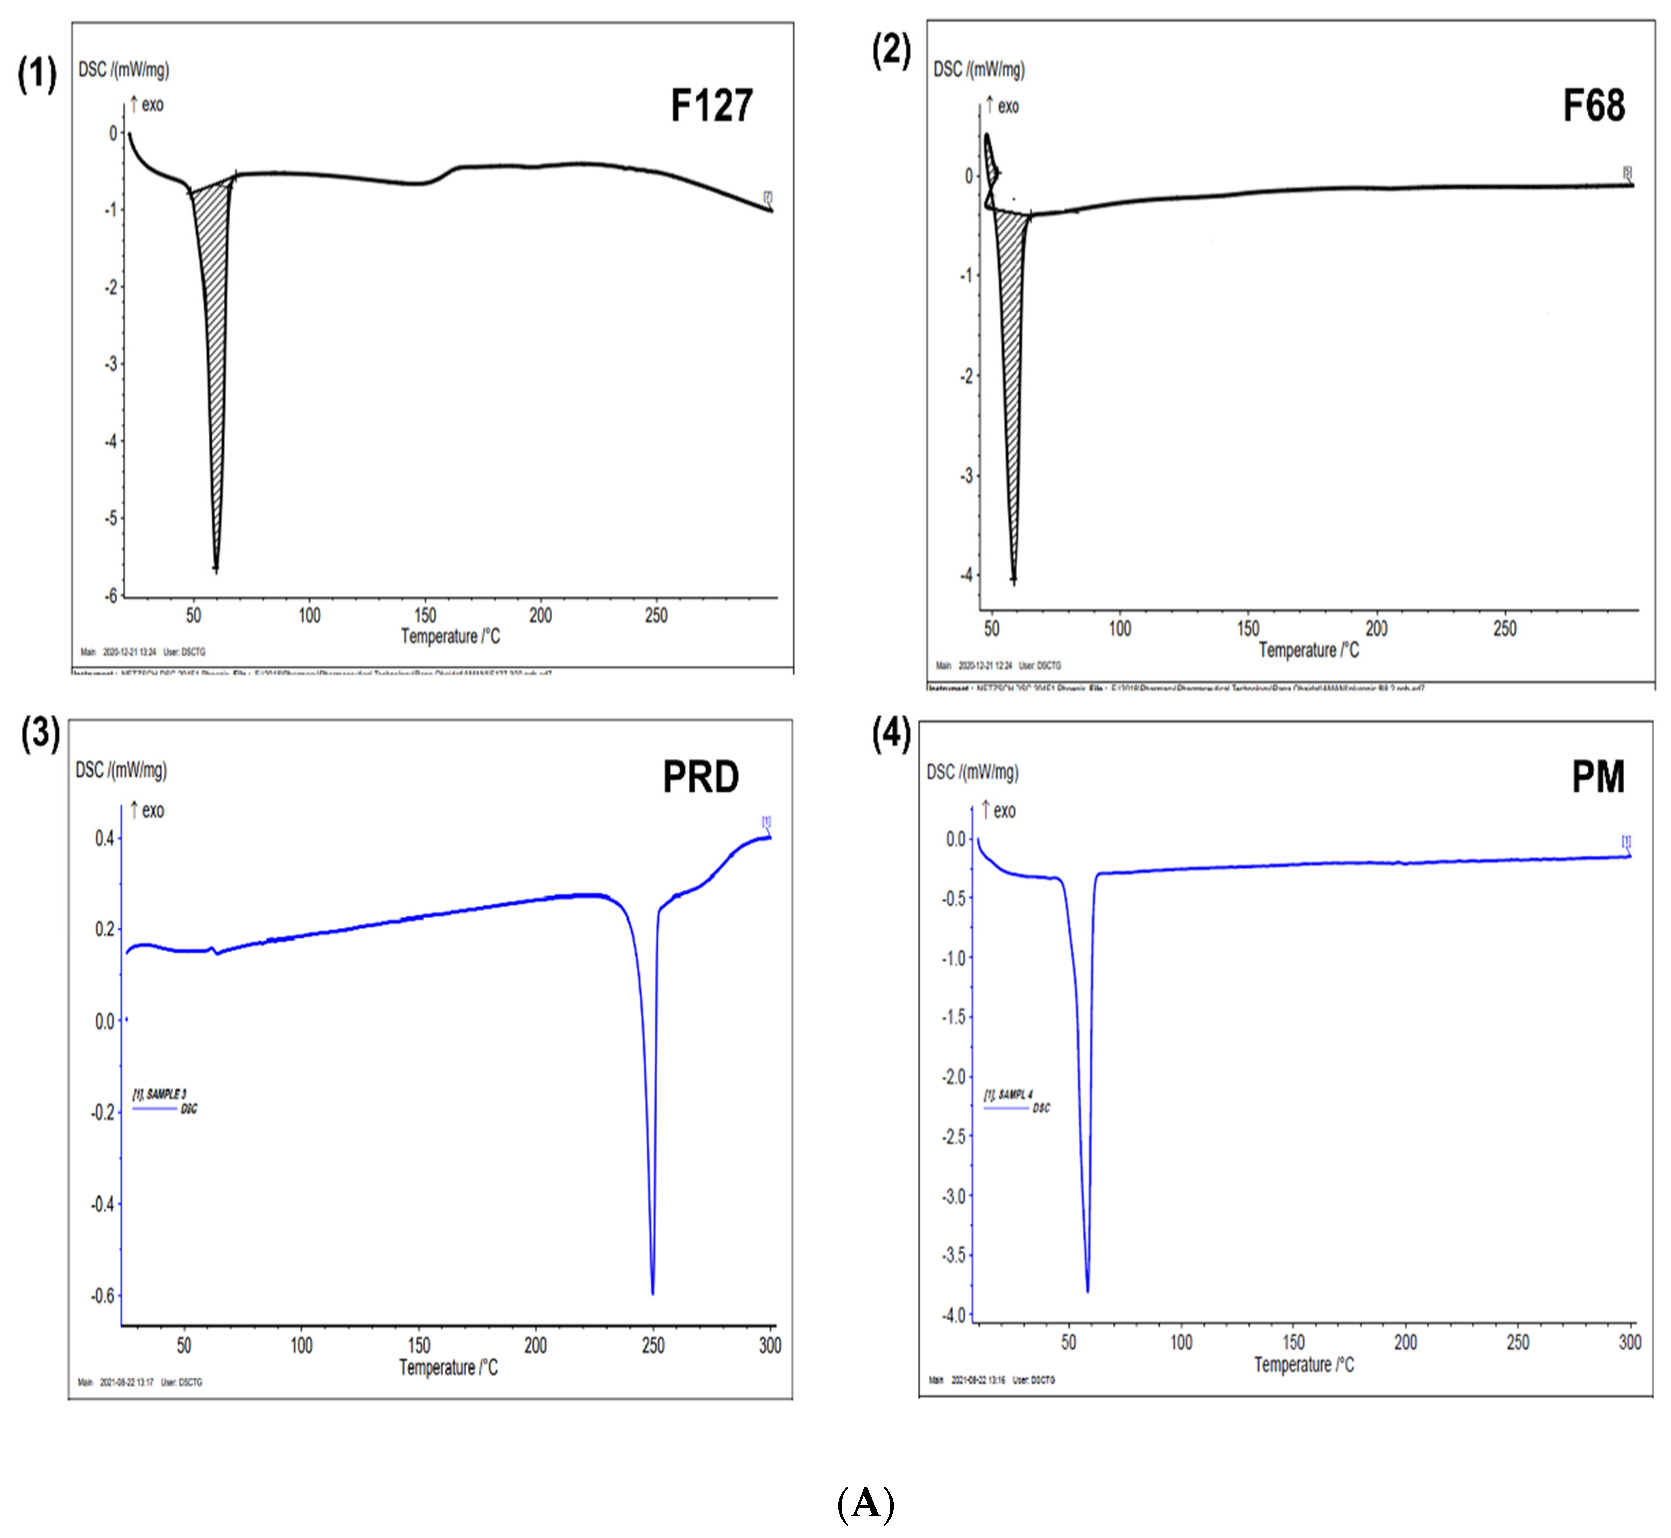
Differential Scanning Calorimetry (DSC)
2.5.5. Rheological Studies
Viscosity Curves
Mathematical Modeling of Viscosity Data
Strain–Sweep Studies
Frequency–Sweep Studies
Temperature–Sweep Test
2.6. Mucoadhesion Test
2.6.1. Preparation of Mucin Dispersions
2.6.2. Preparation of Mucin/PRD Microgel Mixtures
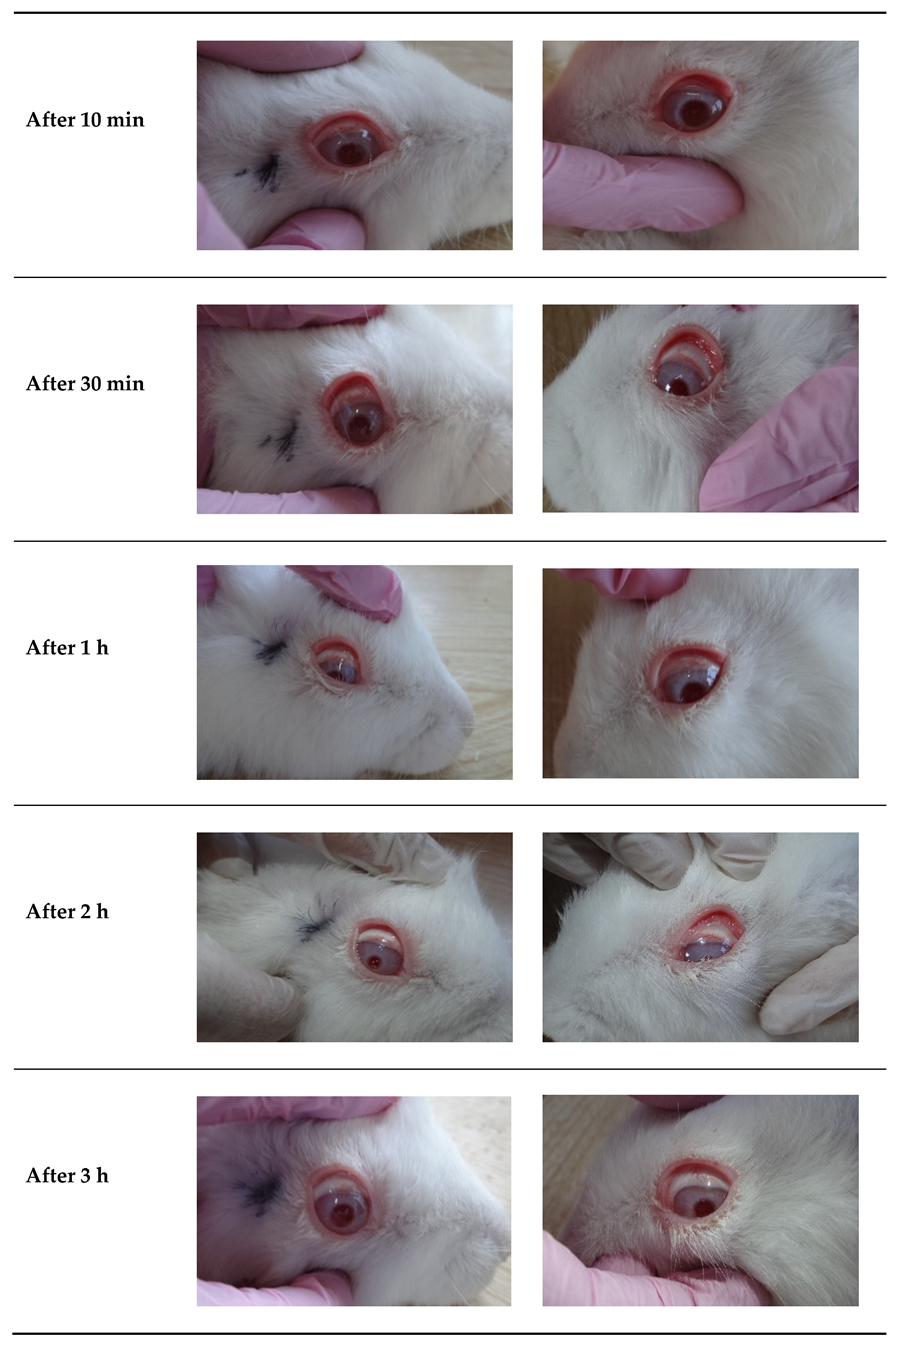
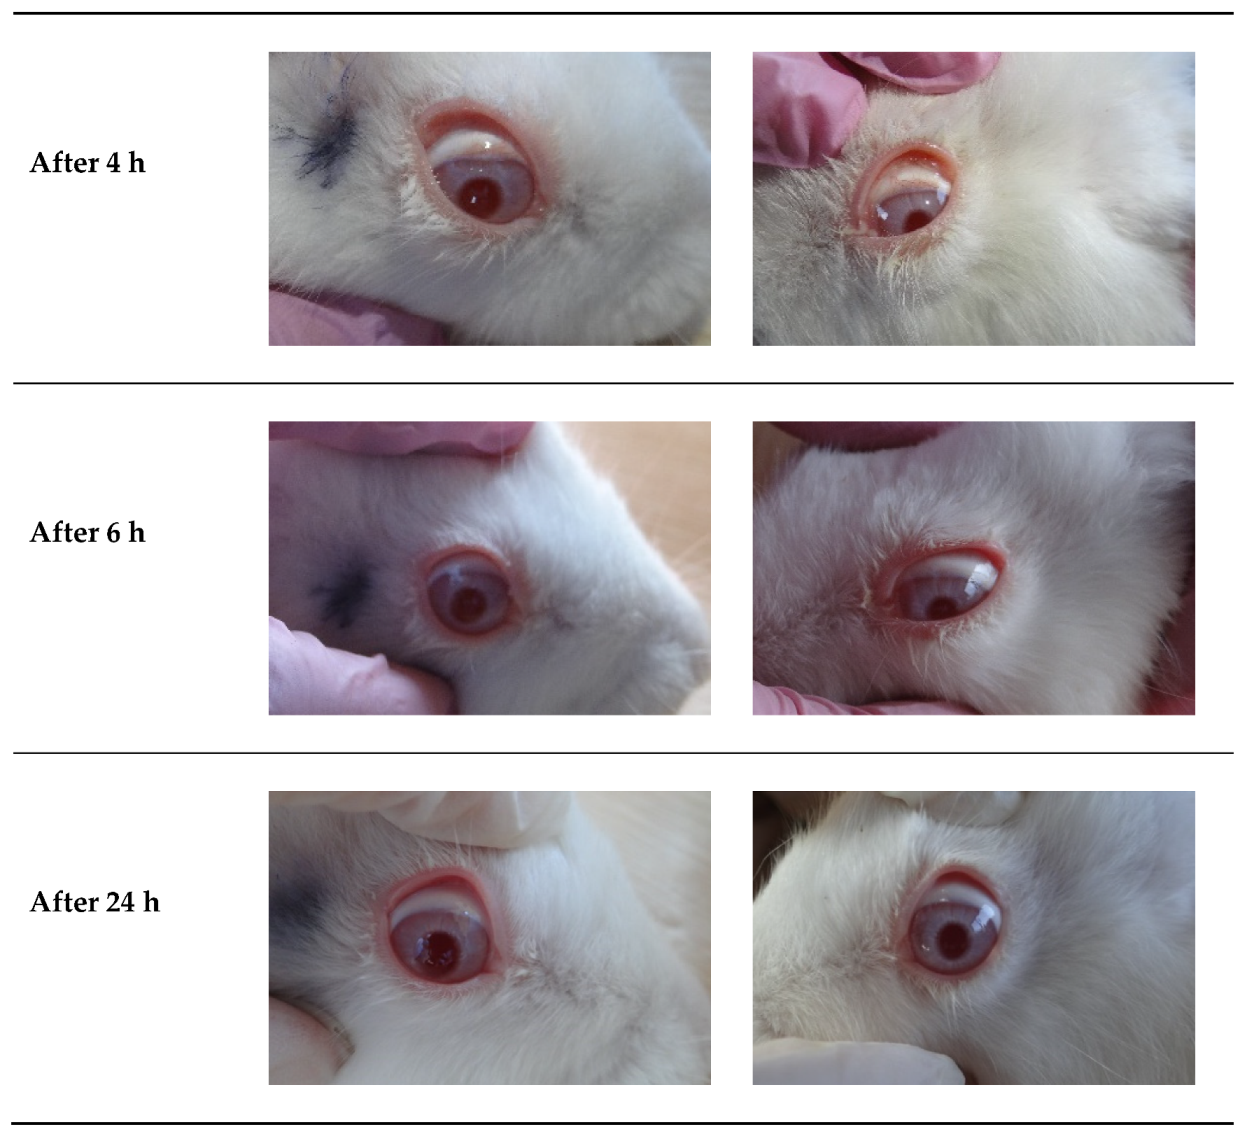
2.7. Eye Irritation Test
2.8. High-Performance Liquid Chromatography
2.9. Assay Test
2.10. In Vitro Release Studies
2.11. Mechanism of Release
2.12. Stability Studies of PRD Microgels
2.12.1. Thermal Stability
2.12.2. Rheological Stability
2.13. Statistical Analysis
3. Results and Discussion
3.1. PRD-MEs
3.1.1. Selection of PRD-MEs Components
3.1.2. Pseudoternary Systems
3.1.3. Preparation of PRD-MEs
3.2. Characterization of PRD-MEs
3.3. PRD Microgels
3.3.1. Clarity, pH, and Surface Tension
3.3.2. Size and Zeta Potential
3.3.3. Tsol-gel and T(gel)
3.4. Physicochemical Characterization
3.4.1. Fourier-Transform Infrared Spectroscopy (FTIR)
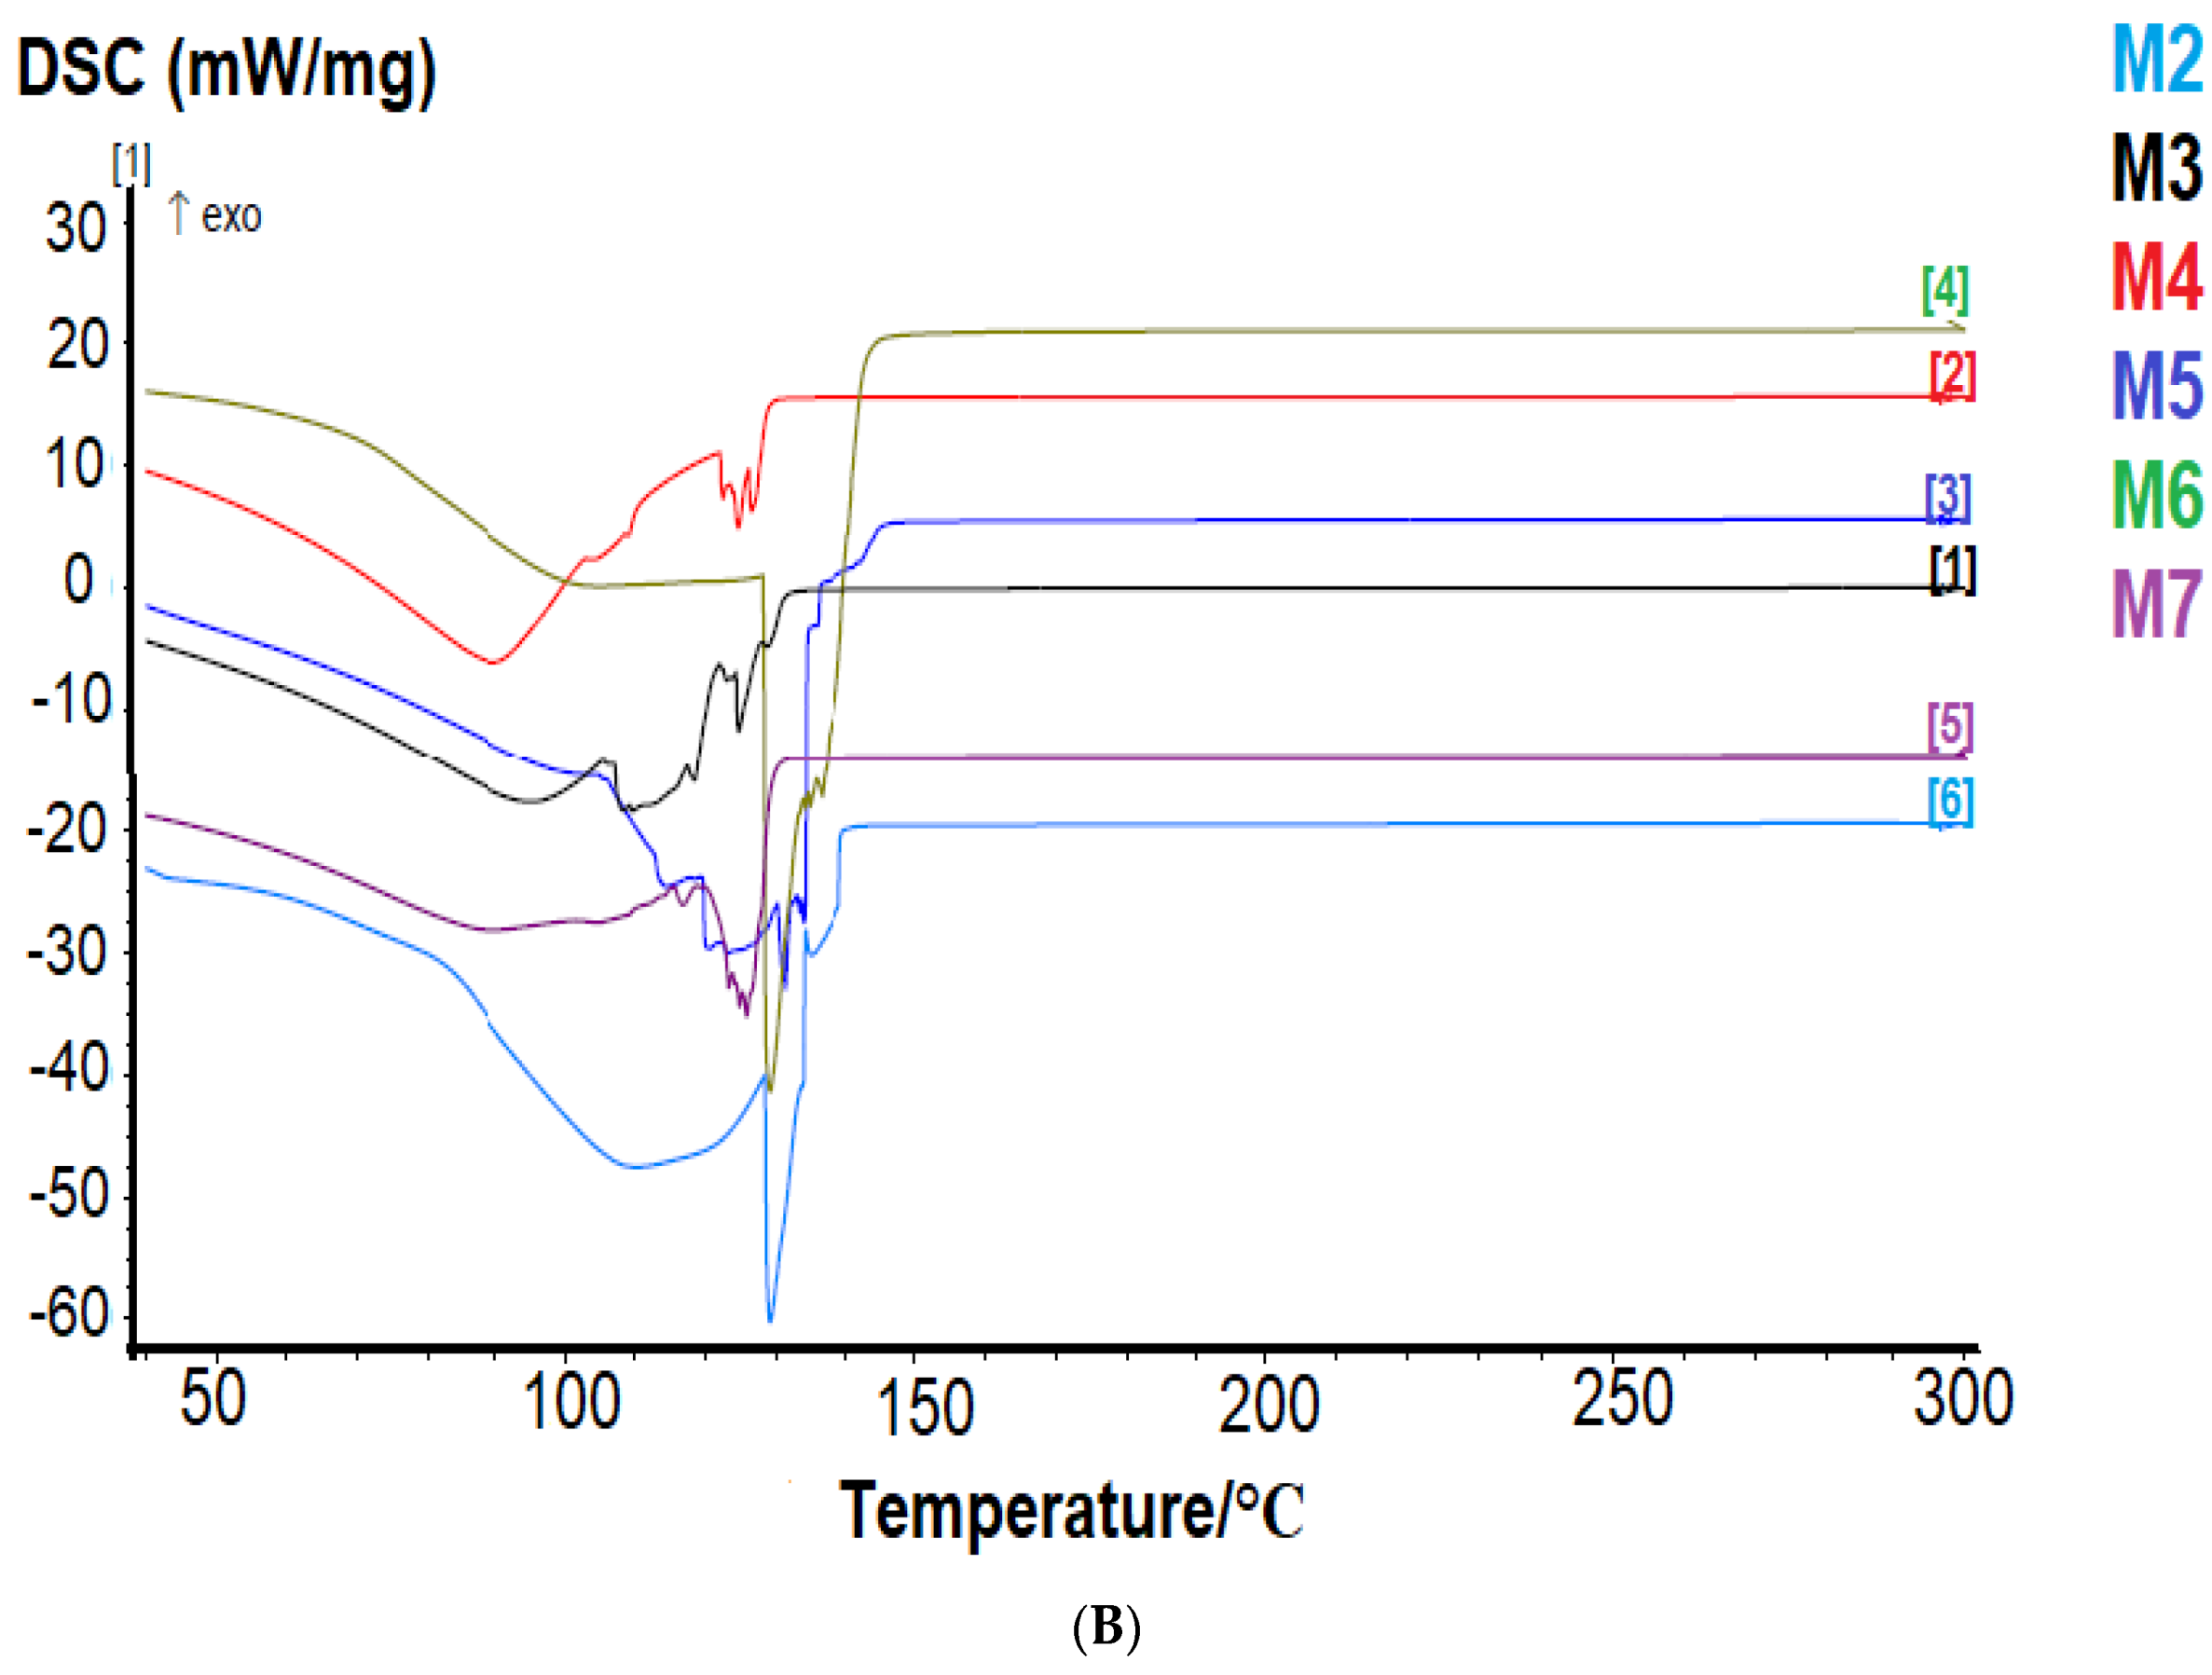
3.4.2. Differential Scanning Calorimetry (DSC)
3.5. Rheological Studies
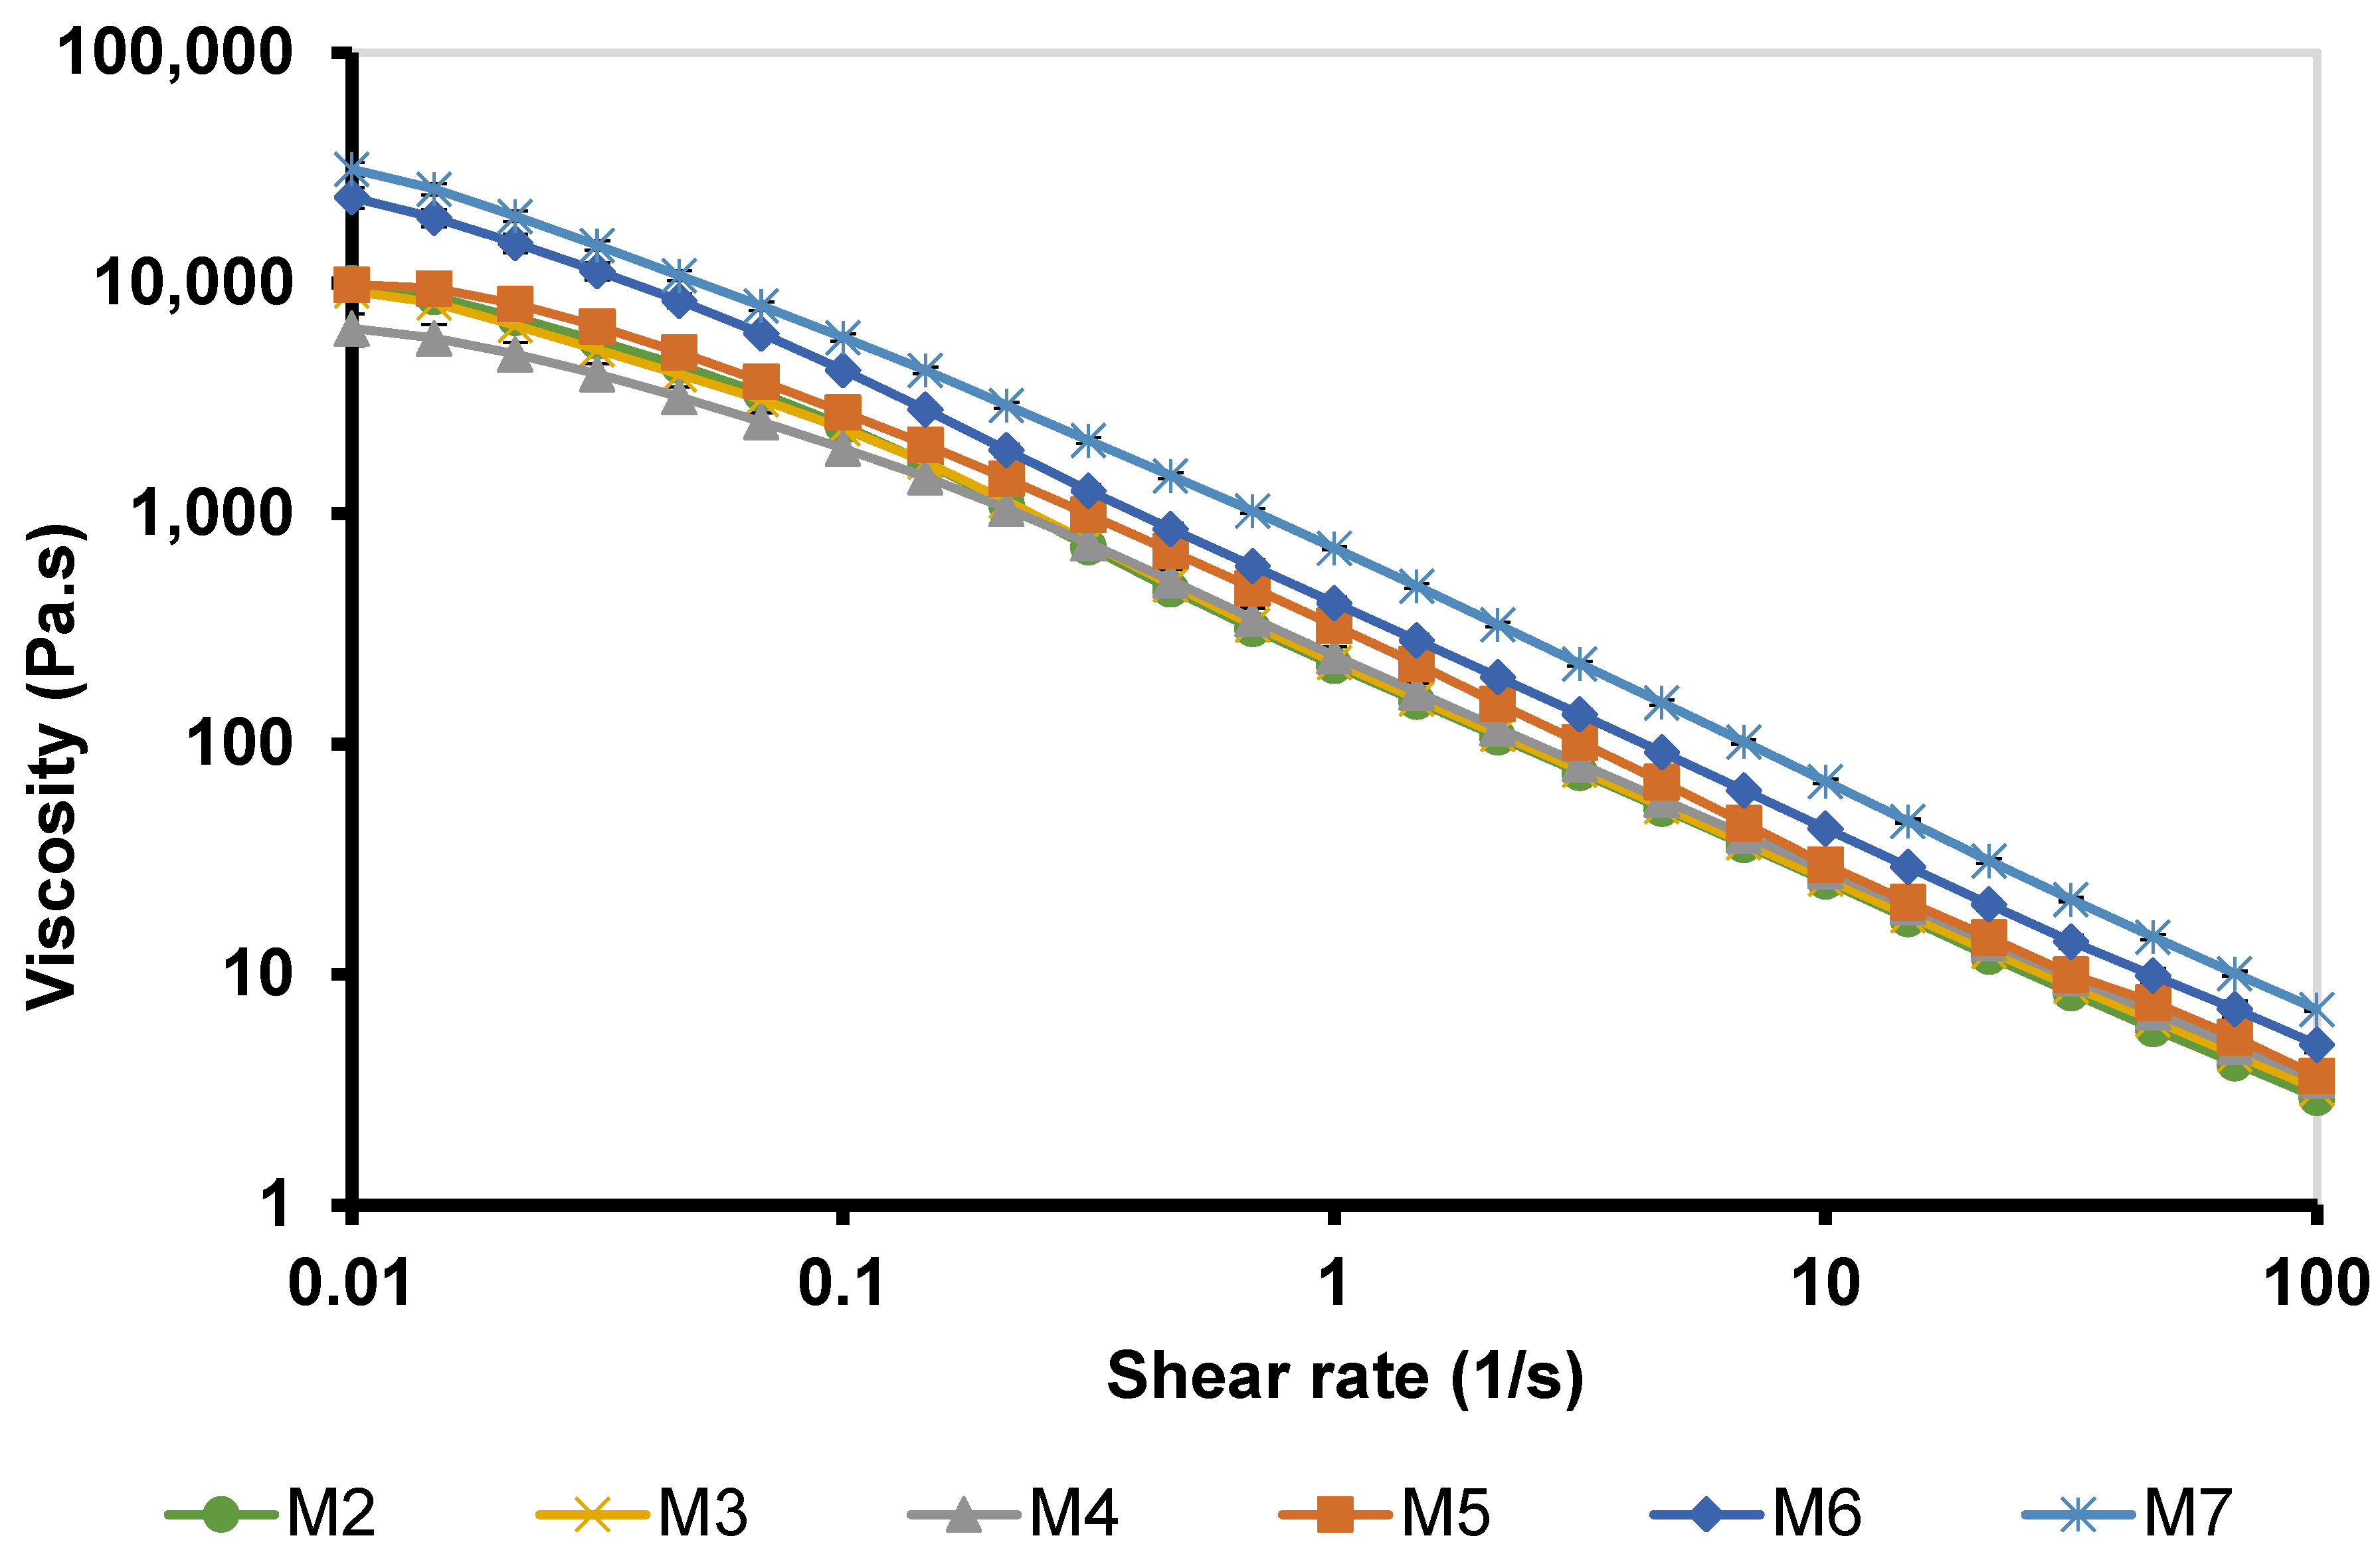
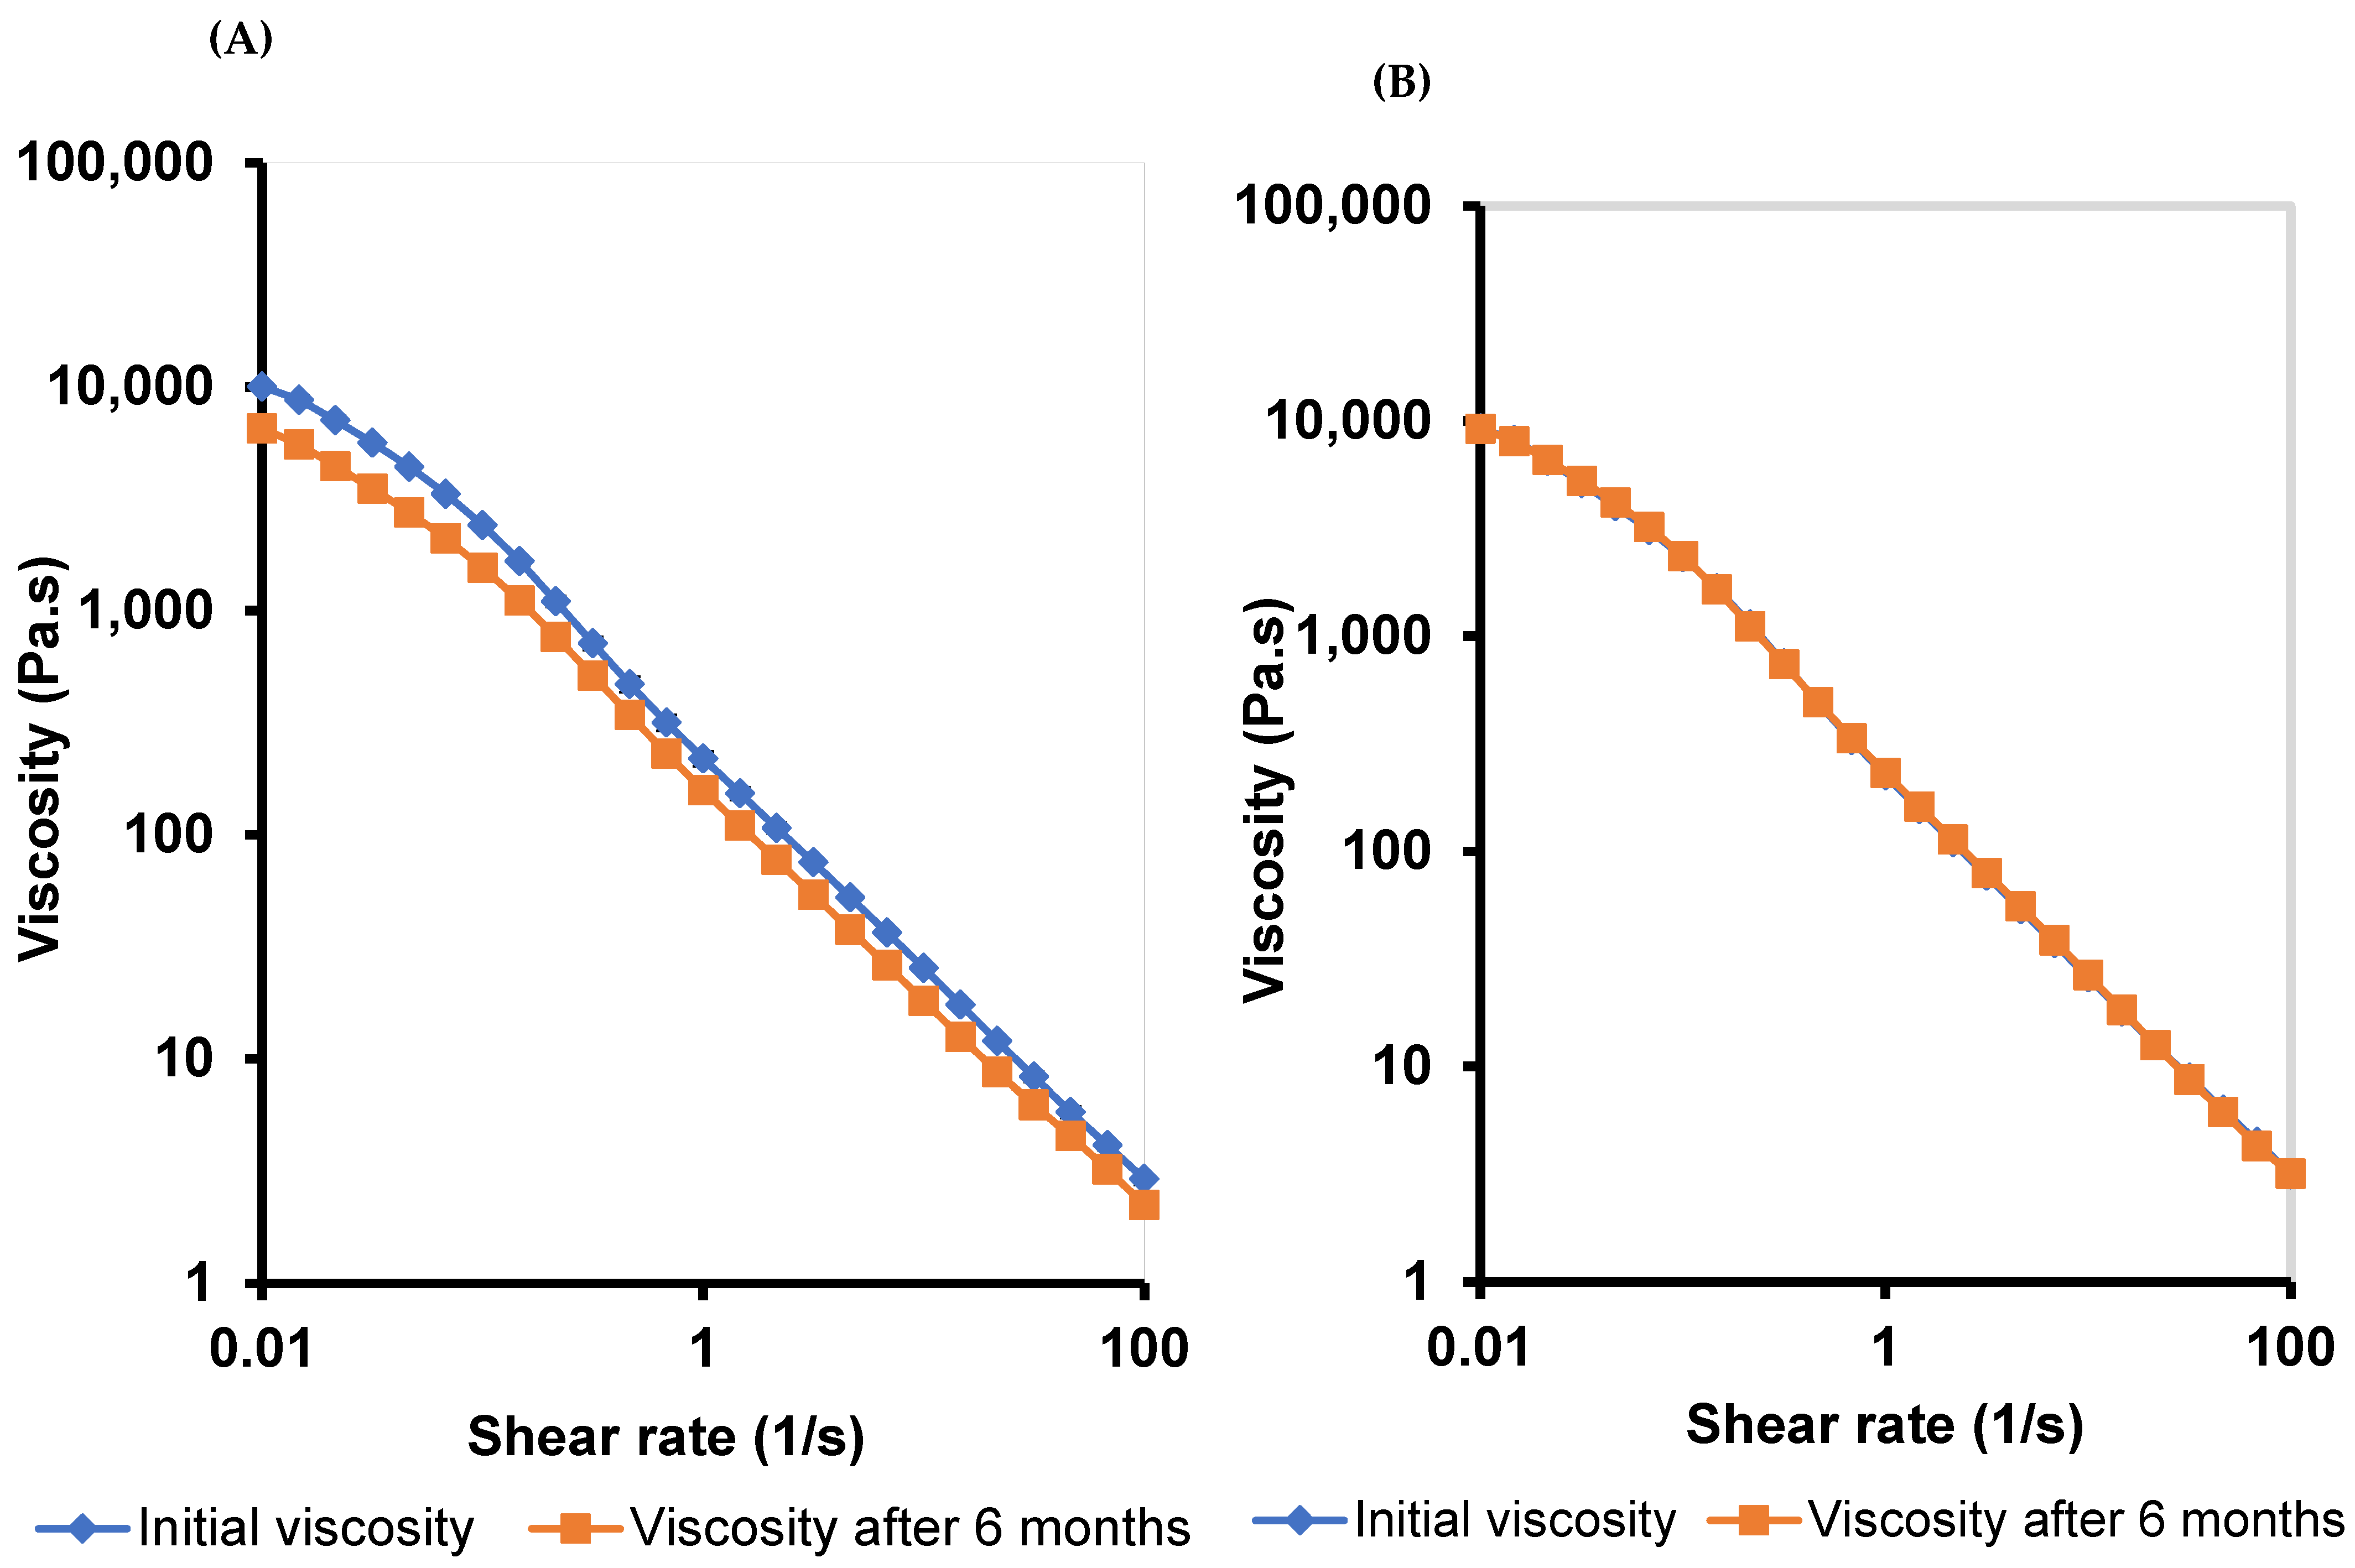
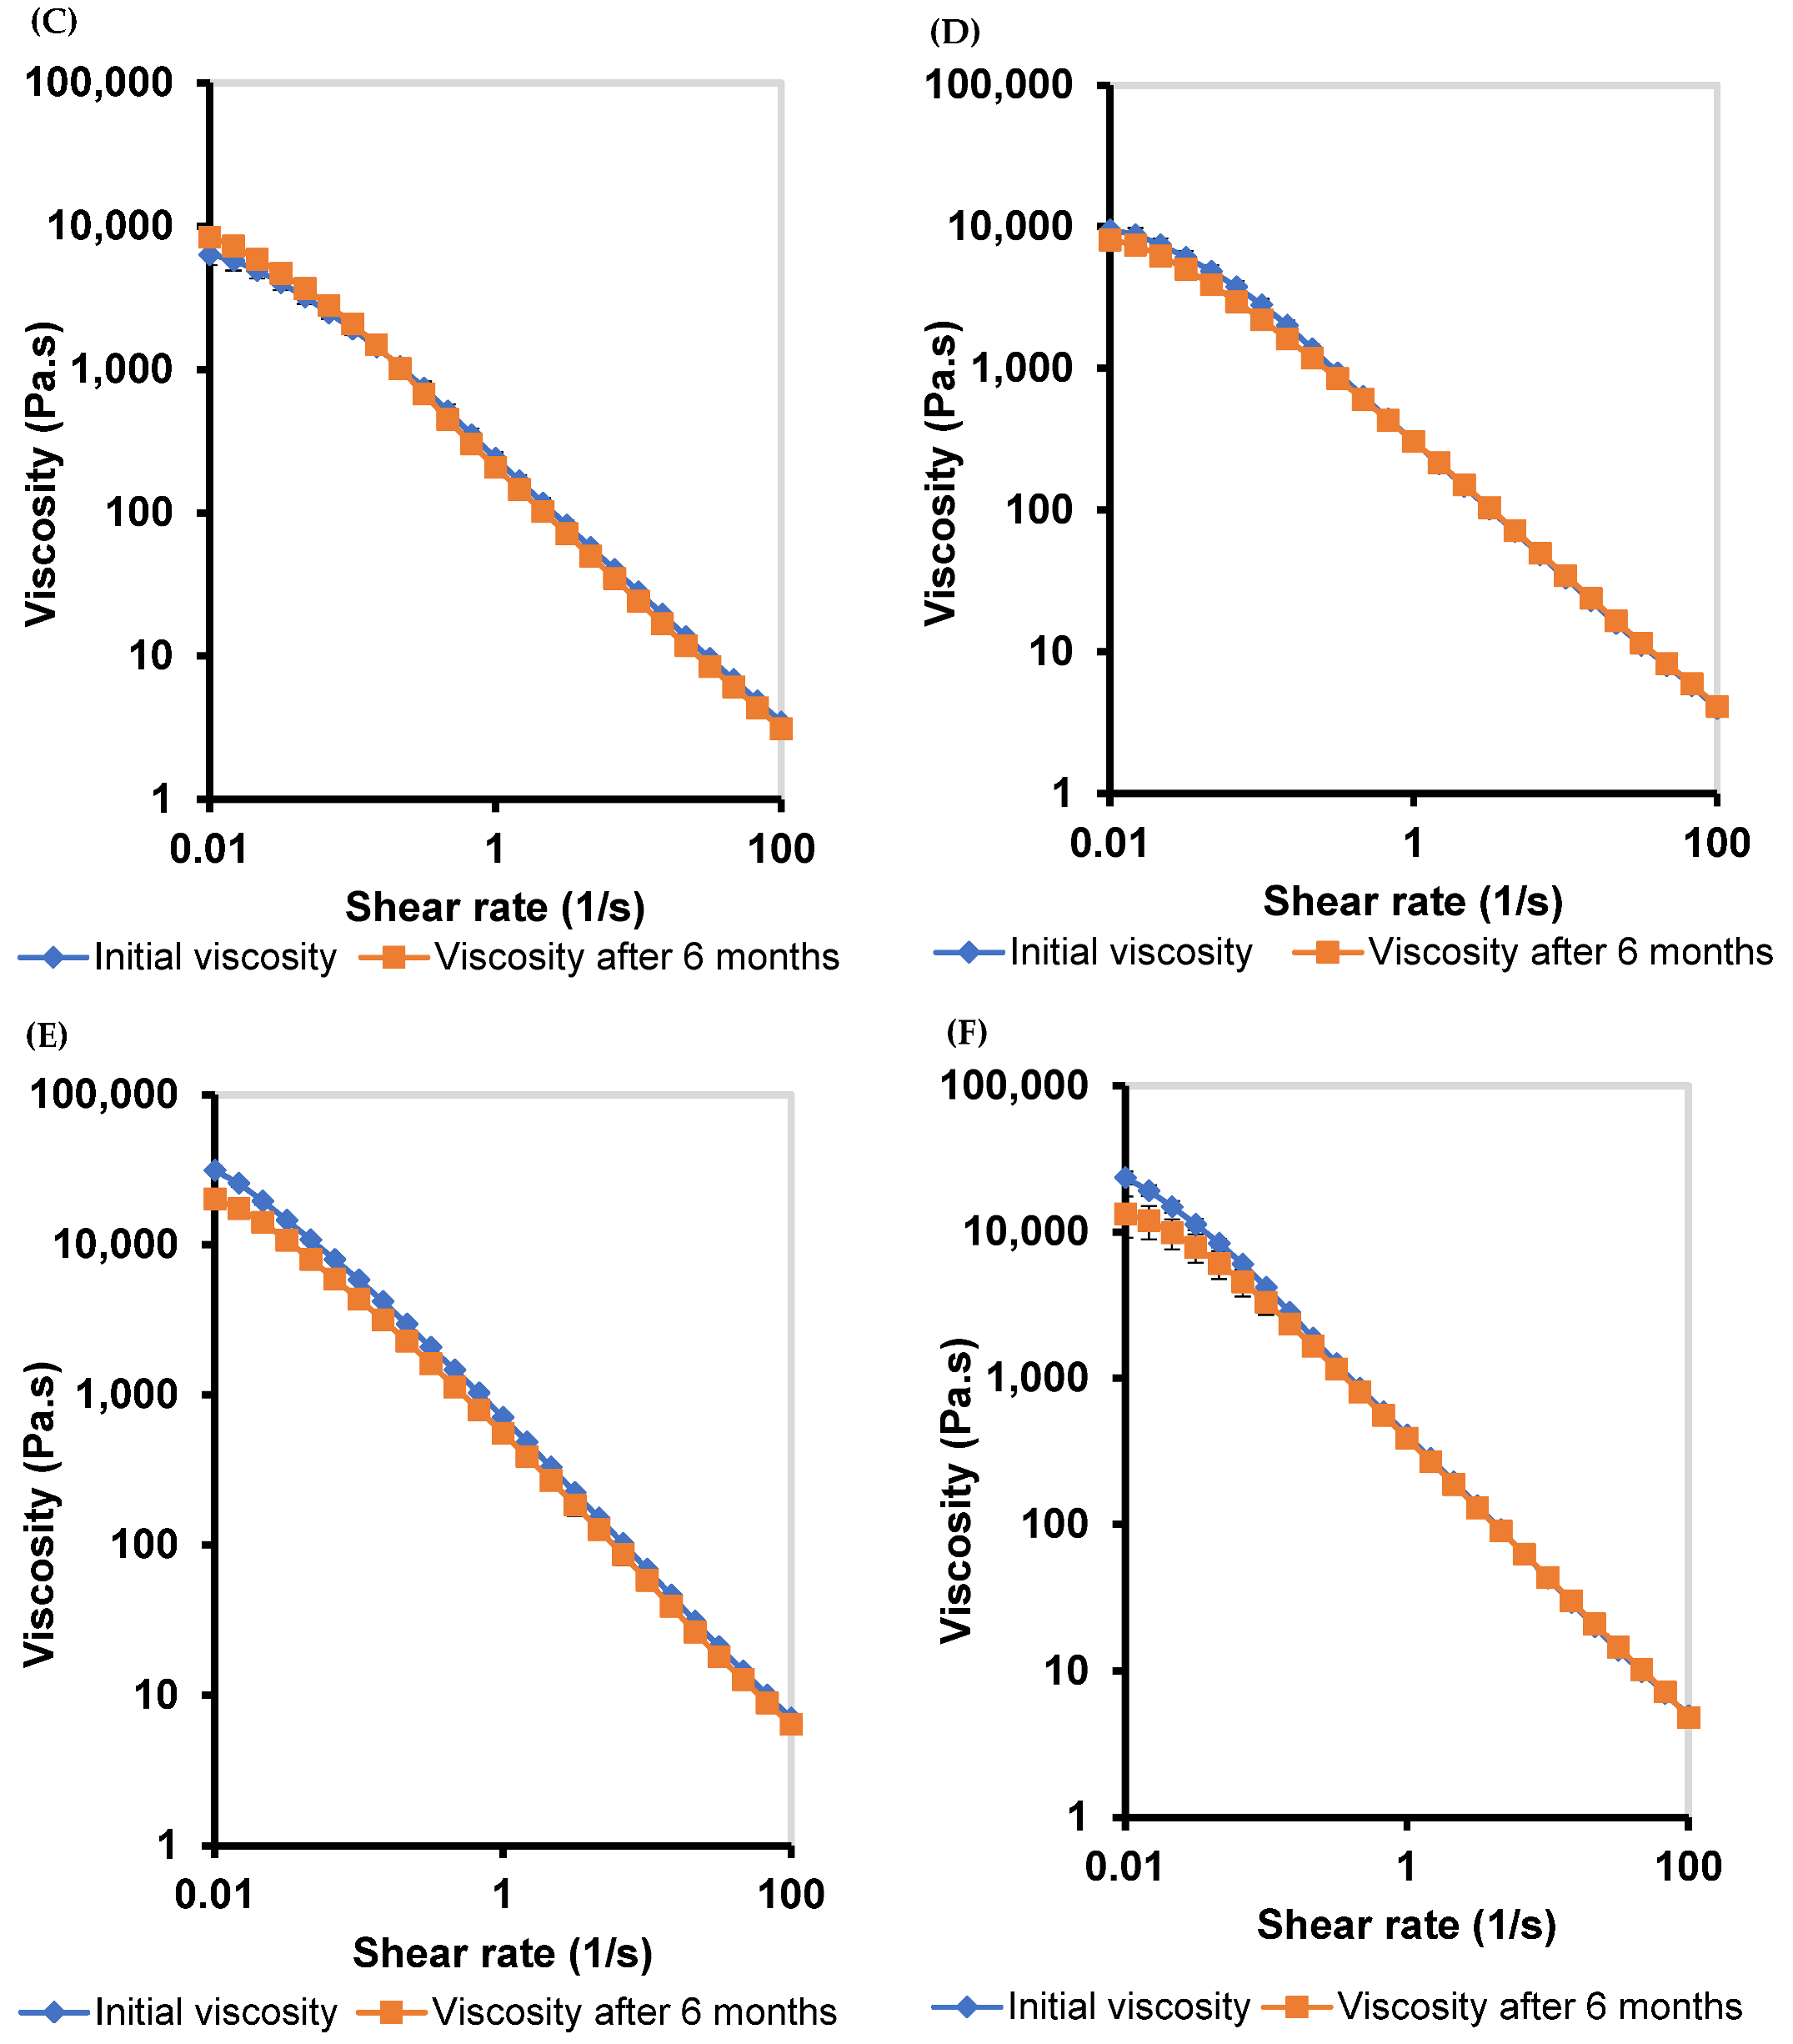
3.5.1. Viscosity Curves
3.5.2. Mathematical Modeling
3.5.3. Strain–Sweep
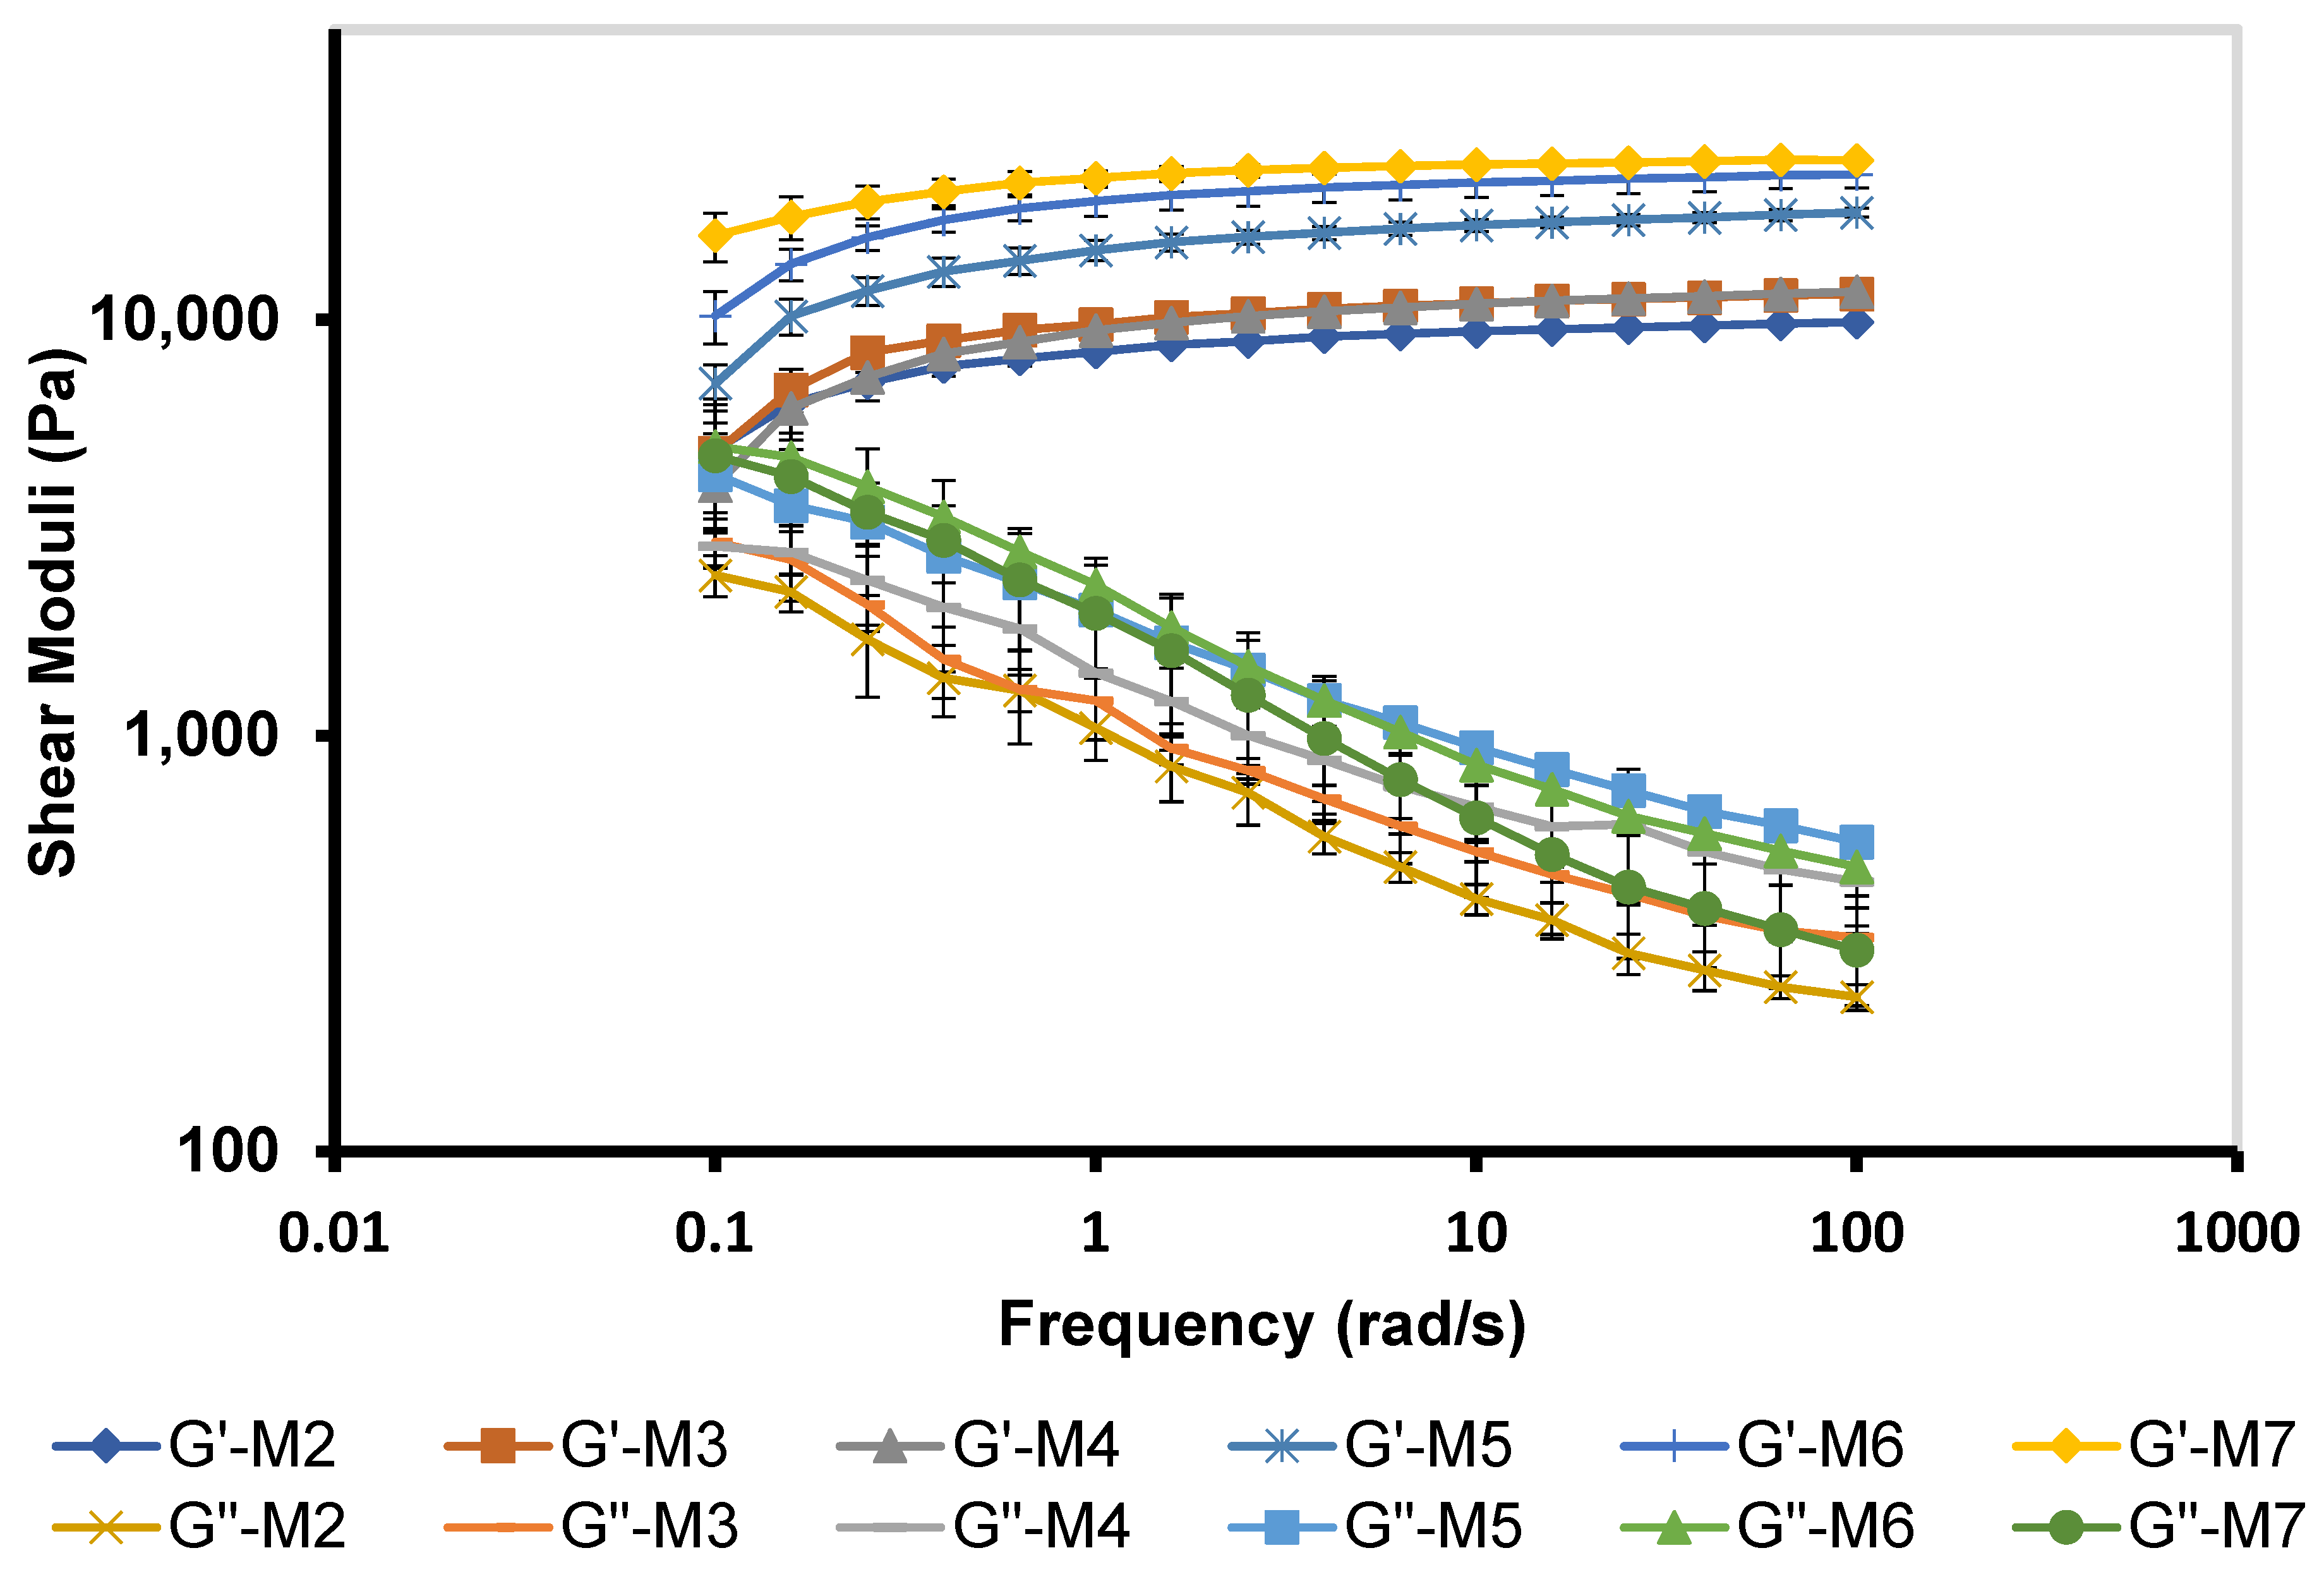
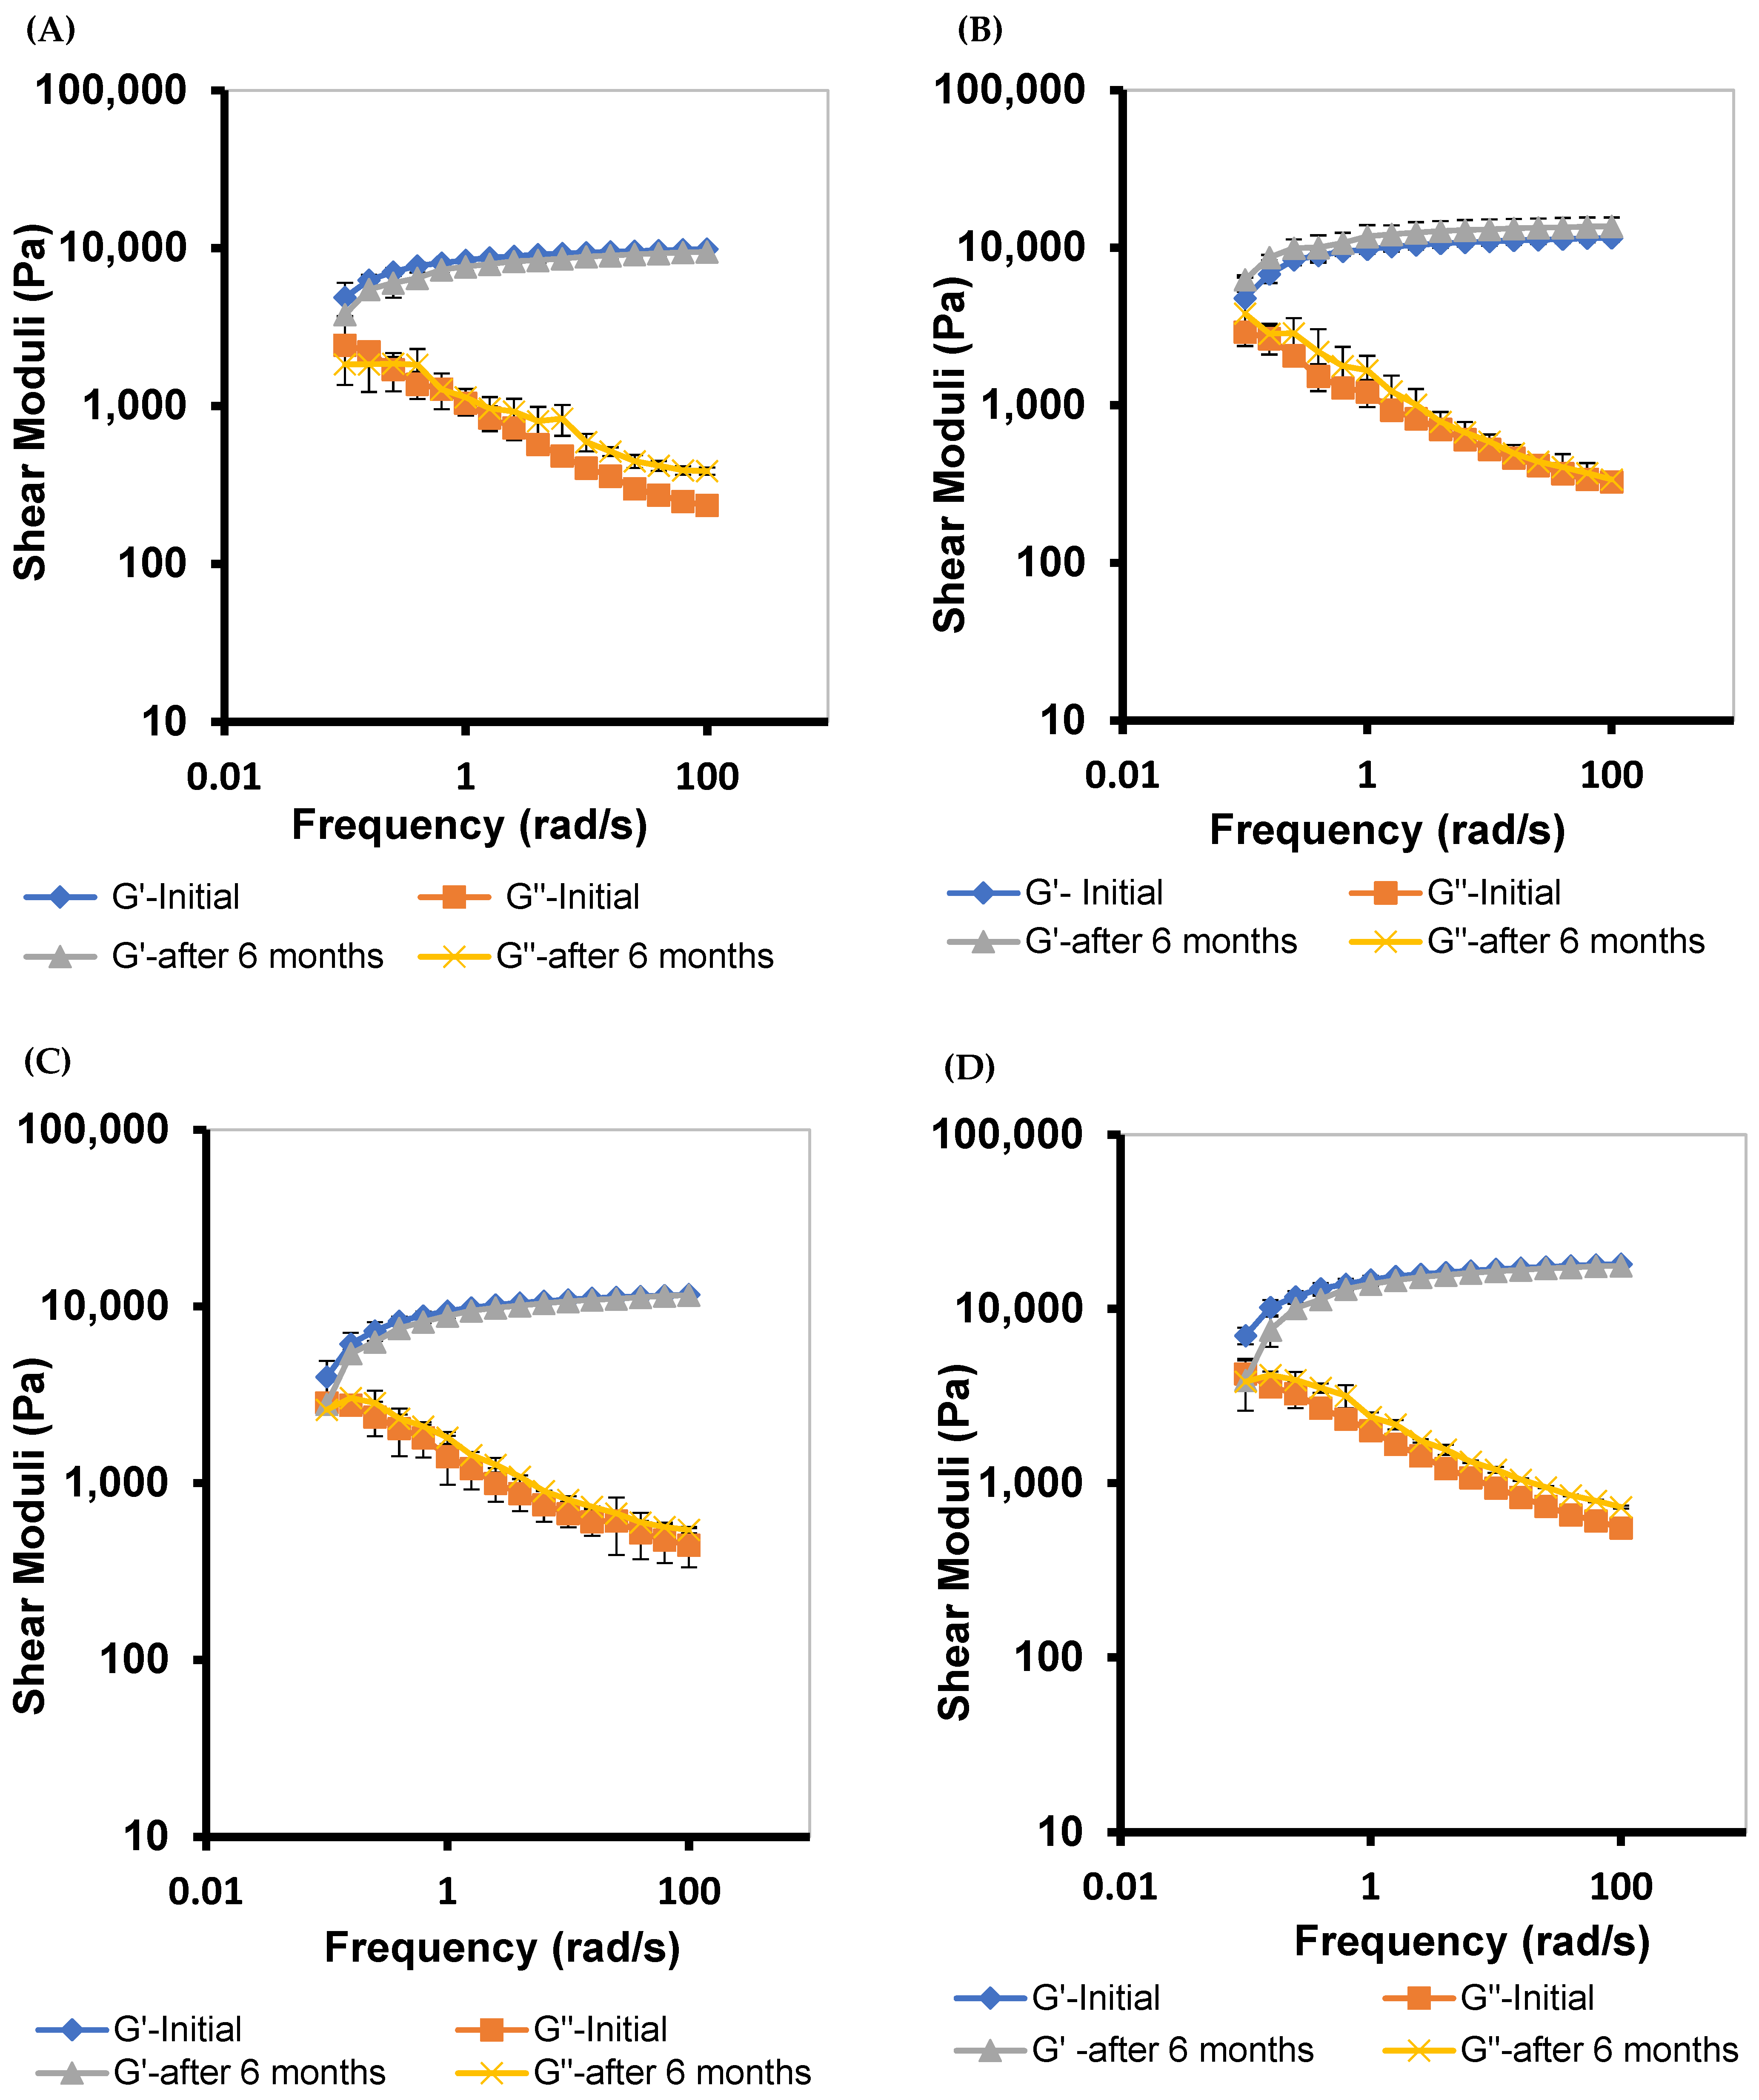
3.5.4. Frequency–Sweep
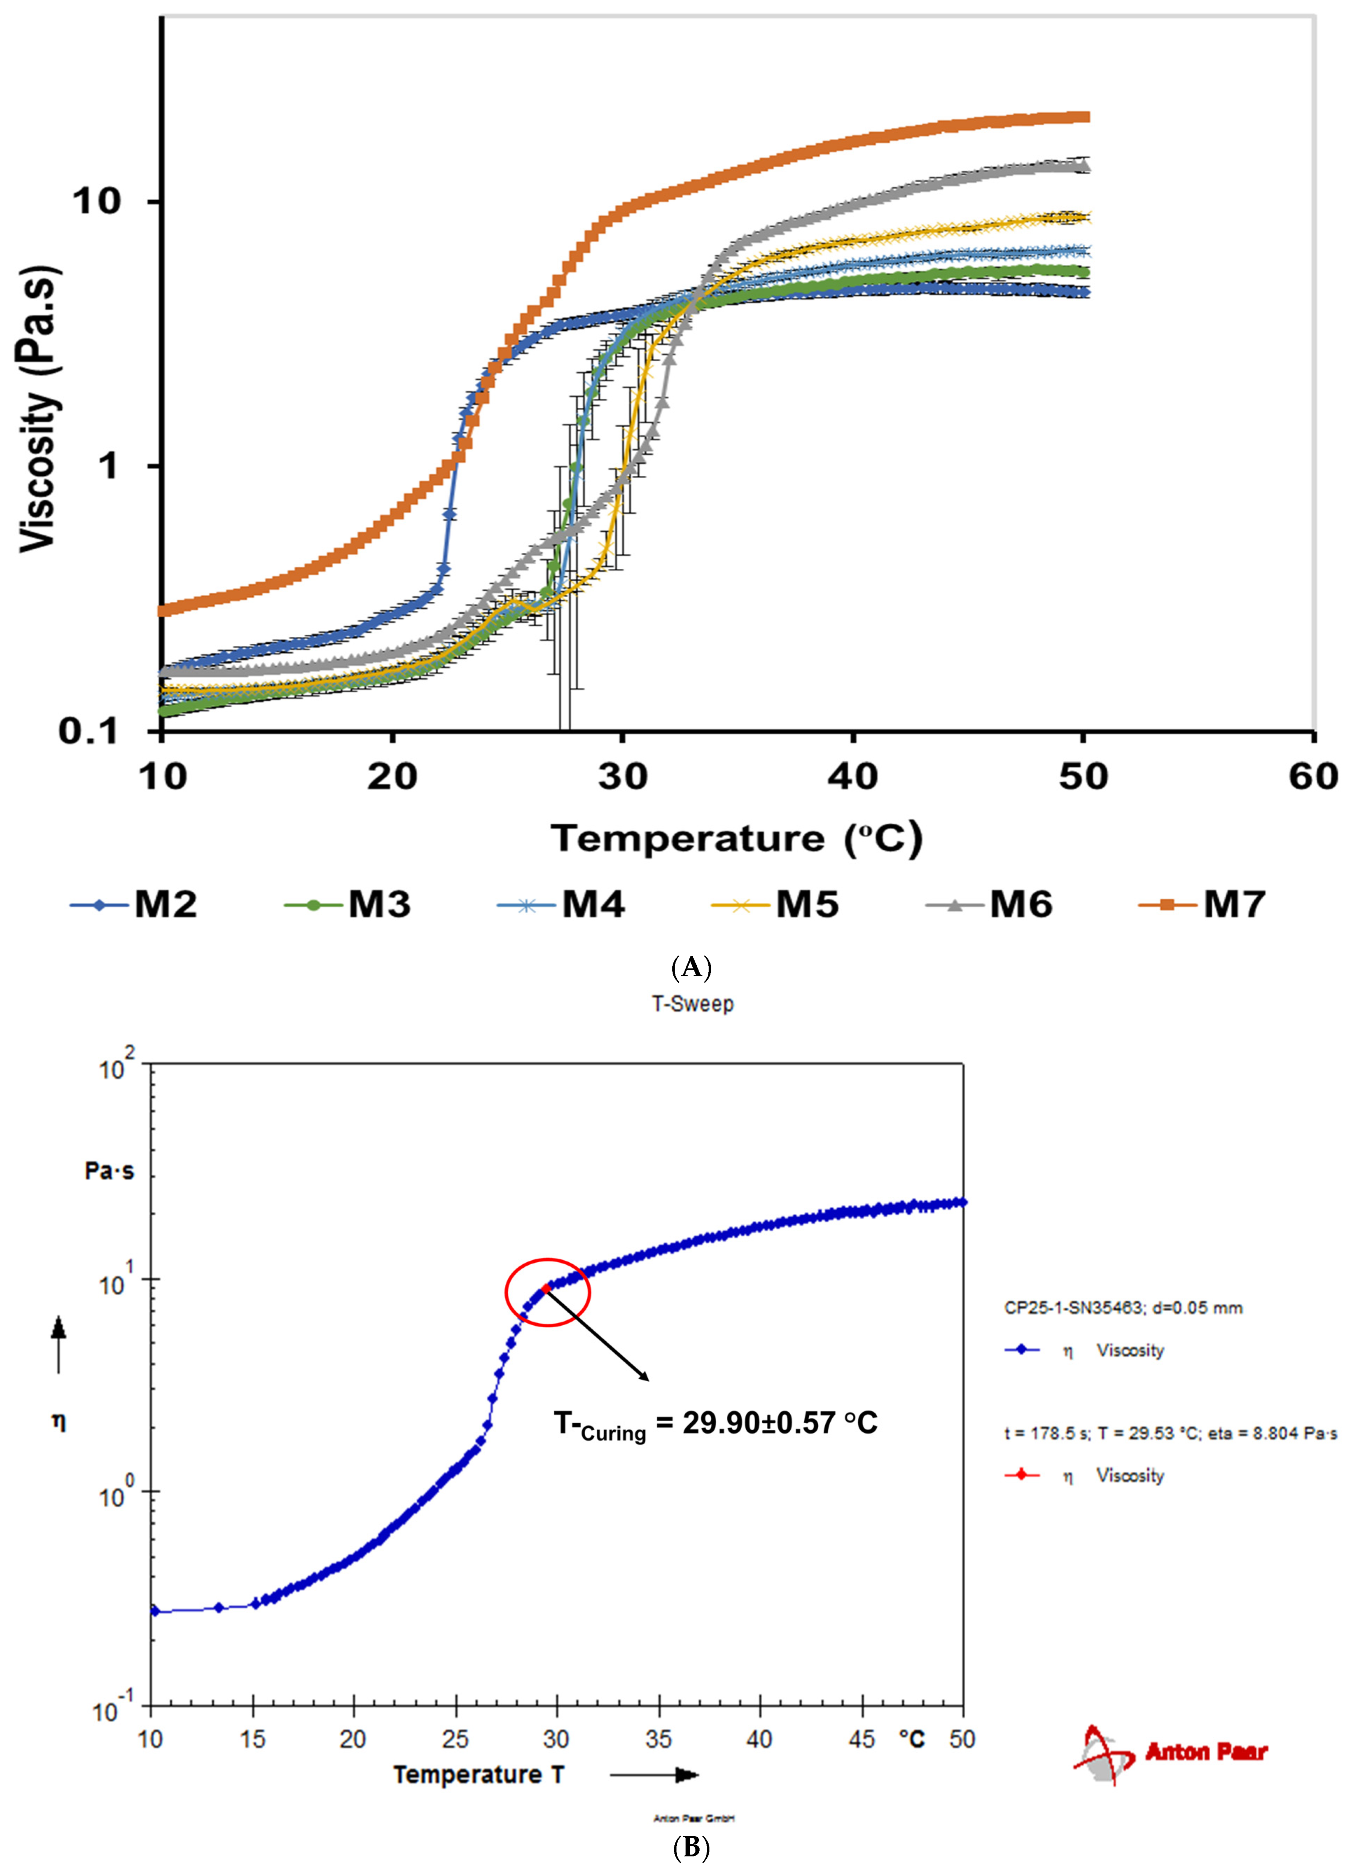
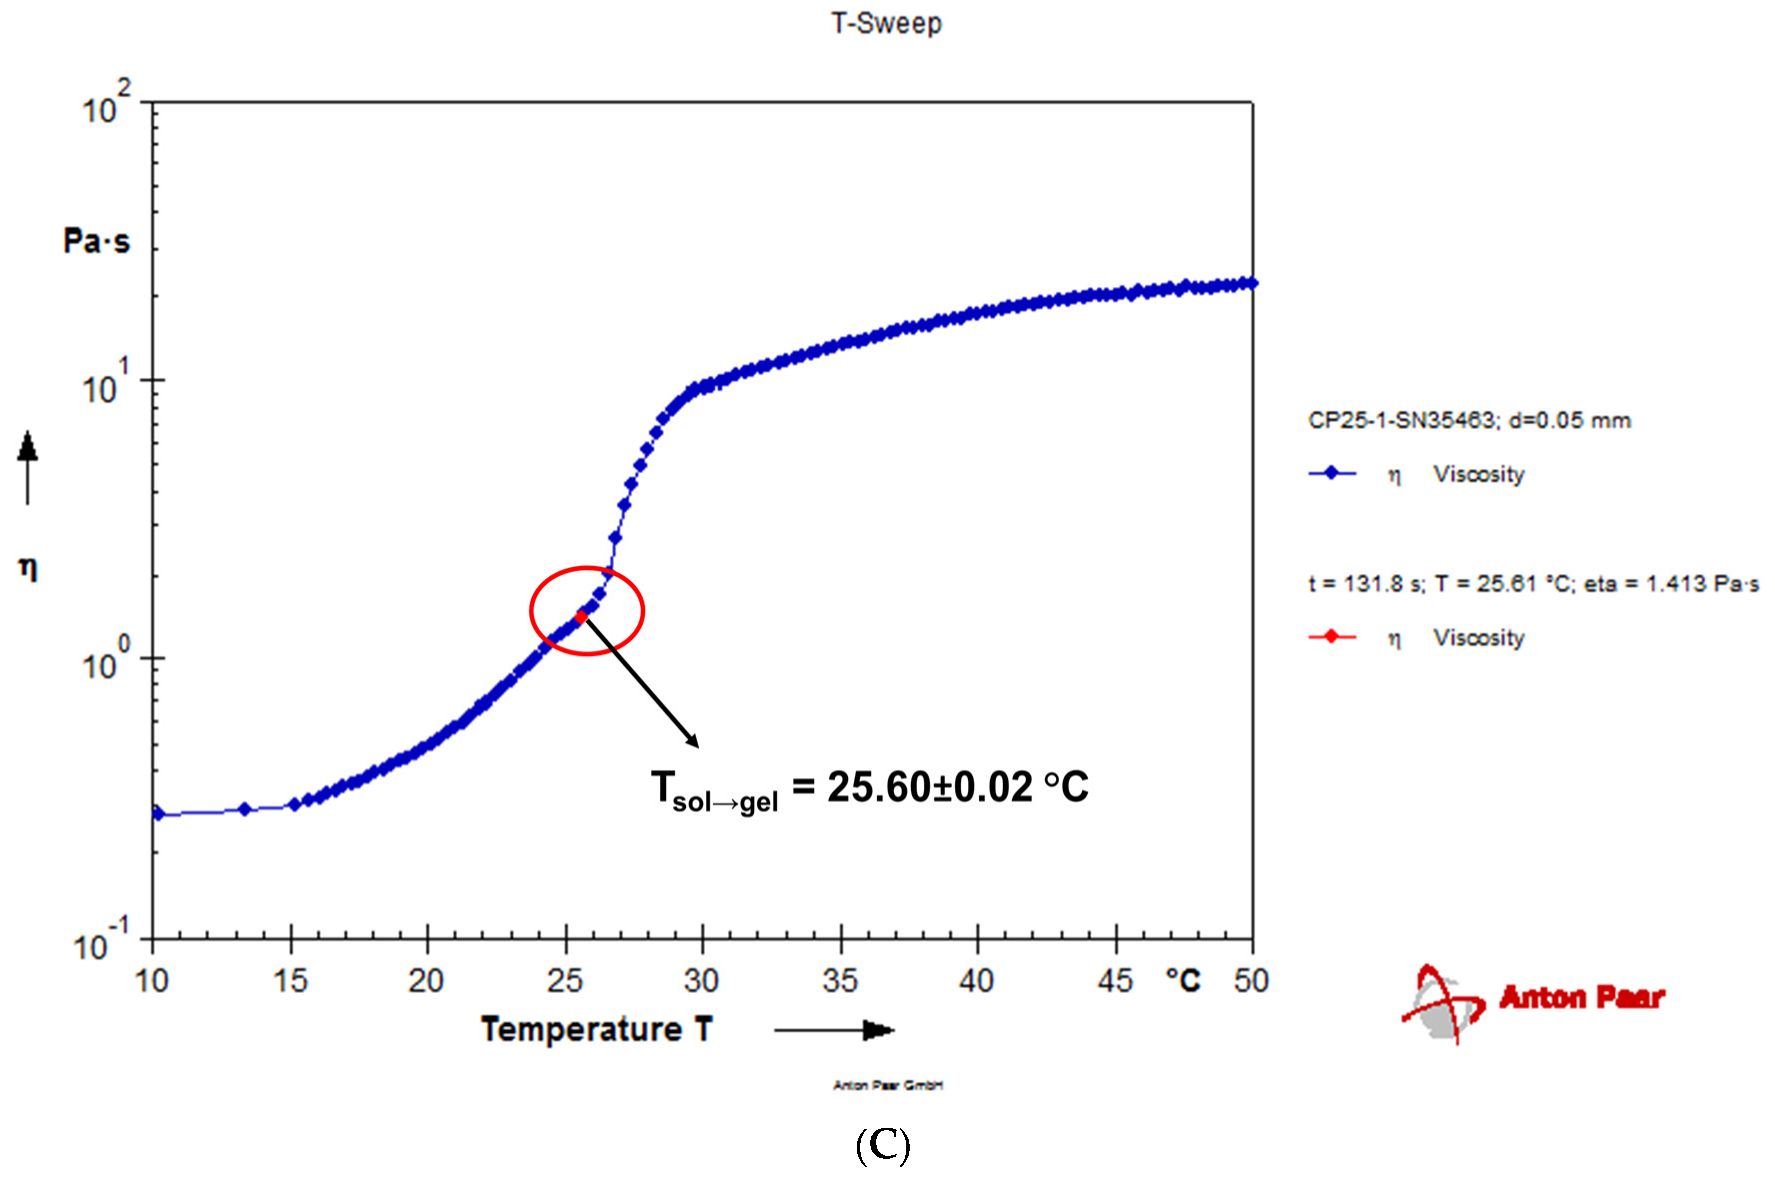
3.5.5. Temperature–Sweep
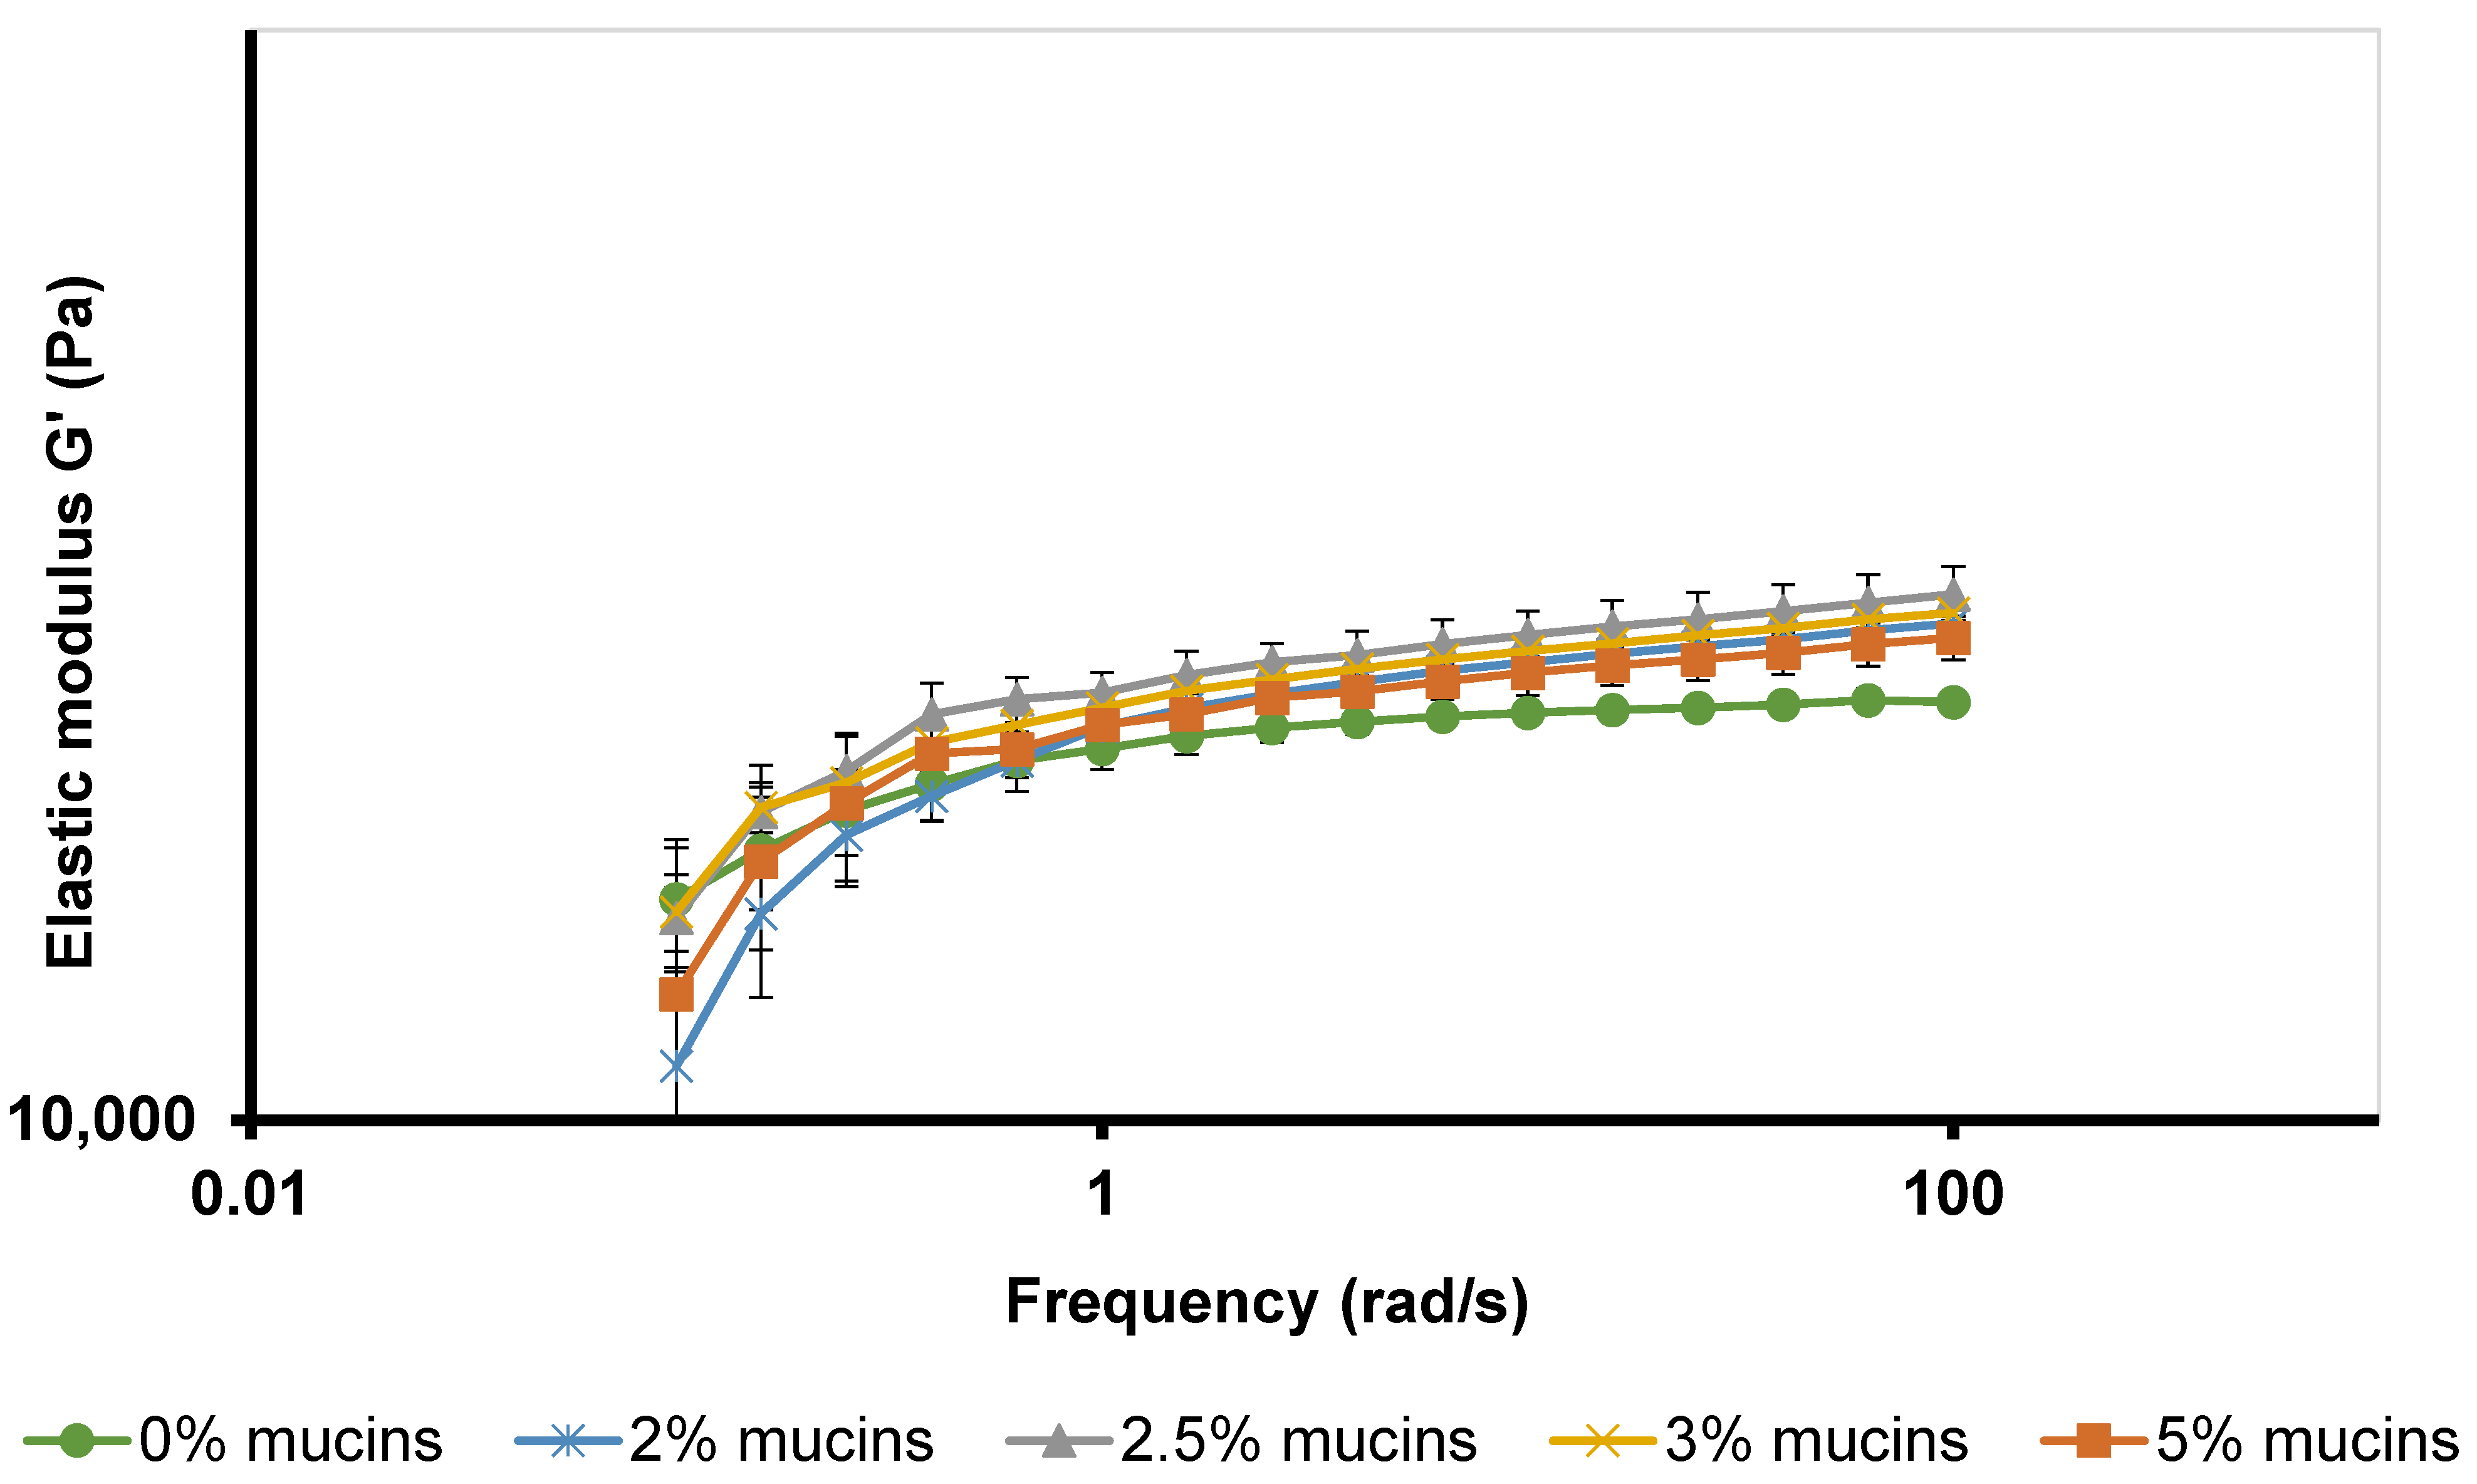
3.6. Mucoadhesion Studies
3.7. Eye Irritation
3.8. Drug Assay
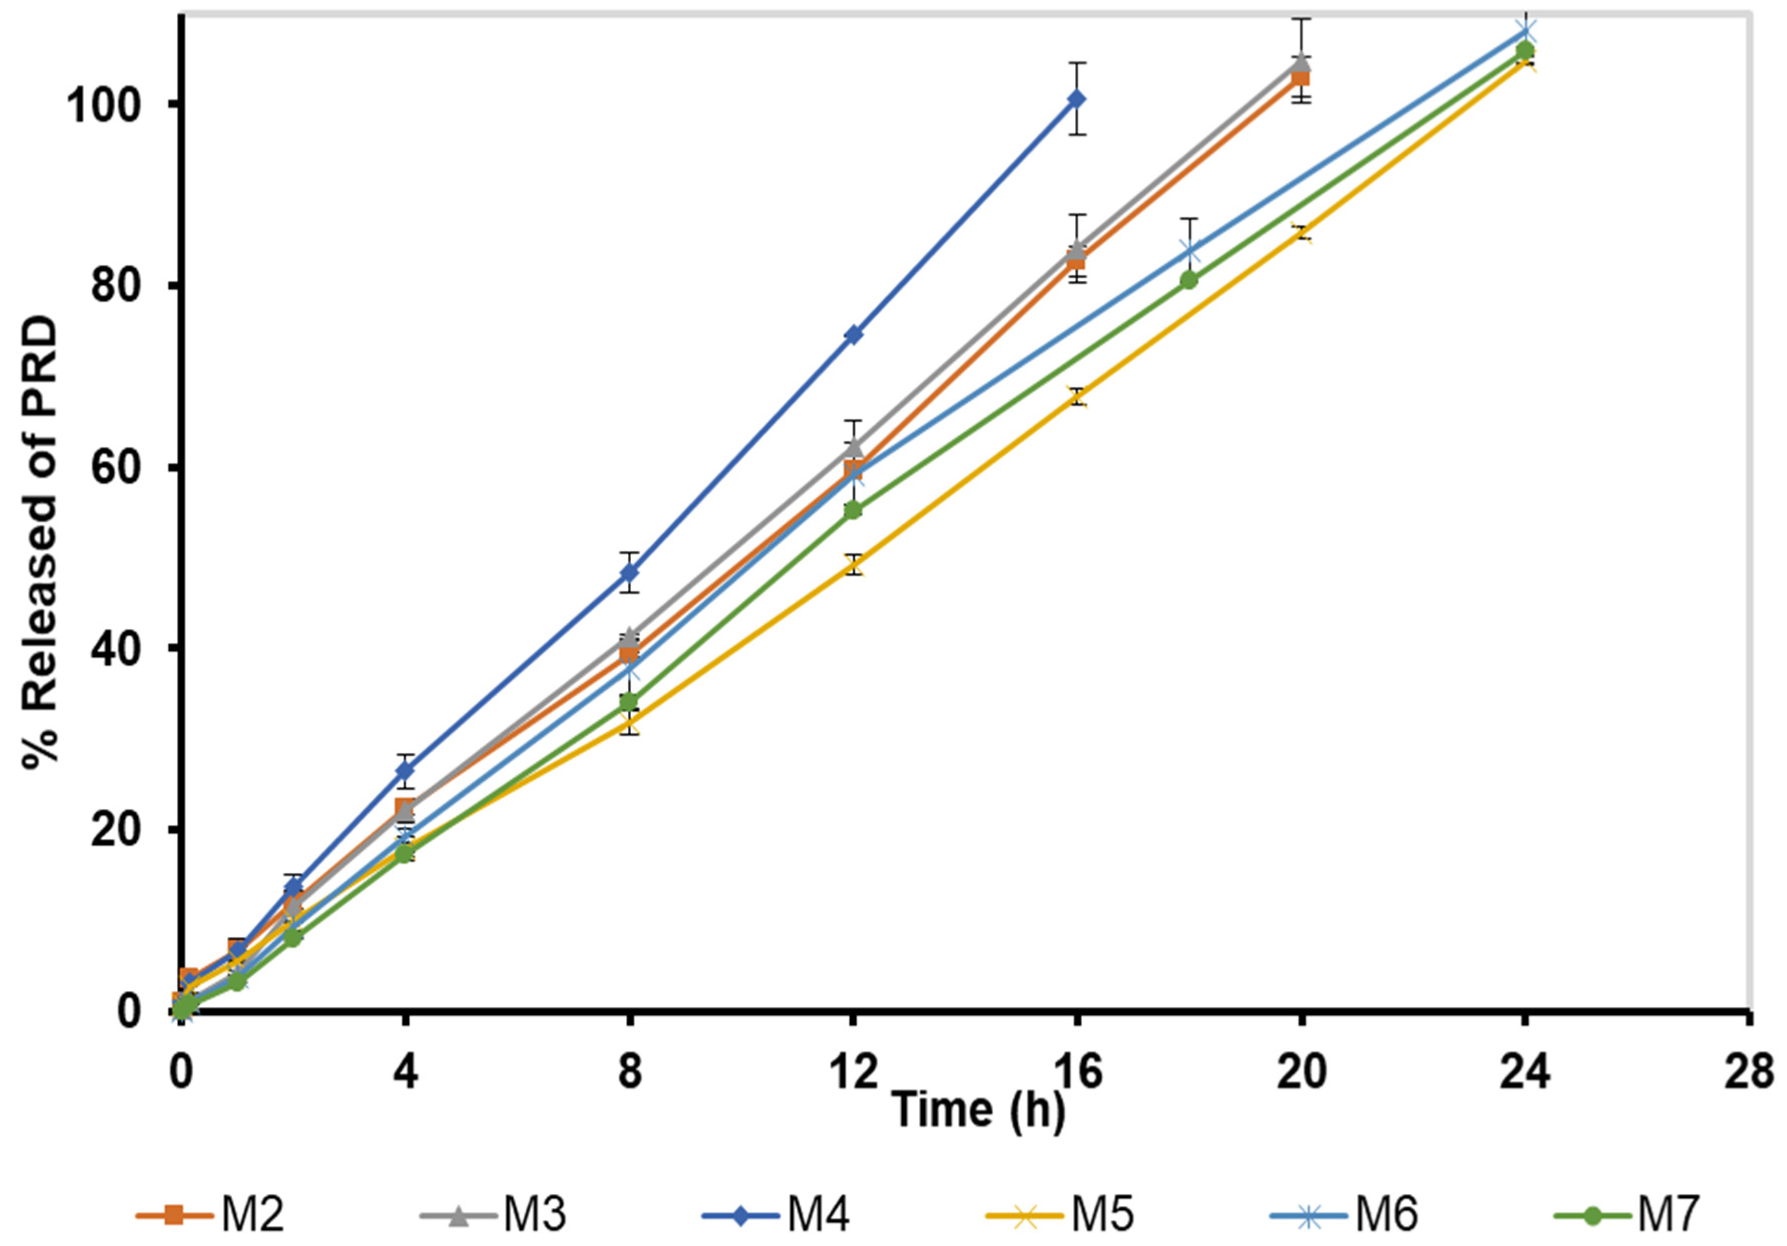
3.9. In Vitro Release
3.10. Mechanism of Drug Release
3.11. Stability Studies of PRD Microgels
3.11.1. Thermal Stability
3.11.2. Size and Zeta Potential
3.11.3. Rheological Stability
Tsol→gel and T(gel)
Viscosity and Viscoelastic Properties
4. Conclusions
Author Contributions
Funding
Institutional Review Board Statement
Informed Consent Statement
Data Availability Statement
Acknowledgments
Conflicts of Interest
References
- Xu, H.; Rao, N. Grand Challenges in Ocular Inflammatory Diseases. Front. Ophthalmol. 2022, 2, 756689. [Google Scholar] [CrossRef]
- Glass, L.R.D.; Freitag, S.K. Orbital inflammation: Corticosteroids first. Surv. Ophthalmol. 2016, 61, 670–673. [Google Scholar] [CrossRef] [PubMed]
- Babu, K.; Mahendradas, P. Medical management of uveitis–current trends. Indian J. Ophthalmol. 2013, 61, 277. [Google Scholar] [CrossRef] [PubMed]
- Kumria, R.; Nair, A.B.; Goomber, G.; Gupta, S. Buccal films of prednisolone with enhanced bioavailability. Drug Deliv. 2016, 23, 471–478. [Google Scholar] [CrossRef]
- Vogt, M.; Derendorf, H.; Krämer, J.; Junginger, H.; Midha, K.; Shah, V.; Stavchansky, S.; Dressman, J.; Barends, D. Biowaiver Monographs for Immediate Release Solid OralDosage Forms: Prednisolone. J. Pharm. Sci. 2007, 96, 27–37. [Google Scholar] [CrossRef]
- Abu-Huwaij, R.; Al-Assaf, S.F.; Hamed, R. Recent exploration of nanoemulsions for drugs and cosmeceuticals delivery. J. Cosmet. Dermatol. 2021. [Google Scholar] [CrossRef]
- Gawin-Mikołajewicz, A.; Nartowski, K.P.; Dyba, A.J.; Gołkowska, A.M.; Malec, K.; Karolewicz, B.E. Ophthalmic nanoemulsions: From composition to technological processes and quality control. Mol. Pharm. 2021, 18, 3719–3740. [Google Scholar] [CrossRef]
- Vandamme, T.F. Microemulsions as ocular drug delivery systems: Recent developments and future challenges. Prog. Retin. Eye Res. 2002, 21, 15–34. [Google Scholar] [CrossRef]
- Vigani, B.; Rossi, S.; Sandri, G.; Bonferoni, M.C.; Caramella, C.M.; Ferrari, F. Recent advances in the development of in situ gelling drug delivery systems for non-parenteral administration routes. Pharmaceutics 2020, 12, 859. [Google Scholar] [CrossRef]
- Bhowmik, M.; Das, S.; Chattopadhyay, D.; Ghosh, L.K. Study of thermo-sensitive in-situ gels for ocular delivery. Sci. Pharm. 2011, 79, 351–358. [Google Scholar] [CrossRef] [Green Version]
- Liu, Y.; Feng, N. Nanocarriers for the delivery of active ingredients and fractions extracted from natural products used in traditional Chinese medicine (TCM). Adv. Colloid Interface Sci. 2015, 221, 60–76. [Google Scholar] [CrossRef]
- Sun, C.; Li, W.; Ma, P.; Li, Y.; Zhu, Y.; Zhang, H.; Adu-Frimpong, M.; Deng, W.; Yu, J.; Xu, X. Development of TPGS/F127/F68 mixed polymeric micelles: Enhanced oral bioavailability and hepatoprotection of syringic acid against carbon tetrachloride-induced hepatotoxicity. Food Chem. Toxicol. 2020, 137, 111126. [Google Scholar] [CrossRef]
- Hamed, R.; Al-Adhami, Y.; Abu-Huwaij, R. Concentration of a microemulsion influences the mechanical properties of ibuprofen in situ microgels. Int. J. Pharm. 2019, 570, 118684. [Google Scholar] [CrossRef]
- Obaidat, R.; Kwiak, A.D.A.; Hamed, R. Development of combined therapy of metronidazole and ibuprofen using in situ microgels for the treatment of periodontitis. J. Drug. Deliv. Sci. Technol. 2022, 71, 103314. [Google Scholar] [CrossRef]
- Gan, L.; Gan, Y.; Zhu, C.; Zhang, X.; Zhu, J. Novel microemulsion in situ electrolyte-triggered gelling system for ophthalmic delivery of lipophilic cyclosporine A: In vitro and in vivo results. Int. J. Pharm. 2009, 365, 143–149. [Google Scholar] [CrossRef]
- Hamed, R.; Basil, M.; AlBaraghthi, T.; Sunoqrot, S.; Tarawneh, O. Nanoemulsion-based gel formulation of diclofenac diethylamine: Design, optimization, rheological behavior and in vitro diffusion studies. Pharm. Dev.Technol. 2016, 21, 980–989. [Google Scholar] [CrossRef]
- Kale, S.N.; Deore, S.L. Emulsion micro emulsion and nano emulsion: A review. Syst. Rev. Pharm. 2017, 8, 39. [Google Scholar] [CrossRef]
- Alkilani, A.Z.; Hamed, R.; Al-Marabeh, S.; Kamal, A.; Abu-Huwaij, R.; Hamad, I. Nanoemulsion-based film formulation for transdermal delivery of carvedilol. J. Drug Deliv. Sci. Technol. 2018, 46, 122–128. [Google Scholar] [CrossRef]
- Srividya, B.; Cardoza, R.M.; Amin, P. Sustained ophthalmic delivery of ofloxacin from a pH triggered in situ gelling system. J. Control. Release 2001, 73, 205–211. [Google Scholar] [CrossRef]
- Takeuchi, M.; Kageyama, S.; Suzuki, H.; Wada, T.; Notsu, Y.; Ishii, F. Rheological properties of reversible thermo-setting in situ gelling solutions with the methylcellulose–polyethylene glycol–citric acid ternary system. Colloid Polym. Sci. 2003, 281, 1178–1183. [Google Scholar] [CrossRef]
- Abu-Rumman, A.; Abu-Huwaij, R.; Hamed, R. Development and in vitro appraisal of Soluplus® and/or Carbopol® 971 buccoadhesive patches releasing atorvastatin. J. Adhes. 2020, 98, 915–933. [Google Scholar] [CrossRef]
- Hamed, R.; Farhan, A.; Abu-Huwaij, R.; Mahmoud, N.N.; Kamal, A. Lidocaine microemulsion-laden organogels as lipid-based systems for topical delivery. J. Pharm. Innov. 2020, 15, 521–534. [Google Scholar] [CrossRef]
- Dong, L.; Cornaglia, M.; Krishnamani, G.; Zhang, J.; Mouchiroud, L.; Lehnert, T.; Auwerx, J.; Gijs, M.A. Reversible and long-term immobilization in a hydrogel-microbead matrix for high-resolution imaging of Caenorhabditis elegans and other small organisms. PLoS ONE 2018, 13, e0193989. [Google Scholar] [CrossRef] [PubMed]
- Hamed, R.; AbuRezeq, A.A.; Tarawneh, O. Development of hydrogels, oleogels, and bigels as local drug delivery systems for periodontitis. Drug Dev. Ind. Pharm. 2018, 44, 1488–1497. [Google Scholar] [CrossRef]
- Hägerström, H.; Paulsson, M.; Edsman, K. Evaluation of mucoadhesion for two polyelectrolyte gels in simulated physiological conditions using a rheological method. Eur. J. Pharm. Sci. 2000, 9, 301–309. [Google Scholar] [CrossRef]
- Mayol, L.; Quaglia, F.; Borzacchiello, A.; Ambrosio, L.; La Rotonda, M.I. A novel poloxamers/hyaluronic acid in situ forming hydrogel for drug delivery: Rheological, mucoadhesive and in vitro release properties. Eur. J. Pharm. Biopharm. 2008, 70, 199–206. [Google Scholar] [CrossRef]
- Rossi, S.; Bonferoni, M.; Ferrari, F.; Bertoni, M.; Caramella, C. Characterization of mucin interaction with three viscosity grades of sodium carboxymethylcellulose. Comparison between rheological and tensile testing. Eur. J. Pharm. Sci. 1996, 4, 189–196. [Google Scholar] [CrossRef]
- Tamburic, S.; Craig, D.Q. A comparison of different in vitro methods for measuring mucoadhesive performance. Eur. J. Pharm. Biopharm. 1997, 44, 159–167. [Google Scholar] [CrossRef]
- Bozdağ, S.; Gümüş, K.; Gümüş, Ö.; Ünlü, N. Formulation and in vitro evaluation of cysteamine hydrochloride viscous solutions for the treatment of corneal cystinosis. Eur. J. Pharm. Biopharm. 2008, 70, 260–269. [Google Scholar] [CrossRef]
- Chhonker, Y.S.; Prasad, Y.D.; Chandasana, H.; Vishvkarma, A.; Mitra, K.; Shukla, P.K.; Bhatta, R.S. Amphotericin-B entrapped lecithin/chitosan nanoparticles for prolonged ocular application. Int. J. Biol. Macromol. 2015, 72, 1451–1458. [Google Scholar] [CrossRef]
- Morsi, N.; Ibrahim, M.; Refai, H.; El Sorogy, H. Nanoemulsion-based electrolyte triggered in situ gel for ocular delivery of acetazolamide. Eur. J. Pharm. Sci. 2017, 104, 302–314. [Google Scholar] [CrossRef]
- Algaradi, A.A.S.A. Development and Validation of an RP-HPLC Method for Estimation of Prednisolone and its Degradation Products in Tablets. EC Pharm. Sci. 2016, 2, 312–324. [Google Scholar]
- Cohen, S.; Lobel, E.; Trevgoda, A.; Peled, Y. A novel in situ-forming ophthalmic drug delivery system from alginates undergoing gelation in the eye. J. Control. Release. 1997, 44, 201–208. [Google Scholar] [CrossRef]
- Hamed, R.; Seder, B.Y.; Bardaweel, S.K.; Qawass, H. Lipid-based formulations of microemulsion-loaded oleogels for the oral delivery of carvedilol. J. Dispers. Sci. Technol. 2021, 1–11. [Google Scholar] [CrossRef]
- Zaid Alkilani, A.; Hamed, R.; Hussein, G.; Alnadi, S. Nanoemulsion-based patch for the dermal delivery of ascorbic acid. J. Dispers. Sci. Technol. 2021, 1–11. [Google Scholar] [CrossRef]
- Hamed, R.; Mahmoud, N.N.; Alnadi, S.H.; Alkilani, A.Z.; Hussein, G. Diclofenac diethylamine nanosystems-loaded bigels for topical delivery: Development, rheological characterization, and release studies. Drug Dev. Ind. Pharm. 2020, 46, 1705–1715. [Google Scholar] [CrossRef]
- Abu-Huwaij, R.; Hamed, R.; Daoud, E.; Alkilani, A.Z. Develoment and in vitro characterization of nanoemulsion-based buccal patches of valsartan. Acta Pol. Pharm. 2019, 76, 313–321. [Google Scholar]
- Pham, M.N.; Vo Van, T.; Tran, P.H.-L.; Tran, T.T.-D. Development of microemulsion containing prednisolone. In International Conference on the Development of Biomedical Engineering in Vietnam; Springer: New York, NY, USA, 2017. [Google Scholar]
- Sahoo, S.; Pani, N.R.; Sahoo, S.K. Microemulsion based topical hydrogel of sertaconazole: Formulation, characterization and evaluation. Colloids Surf. B Biointerfaces 2014, 120, 193–199. [Google Scholar] [CrossRef]
- Barot, B.S.; Parejiya, P.B.; Patel, H.K.; Gohel, M.C.; Shelat, P.K. Microemulsion-based gel of terbinafine for the treatment of onychomycosis: Optimization of formulation using D-optimal design. AAPS PharmSciTech 2012, 13, 184–192. [Google Scholar] [CrossRef]
- Wang, S.; Chen, P.; Zhang, L.; Yang, C.; Zhai, G. Formulation and evaluation of microemulsion-based in situ ion-sensitive gelling systems for intranasal administration of curcumin. J. Drug Target. 2012, 20, 831–840. [Google Scholar] [CrossRef]
- Chirio, D.; Peira, E.; Dianzani, C.; Muntoni, E.; Gigliotti, C.L.; Ferrara, B.; Sapino, S.; Chindamo, G.; Gallarate, M. Development of solid lipid nanoparticles by cold dilution of microemulsions: Curcumin loading, preliminary in vitro studies, and biodistribution. Nanomaterials 2019, 9, 230. [Google Scholar] [CrossRef]
- Lin, H.-Y.; Thomas, J.L.; Chen, H.-W.; Shen, C.-M.; Yang, W.-J.; Lee, M.-H. In vitro suppression of oral squamous cell carcinoma growth by ultrasound-mediated delivery of curcumin microemulsions. Int. J. Nanomed. 2012, 7, 941. [Google Scholar]
- Joseph, E.; Singhvi, G. Chapter 4—Multifunctional nanocrystals for cancer therapy: A potential nanocarrier. In Nanomaterials for Drug Delivery and Therapy; Grumezescu, A.M., Ed.; William Andrew Publishing: Norwich, NY, USA, 2019; pp. 91–116. [Google Scholar]
- Borole, P.M.; Chaudhari, Y.S.; Dharashirakar, S.; Kumavat, S.D.; Shenghani, K.; Shah, P.R. Preparation and evaluation of in situ gel of Levofloxacin hemihydrate for treatment of periodontal disease. Int. J. Pharma. Res. Biol. Sci. 2013, 2, 185–196. [Google Scholar]
- Mahmoud, N.N.; Hikmat, S.; Ghith, D.A.; Hajeer, M.; Hamadneh, L.; Qattan, D.; Khalil, E.A. Gold nanoparticles loaded into polymeric hydrogel for wound healing in rats: Effect of nanoparticles’ shape and surface modification. Int. J. Pharm. 2019, 565, 174–186. [Google Scholar] [CrossRef]
- Uddin, M.S.; Al Mamun, A.; Kabir, M.T.; Setu, J.R.; Zaman, S.; Begum, Y.; Amran, M.S. Quality control tests for ophthalmic pharmaceuticals: Pharmacopoeial standards and specifications. J. Adv. Med. Pharm. Sci. 2017, 14, 1–17. [Google Scholar] [CrossRef]
- Alruwaili, N.K.; Zafar, A.; Imam, S.S.; Alharbi, K.S.; Alotaibi, N.H.; Alshehri, S.; Alhakamy, N.A.; Alzarea, A.I.; Afzal, M.; Elmowafy, M. Stimulus responsive ocular gentamycin-ferrying chitosan nanoparticles hydrogel: Formulation optimization, ocular safety and antibacterial assessment. Int. J. Nanomed. 2020, 15, 4717. [Google Scholar] [CrossRef]
- Thapa, R.K.; Cazzador, F.; Grønlien, K.G.; Tønnesen, H.H. Effect of curcumin and cosolvents on the micellization of Pluronic F127 in aqueous solution. Colloids Surf. B Biointerfaces 2020, 195, 111250. [Google Scholar] [CrossRef]
- Shaarani, S.; Hamid, S.S.; Kaus, N.H.M. The Influence of pluronic F68 and F127 nanocarrier on physicochemical properties, in vitro release, and antiproliferative activity of thymoquinone drug. Pharmacogn. Res. 2017, 9, 12. [Google Scholar]
- Ammar, H.O.; Salama, H.; Ghorab, M.; Mahmoud, A. Nanoemulsion as a potential ophthalmic delivery system for dorzolamide hydrochloride. AAPS PharmSciTech 2009, 10, 808–819. [Google Scholar] [CrossRef]
- López-Alemany, A.; Montés-Micó, R.; Garcia-Valldecabres, M. Ocular physiology and artificial tears. J. Am. Optom. Assoc. 1999, 70, 455–460. [Google Scholar] [PubMed]
- Fialho, S.L.; Da Silva-Cunha, A. New vehicle based on a microemulsion for topical ocular administration of dexamethasone. Clin. Exp. Ophthalmol. 2004, 32, 626–632. [Google Scholar] [CrossRef] [PubMed]
- Shen, C.; Zhu, J.; Song, J.; Wang, J.; Shen, B.; Yuan, H.; Li, X. Formulation of pluronic F127/TPGS mixed micelles to improve the oral absorption of glycyrrhizic acid. Drug Dev. Ind. Pharm. 2020, 46, 1100–1107. [Google Scholar] [CrossRef] [PubMed]
- Wik, J.; Bansal, K.K.; Assmuth, T.; Rosling, A.; Rosenholm, J.M. Facile methodology of nanoemulsion preparation using oily polymer for the delivery of poorly soluble drugs. Drug Deliv. Transl. Res. 2020, 10, 1228–1240. [Google Scholar] [CrossRef] [PubMed]
- Efron, N.; Young, G.; Brennan, N.A. Ocular surface temperature. Curr. Eye Res. 1989, 8, 901–906. [Google Scholar]
- Mahboobian, M.M.; Mohammadi, M.; Mansouri, Z. Development of thermosensitive in situ gel nanoemulsions for ocular delivery of acyclovir. J. Drug Deliv. Sci. Technol. 2020, 55, 101400. [Google Scholar] [CrossRef]
- Wei, G.; Xu, H.; Ding, P.T.; Zheng, J.M. Thermosetting gels with modulated gelation temperature for ophthalmic use: The rheological and gamma scintigraphic studies. J. Control. Release 2002, 83, 65–74. [Google Scholar] [CrossRef]
- Qi, H.; Li, L.; Huang, C.; Li, W.; Wu, C. Optimization and physicochemical characterization of thermosensitive poloxamer gel containing puerarin for ophthalmic use. Chem. Pharm. Bull. 2006, 54, 1500–1507. [Google Scholar] [CrossRef]
- Fathalla, Z.; Mustafa, W.W.; Abdelkader, H.; Moharram, H.; Sabry, A.M.; Alany, R.G. Hybrid thermosensitive-mucoadhesive in situ forming gels for enhanced corneal wound healing effect of L-carnosine. Drug Deliv. 2022, 29, 374–385. [Google Scholar] [CrossRef]
- Palanisamy, M.; Khanam, J. Solid dispersion of prednisolone: Solid state characterization and improvement of dissolution profile. Drug Dev. Ind. Pharm. 2011, 37, 373–386. [Google Scholar] [CrossRef]
- Branca, C.; Khouzami, K.; Wanderlingh, U.; D’Angelo, G. Effect of intercalated chitosan/clay nanostructures on concentrated pluronic F127 solution: A FTIR-ATR, DSC and rheological study. J. Colloid Interface Sci. 2018, 517, 221–229. [Google Scholar] [CrossRef]
- Karolewicz, B.; Górniak, A.; Owczarek, A.; Żurawska-Płaksej, E.; Piwowar, A.; Pluta, J. Thermal, spectroscopic, and dissolution studies of ketoconazole–Pluronic F127 system. J. Therm. Anal. Calorim. 2014, 115, 2487–2493. [Google Scholar] [CrossRef]
- Maghraby, G.M.; Alomrani, A.H. Synergistic enhancement of itraconazole dissolution by ternary system formation with pluronic F68 and hydroxypropylmethylcellulose. Sci. Pharm. 2009, 77, 401–418. [Google Scholar] [CrossRef]
- Musto, P.; Karasz, F.; MacKnight, W. Hydrogen bonding in polybenzimidazole/polyimide systems: A Fourier-transform infra-red investigation using low-molecular-weight monofunctional probes. Polymer 1989, 30, 1012–1021. [Google Scholar] [CrossRef]
- Lima, C.S.D.; Balogh, T.S.; Varca, J.P.; Varca, G.H.; Lugão, A.B.; Camacho-Cruz, A.L.; Bucio, E.; Kadlubowski, S.S. An updated review of macro, micro, and nanostructured hydrogels for biomedical and pharmaceutical applications. Pharmaceutics 2020, 12, 970. [Google Scholar] [CrossRef]
- Cavallari, C.; Fini, A.; Ceschel, G. Design of olanzapine/lutrol solid dispersions of improved stability and performances. Pharmaceutics 2013, 5, 570–590. [Google Scholar] [CrossRef]
- Veiga, M.; Cadorniga, R.; Lozana, R. Thermal study of prednisolone polymorphs. Thermochim. Acta 1985, 96, 111–115. [Google Scholar] [CrossRef]
- Obaidat, R.M.; AlTaani, B.; Ailabouni, A. Effect of different polymeric dispersions on in-vitro dissolution rate and stability of celecoxib class II drug. J. Polym. Res. 2017, 24, 1–14. [Google Scholar] [CrossRef]
- Sayed, S.; Elsharkawy, F.M.; Amin, M.M.; Shamsel-Din, H.A.; Ibrahim, A.B. Brain targeting efficiency of intranasal clozapine-loaded mixed micelles following radio labeling with Technetium-99m. Drug Deliv. 2021, 28, 1524–1538. [Google Scholar] [CrossRef]
- Sayed, S.; Habib, B.A.; Elsayed, G.M. Tri-block co-polymer nanocarriers for enhancement of oral delivery of felodipine: Preparation, in vitro characterization and ex vivo permeation. J. Liposome Res. 2018, 28, 182–192. [Google Scholar] [CrossRef]
- Mehdaoui, H.; Ait Abderrahmane, H.; de Loubens, C.; Nait Bouda, F.; Hamani, S. Dynamics of a Gel-Based Artificial Tear Film with an Emphasis on Dry Disease Treatment Applications. Gels 2021, 7, 215. [Google Scholar] [CrossRef]
- Pakzad, Y.; Fathi, M.; Omidi, Y.; Mozafari, M.; Zamanian, A. Synthesis and characterization of timolol maleate-loaded quaternized chitosan-based thermosensitive hydrogel: A transparent topical ocular delivery system for the treatment of glaucoma. Int. J. Biol. Macromol. 2020, 159, 117–128. [Google Scholar] [CrossRef]
- Pawar, P.; Kashyap, H.; Malhotra, S.; Sindhu, R. Hp-β-CD-voriconazole in situ gelling system for ocular drug delivery: In vitro, stability, and antifungal activities assessment. Biomed. Res. Int. 2013, 2013, 1–9. [Google Scholar] [CrossRef]
- Edsman, K.; Carlfors, J.; Harju, K. Rheological evaluation and ocular contact time of some carbomer gels for ophthalmic use. Int. J. Pharm. 1996, 137, 233–241. [Google Scholar] [CrossRef]
- Mukhopadhyay, S.; De, P.R.; Bhattacharyya, K.; Layek, G. Casson fluid flow over an unsteady stretching surface. Ain Shams Eng. J. 2013, 4, 933–938. [Google Scholar] [CrossRef]
- Binsi, P.; Shamasundar, B.; Dileep, A.; Badii, F.; Howell, N. Rheological and functional properties of gelatin from the skin of Bigeye snapper (Priacanthus hamrur) fish: Influence of gelatin on the gel-forming ability of fish mince. Food Hydrocoll. 2009, 23, 132–145. [Google Scholar] [CrossRef]
- Contreras, M.; Sanchez, R. Application of a factorial design to the study of the flow behavior, spreadability and transparency of a Carbopol ETD 2020 gel. Part II . Int. J. Pharm. Investig. 2002, 234, 149–157. [Google Scholar] [CrossRef]
- Mahmoud, N.N.; Hamed, R.; Khalil, E.A. Colloidal stability and rheological properties of gold nanoparticle–loaded polymeric hydrogels: Impact of nanoparticle’s shape, surface modification, and concentration. Colloid Polym. Sci. 2020, 298, 989–999. [Google Scholar] [CrossRef]
- Hamed, R.; Al-Samydai, A.; Al Baraghthi, T.; Tarawneh, O.; Sunoqrot, S. Influence of HPMC K100LV and Compritol® HD5 ATO on drug release and rheological behavior of HPMC K4M matrix tablets. J. Pharm. Innov. 2017, 12, 62–75. [Google Scholar] [CrossRef]
- Cadenato, A.; Salla, J.; Ramis, X.; Morancho, J.; Marroyo, L.; Martin, J. Determination of gel and vitrification times of thermoset curing process by means of TMA, DMTA and DSC techniques: TTT diagram. J. Therm. Anal. Calorim. 1997, 49, 269–279. [Google Scholar] [CrossRef]
- Hoffman, J.; Khadka, S.; Kumosa, M. Determination of gel point and completion of curing in a single fiber/polymer composite. Compos. Sci. Technol. 2020, 188, 107997. [Google Scholar] [CrossRef]
- Baranowski, P.; Karolewicz, B.; Gajda, M.; Pluta, J. Ophthalmic drug dosage forms: Characterisation and research methods. Sci. World J. 2014, 2014, 1–14. [Google Scholar] [CrossRef]
- Ludwig, A. The use of mucoadhesive polymers in ocular drug delivery. Adv. Drug Deliv. Rev. 2005, 57, 1595–1639. [Google Scholar] [CrossRef]
- Sosnik, A.; das Neves, J.; Sarmento, B. Mucoadhesive polymers in the design of nano-drug delivery systems for administration by non-parenteral routes: A review. Prog. Polym. Sci. 2014, 39, 2030–2075. [Google Scholar] [CrossRef]
- Roggeband, R.; York, M.; Pericoi, M.; Braun, W. Eye irritation responses in rabbit and man after single applications of equal volumes of undiluted model liquid detergent products. Food Chem. Toxicol. 2000, 38, 727–734. [Google Scholar] [CrossRef]
- Hanafy, A.F.; Abdalla, A.M.; Guda, T.K.; Gabr, K.E.; Royall, P.G.; Alqurshi, A. Ocular anti-inflammatory activity of prednisolone acetate loaded chitosan-deoxycholate self-assembled nanoparticles. Int. J. Nanomed. 2019, 14, 3679. [Google Scholar] [CrossRef]
- Rajalakshmi, R.; Padmaja, C.; Radhika, N.; Kumuda, P.; Pavan Kumar, P.; Ujjwala, B.; Vinesha, V. Formulation and assessment of gemifloxacin mesylate ocular in situ gelling system. Int. Res. J. Pharm. 2013, 4, 33–38. [Google Scholar]
- Jahromi, L.P.; Ghazali, M.; Ashrafi, H.; Azadi, A. A comparison of models for the analysis of the kinetics of drug release from PLGA-based nanoparticles. Heliyon 2020, 6, e03451. [Google Scholar] [CrossRef] [Green Version]
- Korsmeyer, R.W.; Gurny, R.; Doelker, E.; Buri, P.; Peppas, N.A. Mechanisms of solute release from porous hydrophilic polymers. Int. J. Pharm. 1983, 15, 25–35. [Google Scholar] [CrossRef]
- Li, P.-H.; Chiang, B.-H. Process optimization and stability of D-limonene-in-water nanoemulsions prepared by ultrasonic emulsification using response surface methodology. Ultrason. Sonochem. 2012, 19, 192–197. [Google Scholar] [CrossRef]


| System | *Smix (Ratio, w/w%) | OA (w/w%) | Water (w/w%) | Pass/Fail the Visual Test |
|---|---|---|---|---|
| S1 | TW-20: Ethanol (1:1, 55) | 10 | 35 | Pass |
| S2 | TW-20: Ethanol (1:2, 55) | 10 | 35 | Pass |
| S3 | TW-20: Ethanol(2:1, 55) | 10 | 35 | Pass |
| S4 | TW-20: PG (1:1, 55) | 10 | 35 | Pass |
| S5 | TW-20: PG (1:2, 55) | 10 | 35 | Pass |
| S6 | TW-20: PG (2:1, 55) | 10 | 35 | Pass |
| S7 | LB: Ethanol (1:1, 55) | 10 | 35 | Fail |
| S8 | LB: Ethanol (1:2, 55) | 10 | 35 | Fail |
| S9 | LB: Ethanol (2:1, 55) | 10 | 35 | Fail |
| S10 | LB: PG (1:1, 55) | 10 | 35 | Fail |
| S11 | LB: PG (1:2, 55) | 10 | 35 | Fail |
| S12 | LB: PG (2:1, 55) | 10 | 35 | Fail |
| *PRD-ME | PRD (%) | Smix (Ratio, w/w%) | OA (w/w%) | Water (w/w%) | F68 (40%) (w/w%) | Observations |
|---|---|---|---|---|---|---|
| 1 | 1 | TW-20: Ethanol (1:1, 55) | 10 | 35 | - | Precipitation of PRD |
| 2 | 1 | TW-20: Ethanol (1:2, 55) | 10 | 35 | - | Precipitation of PRD |
| 3 | 1 | TW-20: Ethanol (2:1, 55) | 10 | 35 | - | Precipitation of PRD |
| 4 | 1 | TW-20: PG (1:1, 55) | 10 | 35 | - | Precipitation of PRD |
| 5 | 1 | TW-20: PG (1:2, 55) | 10 | 35 | - | Precipitation of PRD |
| 6 | 1 | TW-20: PG (2:1, 55) | 10 | 35 | - | Precipitation of PRD |
| 7 | 0.25 | TW-20: Ethanol (1:2, 55) | 10 | - | 35 | Clear |
| 8 | 0.5 | TW-20: Ethanol (1:2, 55) | 10 | - | 35 | Clear |
| 9 | 0.75 | TW-20: Ethanol (1:2, 55) | 10 | - | 35 | Clear |
| 10 | 1 | TW-20: Ethanol (1:2, 55) | 10 | - | 35 | Precipitation of PRD |
| PRD Microgels | *PRD (%) | F127 (%) | F68 (%) | Clarity | pH Mean ± SD | Surface Tension (mN/m) | Tsol→gel (°C) Mean ± SD | T(gel) (min) Mean ± SD |
|---|---|---|---|---|---|---|---|---|
| M1 | 0.25 | 10 | - | Not clear | Not reported | Not reported | 32.0 ± 0.5 | - |
| M2 | 0.25 | 12 | - | Clear (+) | 5.45 ± 0.08 | 31.4 ± 0.1 | 26.0 ± 0.7 | 1.47 ± 0.03 |
| M3 | 0.25 | 12 | 1 | Clear (++) | 5.58 ± 0.03 | 31.7 ± 0.8 | 30.5 ± 0.5 | 2.05 ± 0.03 |
| M4 | 0.25 | 12 | 2.5 | Clear (++) | 5.61 ± 0.04 | 35.4 ± 1.2 | 31.2 ± 0.7 | 2.22 ± 0.03 |
| M5 | 0.25 | 12 | 5 | Clear (++) | 5.76 ± 0.05 | 31.2 ± 0.1 | 33.0 ± 0.5 | 2.30 ± 0.08 |
| M6 | 0.25 | 12 | 7.5 | Clear (++) | 5.43 ± 0.06 | 37.0 ± 1.9 | 35.0 ± 1.0 | 2.35 ± 0.12 |
| M7 | 0.25 | 12 | 10 | Clear (++) | 5.71 ± 0.05 | 36.4 ± 2.0 | 30.0 ± 0.5 | 1.52 ± 0.35 |
| M8 | 0.5 | 12 | - | Not Clear (Precipitation of PRD) | Not reported | Not reported | Not reported | Not reported |
| M9 | 0.5 | 12 | 7.5 | Not Clear (Precipitation of PRD) | Not reported | Not reported | Not reported | Not reported |
| M10 | 0.5 | 12 | 10 | Not Clear (Precipitation of PRD) | Not reported | Not reported | Not reported | Not reported |
| M11 | 0.75 | 12 | - | Not Clear (Precipitation of PRD) | Not reported | Not reported | Not reported | Not reported |
| M12 | 0.75 | 12 | 7.5 | Not Clear (Precipitation of PRD) | Not reported | Not reported | Not reported | Not reported |
| M13 | 0.75 | 12 | 10 | Not Clear (Precipitation of PRD) | Not reported | Not reported | Not reported | Not reported |
| Time | Initial | 1 Week | 2 Weeks | 3 Weeks | One Month |
|---|---|---|---|---|---|
| MDS (nm) | 16.4 ± 2.2 | 18.7 ± 2.8 | 20.6 ± 2.8 | 39.8 ± 4.7 | 67.9 ± 1.9 |
| PDI | 0.24 ± 0.01 | 0.35 ± 0.01 | 0.31 ± 0.01 | 0.30 ± 0.04 | 0.30 ± 0.02 |
| ZP (mV) | −21.03 ± 1.24 | −14.40 ± 0.07 | −14.16 ± 2.21 | −12.60 ± 1.50 | −9.71 ± 0.60 |
| PRD Microgels | Initial | Three Months | ||
|---|---|---|---|---|
| Size (nm) | ZP (mV) | Size (nm) | ZP (mV) | |
| M2 | 22.1 ± 0.9 | −4.77 ± 0.47 | 53.9 ± 0.2 | −4.59 ± 0.92 |
| M3 | 21.8 ± 0.2 | −8.15 ± 1.36 | 39.1 ± 2.8 | −6.22 ± 0.73 |
| M4 | 20.2 ± 0.1 | −8.95 ± 1.30 | 50.5 ± 2.7 | −4.22 ± 0.65 |
| M5 | 20.7 ± 0.2 | −6.23 ± 0.03 | 53.0 ± 2.7 | −2.56 ± 0.38 |
| M6 | 23.0 ± 0.9 | −5.11 ± 0.99 | 58.3 ± 1.2 | −4.00 ± 0.50 |
| M7 | 21.3 ± 0.1 | −2.13 ± 0.79 | 52.0 ± 0.8 | −4.31 ± 0.34 |
| PRD Microgels | C-H Stretching Peak (cm−1) | C–O–C Stretching Vibration Peak (cm−1) | C=O Stretching Vibration Peak (cm−1) |
|---|---|---|---|
| M2 | 2994 | 995.5 | 1633 |
| M3 | 2995 | 990.6 | 1634 |
| M4 | 2996 | 990.6 | 1650 |
| M5 | 3000 | 987.6 | 1650 |
| M6 | 2997 | 990.0 | 1650 |
| M7 | 2923 | 985.8 | 1644 |
| PRD Microgels | Carreau–Yasuda Model | Casson Model | ||||||||
|---|---|---|---|---|---|---|---|---|---|---|
| Initial | After Six Months | Initial | After Six Months | |||||||
| (mPa·s) | (mPa·s) | R2 | (mPa·s) | (mPa·s) | R2 | (Pa) | R2 | (Pa) | R2 | |
| M2 | 1.10 × 10⁷ | 255.61 | 0.9982 | 9.02 × 10⁶ | 578.29 | 0.9986 | 231.49 | 0.9662 | 165.22 | 0.9884 |
| M3 | 1.07 × 10⁷ | 810.16 | 0.9981 | 1.08 × 10⁷ | 8750 | 0.9979 | 243.66 | 0.9983 | 220.23 | 0.9145 |
| M4 | 8.00 × 10⁶ | 615,74 | 0.9992 | 1.04 × 10⁷ | 803.67 | 0.9993 | 258.76 | 0.9951 | 211.94 | 0.9667 |
| M5 | 1.08 × 10⁷ | 606.8 | 0.9995 | 1.29 × 10⁷ | 186.15 | 0.9995 | 314.72 | 0.9224 | 334.85 | 0.9965 |
| M6 | 3.08 × 10⁷ | 726.81 | 0.9997 | 1.59 × 10⁷ | 746.6 | 0.9997 | 389.56 | 0.9640 | 370.68 | 0.9900 |
| M7 | 9.17 × 10⁷ | 0.1 | 0.9995 | 3.58 × 10⁷ | 684.08 | 0.9997 | 657.36 | 0.9012 | 481.29 | 0.9257 |
| PRD Microgels | LVR | γc |
|---|---|---|
| M2 | 0.01–0.251 | 0.04 |
| M3 | 0.0158–0.251 | 0.04 |
| M4 | 0.0251–0.251 | 0.10 |
| M5 | 0.0398–0.398 | 0.10 |
| M6 | 0.01–0.398 | 0.10 |
| M7 | 0.01–0.398 | 0.10 |
| PRD Microgels | Tsol→gel (°C) by Tube Inversion Method | T(gel) (min) | Temperature–Sweep Test | |||
|---|---|---|---|---|---|---|
| Initial | Six Months | Initial | Six Months | Tsol→gel (°C) | T-Curing (°C) | |
| M2 | 26.0 ± 0.7 | 25.0 ± 0.3 | 1.6 ± 0.1 | 1.5 ± 0.1 | 21.40 ± 0.17 | 26.79 ± 0.17 |
| M3 | 30.5 ± 0.5 | 30.0 ± 0.7 | 1.5 ± 0.0 | 1.4 ± 0.1 | 25.73 ± 0.24 | 30.78 ± 0.40 |
| M4 | 31.2 ± 0.7 | 30.5 ± 0.5 | 2.2 ± 0.1 | 2.0 ± 0.2 | 26.74 ± 0.15 | 30.62 ± 0.58 |
| M5 | 33.0 ± 0.5 | 33.0 ± 0.5 | 2.4 ± 0.1 | 2.2 ± 0.1 | 28.37 ± 0.17 | 33.80 ± 0.60 |
| M6 | 35.0 ± 1.0 | 34.5 ± 0.5 | 1.8 ± 0.2 | 1.8 ± 0.1 | 30.68 ± 0.04 | 34.75 ± 0.05 |
| M7 | 30.0 ± 0.5 | 30.5 ± 0.5 | 1.5 ± 0.1 | 1.4 ± 0.1 | 25.59 ± 0.02 | 29.88 ± 0.57 |
| PRD Microgels | M2 (Pa) | (Mucins/M2 Microgel) mixture (Pa) | ΔG′ (Pa) |
|---|---|---|---|
| G′ (1 rad/s) | 8377.5 | 6860.0 | −1517.5 |
| G′ (10 rad/s) | 9377.5 | 9520.8 | +143.3 |
| G′ (100 rad/s) | 9880.0 | 11,700.0 | +1820 |
| Microgel | M3 (Pa) | (Mucins/M3 Microgel) mixture (Pa) | ΔG′ (Pa) |
| G′ (1 rad/s) | 9753.3 | 11,853.3 | +2100 |
| G′ (10 rad/s) | 10,950.0 | 14,300.0 | +3350 |
| G′ (100 rad/s) | 11,533.3 | 16,233.0 | +4699.7 |
| Microgel | M4 (Pa) | (Mucins/M4 Microgel) mixture (Pa) | ΔG′ (Pa) |
| G′ (1 rad/s) | 9432.5 | 9756.7 | +324.2 |
| G′ (10 rad/s) | 10,925.0 | 12,766.7 | +1841.7 |
| G′ (100 rad/s) | 11,700.0 | 15,266.7 | +3566.7 |
| Microgel | M5 (Pa) | (Mucins/M5 Microgel) mixture (Pa) | ΔG′ (Pa) |
| G′ (1 rad/s) | 14,700.0 | 16,600.0 | +1900 |
| G′ (10 rad/s) | 16,900.0 | 19,666.7 | +2766.7 |
| G′ (100 rad/s) | 18,133.3 | 21,866.7 | +3733.4 |
| Microgel | M6 (Pa) | (Mucins/M6 Microgel) mixture (Pa) | ΔG′ (Pa) |
| G′ (1 rad/s) | 19,300.0 | 20,633.3 | +1333.3 |
| G′ (10 rad/s) | 21,400.0 | 24,666.7 | +3266.7 |
| G′ (100 rad/s) | 22,360.0 | 26,466.7 | +4106.7 |
| Microgel | M7 (Pa) | (Mucins/M7 Microgel) mixture (Pa) | ΔG′ (Pa) |
| G′ (1 rad/s) | 21,916.7 | 24,666.7 | +2750.0 |
| G′ (10 rad/s) | 23,650.0 | 27,866.7 | +4216.7 |
| G′ (100 rad/s) | 24,183.3 | 30,366.7 | +6183.4 |
| PRD Microgels | Initial | Three Months | ||||
| Room Temperature (%) | 30 °C/65% RH (%) | 40 °C/75% RH (%) | Room Temperature (100%) | 30 °C/65% RH (%) | 40 °C/75% RH (%) | |
| M2 | 101.5 ± 0.2 | 103.6 ± 1.1 | 102.6 ± 2.1 | 104.4 ± 2.4 | 100.6 ± 4.5 | 92.4 ± 2.7 |
| M3 | 103.2 ± 1.8 | 101.7 ± 3.8 | 100.7 ± 1.2 | 105.4 ± 2.4 | 104.2 ± 1.0 | 87.2 ± 2.8 |
| M4 | 100.7 ± 1.7 | 100.8 ± 1.9 | 100.8 ± 1.9 | 98.0 ± 2.0 | 100.8 ± 3.2 | 91.7 ± 6.4 |
| M5 | 100.4 ± 1.1 | 100.8 ± 2.2 | 100.4 ± 1.5 | 97.4 ± 1.0 | 96.0 ± 2.5 | 92.3 ± 1.9 |
| M6 | 101.0 ± 2.4 | 101.2 ± 2.2 | 100.6 ± 2.5 | 97.4 ± 1.1 | 97.2 ± 3.3 | 80.8 ± 4.0 |
| M7 | 105.2 ± 1.1 | 101.0 ± 2.1 | 100.6 ± 2.8 | 104.4 ± 2.7 | 98.4 ± 2.6 | 86.4 ± 4.3 |
| PRD Microgels | Zero-Order | First-Order | Higuchi | Korsmeyer–Peppas | |
|---|---|---|---|---|---|
| R2 | R2 | R2 | R2 | n | |
| M2 | 0.9986 | 0.9829 | 0.9831 | 0.9987 | 0.88 |
| M3 | 0.9996 | 0.9838 | 0.9853 | 0.9997 | 0.93 |
| M4 | 0.9986 | 0.9994 | 0.9822 | 0.9994 | 0.91 |
| M5 | 0.9961 | 0.9637 | 0.9741 | 0.9946 | 0.95 |
| M6 | 0.9982 | 0.9817 | 0.9862 | 0.9988 | 1.01 |
| M7 | 0.9956 | 0.9778 | 0.9799 | 0.9973 | 1.05 |
Publisher’s Note: MDPI stays neutral with regard to jurisdictional claims in published maps and institutional affiliations. |
© 2022 by the authors. Licensee MDPI, Basel, Switzerland. This article is an open access article distributed under the terms and conditions of the Creative Commons Attribution (CC BY) license (https://creativecommons.org/licenses/by/4.0/).
Share and Cite
Hamed, R.; Abu Kwiak, A.D.; Al-Adhami, Y.; Hammad, A.M.; Obaidat, R.; Abusara, O.H.; Huwaij, R.A. Microemulsions as Lipid Nanosystems Loaded into Thermoresponsive In Situ Microgels for Local Ocular Delivery of Prednisolone. Pharmaceutics 2022, 14, 1975. https://doi.org/10.3390/pharmaceutics14091975
Hamed R, Abu Kwiak AD, Al-Adhami Y, Hammad AM, Obaidat R, Abusara OH, Huwaij RA. Microemulsions as Lipid Nanosystems Loaded into Thermoresponsive In Situ Microgels for Local Ocular Delivery of Prednisolone. Pharmaceutics. 2022; 14(9):1975. https://doi.org/10.3390/pharmaceutics14091975
Chicago/Turabian StyleHamed, Rania, Amani D. Abu Kwiak, Yasmeen Al-Adhami, Alaa M. Hammad, Rana Obaidat, Osama H. Abusara, and Rana Abu Huwaij. 2022. "Microemulsions as Lipid Nanosystems Loaded into Thermoresponsive In Situ Microgels for Local Ocular Delivery of Prednisolone" Pharmaceutics 14, no. 9: 1975. https://doi.org/10.3390/pharmaceutics14091975