
A Metabolomics Approach for Predicting OATP1B-Type Transporter-Mediated Drug–Drug Interaction Liabilities
 , , , , , , and
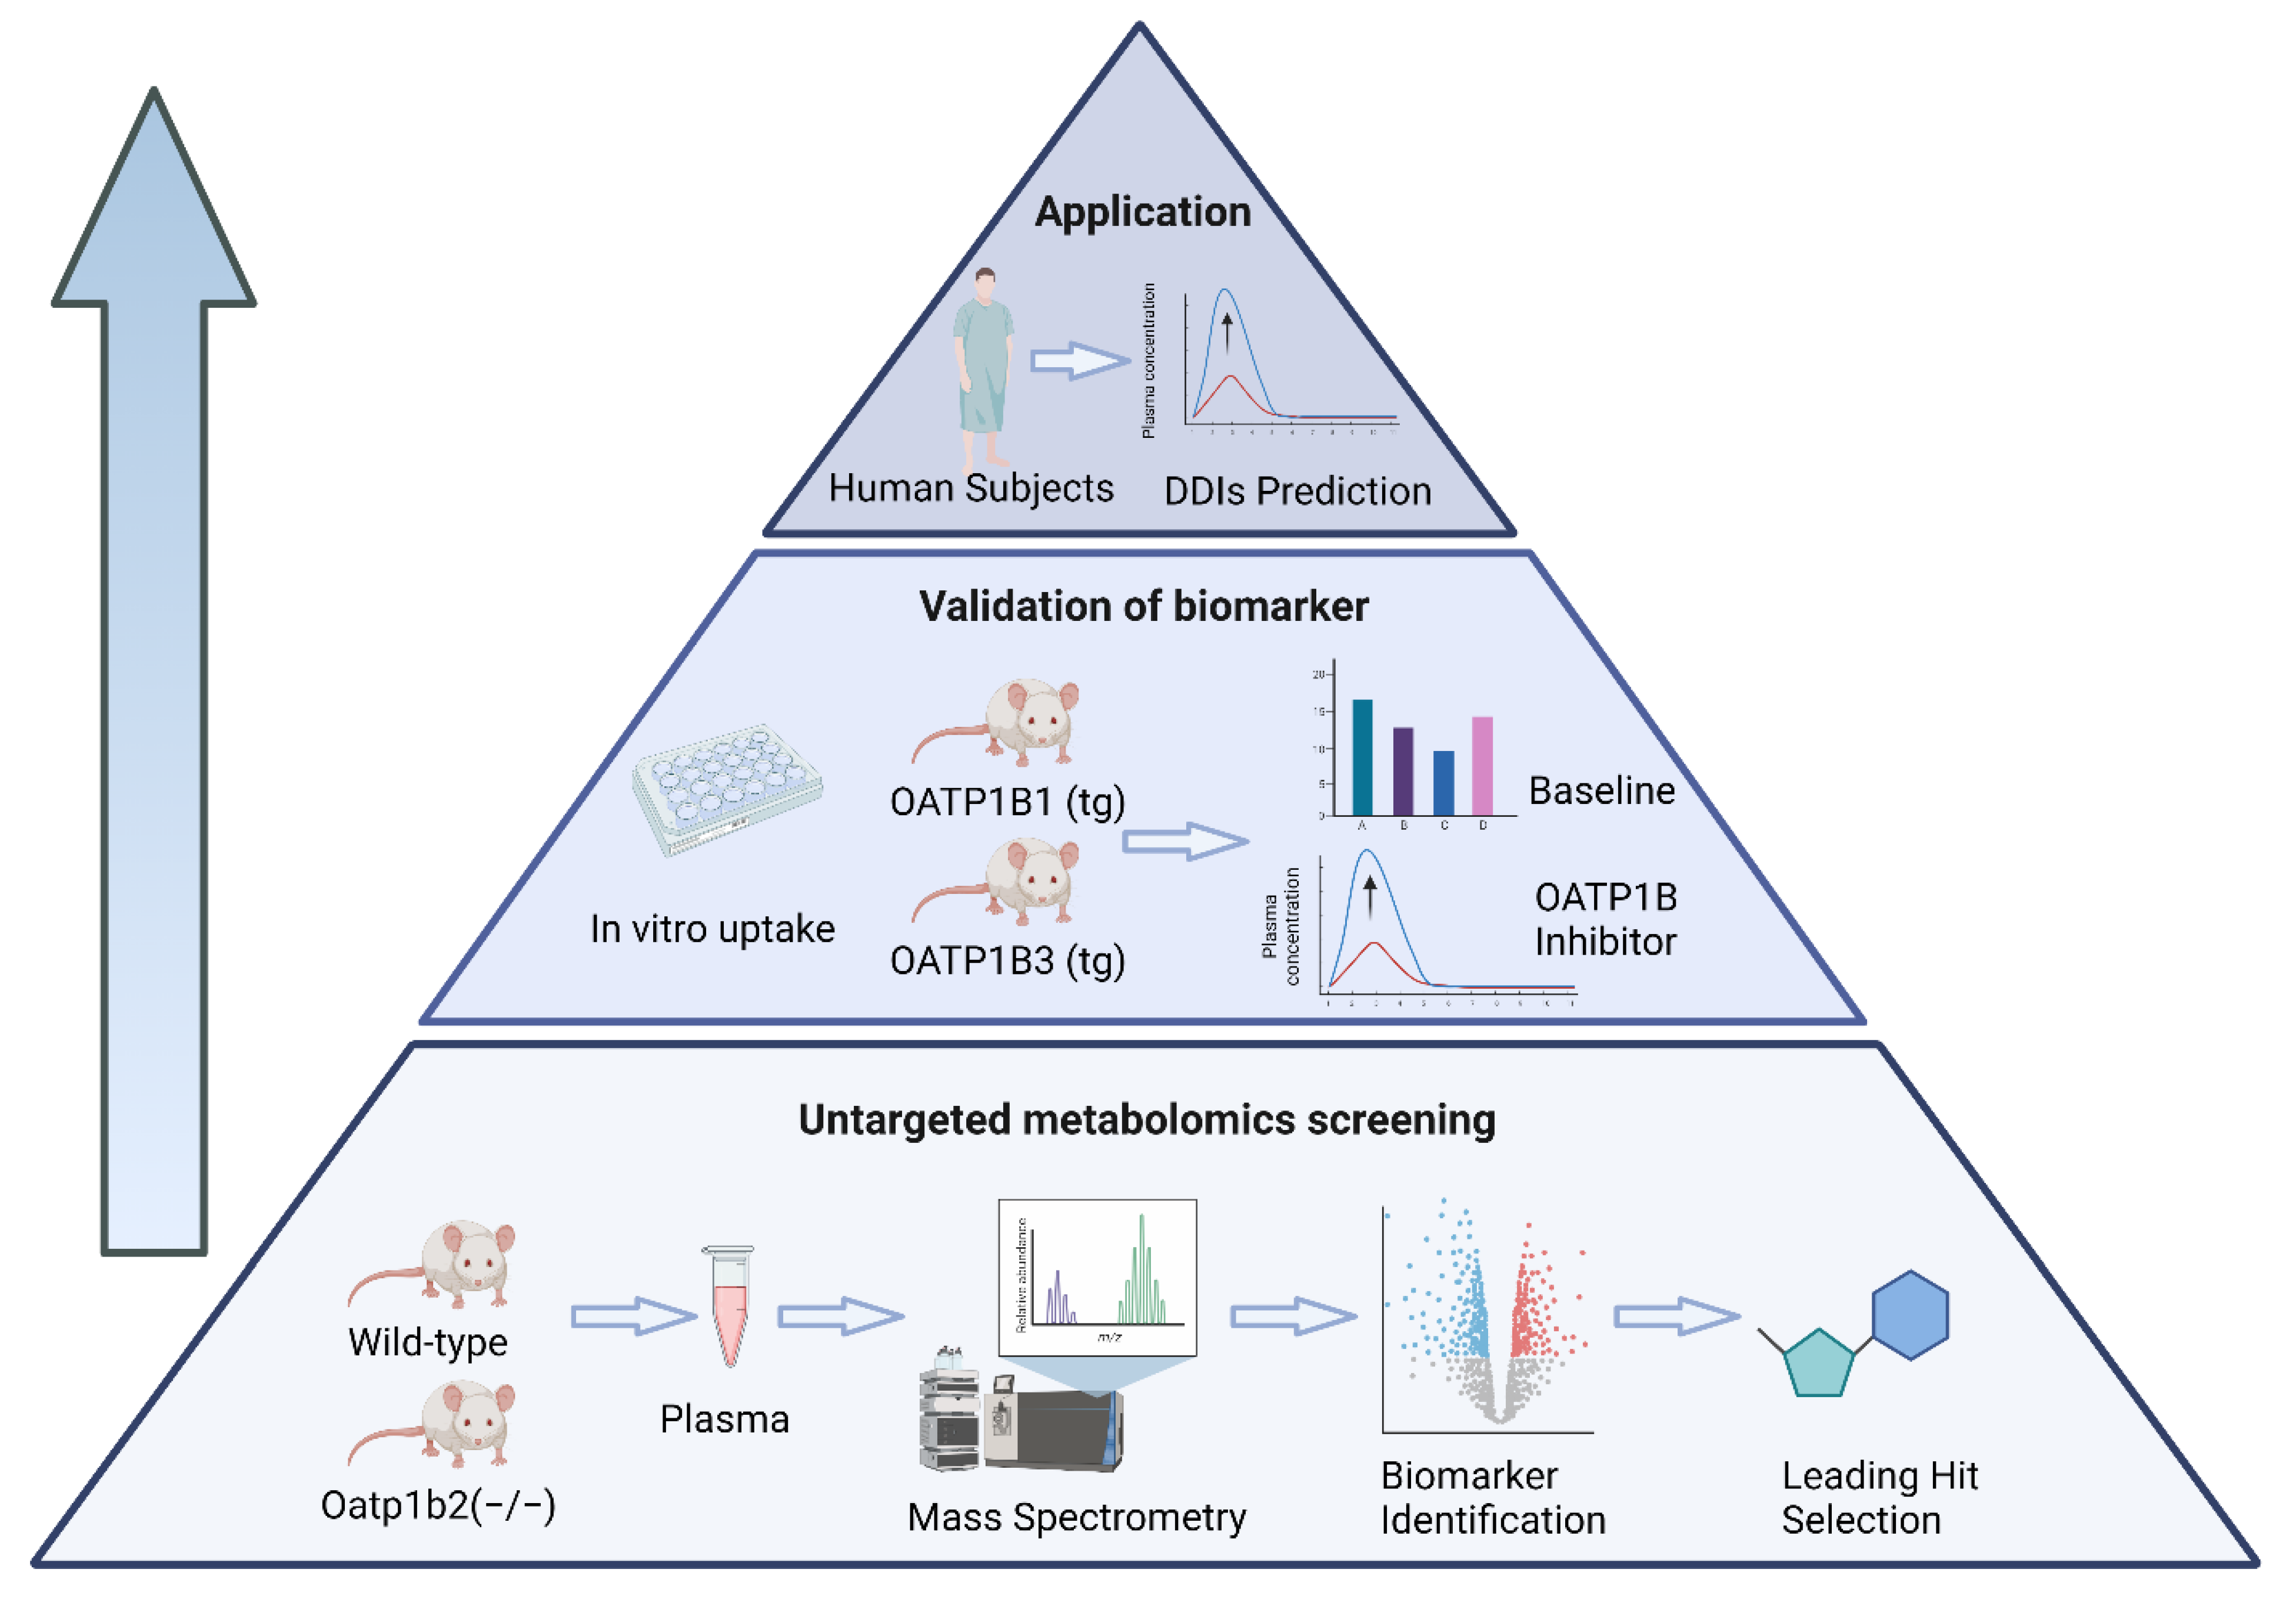
Abstract
:1. Introduction
2. Materials and Methods
2.1. Animals
2.2. Untargeted Metabolomics
2.3. Murine Pharmacokinetic Studies
2.4. In Vitro Studies
2.5. Clinical Studies
2.6. Quantification of Endogenous OATP1B Biomarkers in Plasma
2.7. Pharmacokinetic Analysis
2.8. Statistical Analysis
3. Results
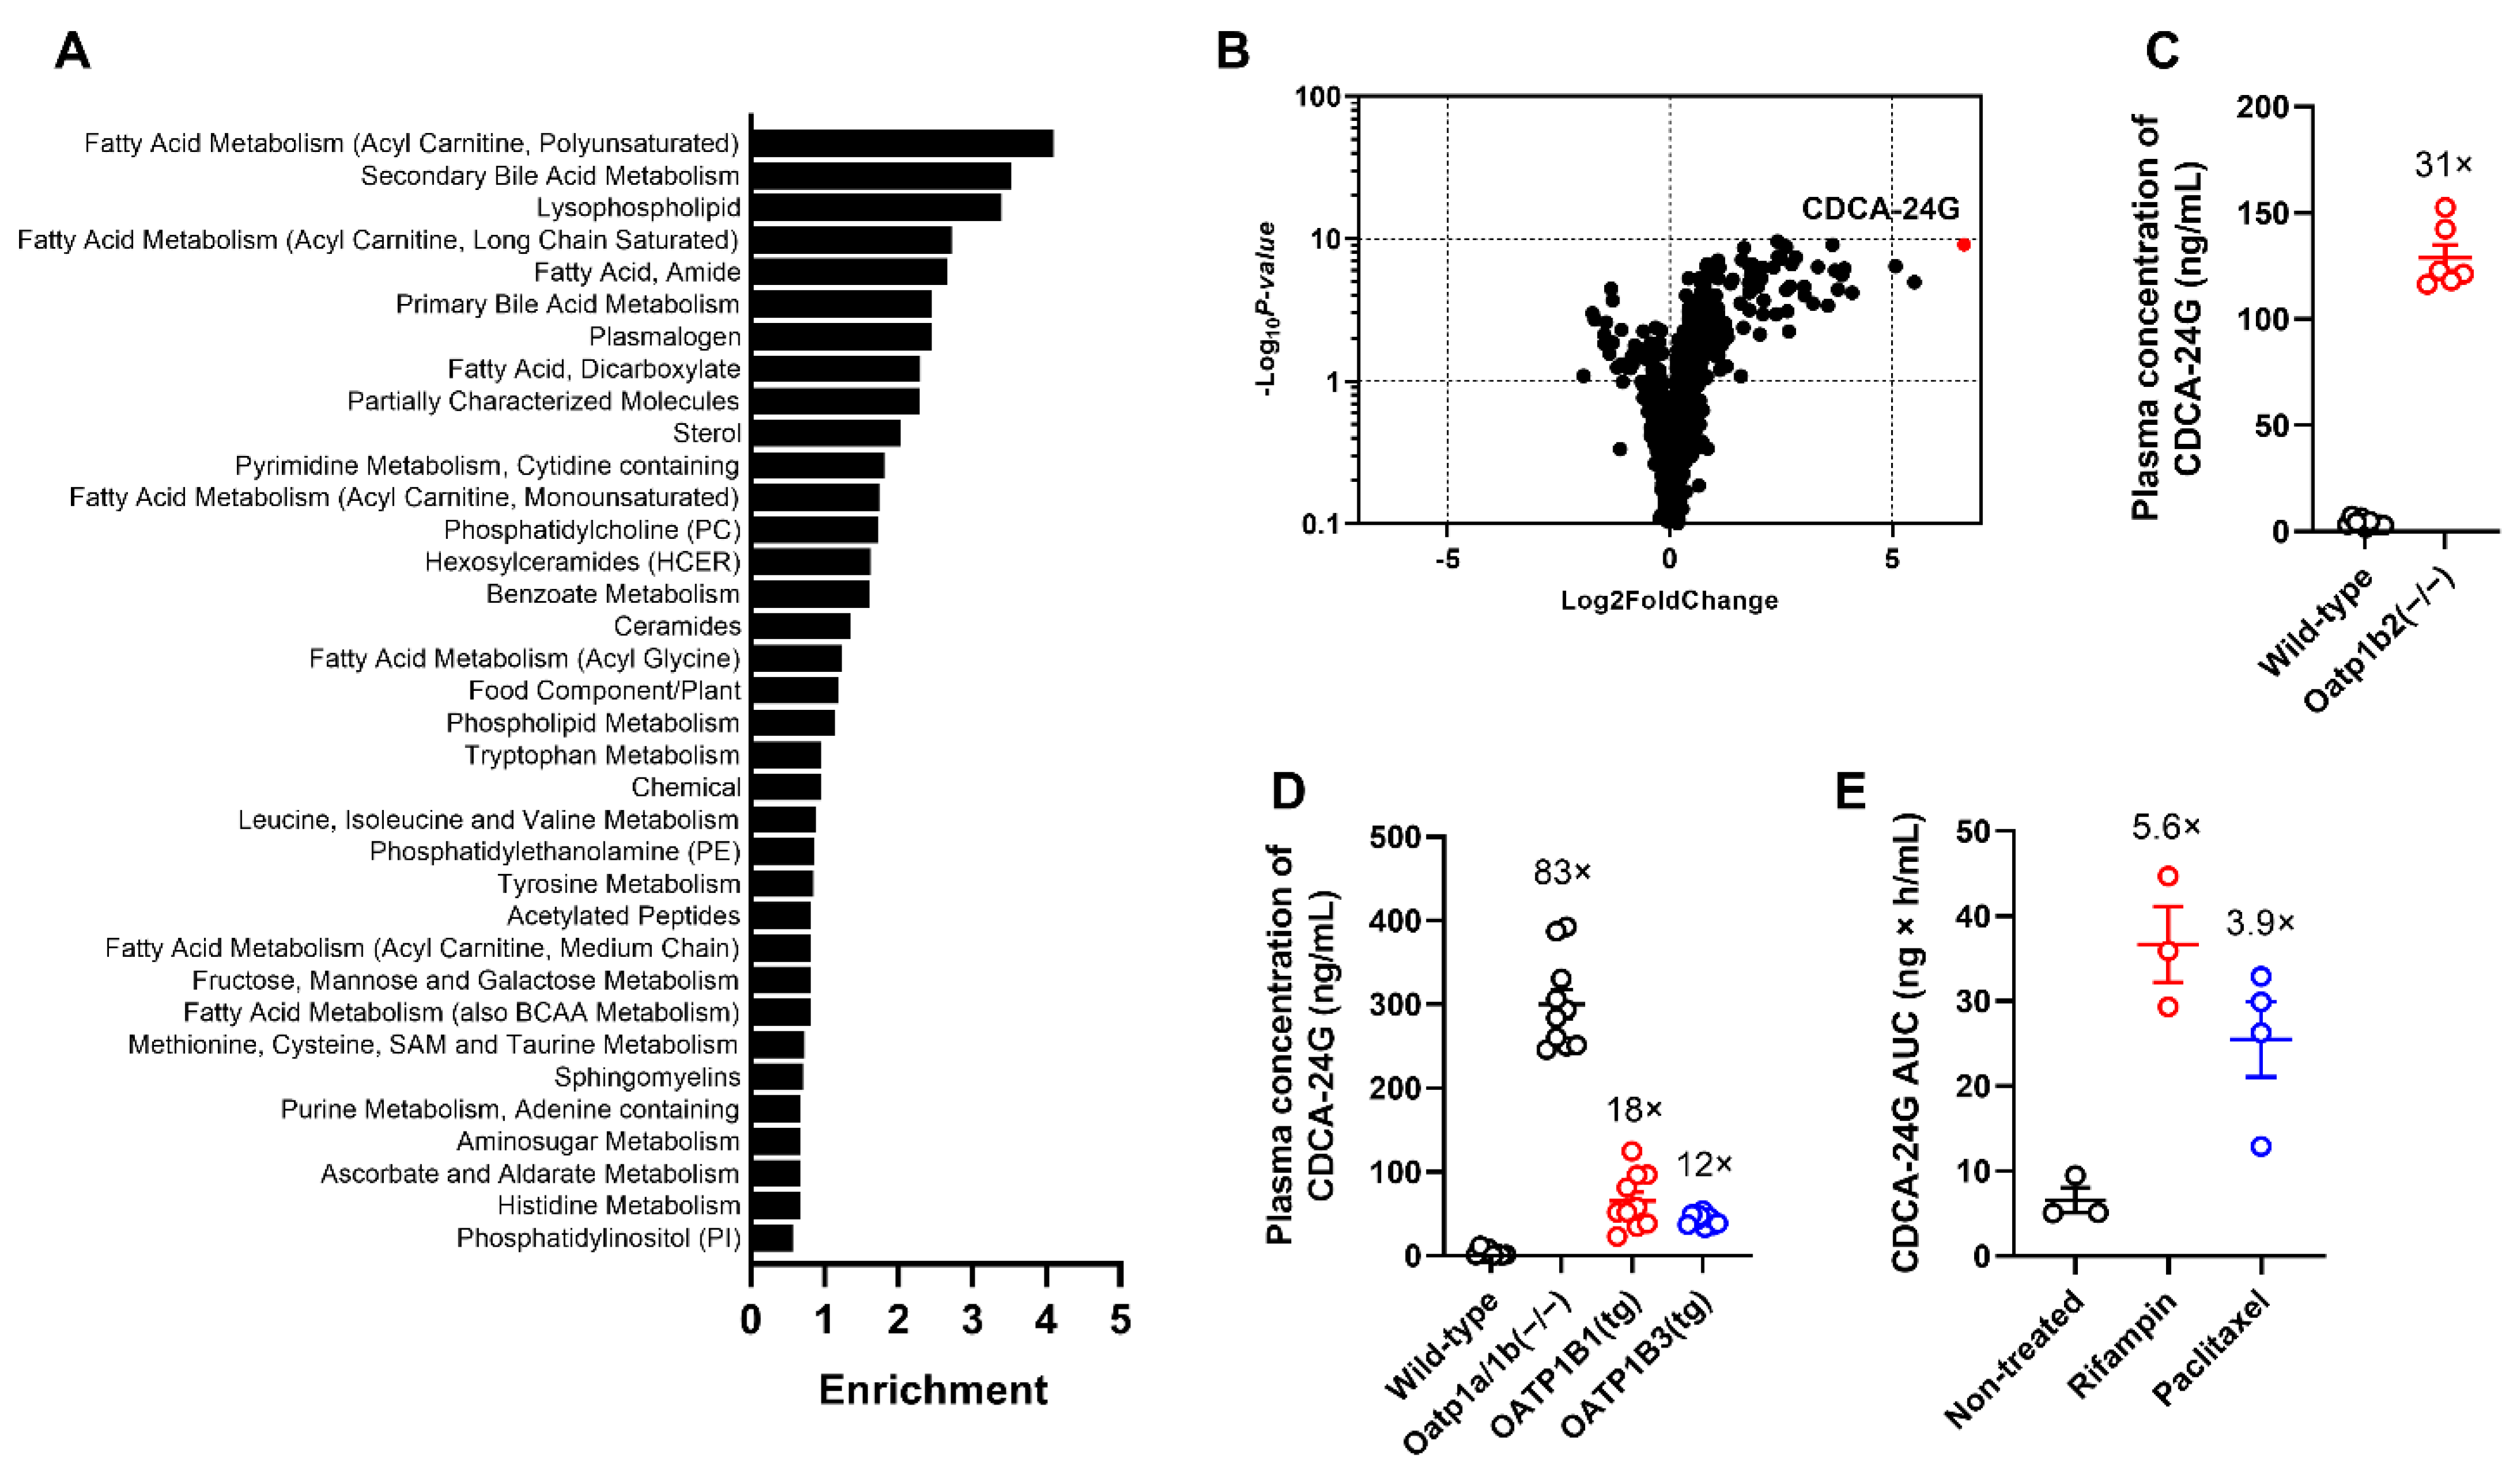
3.1. Identification and Validation of OATP1B Biomarkers
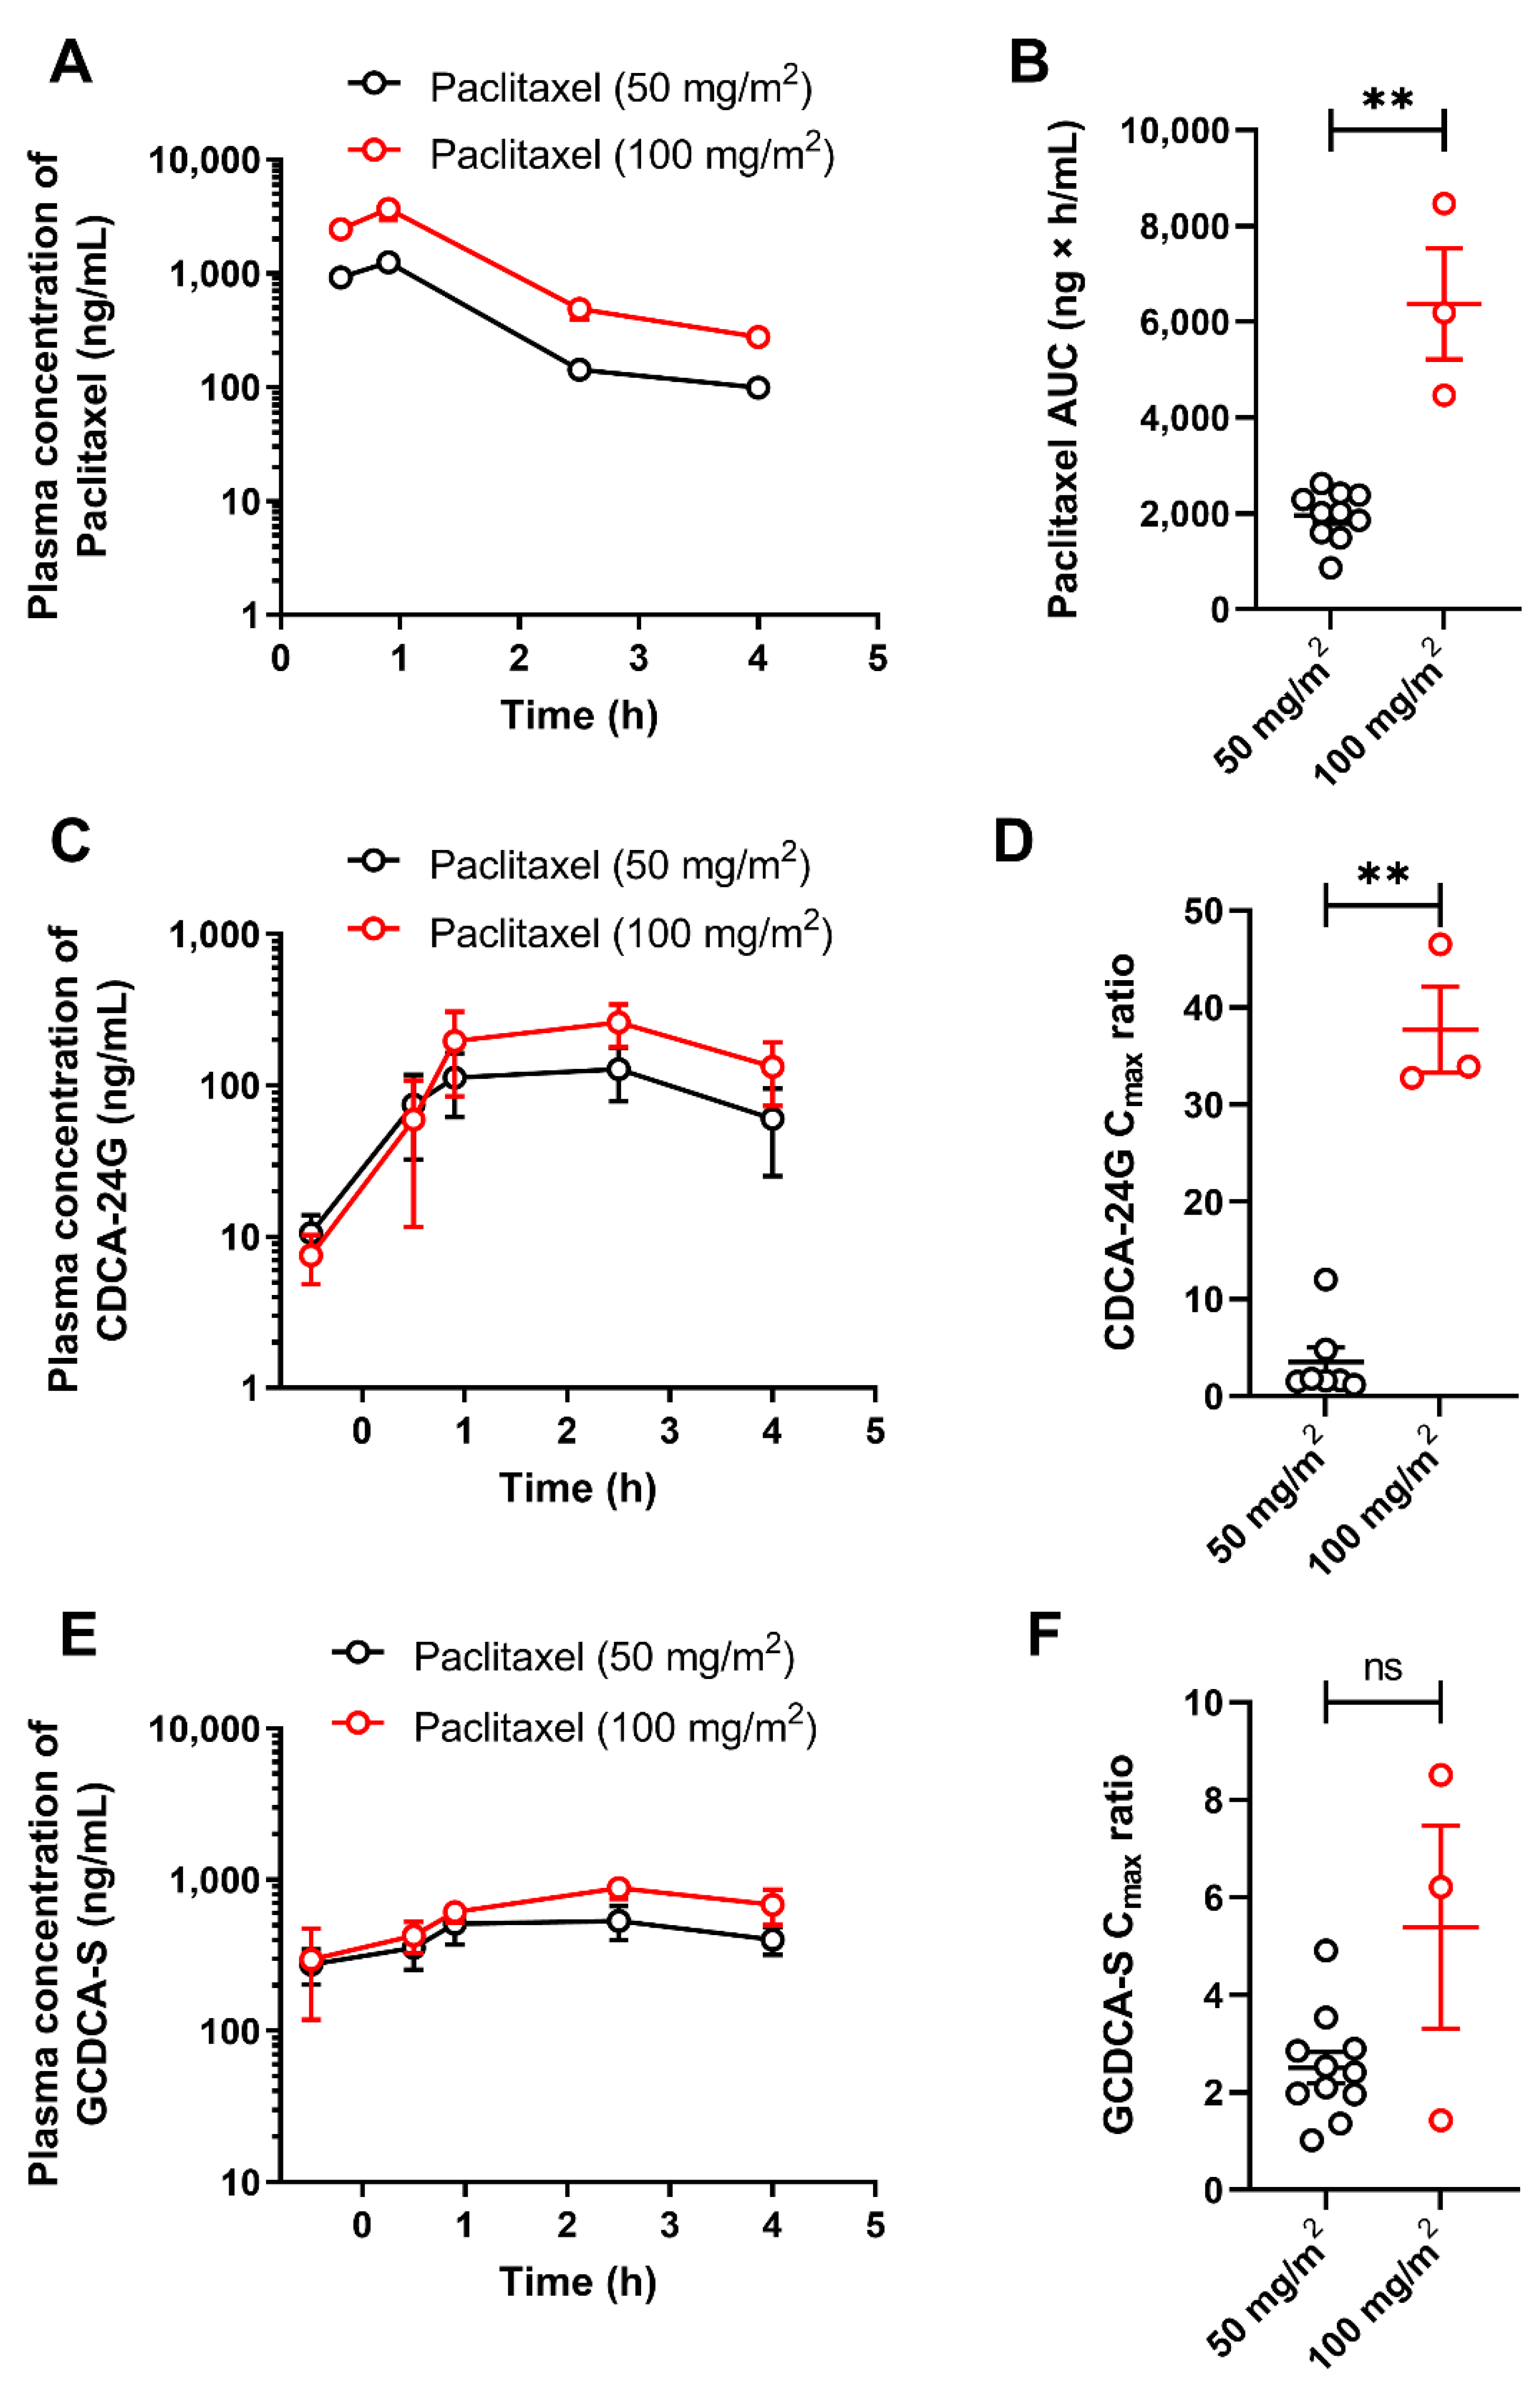
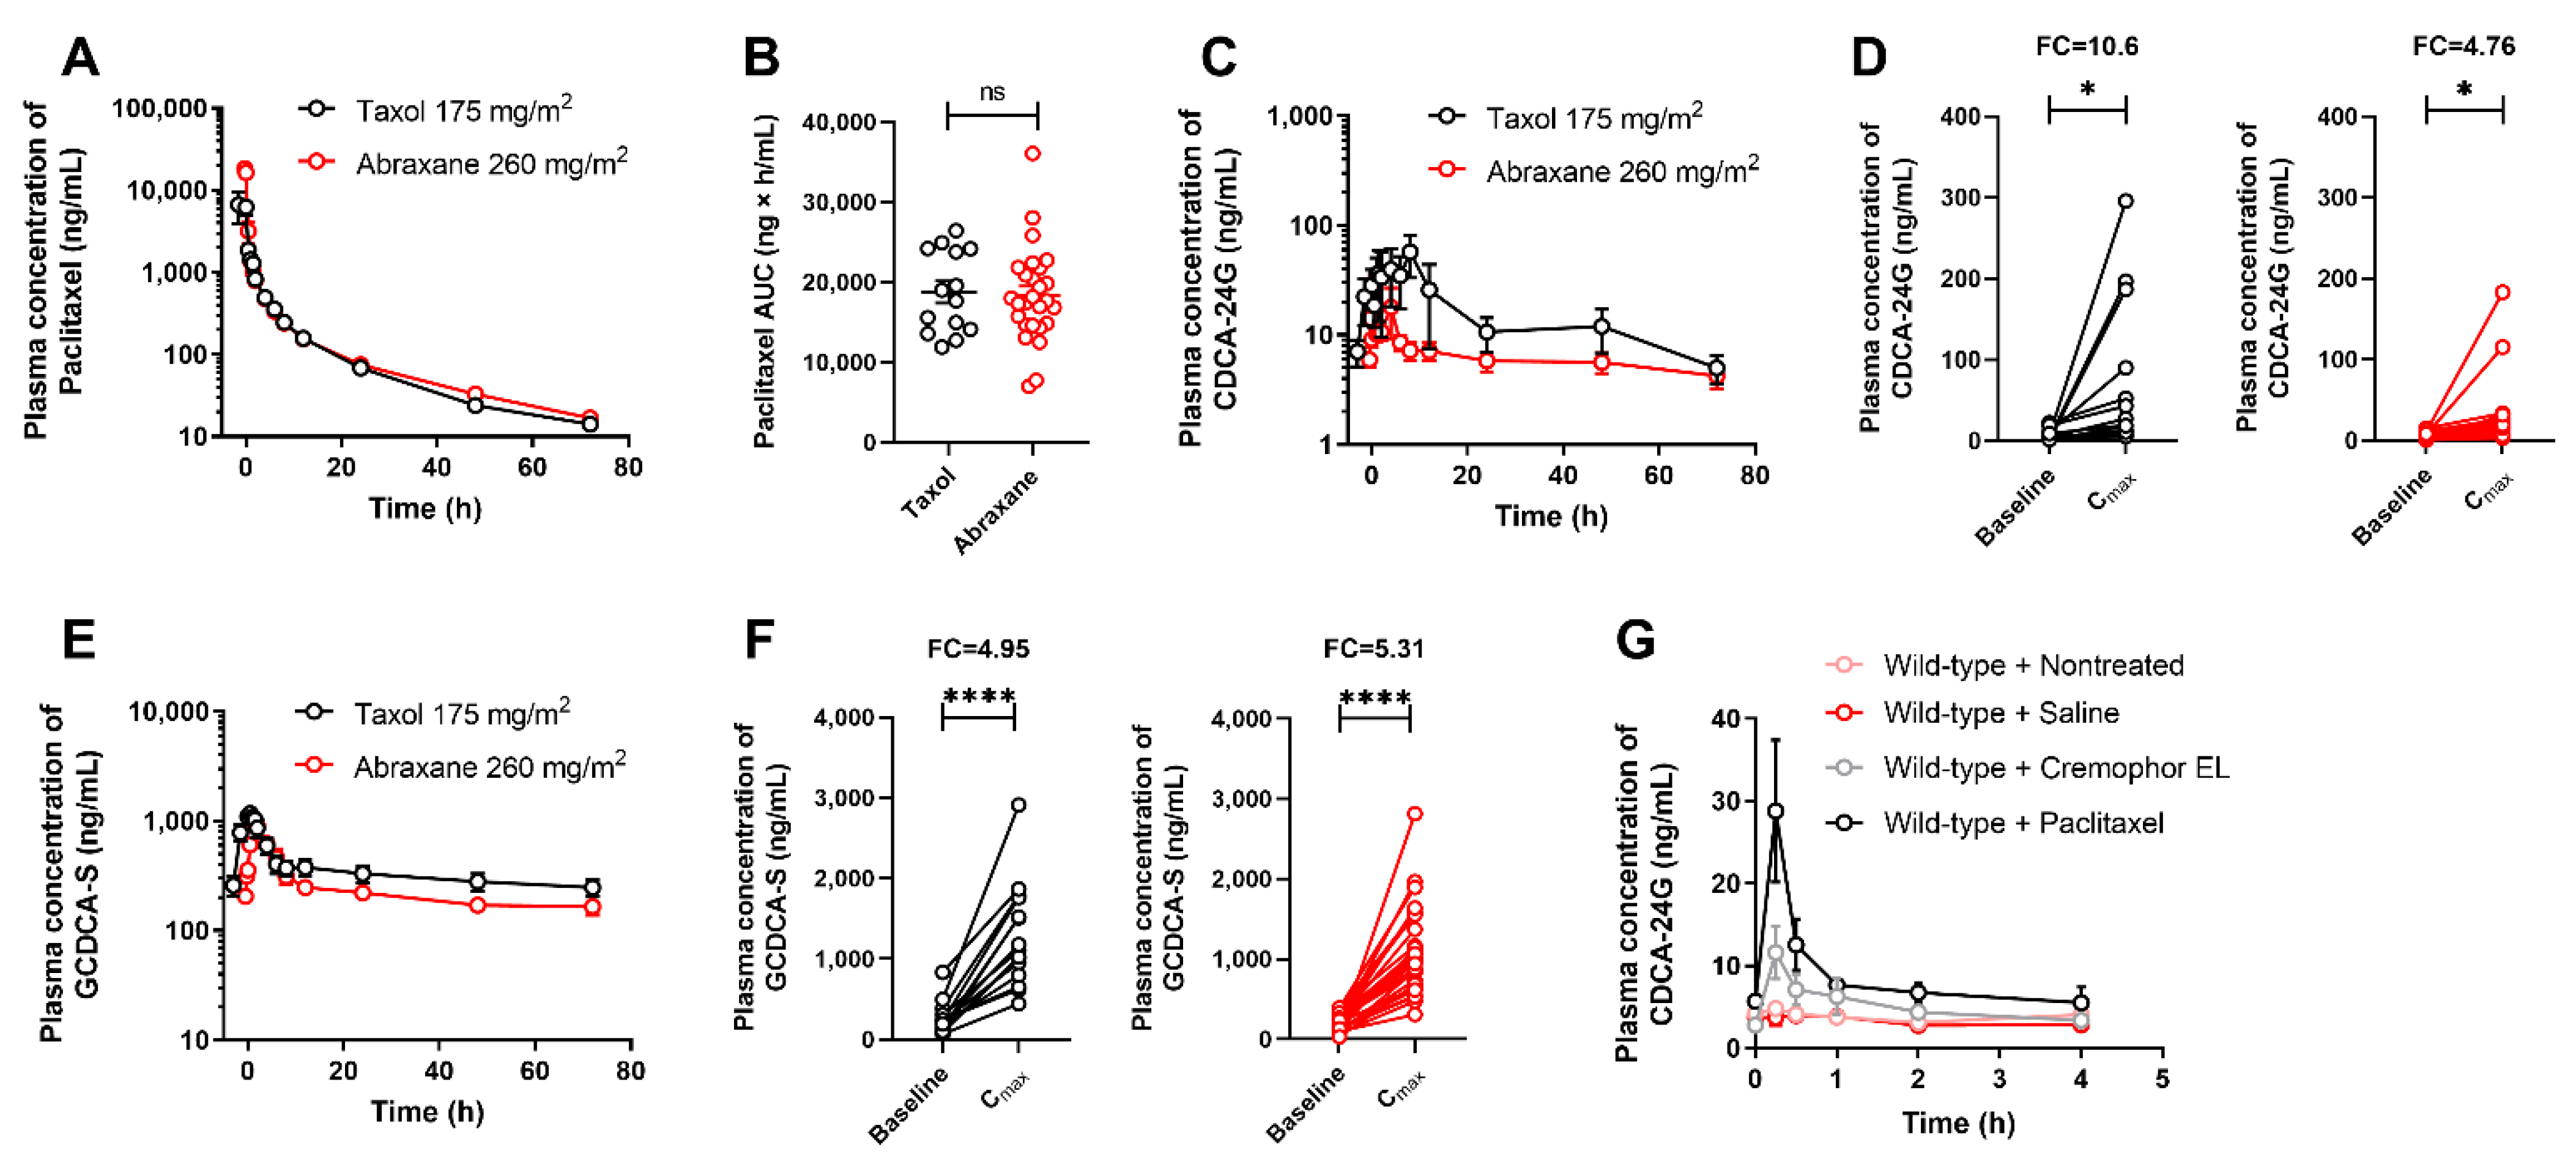
3.2. Implementation of CDCA-24G Analysis to Evaluate Modulation of OATP1B Function in Humans
4. Discussion
5. Conclusions
Supplementary Materials
Author Contributions
Funding
Institutional Review Board Statement
Informed Consent Statement
Data Availability Statement
Acknowledgments
Conflicts of Interest
References
- Giacomini, K.M.; Huang, S.-M.; Tweedie, D.J.; Benet, L.Z.; Brouwer, K.L.R.; Chu, X.; Dahlin, A.; Evers, R.; Fischer, V.; Hillgren, K.M.; et al. Membrane transporters in drug development. Nat. Rev. Drug Discov. 2010, 9, 215. [Google Scholar] [PubMed]
- Gessner, A.; König, J.; Fromm, M.F. Clinical aspects of transporter-mediated drug–drug interactions. Clin. Pharmacol. Ther. 2019, 105, 1386–1394. [Google Scholar] [CrossRef] [PubMed]
- Chu, X.; Liao, M.; Shen, H.; Yoshida, K.; Zur, A.A.; Arya, V.; Galetin, A.; Giacomini, K.M.; Hanna, I.; Kusuhara, H. Clinical probes and endogenous biomarkers as substrates for transporter drug-drug interaction evaluation: Perspectives from the international transporter consortium. Clin. Pharmacol. Ther. 2018, 104, 836–864. [Google Scholar] [CrossRef] [PubMed]
- Mochizuki, T.; Mizuno, T.; Maeda, K.; Kusuhara, H. Current progress in identifying endogenous biomarker candidates for drug transporter phenotyping and their potential application to drug development. Drug Metab. Pharmacokinet. 2021, 37, 100358. [Google Scholar] [CrossRef] [PubMed]
- Miyake, T.; Mizuno, T.; Takehara, I.; Mochizuki, T.; Kimura, M.; Matsuki, S.; Irie, S.; Watanabe, N.; Kato, Y.; Ieiri, I.; et al. Elucidation of N (1)-methyladenosine as a potential surrogate biomarker for drug interaction studies involving renal organic cation transporters. Drug Metab. Dispos. 2019, 47, 1270–1280. [Google Scholar] [CrossRef]
- Yee, S.W.; Giacomini, M.M.; Hsueh, C.H.; Weitz, D.; Liang, X.; Goswami, S.; Kinchen, J.M.; Coelho, A.; Zur, A.A.; Mertsch, K. Metabolomic and genome-wide association studies reveal potential endogenous biomarkers for OATP1B1. Clin. Pharmacol. Ther. 2016, 100, 524–536. [Google Scholar] [CrossRef] [PubMed]
- Hagenbuch, B.; Meier, P.J. Organic anion transporting polypeptides of the OATP/SLC21 family: Phylogenetic classification as OATP/SLCO superfamily, new nomenclature and molecular/functional properties. Pflügers Arch. 2004, 447, 653–665. [Google Scholar] [CrossRef]
- Ho, R.H.; Kim, R.B. Transporters and drug therapy: Implications for drug disposition and disease. Clin. Pharmacol. Ther. 2005, 78, 260–277. [Google Scholar] [CrossRef]
- Kalliokoski, A.; Niemi, M. Impact of OATP transporters on pharmacokinetics. Br. J. Pharmacol. 2009, 158, 693–705. [Google Scholar] [CrossRef]
- Shitara, Y. Clinical importance of OATP1B1 and OATP1B3 in drug-drug interactions. Drug Metab. Pharmacokinet. 2011, 26, 220–227. [Google Scholar] [CrossRef]
- Garrison, D.A.; Talebi, Z.; Eisenmann, E.D.; Sparreboom, A.; Baker, S.D. Role of OATP1B1 and OATP1B3 in drug-drug interactions mediated by tyrosine kinase inhibitors. Pharmaceutics 2020, 12, 856. [Google Scholar] [CrossRef] [PubMed]
- Chu, X.; Chan, G.H.; Evers, R. Identification of endogenous biomarkers to predict the propensity of drug candidates to cause hepatic or renal transporter-mediated drug-drug interactions. J. Pharm. Sci. 2017, 106, 2357–2367. [Google Scholar] [CrossRef] [PubMed]
- Mochizuki, T.; Zamek-Gliszczynski, M.J.; Yoshida, K.; Mao, J.; Taskar, K.; Hirabayashi, H.; Chu, X.; Lai, Y.; Takashima, T.; Rockich, K.; et al. Effect of cyclosporin A and impact of dose staggering on OATP1B1/1B3 endogenous substrates and drug probes for assessing clinical drug interactions. Clin. Pharmacol. Ther. 2022, 111, 1315–1323. [Google Scholar] [CrossRef] [PubMed]
- Leblanc, A.F.; Huang, K.M.; Uddin, M.E.; Anderson, J.T.; Chen, M.; Hu, S. Murine pharmacokinetic studies. Bio-Protocol 2018, 8, e3056. [Google Scholar] [CrossRef]
- Leblanc, A.F.; Sprowl, J.A.; Alberti, P.; Chiorazzi, A.; Arnold, W.D.; Gibson, A.A.; Hong, K.W.; Pioso, M.S.; Chen, M.; Huang, K.M. OATP1B2 deficiency protects against paclitaxel-induced neurotoxicity. J. Clin. Investig. 2018, 128, 816–825. [Google Scholar] [CrossRef]
- Belderbos, B.P.; Bins, S.; van Leeuwen, R.W.; Oomen-de Hoop, E.; van der Meer, N.; de Bruijn, P.; Hamberg, P.; Overkleeft, E.N.; van der Deure, W.M.; Lolkema, M.P. Influence of enzalutamide on cabazitaxel pharmacokinetics: A drug–drug interaction study in metastatic castration-resistant prostate cancer (mCRPC) Patients. Clin. Cancer Res. 2018, 24, 541–546. [Google Scholar] [CrossRef]
- Gardner, E.R.; Dahut, W.L.; Scripture, C.D.; Jones, J.; Aragon-Ching, J.B.; Desai, N.; Hawkins, M.J.; Sparreboom, A.; Figg, W.D. Randomized crossover pharmacokinetic study of solvent-based paclitaxel and nab-paclitaxel. Clin. Cancer Res. 2008, 14, 4200–4205. [Google Scholar] [CrossRef]
- Van Eerden, R.A.; van Doorn, L.; de Man, F.M.; Heersche, N.; Doukas, M.; van den Bosch, T.P.; Oomen-de Hoop, E.; de Bruijn, P.; Bins, S.; Ibrahim, E. Tissue type differences in ABCB1 expression and paclitaxel tissue pharmacokinetics in patients with esophageal cancer. Front. Pharmacol. 2021, 12, 759146. [Google Scholar] [CrossRef]
- Jin, Y.; Li, Y.; Eisenmann, E.D.; Figg, W.D.; Baker, S.D.; Sparreboom, A.; Hu, S. Determination of the endogenous OATP1B biomarkers glycochenodeoxycholate-3-sulfate and chenodeoxycholate 24-glucuronide in human and mouse plasma by a validated UHPLC-MS/MS method. J. Chromatogr. B 2022, 1210, 123437. [Google Scholar] [CrossRef]
- Mori, D.; Ishida, H.; Mizuno, T.; Kusumoto, S.; Kondo, Y.; Izumi, S.; Nakata, G.; Nozaki, Y.; Maeda, K.; Sasaki, Y. Alteration in the plasma concentrations of endogenous organic anion–transporting polypeptide 1B biomarkers in patients with non–small cell lung cancer treated with paclitaxel. Drug Metabo. Dispos. 2020, 48, 387–394. [Google Scholar] [CrossRef]
- Csanaky, I.L.; Lu, H.; Zhang, Y.; Ogura, K.; Choudhuri, S.; Klaassen, C.D. Organic anion–transporting polypeptide 1b2 (Oatp1b2) is important for the hepatic uptake of unconjugated bile acids: Studies in Oatp1b2-null mice. Hepatology 2011, 53, 272–281. [Google Scholar] [CrossRef] [PubMed]
- Ma, X.; Shang, X.; Qin, X.; Lu, J.; Liu, M.; Wang, X. Characterization of organic anion transporting polypeptide 1b2 knockout rats generated by CRISPR/Cas9: A novel model for drug transport and hyperbilirubinemia disease. Acta Pharm. Sin. B 2020, 10, 850–860. [Google Scholar] [CrossRef] [PubMed]
- Takehara, I.; Terashima, H.; Nakayama, T.; Yoshikado, T.; Yoshida, M.; Furihata, K.; Watanabe, N.; Maeda, K.; Ando, O.; Sugiyama, Y. Investigation of glycochenodeoxycholate sulfate and chenodeoxycholate glucuronide as surrogate endogenous probes for drug interaction studies of OATP1B1 and OATP1B3 in healthy Japanese volunteers. Pharm. Res. 2017, 34, 1601–1614. [Google Scholar] [CrossRef] [PubMed]
- Zimmerman, E.I.; Hu, S.; Roberts, J.L.; Gibson, A.A.; Orwick, S.J.; Li, L.; Sparreboom, A.; Baker, S.D. Contribution of OATP1B1 and OATP1B3 to the disposition of sorafenib and sorafenib-glucuronide. Clin. Cancer Res. 2013, 19, 1458–1466. [Google Scholar] [CrossRef] [PubMed]
- Iusuf, D.; van de Steeg, E.; Schinkel, A.H. Functions of OATP1A and 1B transporters in vivo: Insights from mouse models. Trends Pharm. Sci. 2012, 33, 100–108. [Google Scholar] [CrossRef]
- Gui, C.; Wahlgren, B.; Lushington, G.H.; Hagenbuch, B. Identification, Ki determination and CoMFA analysis of nuclear receptor ligands as competitive inhibitors of OATP1B1-mediated estradiol-17β-glucuronide transport. Pharmacol. Res. 2009, 60, 50–56. [Google Scholar] [CrossRef]
- Li, Y.F.; Zhang, C.; Zhou, S.; He, M.; Zhang, H.; Chen, N.; Li, F.; Luan, X.; Pai, M.; Yuan, H. Species difference in paclitaxel disposition correlated with poor pharmacological efficacy translation from mice to humans. Clin. Pharmacol. Adv. Appl. 2018, 10, 165. [Google Scholar] [CrossRef]
- Nieuweboer, A.J.; Hu, S.; Gui, C.; Hagenbuch, B.; Moghaddam-Helmantel, I.M.G.; Gibson, A.A.; de Bruijn, P.; Mathijssen, R.H.; Sparreboom, A. Influence of drug formulation on OATP1B-mediated transport of paclitaxel. Cancer Res. 2014, 74, 3137–3145. [Google Scholar] [CrossRef]
- de Morrée, E.S.; Böttcher, R.; van Soest, R.J.; Aghai, A.; de Ridder, C.M.; Gibson, A.A.; Mathijssen, R.H.; Burger, H.; Wiemer, E.A.; Sparreboom, A. Loss of SLCO1B3 drives taxane resistance in prostate cancer. Br. J. Cancer 2016, 115, 674–681. [Google Scholar] [CrossRef]
- Belderbos, B.P.; Singh, R.K.; Agema, B.C.; El Bouazzaoui, S.; Oomen-de Hoop, E.; de Wit, R.; van Schaik, R.H.; Mathijssen, R.H.; Bins, S. The influence of single-nucleotide polymorphisms on overall survival and toxicity in cabazitaxel-treated patients with metastatic castration-resistant prostate cancer. Cancer Chemother. Pharmacol. 2020, 85, 547–553. [Google Scholar] [CrossRef]
- Sanofi. Jevtana (Cabazitaxel) Injection, Prescribing Information. 2010. Available online: http://products.sanofi.us/jevtana/jevtana.pdf (accessed on 6 March 2012).
- Fuhr, U.; Hsin, C.H.; Li, X.; Jabrane, W.; Sorgel, F. Assessment of pharmacokinetic drug-drug interactions in humans: In vivo probe substrates for drug metabolism and drug transport revisited. Annu. Rev. Pharm. Toxicol. 2019, 59, 507–536. [Google Scholar] [CrossRef] [PubMed]
- Sharma, M.; Vadhariya, A.; Chikermane, S.; Gopinathan, S.; Chavez-MacGregor, M.; Giordano, S.H.; Johnson, M.L.; Holmes, H.M. Clinical outcomes associated with drug-drug interactions of oral chemotherapeutic agents: A comprehensive evidence-based literature review. Drugs Aging 2019, 36, 341–354. [Google Scholar] [CrossRef] [PubMed]
- Riechelmann, R.P.; Del Giglio, A. Drug interactions in oncology: How common are they? Ann. Oncol. 2009, 20, 1907–1912. [Google Scholar] [CrossRef] [PubMed]
- van Leeuwen, R.W.; Brundel, D.H.; Neef, C.; van Gelder, T.; Mathijssen, R.H.; Burger, D.M.; Jansman, F.G. Prevalence of potential drug-drug interactions in cancer patients treated with oral anticancer drugs. Br. J. Cancer 2013, 108, 1071–1078. [Google Scholar] [CrossRef]
- Bartel, S.B. Safe practices and financial considerations in using oral chemotherapeutic agents. Am. J. Health Syst. Pharm. 2007, 64, S8–S14. [Google Scholar] [CrossRef]
- Swann, J.R.; Want, E.J.; Geier, F.M.; Spagou, K.; Wilson, I.D.; Sidaway, J.E.; Nicholson, J.K.; Holmes, E. Systemic gut microbial modulation of bile acid metabolism in host tissue compartments. Proc. Nat. Acad. Sci. USA 2011, 108, 4523–4530. [Google Scholar] [CrossRef]
- Meier, P.J.; Stieger, B. Bile salt transporters. Annu. Rev. Physiol. 2002, 64, 635–661. [Google Scholar] [CrossRef]
- Dawson, P.A.; Lan, T.; Rao, A. Bile acid transporters. J. Lipid Res. 2009, 50, 2340–2357. [Google Scholar] [CrossRef]
- Hussaarts, K.G.; van Doorn, L.; Eechoute, K.; Damman, J.; Fu, Q.; van Doorn, N.; Eisenmann, E.D.; Gibson, A.A.; Oomen-de Hoop, E.; de Bruijn, P. Influence of probenecid on the pharmacokinetics and pharmacodynamics of sorafenib. Pharmaceutics 2020, 12, 788. [Google Scholar] [CrossRef]
- Fu, Q.; Chen, M.; Anderson, J.T.; Sun, X.; Hu, S.; Sparreboom, A.; Baker, S.D. Interaction between sex and organic anion-transporting polypeptide 1b2 on the pharmacokinetics of regorafenib and its metabolites regorafenib-N-oxide and regorafenib-glucuronide in mice. Clin. Transl. Sci. 2019, 12, 400–407. [Google Scholar] [CrossRef] [Green Version]
- van de Steeg, E.; Stranecky, V.; Hartmannova, H.; Noskova, L.; Hrebicek, M.; Wagenaar, E.; van Esch, A.; de Waart, D.R.; Oude Elferink, R.P.; Kenworthy, K.E.; et al. Complete OATP1B1 and OATP1B3 deficiency causes human Rotor syndrome by interrupting conjugated bilirubin reuptake into the liver. J. Clin. Investig. 2012, 122, 519–528. [Google Scholar] [CrossRef] [PubMed]
- Neuvonen, M.; Hirvensalo, P.; Tornio, A.; Rago, B.; West, M.; Lazzaro, S.; Mathialagan, S.; Varma, M.; Cerny, M.A.; Costales, C. Identification of glycochenodeoxycholate 3-O-glucuronide and glycodeoxycholate 3-O-glucuronide as highly sensitive and specific OATP1B1 biomarkers. Clin. Pharmacol. Ther. 2021, 109, 646–657. [Google Scholar] [CrossRef] [PubMed]
- Ma, Y.; Xin, M.; Wen, Y.; Wang, H.; Zhang, G.; Dai, J.; Wu, X.-A. The utility of endogenous glycochenodeoxycholate-3-sulfate and 4β-hydroxycholesterol to evaluate the hepatic disposition of atorvastatin in rats. Asian J. Pharm. Sci. 2021, 16, 519–529. [Google Scholar] [CrossRef]
- Mori, D.; Kimoto, E.; Rago, B.; Kondo, Y.; King-Ahmad, A.; Ramanathan, R.; Wood, L.S.; Johnson, J.G.; Le, V.H.; Vourvahis, M. Dose-dependent inhibition of OATP1B by rifampicin in healthy volunteers: Comprehensive evaluation of candidate biomarkers and OATP1B probe drugs. Clin. Pharmacol. Ther. 2020, 107, 1004–1013. [Google Scholar] [CrossRef]
- Kimura, A.; Kagawa, T.; Takei, H.; Maruo, Y.; Sakugawa, H.; Sasaki, T.; Murai, T.; Naritaka, N.; Takikawa, H.; Nittono, H. Rotor syndrome: Glucuronidated bile acidemia from defective reuptake by hepatocytes. Hepatol. Commun. 2021, 5, 629–633. [Google Scholar] [CrossRef] [PubMed]
- Li, Y.; Talebi, Z.; Chen, X.; Sparreboom, A.; Hu, S. Endogenous biomarkers for SLC transporter-mediated drug-drug interaction evaluation. Molecules 2021, 26, 5500. [Google Scholar] [CrossRef]
- de Graan, A.J.; Lancaster, C.S.; Obaidat, A.; Hagenbuch, B.; Elens, L.; Friberg, L.E.; de Bruijn, P.; Hu, S.; Gibson, A.A.; Bruun, G.H.; et al. Influence of polymorphic OATP1B-type carriers on the disposition of docetaxel. Clin. Cancer Res. 2012, 18, 4433–4440. [Google Scholar] [CrossRef]
- Engel, A.; Oswald, S.; Siegmund, W.; Keiser, M. Pharmaceutical excipients influence the function of human uptake transporting proteins. Mol. Pharm. 2012, 9, 2577–2581. [Google Scholar] [CrossRef]
- Zolk, O.; Fromm, M.F. Transporter-mediated drug uptake and efflux: Important determinants of adverse drug reactions. Clin. Pharmacol. Ther. 2011, 89, 798–805. [Google Scholar] [CrossRef]
- ten Tije, A.J.; Verweij, J.; Loos, W.J.; Sparreboom, A. Pharmacological effects of formulation vehicles: Implications for cancer chemotherapy. Clin. Pharm. 2003, 42, 665–685. [Google Scholar] [CrossRef] [Green Version]
- Fahrmayr, C.; Konig, J.; Auge, D.; Mieth, M.; Fromm, M.F. Identification of drugs and drug metabolites as substrates of multidrug resistance protein 2 (MRP2) using triple-transfected MDCK-OATP1B1-UGT1A1-MRP2 cells. Br. J. Pharmacol. 2012, 165, 1836–1847. [Google Scholar] [CrossRef] [PubMed]
- Izquierdo, M.A.; Garcia, M.; Ponton, J.L.; Martinez, M.; Valenti, V.; Navarro, M.; Gil, M.; Cardenal, F.; Mesia, R.; Perez, X.; et al. A phase I clinical and pharmacokinetic study of paclitaxel and docetaxel given in combination in patients with solid tumours. Eur. J. Cancer 2006, 42, 1789–1796. [Google Scholar] [CrossRef] [PubMed]
- Lancaster, C.S.; Sprowl, J.A.; Walker, A.L.; Hu, S.; Gibson, A.A.; Sparreboom, A. Modulation of OATP1B-type transporter function alters cellular uptake and disposition of platinum chemotherapeutics. Mol. Cancer 2013, 12, 1537–1544. [Google Scholar] [CrossRef] [PubMed]
- Fujita, K.I.; Sugiura, T.; Okumura, H.; Umeda, S.; Nakamichi, N.; Watanabe, Y.; Suzuki, H.; Sunakawa, Y.; Shimada, K.; Kawara, K.; et al. Direct inhibition and down-regulation by uremic plasma components of hepatic uptake transporter for SN-38, an active metabolite of irinotecan, in humans. Pharm. Res. 2013, 31, 204–215. [Google Scholar] [CrossRef] [PubMed] [Green Version]


Publisher’s Note: MDPI stays neutral with regard to jurisdictional claims in published maps and institutional affiliations. |
© 2022 by the authors. Licensee MDPI, Basel, Switzerland. This article is an open access article distributed under the terms and conditions of the Creative Commons Attribution (CC BY) license (https://creativecommons.org/licenses/by/4.0/).
Share and Cite
Li, Y.; Jin, Y.; Taheri, H.; Schmidt, K.T.; Gibson, A.A.; Buck, S.A.J.; Eisenmann, E.D.; Mathijssen, R.H.J.; Figg, W.D.; Baker, S.D.; et al. A Metabolomics Approach for Predicting OATP1B-Type Transporter-Mediated Drug–Drug Interaction Liabilities. Pharmaceutics 2022, 14, 1933. https://doi.org/10.3390/pharmaceutics14091933
Li Y, Jin Y, Taheri H, Schmidt KT, Gibson AA, Buck SAJ, Eisenmann ED, Mathijssen RHJ, Figg WD, Baker SD, et al. A Metabolomics Approach for Predicting OATP1B-Type Transporter-Mediated Drug–Drug Interaction Liabilities. Pharmaceutics. 2022; 14(9):1933. https://doi.org/10.3390/pharmaceutics14091933
Chicago/Turabian StyleLi, Yang, Yan Jin, Hanieh Taheri, Keith T. Schmidt, Alice A. Gibson, Stefan A. J. Buck, Eric D. Eisenmann, Ron H. J. Mathijssen, William D. Figg, Sharyn D. Baker, and et al. 2022. "A Metabolomics Approach for Predicting OATP1B-Type Transporter-Mediated Drug–Drug Interaction Liabilities" Pharmaceutics 14, no. 9: 1933. https://doi.org/10.3390/pharmaceutics14091933