
Effect of Exo/Endogenous Prophylaxis Dentifrice/Drug and Cariogenic Conditions of Patient on Molecular Property of Dental Biofilm: Synchrotron FTIR Spectroscopic Study

 ,
,
Abstract
:1. Introduction
2. Materials and Methods
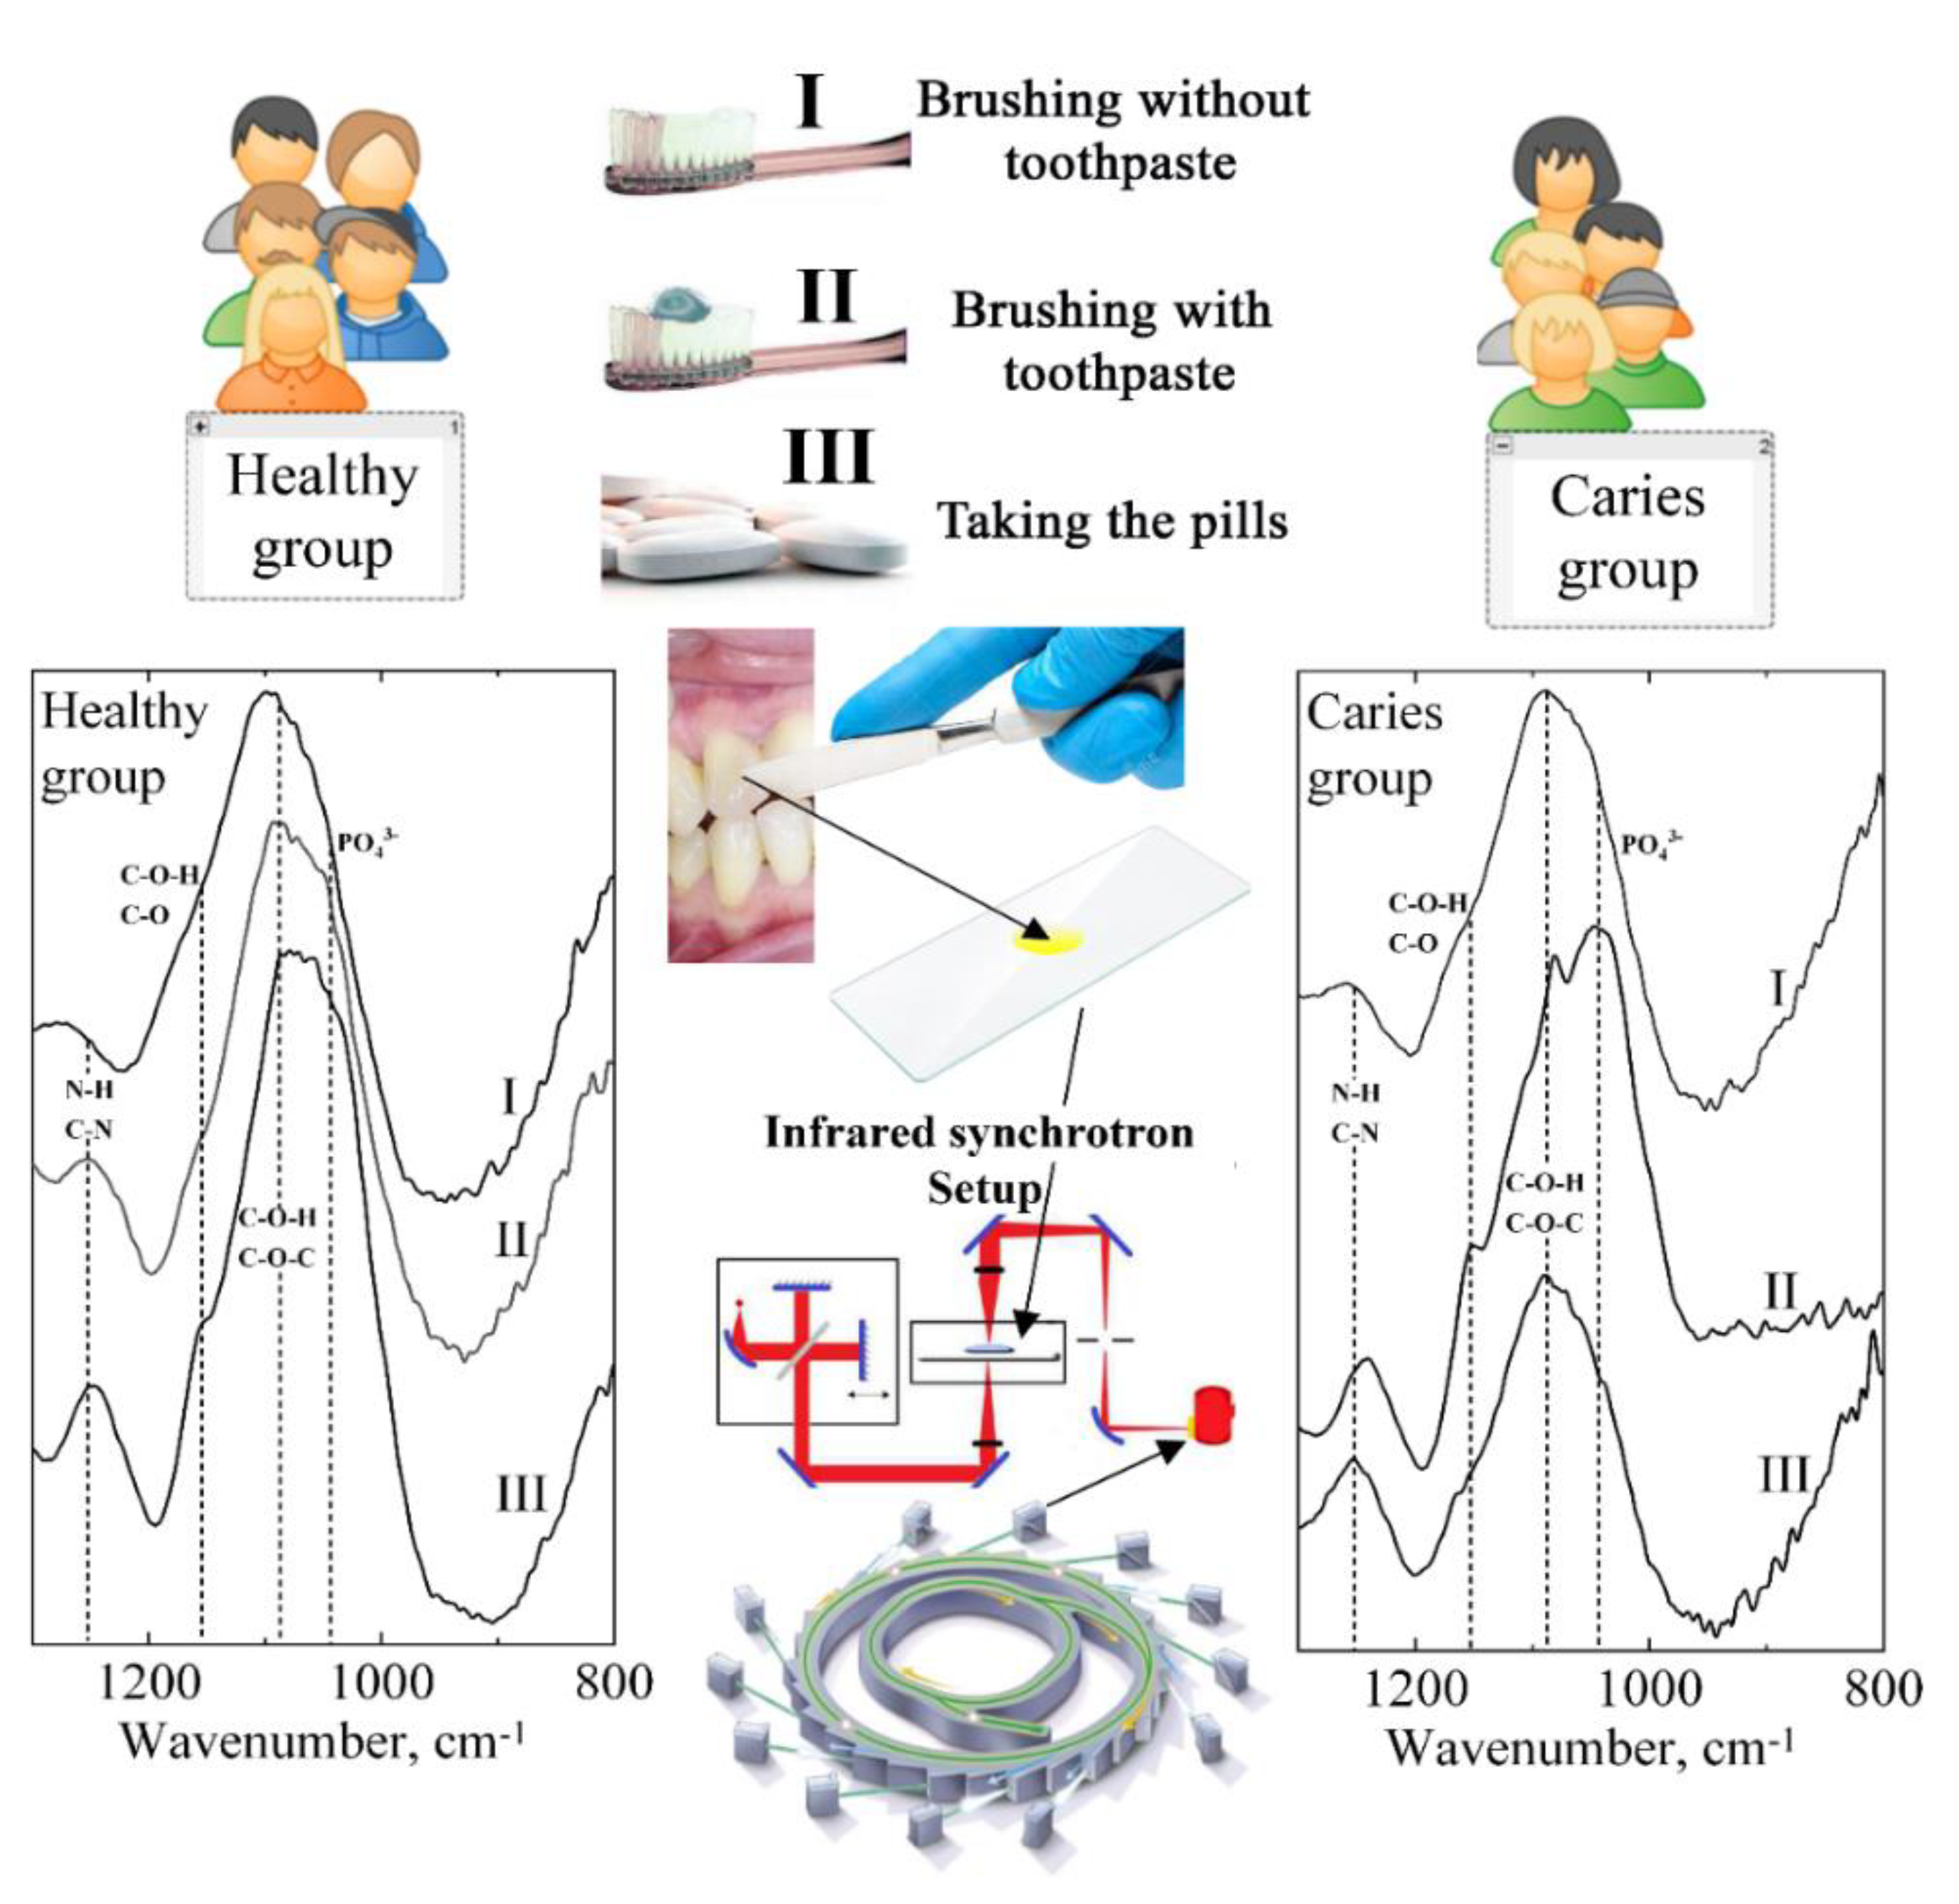
2.1. Research Design
2.2. Equipment Setup and Sample Scanning
2.3. Study Design Scheme
2.4. Statistical Analysis
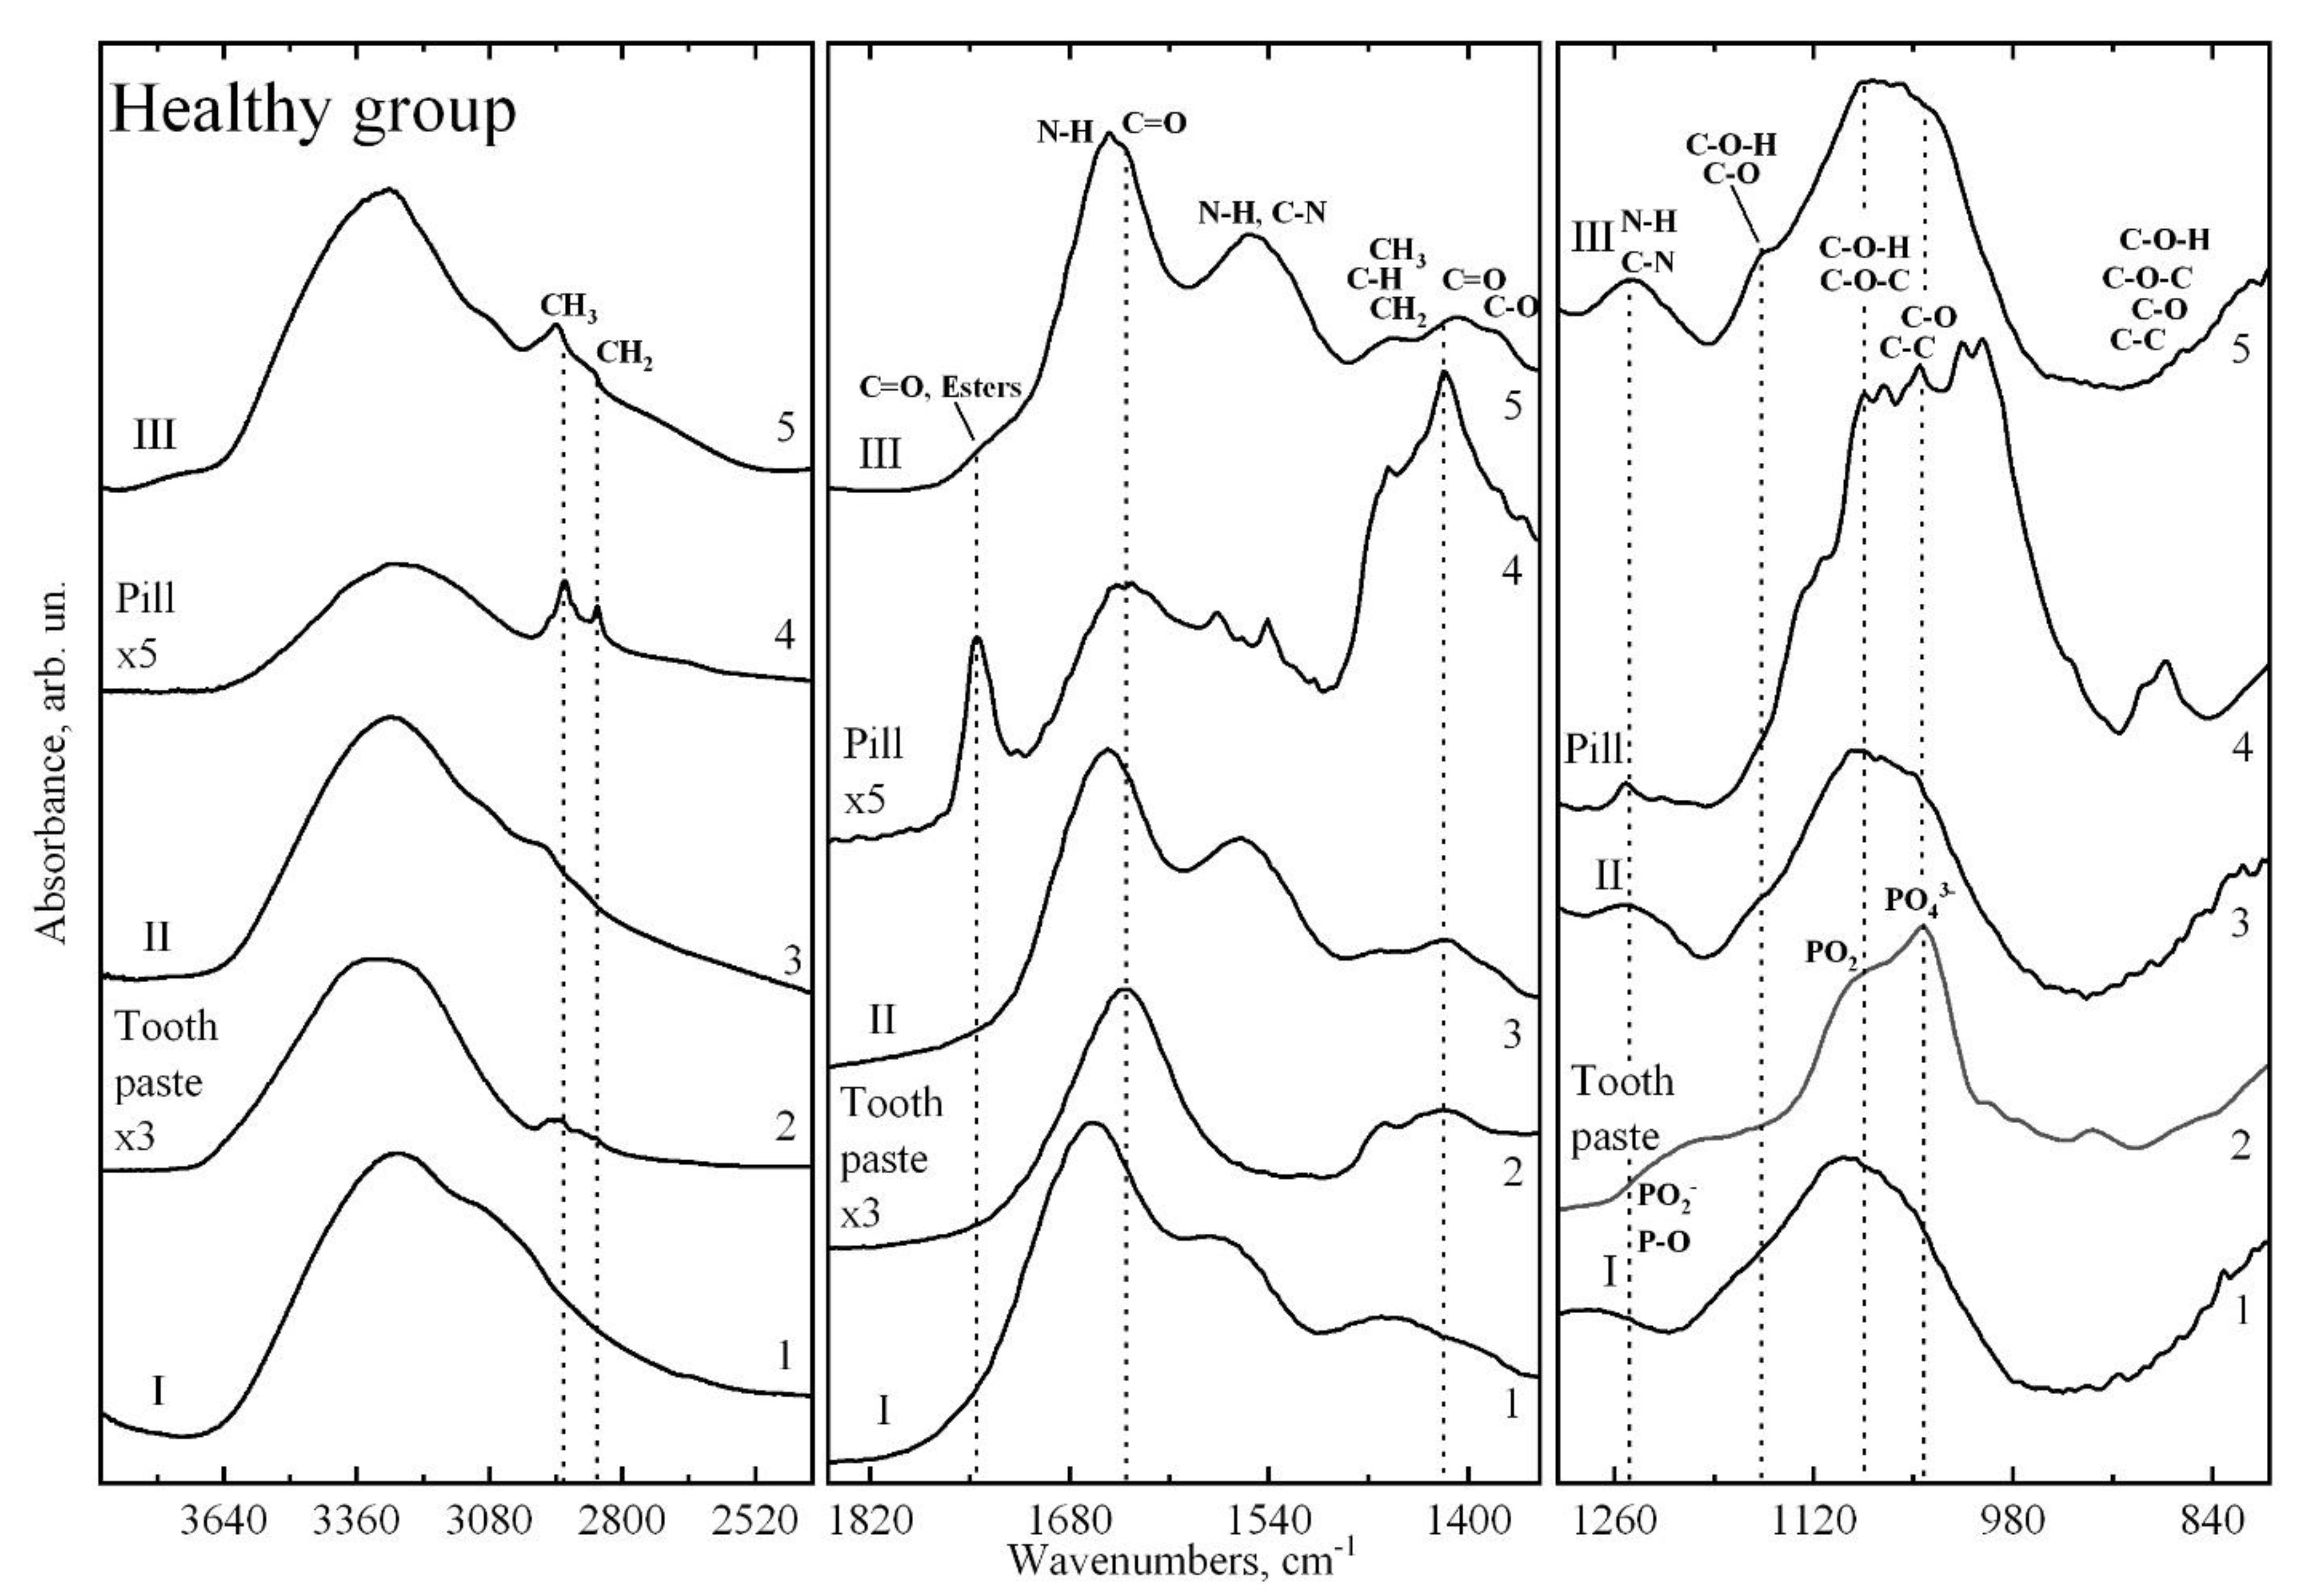
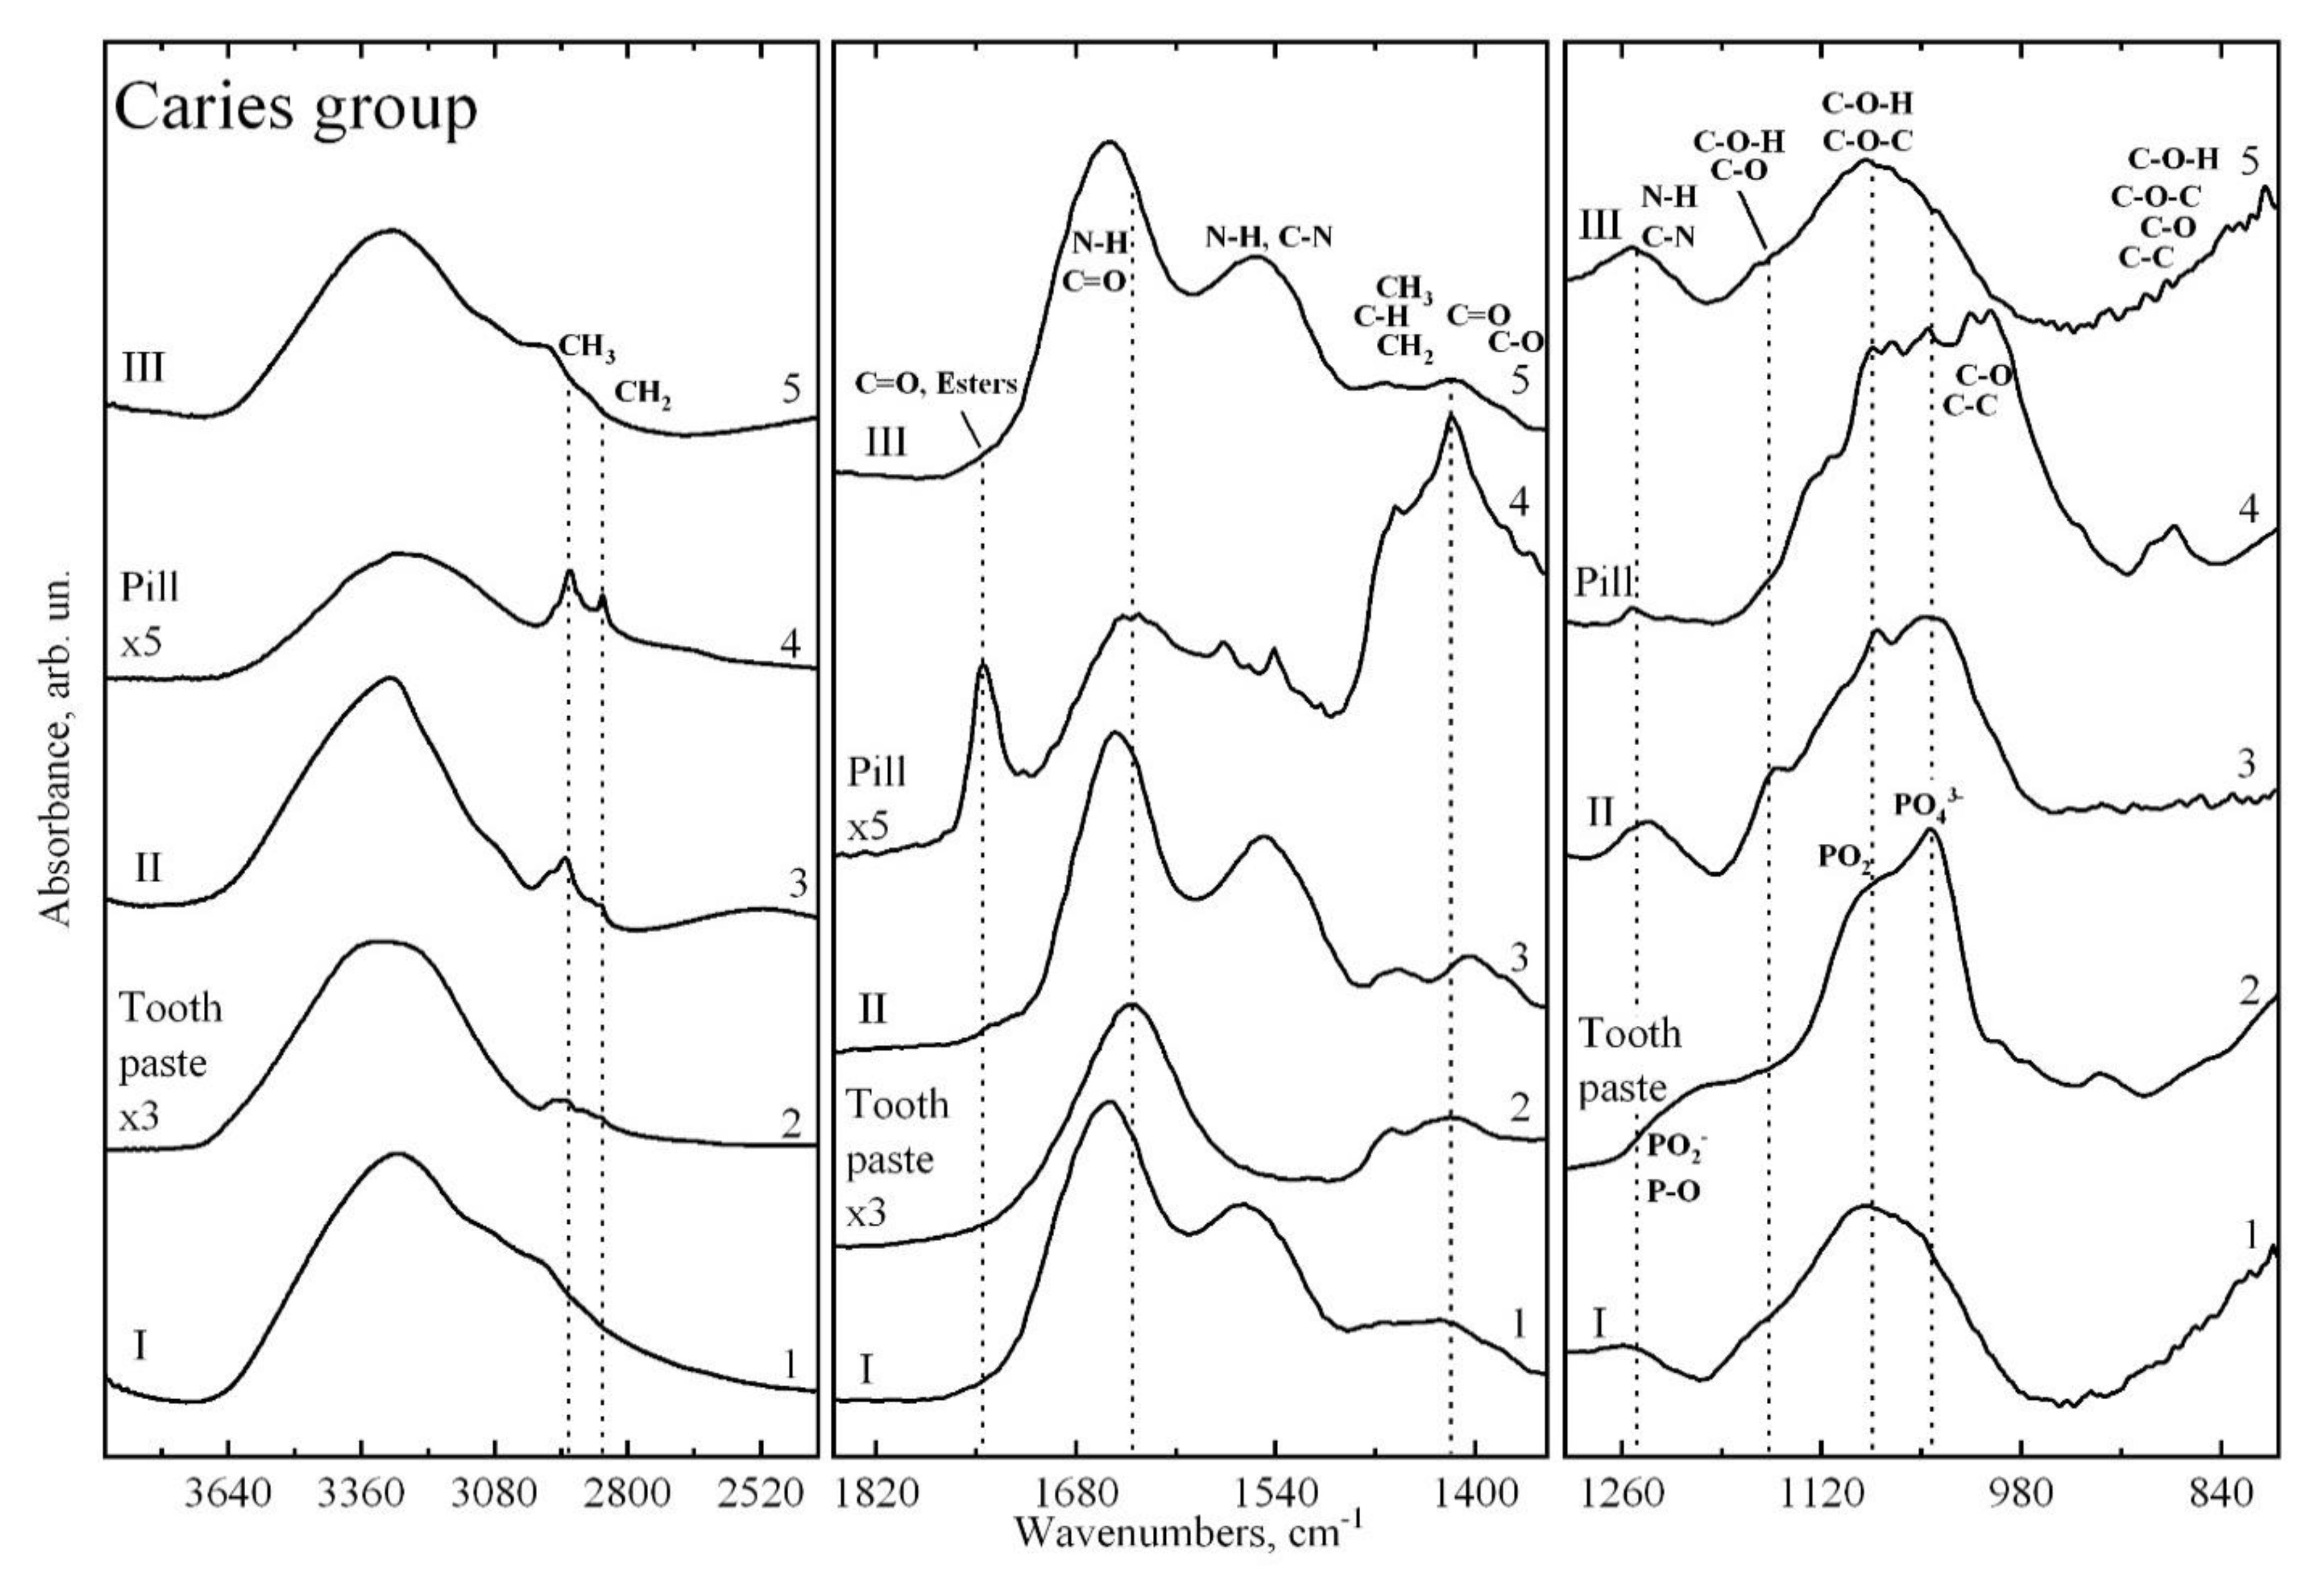
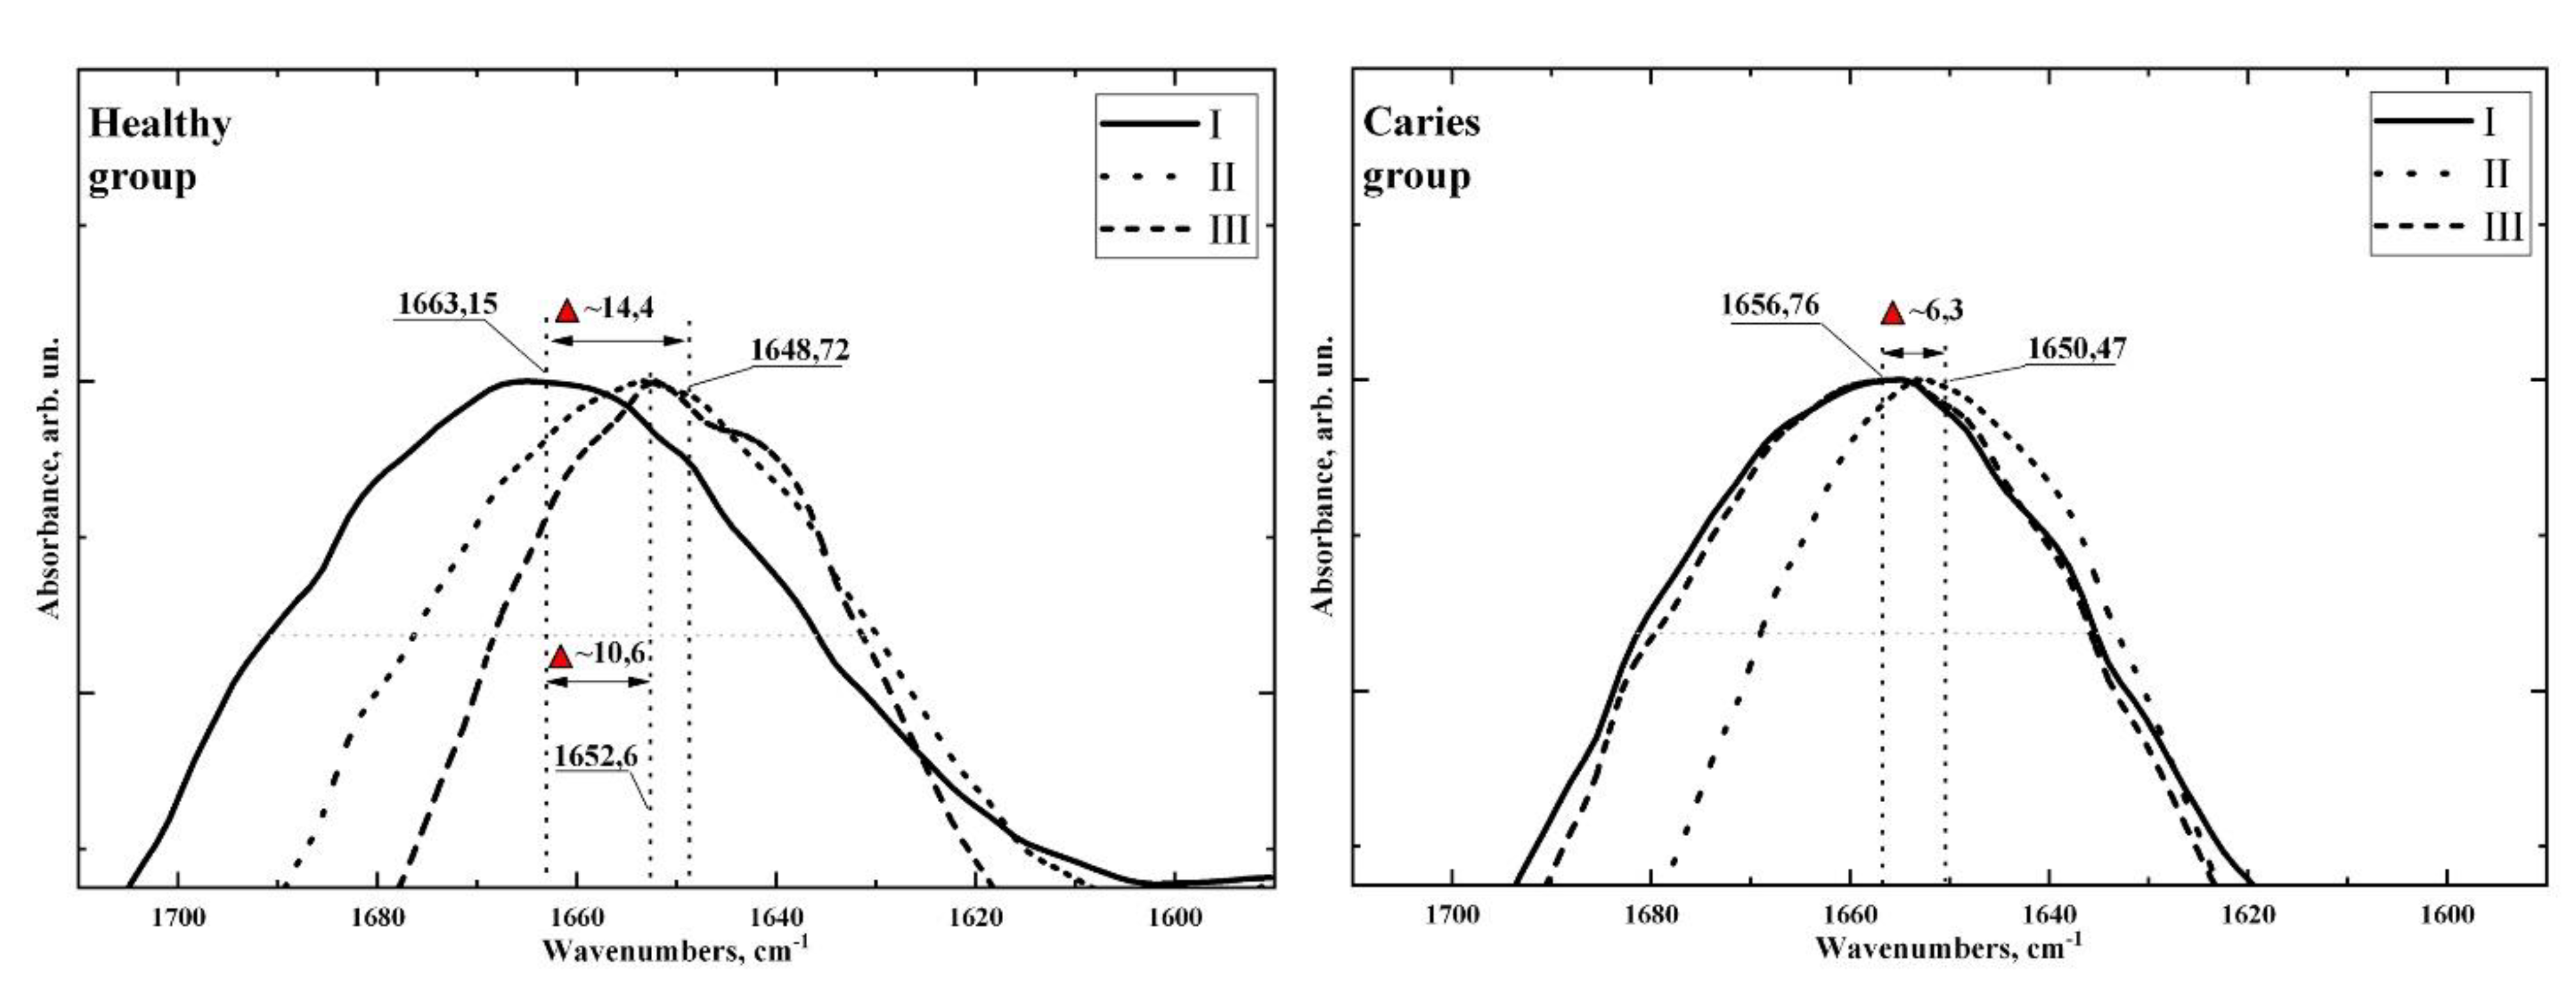
3. Experimental Results
4. Discussion
5. Limitations
6. Conclusions
7. Recommendation of an Expert
Author Contributions
Funding
Institutional Review Board Statement
Informed Consent Statement
Data Availability Statement
Acknowledgments
Conflicts of Interest
References
- Sanz, M.; Beighton, D.; Curtis, M.A.; Cury, J.A.; Dige, I.; Dommisch, H.; Ellwood, R.; Giacaman, R.A.; Herrera, D.; Herzberg, M.C.; et al. Role of Microbial Biofilms in the Maintenance of Oral Health and in the Development of Dental Caries and Periodontal Diseases. Consensus Report of Group 1 of the Joint EFP/ORCA Workshop on the Boundaries between Caries and Periodontal Disease. J. Clin. Periodontol. 2017, 44 (Suppl. S18), S5–S11. [Google Scholar] [CrossRef] [PubMed]
- Kriebel, K.; Hieke, C.; Müller-Hilke, B.; Nakata, M.; Kreikemeyer, B. Oral Biofilms from Symbiotic to Pathogenic Interactions and Associated Disease—Connection of Periodontitis and Rheumatic Arthritis by Peptidylarginine Deiminase. Front. Microbiol. 2018, 9, 53. [Google Scholar] [CrossRef] [PubMed]
- Colombo, A.P.V.; Tanner, A.C.R. The Role of Bacterial Biofilms in Dental Caries and Periodontal and Peri-Implant Diseases: A Historical Perspective. J. Dent. Res. 2019, 98, 373–385. [Google Scholar] [CrossRef]
- Eick, S. (Ed.) Oral Biofilms; Monographs in Oral Science; S. Karger AG: Basel, Switzerland, 2020; Volume 29, ISBN 978-3-318-06851-1. [Google Scholar]
- Gheorghe, D.C.; Niculescu, A.-G.; Bîrcă, A.C.; Grumezescu, A.M. Biomaterials for the Prevention of Oral Candidiasis Development. Pharmaceutics 2021, 13, 803. [Google Scholar] [CrossRef] [PubMed]
- García-Godoy, F.; Hicks, M.J. Maintaining the Integrity of the Enamel Surface: The Role of Dental Biofilm, Saliva and Preventive Agents in Enamel Demineralization and Remineralization. J. Am. Dent. Assoc. 2008, 139 (Suppl. S2), 25S–34S. [Google Scholar] [CrossRef]
- Ma, R.; Liu, J.; Jiang, Y.; Liu, Z.; Tang, Z.; Ye, D.; Zeng, J.; Huang, Z. Modeling of Diffusion Transport through Oral Biofilms with the Inverse Problem Method. Int. J. Oral Sci. 2010, 2, 190–197. [Google Scholar] [CrossRef] [Green Version]
- Leitão, T.J.; Cury, J.A.; Tenuta, L.M.A. Kinetics of Calcium Binding to Dental Biofilm Bacteria. PLoS ONE 2018, 13, e0191284. [Google Scholar] [CrossRef] [Green Version]
- Meyer, F.; Enax, J.; Epple, M.; Amaechi, B.T.; Simader, B. Cariogenic Biofilms: Development, Properties, and Biomimetic Preventive Agents. Dent. J. 2021, 9, 88. [Google Scholar] [CrossRef]
- Krzyściak, W.; Jurczak, A.; Piątkowski, J. The Role of Human Oral Microbiome in Dental Biofilm Formation. In Microbial Biofilms—Importance and Applications; InTech Open: London, UK, 2016. [Google Scholar] [CrossRef] [Green Version]
- Lazar, V.; Ditu, L.-M.; Curutiu, C.; Gheorghe, I.; Holban, A.; Popa, M.; Chifiriuc, C. Impact of Dental Plaque Biofilms in Periodontal Disease: Management and Future Therapy. In Periodontitis—A Useful Reference; Arjunan, P., Ed.; InTech: London, UK, 2017; ISBN 978-953-51-3605-7. [Google Scholar]
- Maske, T.T.; van de Sande, F.H.; Arthur, R.A.; Huysmans, M.C.D.N.J.M.; Cenci, M.S. In Vitro Biofilm Models to Study Dental Caries: A Systematic Review. Biofouling 2017, 33, 661–675. [Google Scholar] [CrossRef] [PubMed]
- de Barros Pinto, L.; Lira, M.L.L.A.; Cavalcanti, Y.W.; de Andrade Dantas, E.L.; Vieira, M.L.O.; de Carvalho, G.G.; de Sousa, F.B. Natural Enamel Caries, Dentine Reactions, Dentinal Fluid and Biofilm. Sci. Rep. 2019, 9, 2841. [Google Scholar] [CrossRef] [PubMed]
- Radaic, A.; Kapila, Y.L. The Oralome and Its Dysbiosis: New Insights into Oral Microbiome-Host Interactions. Comput. Struct. Biotechnol. J. 2021, 19, 1335–1360. [Google Scholar] [CrossRef] [PubMed]
- Hicks, J.; Garcia-Godoy, F.; Flaitz, C. Biological Factors in Dental Caries: Role of Saliva and Dental Plaque in the Dynamic Process of Demineralization and Remineralization (Part 1). J. Clin. Pediatric Dent. 2004, 28, 47–52. [Google Scholar] [CrossRef] [PubMed]
- Hara, A.T.; Zero, D.T. The Caries Environment: Saliva, Pellicle, Diet, and Hard Tissue Ultrastructure. Dent. Clin. North Am. 2010, 54, 455–467. [Google Scholar] [CrossRef]
- Odanaka, H.; Obama, T.; Sawada, N.; Sugano, M.; Itabe, H.; Yamamoto, M. Comparison of Protein Profiles of the Pellicle, Gingival Crevicular Fluid, and Saliva: Possible Origin of Pellicle Proteins. Biol. Res. 2020, 53, 3. [Google Scholar] [CrossRef] [PubMed]
- Lee, Y.H.; Zimmerman, J.N.; Custodio, W.; Xiao, Y.; Basiri, T.; Hatibovic-Kofman, S.; Siqueira, W.L. Proteomic Evaluation of Acquired Enamel Pellicle during In Vivo Formation. PLoS ONE 2013, 8, e67919. [Google Scholar] [CrossRef] [Green Version]
- Paolone, G.; Moratti, E.; Goracci, C.; Gherlone, E.; Vichi, A. Effect of Finishing Systems on Surface Roughness and Gloss of Full-Body Bulk-Fill Resin Composites. Materials 2020, 13, 5657. [Google Scholar] [CrossRef]
- Toledano-Osorio, M.; Osorio, R.; Aguilera, F.S.; Medina-Castillo, A.L.; Toledano, M.; Osorio, E.; Acosta, S.; Chen, R.; Aparicio, C. Polymeric Nanoparticles Protect the Resin-Dentin Bonded Interface from Cariogenic Biofilm Degradation. Acta Biomater. 2020, 111, 316–326. [Google Scholar] [CrossRef] [PubMed]
- Engel, A.-S.; Kranz, H.T.; Schneider, M.; Tietze, J.P.; Piwowarcyk, A.; Kuzius, T.; Arnold, W.; Naumova, E.A. Biofilm Formation on Different Dental Restorative Materials in the Oral Cavity. BMC Oral Health 2020, 20, 162. [Google Scholar] [CrossRef] [PubMed]
- El Gezawi, M.; Wölfle, U.C.; Haridy, R.; Fliefel, R.; Kaisarly, D. Remineralization, Regeneration, and Repair of Natural Tooth Structure: Influences on the Future of Restorative Dentistry Practice. ACS Biomater. Sci. Eng. 2019, 5, 4899–4919. [Google Scholar] [CrossRef]
- Malekipour, M.; Norouzi, Z.; Shahlaei, S. Effect of Remineralizing Agents on Tooth Color after Home Bleaching. Front. Dent. 2019, 16, 158–165. [Google Scholar] [CrossRef]
- Choi, Y.-R.; Choi, M.-S.; Nam, S.-H. Remineralization Effect of Varnish on Early Tooth Decay. Biomed. Res. 2019, 30, 88087095. [Google Scholar] [CrossRef] [Green Version]
- Bang, S.-J.; Jun, S.-K.; Kim, Y.-J.; Ahn, J.-Y.; Vu, H.T.; Mandakhbayar, N.; Han, M.-R.; Lee, J.-H.; Kim, J.-B.; Kim, J.-S.; et al. Characterization of Physical and Biological Properties of a Caries-Arresting Liquid Containing Copper Doped Bioglass Nanoparticles. Pharmaceutics 2022, 14, 1137. [Google Scholar] [CrossRef] [PubMed]
- Seredin, P.; Goloshchapov, D.; Kashkarov, V.; Ippolitov, Y.; Bambery, K. The Investigations of Changes in Mineral–Organic and Carbon–Phosphate Ratios in the Mixed Saliva by Synchrotron Infrared Spectroscopy. Results Phys. 2016, 6, 315–321. [Google Scholar] [CrossRef] [Green Version]
- Seredin, P.V.; Goloshchapov, D.L.; Ippolitov, Y.A.; Kalivradzhiyan, E.S. Does Dentifrice Provide the Necessary Saturation of Ions in Oral Fluids to Favour Remineralisation? Russ. Open Med. J. 2018, 7, e0106. [Google Scholar] [CrossRef] [Green Version]
- Chirman, D.; Pleshko, N. Characterization of Bacterial Biofilm Infections with Fourier Transform Infrared Spectroscopy: A Review. Appl. Spectrosc. Rev. 2021, 56, 673–701. [Google Scholar] [CrossRef]
- Gieroba, B.; Krysa, M.; Wojtowicz, K.; Wiater, A.; Pleszczyńska, M.; Tomczyk, M.; Sroka-Bartnicka, A. The FT-IR and Raman Spectroscopies as Tools for Biofilm Characterization Created by Cariogenic Streptococci. Int. J. Mol. Sci. 2020, 21, 3811. [Google Scholar] [CrossRef] [PubMed]
- Seredin, P.; Kashkarov, V.; Lukin, A.; Ippolitov, Y.; Julian, R.; Doyle, S. Local Study of Fissure Caries by Fourier Transform Infrared Microscopy and X-Ray Diffraction Using Synchrotron Radiation. J. Synchrotron Radiat. 2013, 20, 705–710. [Google Scholar] [CrossRef]
- Seredin, P.; Goloshchapov, D.; Kashkarov, V.; Ippolitov, Y.; Ippolitov, I.; Vongsvivut, J. To the Question on the Use of Multivariate Analysis and 2D Visualisation of Synchrotron ATR-FTIR Chemical Imaging Spectral Data in the Diagnostics of Biomimetic Sound Dentin/Dental Composite Interface. Diagnostics 2021, 11, 1294. [Google Scholar] [CrossRef]
- Azam, M.T.; Khan, A.S.; Muzzafar, D.; Faryal, R.; Siddiqi, S.A.; Ahmad, R.; Chauhdry, A.A.; Rehman, I.U. Structural, Surface, in Vitro Bacterial Adhesion and Biofilm Formation Analysis of Three Dental Restorative Composites. Materials 2015, 8, 3221–3237. [Google Scholar] [CrossRef]
- Cheeseman, S.; Shaw, Z.L.; Vongsvivut, J.; Crawford, R.J.; Dupont, M.F.; Boyce, K.J.; Gangadoo, S.; Bryant, S.J.; Bryant, G.; Cozzolino, D.; et al. Analysis of Pathogenic Bacterial and Yeast Biofilms Using the Combination of Synchrotron ATR-FTIR Microspectroscopy and Chemometric Approaches. Molecules 2021, 26, 3890. [Google Scholar] [CrossRef]
- Fatima, S.; Ali, K.; Ahmed, B.; Al Kheraif, A.A.; Syed, A.; Elgorban, A.M.; Musarrat, J.; Lee, J. Titanium Dioxide Nanoparticles Induce Inhibitory Effects against Planktonic Cells and Biofilms of Human Oral Cavity Isolates of Rothia Mucilaginosa, Georgenia Sp. and Staphylococcus Saprophyticus. Pharmaceutics 2021, 13, 1564. [Google Scholar] [CrossRef] [PubMed]
- Pitts, N.; Ekstrand, K. The ICDAS Foundation International Caries Detection and Assessment System (ICDAS) and Its International Caries Classification and Management System (ICCMS)—Methods for Staging of the Caries Process and Enabling Dentists to Manage Caries. Community Dent. Oral Epidemiol. 2013, 41, e41–e52. [Google Scholar] [CrossRef] [PubMed]
- Nalin, E.K.P.; Danelon, M.; da Silva, E.S.; Hosida, T.Y.; Pessan, J.P.; Delbem, A.C.B. Surface Free Energy, Interaction, and Adsorption of Calcium and Phosphate to Enamel Treated with Trimetaphosphate and Glycerophosphate. CRE 2021, 55, 496–504. [Google Scholar] [CrossRef]
- Zaze, A.C.S.F.; Dias, A.P.; Sassaki, K.T.; Delbem, A.C.B. The Effects of Low-Fluoride Toothpaste Supplemented with Calcium Glycerophosphate on Enamel Demineralization. Clin. Oral Invest. 2014, 18, 1619–1624. [Google Scholar] [CrossRef] [PubMed]
- Vongsvivut, J.; Pérez-Guaita, D.; Wood, B.R.; Heraud, P.; Khambatta, K.; Hartnell, D.; Hackett, M.J.; Tobin, M.J. Synchrotron Macro ATR-FTIR Microspectroscopy for High-Resolution Chemical Mapping of Single Cells. Analyst 2019, 144, 3226–3238. [Google Scholar] [CrossRef]
- Seredin, P.; Goloshchapov, D.; Ippolitov, Y.; Vongsvivut, J. Engineering of a Biomimetic Interface between a Native Dental Tissue and Restorative Composite and Its Study Using Synchrotron FTIR Microscopic Mapping. Int. J. Mol. Sci. 2021, 22, 6510. [Google Scholar] [CrossRef]
- Seredin, P.; Goloshchapov, D.; Ippolitov, Y.; Vongsvivut, J. Spectroscopic Signature of the Pathological Processes of Carious Dentine Based on FTIR Investigations of the Oral Biological Fluids. Biomed. Opt. Express BOE 2019, 10, 4050–4058. [Google Scholar] [CrossRef] [PubMed]
- Baldassarre, M.; Li, C.; Eremina, N.; Goormaghtigh, E.; Barth, A.; Baldassarre, M.; Li, C.; Eremina, N.; Goormaghtigh, E.; Barth, A. Simultaneous Fitting of Absorption Spectra and Their Second Derivatives for an Improved Analysis of Protein Infrared Spectra. Molecules 2015, 20, 12599–12622. [Google Scholar] [CrossRef] [Green Version]
- Barth, A.; Haris, P.I. Biological and Biomedical Infrared Spectroscopy; IOS Press: Amsterdam, The Netherlands, 2009; ISBN 978-1-60750-045-2. [Google Scholar]
- Matthäus, C.; Bird, B.; Miljković, M.; Chernenko, T.; Romeo, M.; Diem, M. Infrared and Raman Microscopy in Cell Biology. Methods Cell Biol. 2008, 89, 275–308. [Google Scholar] [CrossRef] [Green Version]
- Ren, Z.; Do, L.D.; Bechkoff, G.; Mebarek, S.; Keloglu, N.; Ahamada, S.; Meena, S.; Magne, D.; Pikula, S.; Wu, Y.; et al. Direct Determination of Phosphatase Activity from Physiological Substrates in Cells. PLoS ONE 2015, 10, e0120087. [Google Scholar] [CrossRef] [Green Version]
- Yang, S.; Zhang, Q.; Yang, H.; Shi, H.; Dong, A.; Wang, L.; Yu, S. Progress in Infrared Spectroscopy as an Efficient Tool for Predicting Protein Secondary Structure. Int. J. Biol. Macromol. 2022, 206, 175–187. [Google Scholar] [CrossRef] [PubMed]
- Seredin, P.; Goloshchapov, D.; Kashkarov, V.; Ippolitov, Y.; Vongsvivut, J. The Molecular and Mechanical Characteristics of Biomimetic Composite Dental Materials Composed of Nanocrystalline Hydroxyapatite and Light-Cured Adhesive. Biomimetics 2022, 7, 35. [Google Scholar] [CrossRef] [PubMed]
- Goloshchapov, D.; Kashkarov, V.; Nikitkov, K.; Seredin, P. Investigation of the Effect of Nanocrystalline Calcium Carbonate-Substituted Hydroxyapatite and L-Lysine and L-Arginine Surface Interactions on the Molecular Properties of Dental Biomimetic Composites. Biomimetics 2021, 6, 70. [Google Scholar] [CrossRef]
- Liaqat, I. Fourier Transform Infrared Spectroscopy of Dental Unit Water Line Biofilm Bacteria. Spectroscopy 2009, 23, 175–189. [Google Scholar] [CrossRef]
- Seredin, P.; Goloshchapov, D.; Ippolitov, Y.; Vongsvivut, P. Pathology-Specific Molecular Profiles of Saliva in Patients with Multiple Dental Caries—Potential Application for Predictive, Preventive and Personalised Medical Services. EPMA J. 2018, 9, 195–203. [Google Scholar] [CrossRef] [PubMed]
- Meyer, F.; Amaechi, B.T.; Fabritius, H.-O.; Enax, J. Overview of Calcium Phosphates Used in Biomimetic Oral Care. Open Dent. J. 2018, 12, 406–423. [Google Scholar] [CrossRef]
- Ripanti, F.; Luchetti, N.; Nucara, A.; Minicozzi, V.; Venere, A.D.; Filabozzi, A.; Carbonaro, M. Normal Mode Calculation and Infrared Spectroscopy of Proteins in Water Solution: Relationship between Amide I Transition Dipole Strength and Secondary Structure. Int. J. Biol. Macromol. 2021, 185, 369–376. [Google Scholar] [CrossRef]
- Miller, L.M.; Bourassa, M.W.; Smith, R.J. FTIR Spectroscopic Imaging of Protein Aggregation in Living Cells. Biochim. Et Biophys. Acta (BBA) Biomembr. 2013, 1828, 2339–2346. [Google Scholar] [CrossRef] [Green Version]
- Seredin, P.; Goloshchapov, D.; Ippolitov, Y.; Vongsvivut, J. Comparative Analysis of Dentine and Gingival Fluid Molecular Composition and Protein Conformations during Development of Dentine Caries: A Pilot Study. Vib. Spectrosc. 2020, 108, 103058. [Google Scholar] [CrossRef]
- Andrade, M.R.T.C.; Salazar, S.L.A.; de Sá, L.F.R.; Portela, M.; Ferreira-Pereira, A.; Soares, R.M.A.; Leão, A.T.T.; Primo, L.G. Role of Saliva in the Caries Experience and Calculus Formation of Young Patients Undergoing Hemodialysis. Clin. Oral Investig. 2015, 19, 1973–1980. [Google Scholar] [CrossRef]


| Molecular Group Assignment | Vibration Modes | Wave Numbers, cm−1 | References |
|---|---|---|---|
| Proteins (α-Amylase; Albumin; Cystatins; Mucins; Proline-rich proteins; sIgA) -HormonesBREAK (Cortisol; Testosterone) | O-H str of hydroxyl groups | 3600–3100 | [28,29,42] |
| functional groups dominated by fatty acid chains, lipids (phospholipids) | C–H str (asym) of –CH3, C–H str (asym) of > CH2, | 2963–2855 | [28,29,42,43,48] |
| Lipid ester carbonyl and DNA strands | >C=O stretching, C=O stretching groups and DNA characteristic of base-paired | 1740–1710 | [28,29,43,48,49] |
| Protein, Peptide | Amide I of α-helical structures, Amide I C=O stretching and Amide II N–H bending | 1675–1615 | [28,29,41,42,43,45] |
| Proteins, tryptophan, Peptide | Amide II, νN–H, νC=N stretching, νC=C | 1575–1520 | [28,29,42,43] |
| Amino acid side chains, lipids and proteins | Asymmetric CH2 bending Methyl bending of | 1469–1455 | [28,29,41,42,43,44,45] |
| Fibrinogen/methyl bending of amino acid side chains, lipids and proteins | Symmetric CH3 bending, Stretching of COO | 1412–1396 | [28,29,41,42,43,44,45] |
| Proteins | Amide III coupled N–H/C–H deformations, τ (N–H), ν (C–N), τ (C=O), ν (C–C), ν (CH3) | 1350–1200 | [28,29,42,43] |
| Phosphodiester groups in DNA, Proteins (amide III, mainly α–helix conformation) | P=O of PO2− stretching, Amide III Asymmetric C–N stretching | 1250–1240 | [28,29,42,43,44] |
| Ester; Membrane lipids (phospholipids); Carbohydrates | P=O of PO2, CO-O-C antisymmetric stretching C–O, C–C stretching and C–O–H, C–O–C deformation | 1171–1160 | [28,29,42,43,44] |
| Polysaccharides, Carbohydrates, Phosphates, glycerophosphate and phosphatase; Phospholipids Phosphodiester groups in DNA | PO2− stretching, CH2 OH groups, C–O stretching and COH groups bending, C–C, C–O–P–O–C | 1085–1050 | [28,29,42,43,44] |
| Phosphodiester residue (DNA) | C–O–P | 975–960 | [29,42,43,44] |
| Carbohydrates and (CH3)3 symmetric stretching Membrane lipids (phospholipids) | C–O, C–C stretching, C–O–H, C–O–C deformation C–H stretch, 3rd overtones | 929–924 | [29,42] |
| Fingerprint region | Anomeric ring vibrations for tryptophan, tyrosine, and phenyloalanine | 900–800 | [29,42] |
| Participants in Experiment | Ratio | Stage of Experiment | ||
|---|---|---|---|---|
| I Without Prophylaxis | II Toothpaste | III Tablet | ||
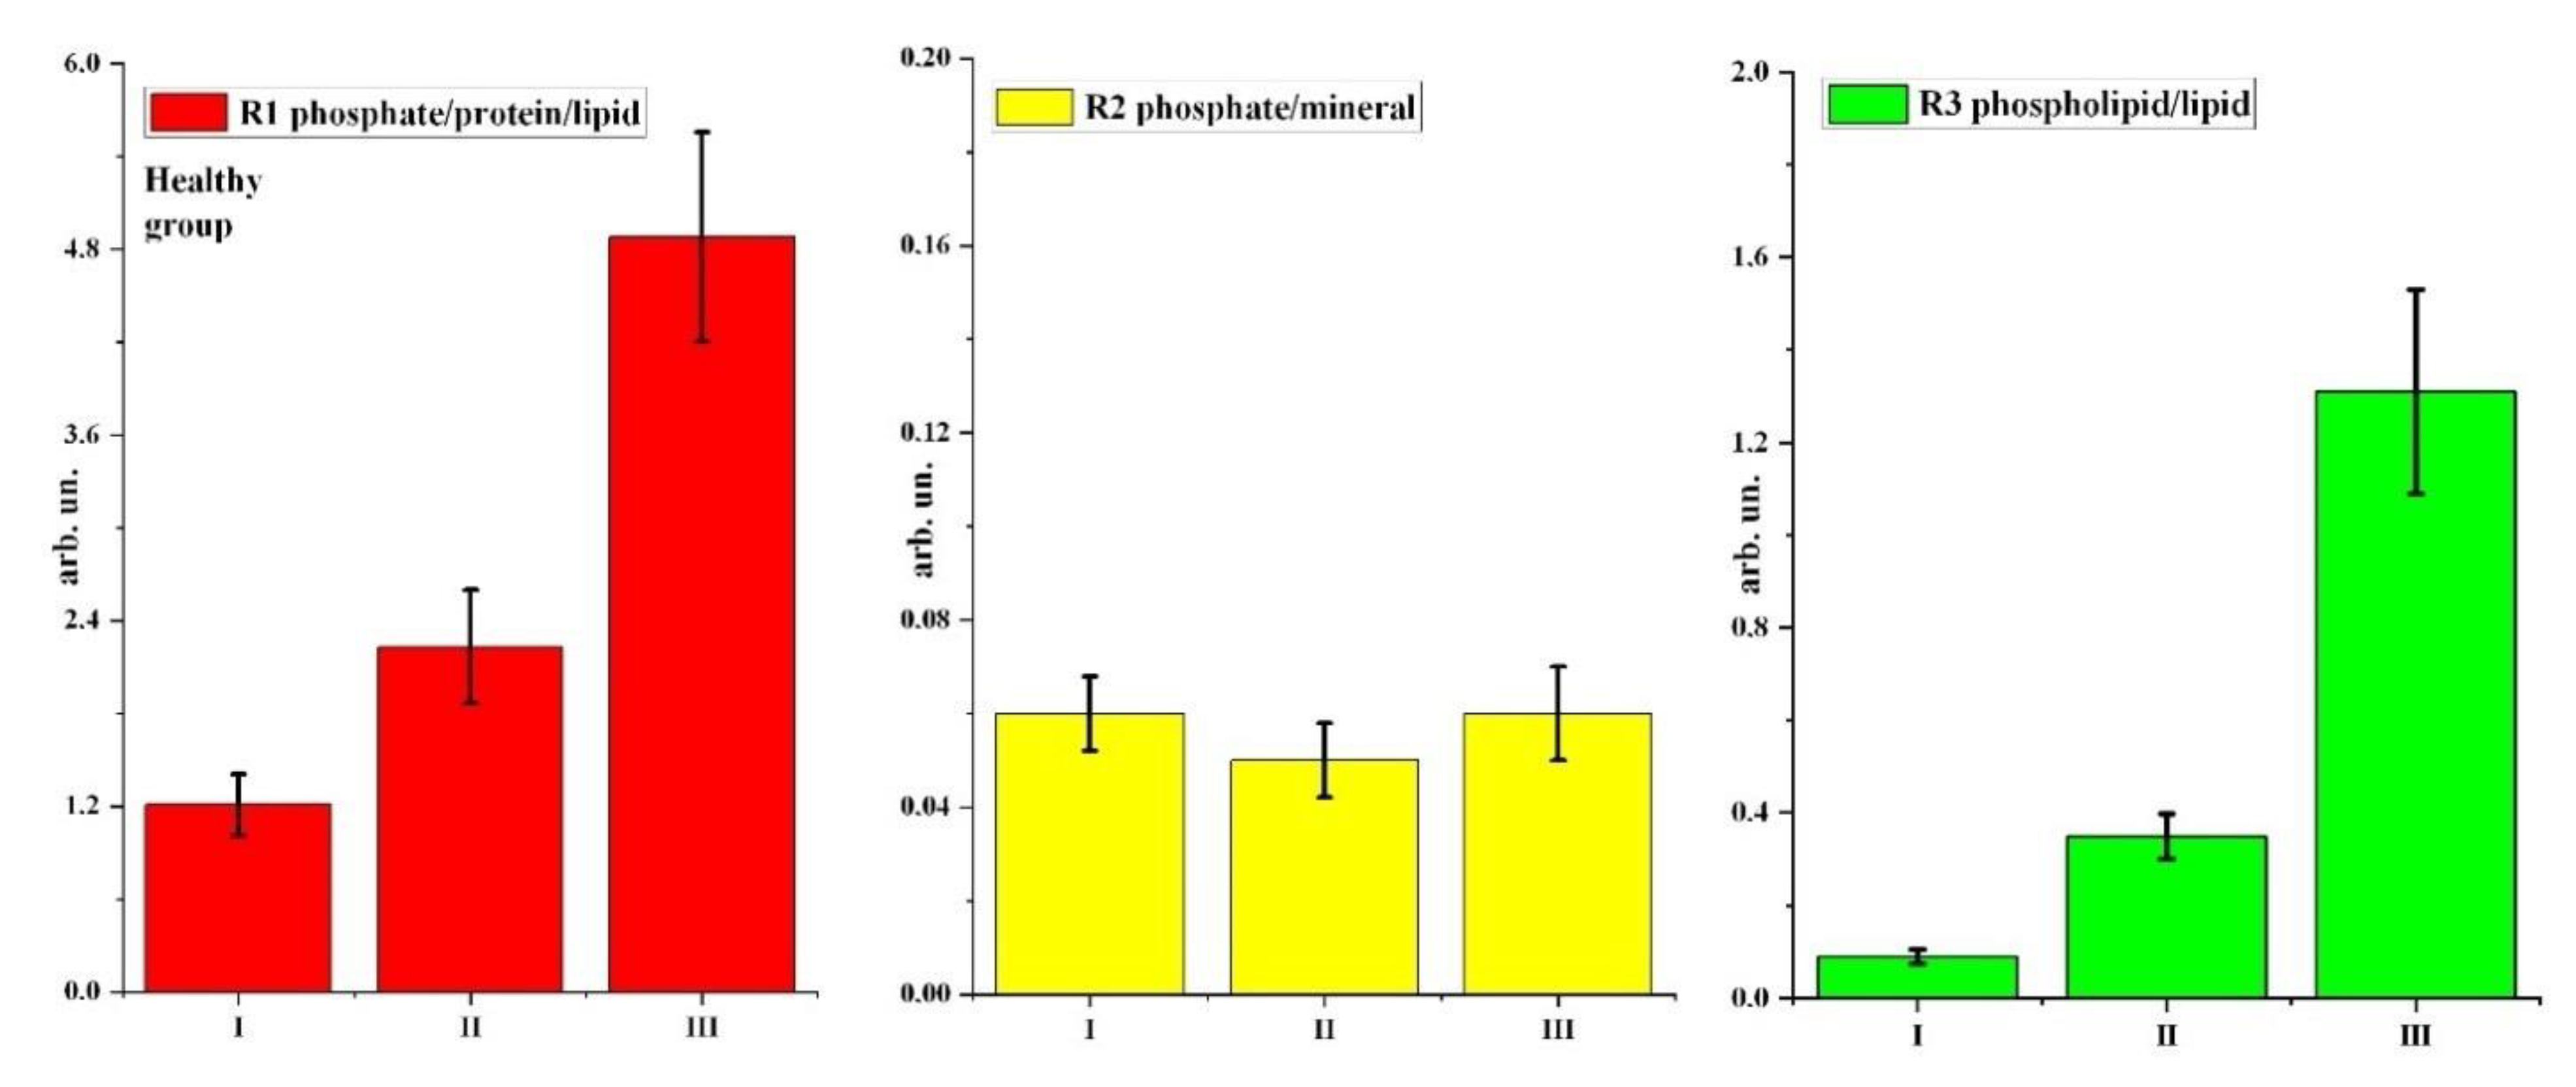
| Healthy group | R1 phosphate/protein/lipid | 1.21 ± 0.20 | 2.23 ± 0.368 | 4.88 ± 0.68 |
| R2 phosphate/mineral | 0.06 ± 0.008 | 0.05 ± 0.008 | 0.06 ± 0.01 | |
| R3 phospholipid/lipid | 0.09 ± 0.016 | 0.35 ± 0.048 | 1.31 ± 0.22 | |
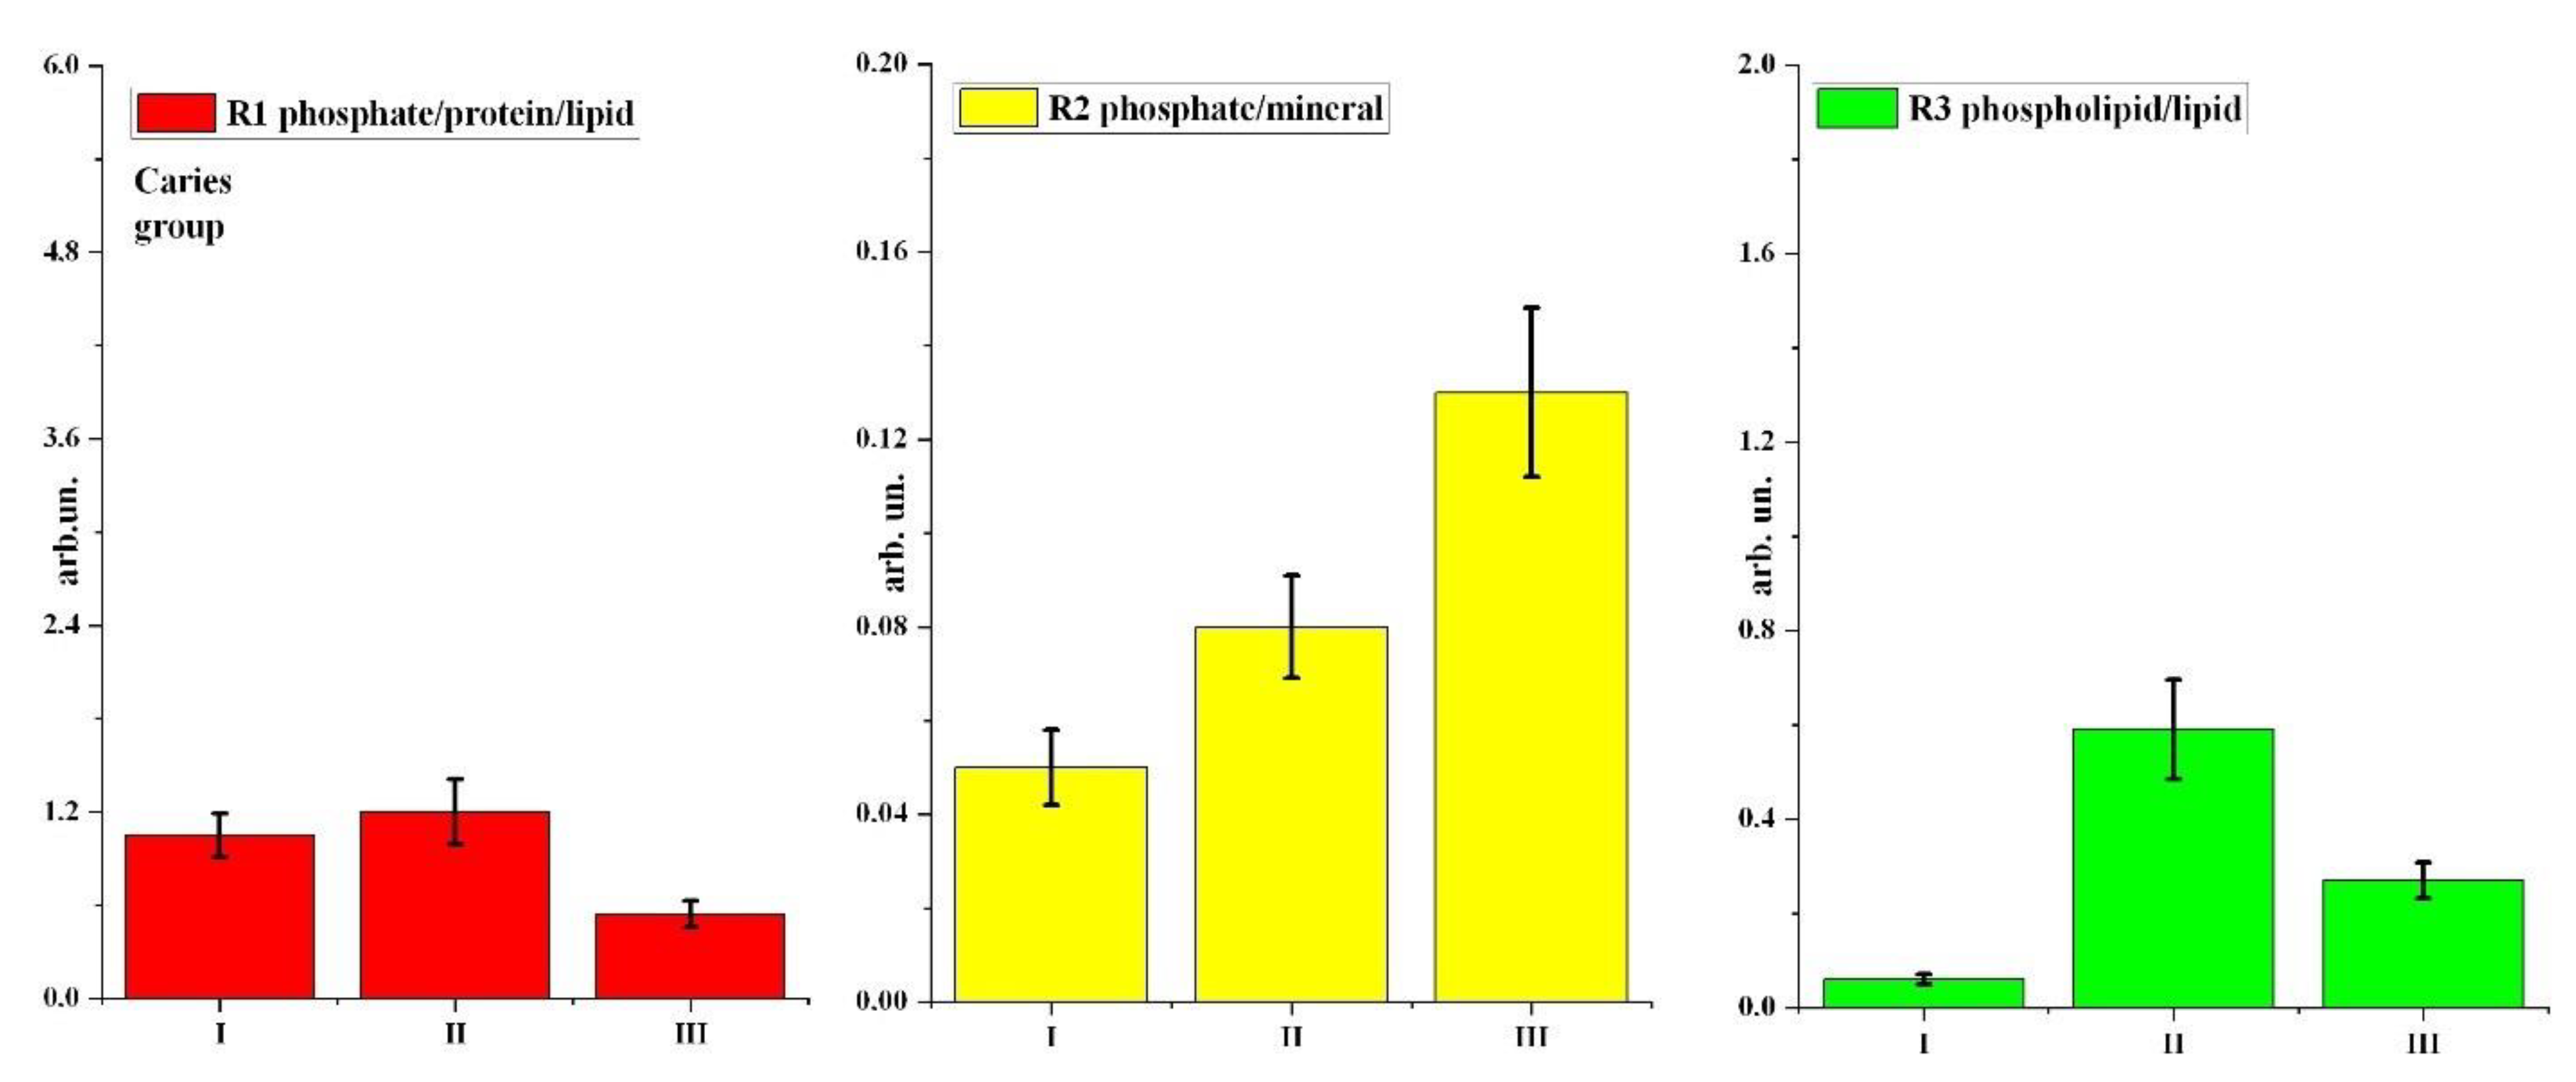
| Caries group | R1 phosphate/protein/lipid | 1.05 ± 0.14 | 1.20 ± 0.21 | 0.54 ± 0.086 |
| R2 phosphate/mineral | 0.05 ± 0.008 | 0.08 ± 0.011 | 0.13 ± 0.018 | |
| R3 phospholipid/lipid | 0.06 ± 0.011 | 0.59 ± 0.105 | 0.27 ± 0.038 | |
| Participant Group | Stages of Experiment (Stages of Prophylaxis) | Ratios | ||
|---|---|---|---|---|
| R1 | R2 | R3 | ||
| Healthy | I (without prophylaxis)—II (toothpaste) | + [0.035] | − | + [0.005] |
| I (without prophylaxis)—III (tablet) | + [0.01] | − | + [0.007] | |
| Carious | I (without prophylaxis)—II (toothpaste) | − | − | + [0.003] |
| I (without prophylaxis)—III (tablet) | + [0.01] | + [0.005] | + [0.001] | |
| Stages of Experiment (Stages of Prophylaxis) | Ratios | ||
|---|---|---|---|
| R1 | R2 | R3 | |
| II (toothpaste) | + [0.01] | − | − |
| III (tablet) | + [0.003] | + [0.01] | + [0.001] |
Publisher’s Note: MDPI stays neutral with regard to jurisdictional claims in published maps and institutional affiliations. |
© 2022 by the authors. Licensee MDPI, Basel, Switzerland. This article is an open access article distributed under the terms and conditions of the Creative Commons Attribution (CC BY) license (https://creativecommons.org/licenses/by/4.0/).
Share and Cite
Seredin, P.; Goloshchapov, D.; Kashkarov, V.; Nesterov, D.; Ippolitov, Y.; Ippolitov, I.; Vongsvivut, J. Effect of Exo/Endogenous Prophylaxis Dentifrice/Drug and Cariogenic Conditions of Patient on Molecular Property of Dental Biofilm: Synchrotron FTIR Spectroscopic Study. Pharmaceutics 2022, 14, 1355. https://doi.org/10.3390/pharmaceutics14071355
Seredin P, Goloshchapov D, Kashkarov V, Nesterov D, Ippolitov Y, Ippolitov I, Vongsvivut J. Effect of Exo/Endogenous Prophylaxis Dentifrice/Drug and Cariogenic Conditions of Patient on Molecular Property of Dental Biofilm: Synchrotron FTIR Spectroscopic Study. Pharmaceutics. 2022; 14(7):1355. https://doi.org/10.3390/pharmaceutics14071355
Chicago/Turabian StyleSeredin, Pavel, Dmitry Goloshchapov, Vladimir Kashkarov, Dmitry Nesterov, Yuri Ippolitov, Ivan Ippolitov, and Jitraporn Vongsvivut. 2022. "Effect of Exo/Endogenous Prophylaxis Dentifrice/Drug and Cariogenic Conditions of Patient on Molecular Property of Dental Biofilm: Synchrotron FTIR Spectroscopic Study" Pharmaceutics 14, no. 7: 1355. https://doi.org/10.3390/pharmaceutics14071355