
Therapeutic Drug Monitoring of Mycophenolic Acid as a Precision Medicine Tool for Heart Transplant Patients: Results of an Observational Pharmacokinetic Pilot Study

 , ,
, ,
Abstract
:1. Introduction
2. Materials and Methods
2.1. Patients
2.2. Study Design and Pharmacokinetic Measurements
2.3. Rejection Assessment
2.4. Statistical Analysis
3. Results
3.1. Patients Characterization
3.2. Analysis of Patients’ Primary Outcome: PK Analysis
3.3. Descriptive Analysis of Patients Reporting Acute Cellular Rejection
4. Discussion
5. Conclusions
Author Contributions
Funding
Institutional Review Board Statement
Informed Consent Statement
Data Availability Statement
Acknowledgments
Conflicts of Interest
References
- Chambers, D.C.; Cherikh, W.S.; Harhay, M.O.; Hayes, D.J.; Hsich, E.; Khush, K.K.; Meiser, B.; Potena, L.; Rossano, J.W.; Toll, A.E.; et al. The International Thoracic Organ Transplant Registry of the International Society for Heart and Lung Transplantation: Thirty-sixth adult lung and heart-lung transplantation Report-2019; Focus theme: Donor and recipient size match. J. Heart Lung Transplant. Off. Publ. Int. Soc. Heart Transplant. 2019, 38, 1042–1055. [Google Scholar] [CrossRef] [PubMed]
- Staatz, C.E.; Tett, S.E. Clinical pharmacokinetics and pharmacodynamics of mycophenolate in solid organ transplant recipients. Clin. Pharmacokinet. 2007, 46, 13–58. [Google Scholar] [CrossRef] [PubMed]
- Staatz, C.E.; Tett, S.E. Pharmacology and toxicology of mycophenolate in organ transplant recipients: An update. Arch. Toxicol. 2014, 88, 1351–1389. Available online: http://www.ncbi.nlm.nih.gov/pubmed/24792322 (accessed on 1 March 2022). [CrossRef] [PubMed]
- Cattaneo, D.; Merlini, S.; Zenoni, S.; Baldelli, S.; Gotti, E.; Remuzzi, G.; Perico, N. Influence of Co-Medication with Sirolimus or Cyclosporine on Mycophenolic Acid Pharmacokinetics in Kidney Transplantation. Am. J. Transplant. 2005, 5, 2937–2944. [Google Scholar] [CrossRef]
- Yau, W.-P.; Vathsala, A.; Lou, H.-X.; Zhou, S.; Chan, E. Mechanism-based enterohepatic circulation model of mycophenolic acid and its glucuronide metabolite: Assessment of impact of cyclosporine dose in Asian renal transplant patients. J. Clin. Pharmacol. 2009, 49, 684–699. [Google Scholar] [CrossRef]
- Bergan, S.; Brunet, M.; Hesselink, D.A.; Johnson-Davis, K.L.; Kunicki, P.K.; Lemaitre, F.; Marquet, P.; Molinaro, M.; Noceti, O.; Pattanaik, S.; et al. Personalized Therapy for Mycophenolate: Consensus Report by the International Association of Therapeutic Drug Monitoring and Clinical Toxicology. Ther. Drug Monit. 2021, 43, 150–200. Available online: https://journals.lww.com/10.1097/FTD.0000000000000871 (accessed on 1 March 2022). [CrossRef]
- Kuypers, D.R.J.; Le Meur, Y.; Cantarovich, M.; Tredger, M.J.; Tett, S.E.; Cattaneo, D.; Tönshoff, B.; Holt, D.W.; Chapman, J.; van Gelder, T. Consensus report on therapeutic drug monitoring of mycophenolic acid in solid organ transplantation. Clin. J. Am. Soc. Nephrol. 2010, 5, 341–358. [Google Scholar] [CrossRef] [Green Version]
- Shaw, L.M.; Kaplan, B.; DeNofrio, D.; Korecka, M.; Brayman, K.L. Pharmacokinetics and concentration-control investigations of mycophenolic acid in adults after transplantation. Ther. Drug Monit. 2000, 22, 14–19. [Google Scholar] [CrossRef]
- Yamani, M.H.; Starling, R.C.; Goormastic, M.; Van Lente, F.; Smedira, N.; McCarthy, P.; Young, J.B. The impact of routine mycophenolate mofetil drug monitoring on the treatment of cardiac allograft rejection. Transplantation 2000, 69, 2326–2330. [Google Scholar] [CrossRef]
- Hesse, C.J.; Vantrimpont, P.; van Riemsdijk-van Overbeeke, I.C.; van Gelder, T.; Balk, A.H.; Weimar, W. The value of routine monitoring of mycophenolic acid plasma levels after clinical heart transplantation. Transplant. Proc. 2001, 33, 2163–2164. [Google Scholar] [CrossRef]
- van Gelder, T.; Tedesco Silva, H.; de Fijter, J.W.; Budde, K.; Kuypers, D.; Arns, W.; Paul Soulillou, J.; Kanellis, J.; Zelvys, A.; Ekberg, H.; et al. Renal Transplant Patients at High Risk of Acute Rejection Benefit From Adequate Exposure to Mycophenolic Acid. Transplantation 2010, 89, 595–599. Available online: https://journals.lww.com/transplantjournal/Fulltext/2010/03150/Renal_Transplant_Patients_at_High_Risk_of_Acute.14.aspx (accessed on 1 March 2022). [CrossRef] [PubMed]
- Woillard, J.-B.; Saint-Marcoux, F.; Monchaud, C.; Youdarène, R.; Pouche, L.; Marquet, P. Mycophenolic mofetil optimized pharmacokinetic modelling, and exposure-effect associations in adult heart transplant recipients. Pharmacol. Res. 2015, 99, 308–315. Available online: https://www.sciencedirect.com/science/article/pii/S1043661815001450 (accessed on 1 March 2022). [CrossRef] [PubMed]
- Figurski, M.J.; Pawiński, T.; Goldberg, L.R.; DeNofrio, D.; Nawrocki, A.; Taylor, D.O.; Lake, K.D.; Chojnowski, D.; Shaw, L.M. Pharmacokinetic monitoring of mycophenolic acid in heart transplant patients: Correlation the side-effects and rejections with pharmacokinetic parameters. Ann. Transplant. 2012, 17, 68–78. [Google Scholar] [CrossRef] [PubMed]
- Sponga, S.; Travaglini, C.; Pisa, F.; Piani, D.; Guzzi, G.; Nalli, C.; Spagna, E.; Tursi, V.; Livi, U. Does psychosocial compliance have an impact on long-term outcome after heart transplantation? Eur. J. Cardiothorac. Surg. Off. J. Eur. Assoc. Cardiothorac. Surg. 2016, 49, 64–72. [Google Scholar] [CrossRef] [PubMed] [Green Version]
- Kobashigawa, J.A.; Miller, L.W.; Russell, S.D.; Ewald, G.A.; Zucker, M.J.; Goldberg, L.R.; Eisen, H.J.; Salm, K.; Tolzman, D.; Gao, J.; et al. Tacrolimus with Mycophenolate Mofetil (MMF) or Sirolimus vs. Cyclosporine with MMF in Cardiac Transplant Patients: 1-Year Report. Am. J. Transplant. 2006, 6, 1377–1386. [Google Scholar] [CrossRef]
- Brunet, M.; van Gelder, T.; Åsberg, A.; Haufroid, V.; Hesselink, D.A.; Langman, L.; Lemaitre, F.; Marquet, P.; Seger, C.; Shipkova, M.; et al. Therapeutic Drug Monitoring of Tacrolimus-Personalized Therapy: Second Consensus Report. Ther. Drug Monit. 2019, 41, 261–307. Available online: https://journals.lww.com/drug-monitoring/Fulltext/2019/06000/Therapeutic_Drug_Monitoring_of.2.aspx (accessed on 1 March 2022). [CrossRef]
- Shaw, L.M.; Korecka, M.; van Breeman, R.; Nowak, I.; Brayman, K.L. Analysis, pharmacokinetics and therapeutic drug monitoring of mycophenolic acid. Clin. Biochem. 1998, 31, 323–328. [Google Scholar] [CrossRef]
- Zhang, Y.; Huo, M.; Zhou, J.; Xie, S. PKSolver: An add-in program for pharmacokinetic and pharmacodynamic data analysis in Microsoft Excel. Comput. Methods Programs Biomed. 2010, 99, 306–314. [Google Scholar] [CrossRef]
- Xiang, H.; Zhou, H.; Zhang, J.; Sun, Y.; Wang, Y.; Han, Y.; Cai, J. Limited Sampling Strategy for Estimation of Mycophenolic Acid Exposure in Adult Chinese Heart Transplant Recipients. Front. Pharmacol. 2021, 12, 652333. [Google Scholar] [CrossRef]
- Ting, L.S.L.; Partovi, N.; Levy, R.D.; Riggs, K.W.; Ensom, M.H.H. Pharmacokinetics of mycophenolic acid and its phenolic-glucuronide and ACYl glucuronide metabolites in stable thoracic transplant recipients. Ther. Drug Monit. 2008, 30, 282–291. [Google Scholar] [CrossRef]
- Billingham, M.; Kobashigawa, J.A. The revised ISHLT heart biopsy grading scale. J. Heart Lung Transplant. Off. Publ. Int. Soc. Heart Transplant. 2005, 24, 1709. [Google Scholar] [CrossRef] [PubMed]
- Dösch, A.O.; Ehlermann, P.; Koch, A.; Remppis, A.; Katus, H.A.; Dengler, T.J. A comparison of measured trough levels and abbreviated AUC estimation by limited sampling strategies for monitoring mycophenolic acid exposure in stable heart transplant patients receiving cyclosporin A-containing and cyclosporin A-free immunosuppressive. Clin. Ther. 2006, 28, 893–905. [Google Scholar] [CrossRef] [PubMed]
- Noreikaitė, A.; Saint-Marcoux, F.; Marquet, P.; Kaduševičius, E.; Stankevičius, E. Influence of cyclosporine and everolimus on the main mycophenolate mofetil pharmacokinetic parameters: Cross-sectional study. Medicine 2017, 96, e6469. [Google Scholar] [CrossRef]
- Zuk, D.M.; Pearson, G.J. Monitoring of mycophenolate mofetil in orthotopic heart transplant recipients-a systematic review. Transplant. Rev. 2009, 23, 171–177. [Google Scholar] [CrossRef]
- Monchaud, C.; Marquet, P. Pharmacokinetic Optimization of Immunosuppressive Therapy in Thoracic Transplantation: Part II. Clin. Pharmacokinet. 2009, 48, 489–516. [Google Scholar] [CrossRef] [PubMed]
- DeNofrio, D.; Loh, E.; Kao, A.; Korecka, M.; Pickering, F.W.; Craig, K.A.; Shaw, L.M. Mycophenolic acid concentrations are associated with cardiac allograft rejection. J. Heart lung Transplant. Off. Publ. Int. Soc. Heart Transplant. 2000, 19, 1071–1076. [Google Scholar] [CrossRef]
- Baraldo, M.; Isola, M.; Feruglio, M.T.; Francesconi, A.; Franceschi, L.; Tursi, V.; Livi, U.; Furlanut, M. Therapeutic mycophenolic acid monitoring by means of limited sampling strategy in orthotopic heart transplant patients. Transplant. Proc. 2005, 37, 2240–2243. [Google Scholar] [CrossRef] [PubMed]
- Wada, K.; Takada, M.; Kotake, T.; Ochi, H.; Morishita, H.; Komamura, K.; Oda, N.; Mano, A.; Kato, T.S.; Hanatani, A.; et al. Limited Sampling Strategy for Mycophenolic Acid in Japanese Heart Transplant Recipients. Circ. J. 2007, 71, 1022–1028. [Google Scholar] [CrossRef] [Green Version]
- Kaczmarek, I.; Bigdeli, A.K.; Vogeser, M.; Mueller, T.; Beiras-Fernandez, A.; Kaczmarek, P.; Schmoeckel, M.; Meiser, B.; Reichart, B.; Ueberfuhr, P. Defining algorithms for efficient therapeutic drug monitoring of mycophenolate mofetil in heart transplant recipients. Ther. Drug Monit. 2008, 30, 419–427. [Google Scholar] [CrossRef]
- Shaw, L.M.; Figurski, M.; Milone, M.C.; Trofe, J.; Bloom, R.D. Therapeutic Drug Monitoring of Mycophenolic Acid. Clin. J. Am. Soc. Nephrol. 2007, 2, 1062–1072. Available online: http://cjasn.asnjournals.org/content/2/5/1062.abstract (accessed on 1 March 2022). [CrossRef]
- Pescovitz, M.D.; Guasch, A.; Gaston, R.; Rajagopalan, P.; Tomlanovich, S.; Weinstein, S.; Bumgardner, G.L.; Melton, L.; Ducray, P.S.; Banken, L.; et al. Equivalent Pharmacokinetics of Mycophenolate Mofetil in African-American and Caucasian Male and Female Stable Renal Allograft Recipients. Am. J. Transplant. 2003, 3, 1581–1586. [Google Scholar] [CrossRef] [PubMed]
- Tornatore, K.M.; Meaney, C.J.; Wilding, G.E.; Chang, S.S.; Gundroo, A.; Cooper, L.M.; Gray, V.; Shin, K.; Fetterly, G.J.; Prey, J.; et al. Influence of sex and race on mycophenolic acid pharmacokinetics in stable African American and Caucasian renal transplant recipients. Clin. Pharmacokinet. 2015, 54, 423–434. [Google Scholar] [CrossRef] [PubMed] [Green Version]


| Parameter | Total | Group 1 | Group 2 | |
|---|---|---|---|---|
| Median (IQR) | Median (IQR) | Median (IQR) | p-Value | |
| Number of patients (N, %) | 21 (100%) | 12 (57.1%) | 9 (42.9%) | - |
| Males (N, %) | 14 (67%) | 10 (83%) | 4 (44%) | 0.09 a |
| Age (years) | 56.0 (42.0–62.9) | 58.3 (49.8–60.5) | 43.1 (41.0–65.6) | 0.57 |
| MMF dose (mg/day) | 1500 (1500–2000) | 1500 (1500–2000) | 1500 (1500–2000) | 1.00 |
| MMF dose (mg/kg/day) | 26.3 (20.5–29.7) | 24.7 (19.9–28.1) | 26.3 (20.8–29.7) | 0.72 |
| Post-transplant time (months) | 2.6 (1.9–6.1) | 2.8 (1.1–6.7) | 2.6 (2.3–5.6) | 0.67 |
| BMI (Kg/m2) | 22.7 (19.9–28.7) | 22.7 (19.9–29.2) | 22.7 (20.2–26.8) | 0.86 |
| RBCs (×106/μL) | 3.9 (3.6–4.2) | 4.0 (3.6–4.4) | 3.8 (3.5–4.0) | 0.23 |
| Hb (g/dL) | 11.6 (10.3–12.8) | 11.6 (10.5–12.5) | 11.6 (10.3–12.8) | 0.7 |
| WBCs (×103/μL) | 7.9 (6.2–9.2) | 8.0 (6.7–10.1) | 6.5 (5.2–8.5) | 0.21 |
| Neutro (×103/μL) | 5.3 (3.9–7.4) | 6.1 (4.4–7.7) | 4.3 (3.7–6.2) | 0.14 |
| Lymph (×103/μL) | 1.0 (0.6–1.5) | 0.9 (0.5–1.3) | 1.1 (0.9–1.5) | 0.41 |
| Mono (×103/μL) | 0.6 (0.5–0.8) | 0.6 (0.5–0.8) | 0.7 (0.6–0.7) | 0.43 |
| Eos (×103/μL) | 0.09 (0.02–0.12) | 0.09 (0.02–0.11) | 0.09 (0.03–0.12) | 0.86 |
| Bas (×103/μL) | 0.04 (0.01–0.06) | 0.05 (0.02–0.05) | 0.04 (0.01–0.07) | 0.91 |
| Plt (×103/μL) | 219.0 (195.0–299.0) | 206.0 (173.0–214.5) | 255.0 (221.0–311.0) | 0.04 * |
| ALT (IU/L) | 19.3 (17.0–30.0) | 21.5 (17.8–31.0) | 18.0 (17.0–19.3) | 0.31 |
| AST (IU/L) | 19.0 (14.6–30.0) | 19.5 (15.5–24.3) | 19.0 (14.6–20.0) | 0.52 |
| Albumin (mg/dL) | 42.4 (36.0–44.7) | 37.5 (34.9–43.9) | 44.4 (41.4–47.8) | 0.05 |
| Bilirubin (mg/dL) | 0.7 (0.4–1.1) | 1.0 (0.7–1.3) | 0.4 (0.4–0.6) | 0.01 * |
| CrCl (mL/min) b | 56.0 (48.0–80.0) | 60.5 (37.0–83.8) | 55.0 (52.0–68.0) | 0.83 |
| GFR (mL/min/1.73 m2) c | 60.0 (50.5–81.0) | 61.5 (38.3–88.5) | 60.0 (51.0–65.0) | 0.89 |
| Prednisone (mg/day) | 15.0 (7.5–20.0) | 12.5 (9.4–15.0) | 20.0 (7.5–25.0) | 0.26 |
| Prednisone (mg/kg/day) | 0.2 (0.1–0.3) | 0.2 (0.1–0.2) | 0.3 (0.1–0.4) | 0.14 |
| CsA dose (mg/day) | - | 200.0 (168.8–250.0) | - | - |
| CsA dose (mg/kg/day) | - | 2.9 (2.5–3.5) | - | - |
| CsA C0 (ng/mL) | - | 184.6 (171.7–209.4) | - | - |
| TAC dose (mg/day) | - | - | 4.0 (4.0–5.0) | - |
| TAC dose (mg/kg/day) | - | - | 0.1 (0.1–0.1) | - |
| TAC C0 (ng/mL) | - | - | 11.4 (9.9–12.0) |
| Parameter | Group 1 | Group 2 | ||||
|---|---|---|---|---|---|---|
| Median | IQR | Median | IQR | p-Value | Ratio | |
| MMF dose (mg/day) | 1500 | 1500–2000 | 1500 | 1500–2000 | 1 | 1 |
| MPA-C0 (μg/mL) | 1.20 | 0.66–1.75 | 2.83 | 2.08–5.83 | 0.0014 * | 2.35 |
| MPA dose-adjusted C0 (μg/mL/g) | 0.78 | 0.44–0.89 | 2.11 | 1.27–2.95 | 0.0014 * | 2.70 |
| MPA-Cmax (μg/mL) | 12.05 | 3.84–14.27 | 14.06 | 11.50–18.07 | 0.1769 | 1.16 |
| MPA dose-adjusted Cmax (μg/mL/g) | 5.55 | 3.15–9.40 | 9.52 | 5.58–14.41 | 0.1021 | 1.72 |
| Tmax (min) | 75 | 52.50–120.00 | 75 | 63.75–120.00 | 0.8806 | 1 |
| MPA Cl/F (L/h) | 24.63 | 18.85–32.12 | 12.28 | 10.18–18.34 | 0.0056 * | 0.50 |
| MPA-AUC0–12h (mg·h/L) | 36.05 | 22.95–47.85 | 67.60 | 52.75–80.30 | 0.0036 * | 1.88 |
| MPA dose-adjusted AUC0–12h (mg·h/L/g) | 20.40 | 15.57–26.58 | 40.73 | 27.50–50.63 | 0.0056 * | 2.00 |
| MPA-AUC0–2h (mg·h/L) | 13.80 | 3.67–19.55 | 16.31 | 14.97–29.23 | 0.1021 | 1.18 |
| MPA dose-adjusted AUC0–2h (mg·h/L/g) | 7.28 | 3.63–10.51 | 12.92 | 7.94–21.67 | 0.1021 | 1.77 |
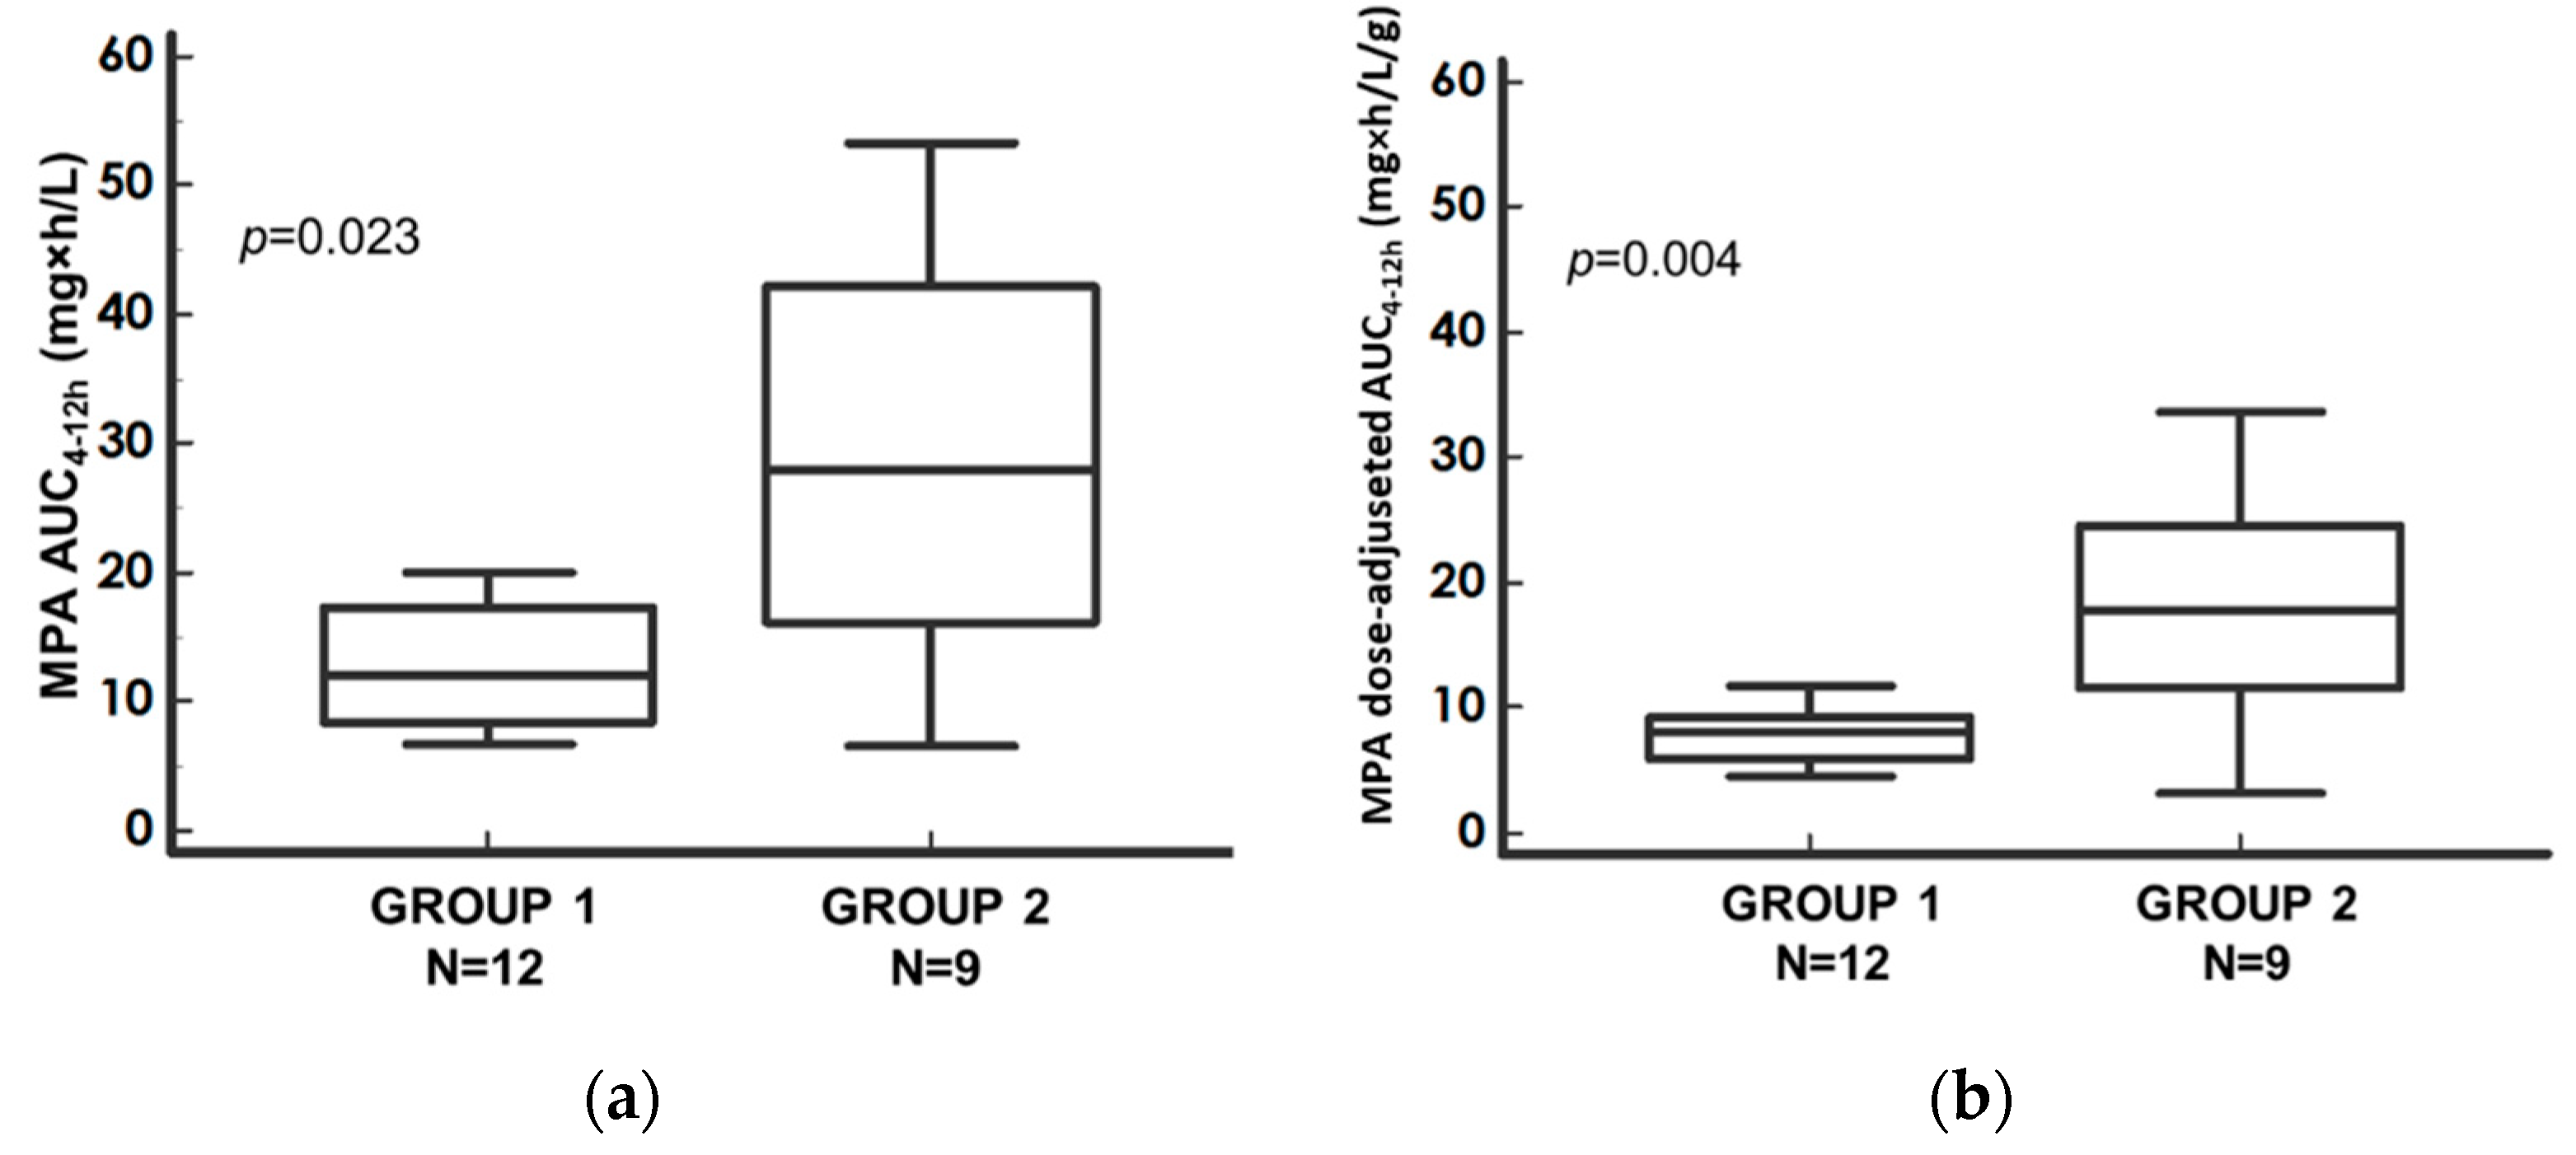
| MPA-AUC4–12h (mg·h/L) | 12.12 | 8.48–17.40 | 27.91 | 16.09–42.17 | 0.0230 * | 2.30 |
| MPA dose-adjusted AUC4–12h (mg·h/L/g) | 8.10 | 5.84–9.25 | 17.77 | 11.67–24.46 | 0.0036 * | 2.19 |
| CsA-Treated Patients N (%) | TAC-Treated Patients N (%) | Total N (%) | Fisher’s Exact Test p-Value | |
|---|---|---|---|---|
| ACR Patients | 7 (58.3) | 1 (11.1) | 8 (38.1) | 0.067 |
| NACR Patients | 5 (41.7) | 8 (88.9) | 13 (61.9) | |
| Total | 12 (100) | 9 (100) | 21 (100) |
| Parameter | N (%) |
|---|---|
| Patients reporting ACR ISHLT 1R (N, %) | 5 (62.5%) |
| Patients reporting ACR ISHLT 2R (N, %) | 2 (25.0%) |
| Patients reporting ACR ISHLT 3R (N, %) | 1 (12.5%) |
| Parameter | NACR Pts | ACR Pts | ||||
|---|---|---|---|---|---|---|
| Median | IQR | Median | IQR | p-Value | Ratio | |
| MMF dose (mg/day/kg) | 26.32 | 20.14–29.46 | 24.09 | 18.21–34.04 | 0.86 | 0.91 |
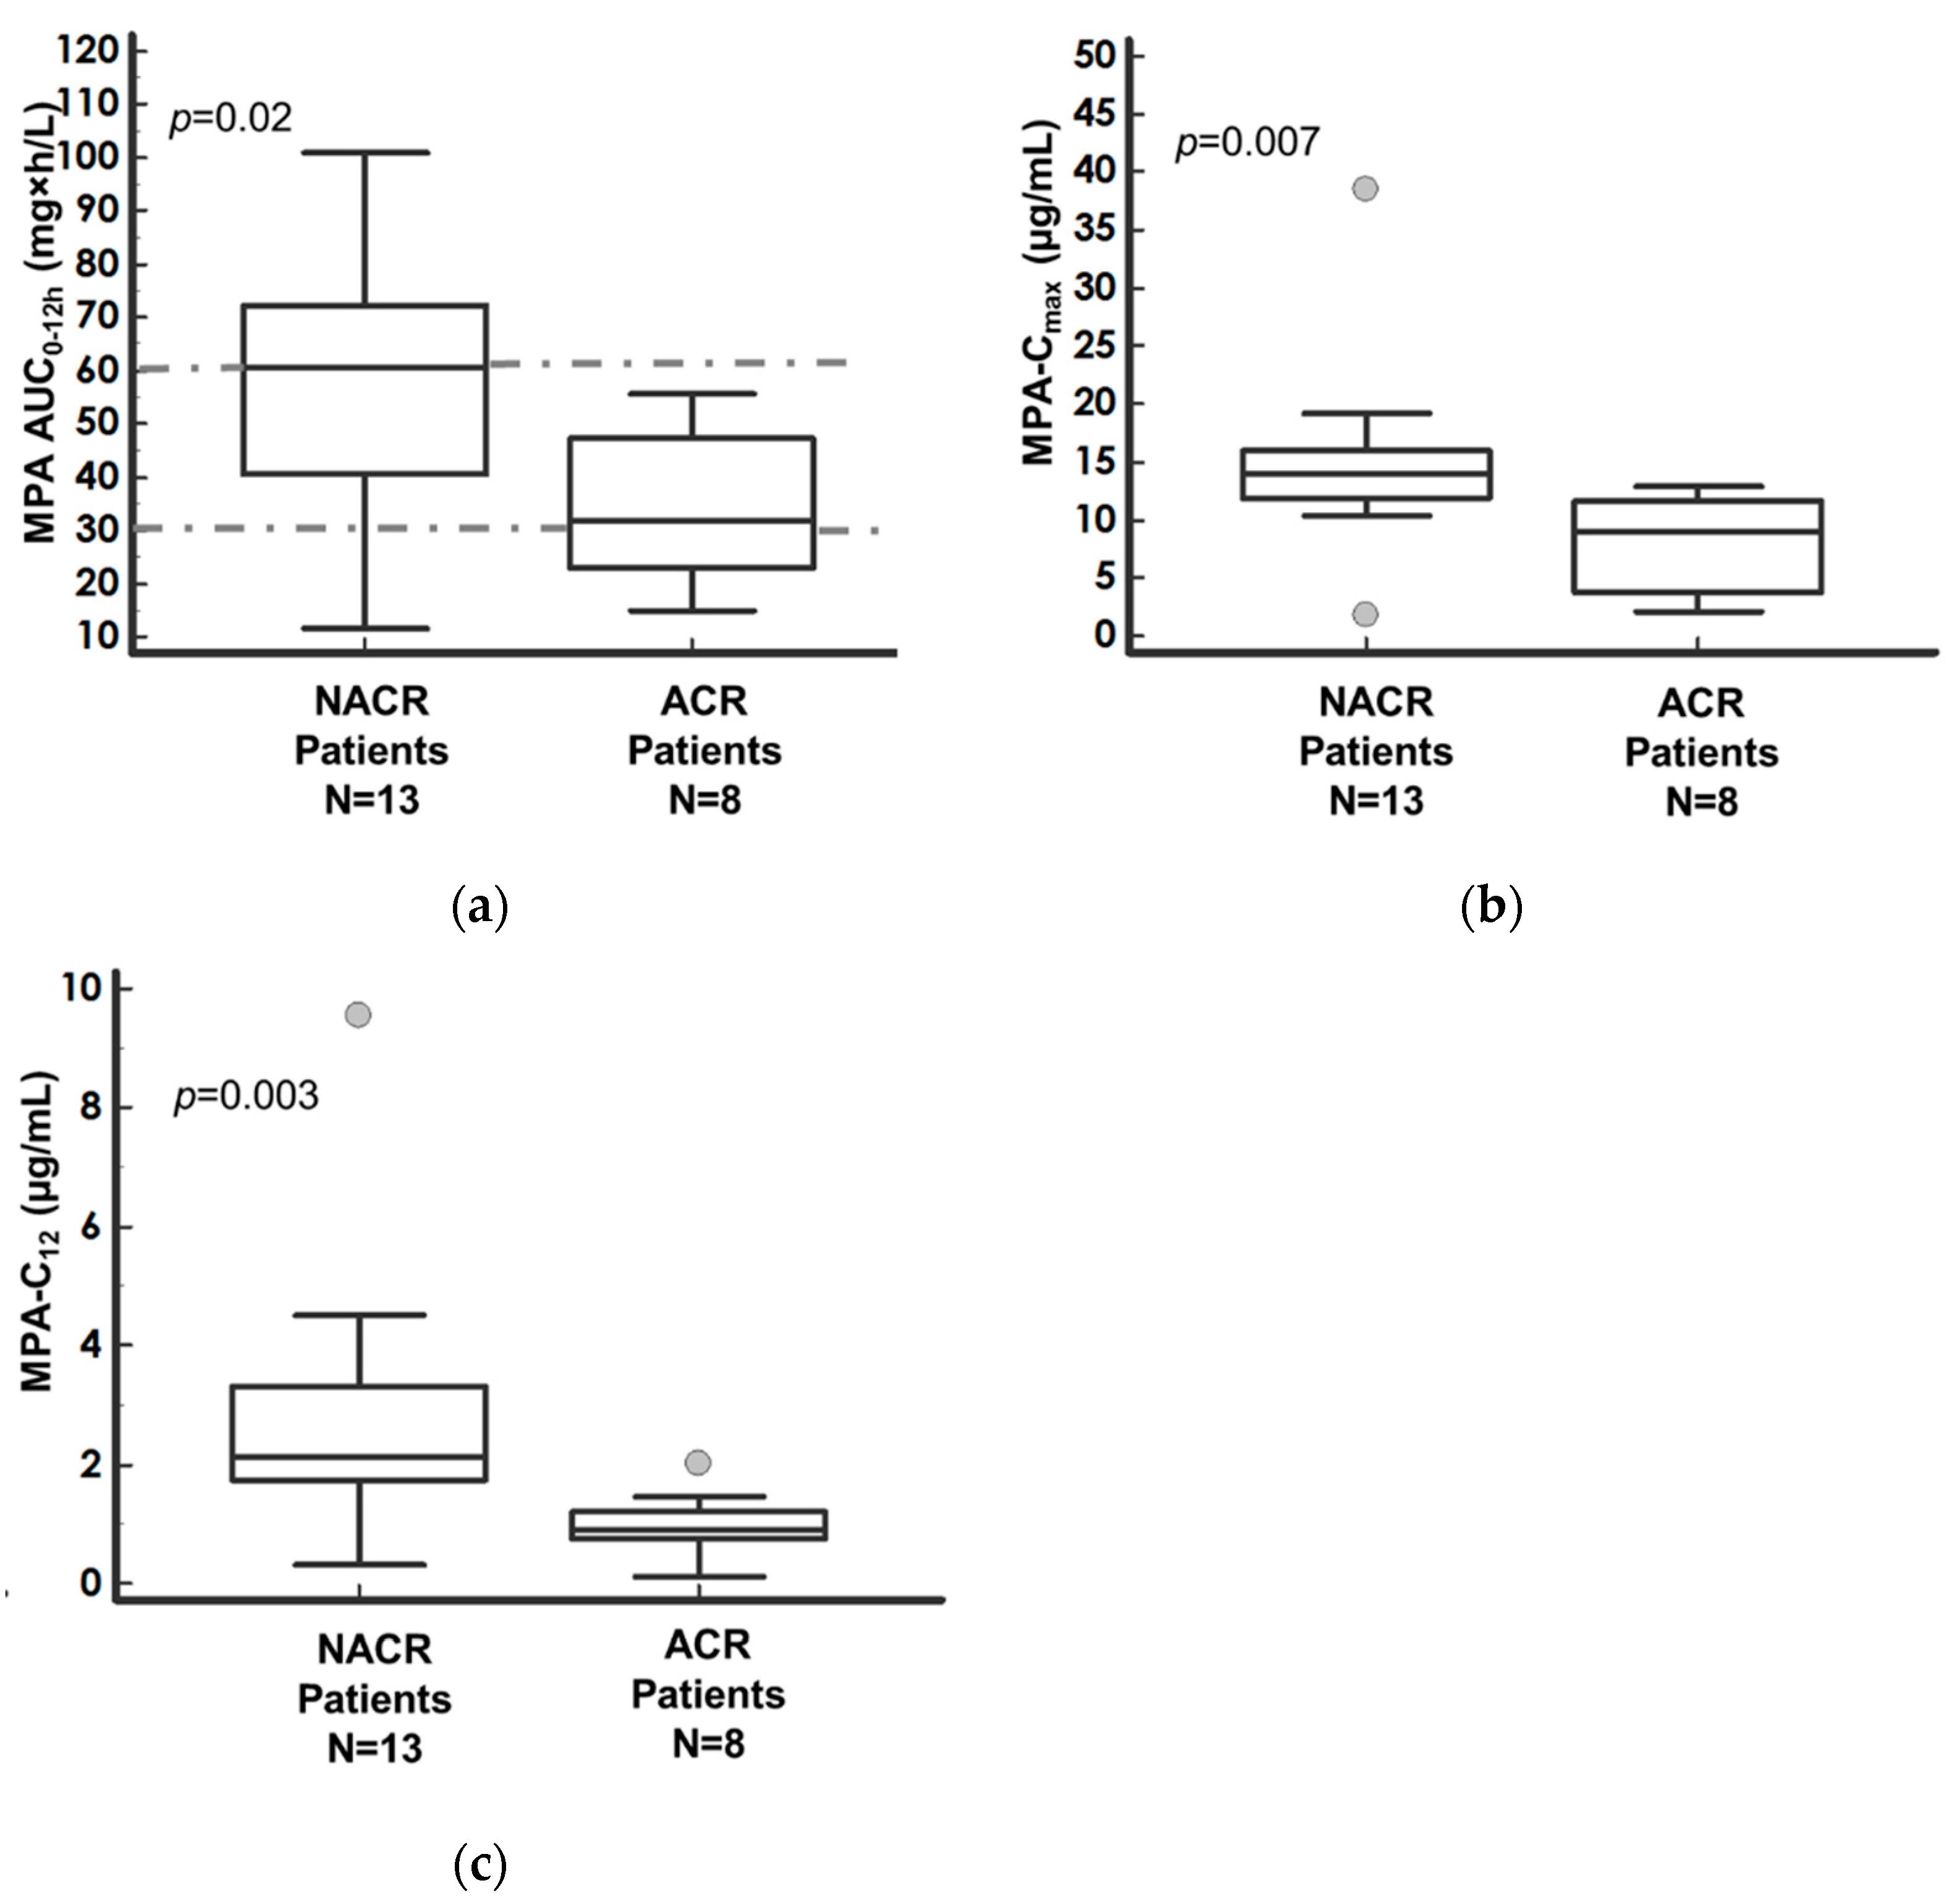
| MPA-AUC0–12h (mg·h/L) | 60.60 | 40.45–72.10 | 31.85 | 22.95–47.10 | 0.0248 * | 1.90 |
| MPA dose-adjusted AUC0–12h (mg·h/L/g) | 29.53 | 21.57–43.17 | 20.40 | 16.57–23.98 | 0.0298 * | 1.45 |
| MPA-C0 (µg/mL) | 2.11 | 1.62–2.95 | 1.35 | 0.70–2.10 | 0.3106 | 1.60 |
| MPA dose-adjusted C0 (µg/mL/g) | 1.10 | 0.73–2.13 | 0.84 | 0.60–1.14 | 0.4257 | 1.31 |
| MPA-Cmax (µg/mL) | 14.06 | 11.88–16.02 | 8.95 | 3.88–11.56 | 0.0074 * | 1.60 |
| MPA dose-adjusted Cmax (µg/mL/g) | 8.89 | 5.45–12.89 | 4.48 | 3.15–5.96 | 0.0357 * | 1.98 |
| MPA-C12 (µg/mL) | 2.14 | 1.74–3.29 | 0.91 | 0.77–1.21 | 0.0030 * | 2.36 |
| MPA dose-adjusted C12 (µg/mL/g) | 1.33 | 0.99–2.29 | 0.63 | 0.49–0.91 | 0.0059 * | 1.60 |
Publisher’s Note: MDPI stays neutral with regard to jurisdictional claims in published maps and institutional affiliations. |
© 2022 by the authors. Licensee MDPI, Basel, Switzerland. This article is an open access article distributed under the terms and conditions of the Creative Commons Attribution (CC BY) license (https://creativecommons.org/licenses/by/4.0/).
Share and Cite
Lo Re, F.; Angelini, J.; Sponga, S.; Nalli, C.; Zucchetto, A.; Biasizzo, J.; Livi, U.; Baraldo, M. Therapeutic Drug Monitoring of Mycophenolic Acid as a Precision Medicine Tool for Heart Transplant Patients: Results of an Observational Pharmacokinetic Pilot Study. Pharmaceutics 2022, 14, 1304. https://doi.org/10.3390/pharmaceutics14061304
Lo Re F, Angelini J, Sponga S, Nalli C, Zucchetto A, Biasizzo J, Livi U, Baraldo M. Therapeutic Drug Monitoring of Mycophenolic Acid as a Precision Medicine Tool for Heart Transplant Patients: Results of an Observational Pharmacokinetic Pilot Study. Pharmaceutics. 2022; 14(6):1304. https://doi.org/10.3390/pharmaceutics14061304
Chicago/Turabian StyleLo Re, Francesco, Jacopo Angelini, Sandro Sponga, Chiara Nalli, Antonella Zucchetto, Jessica Biasizzo, Ugolino Livi, and Massimo Baraldo. 2022. "Therapeutic Drug Monitoring of Mycophenolic Acid as a Precision Medicine Tool for Heart Transplant Patients: Results of an Observational Pharmacokinetic Pilot Study" Pharmaceutics 14, no. 6: 1304. https://doi.org/10.3390/pharmaceutics14061304