
Behavior of Regular Insulin in a Parenteral Nutrition Admixture: Validation of an LC/MS-MS Assay and the In Vitro Evaluation of Insulin Glycation

 , , , ,
Abstract
:
1. Introduction
2. Materials and Methods
2.1. Chemicals
2.2. In Vitro Glycation of R-Insulin
2.3. LC-MS/MS Apparatus and Method
2.4. Preparation of Calibration Standards (CSs) and Validation Standards (VSs)
2.4.1. Preparation of the Binary PN Admixture
2.4.2. Preparation of Standard Solutions
2.5. Validation of a Method for Assaying R-Insulin and Identifying Glycated R-Insulin Species
2.5.1. The R-Insulin Assay
2.5.2. Identification of Glycated R-Insulin Species
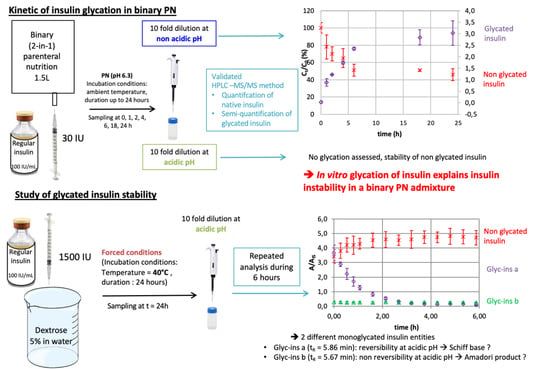
2.6. Study of the Time Course of R-Insulin Glycation in a Binary PN Admixture at Two pHs
2.7. Study of the Stability of Glycated Insulin
3. Results
3.1. Development of An LC-MS/MS Assay for the Quantification of R-Insulin and the Identification of Glycated R-Insulin Species
3.1.1. Optimization of the MS Detection Conditions
3.1.2. Optimization of the LC Assay
3.1.3. Optimization of the Diluent Composition for Standard and Sample Preparation
3.2. Validation of the LC-MS/MS Method for the Quantification of R-Insulin and the Semi-Quantification of Glycated R-Insulin
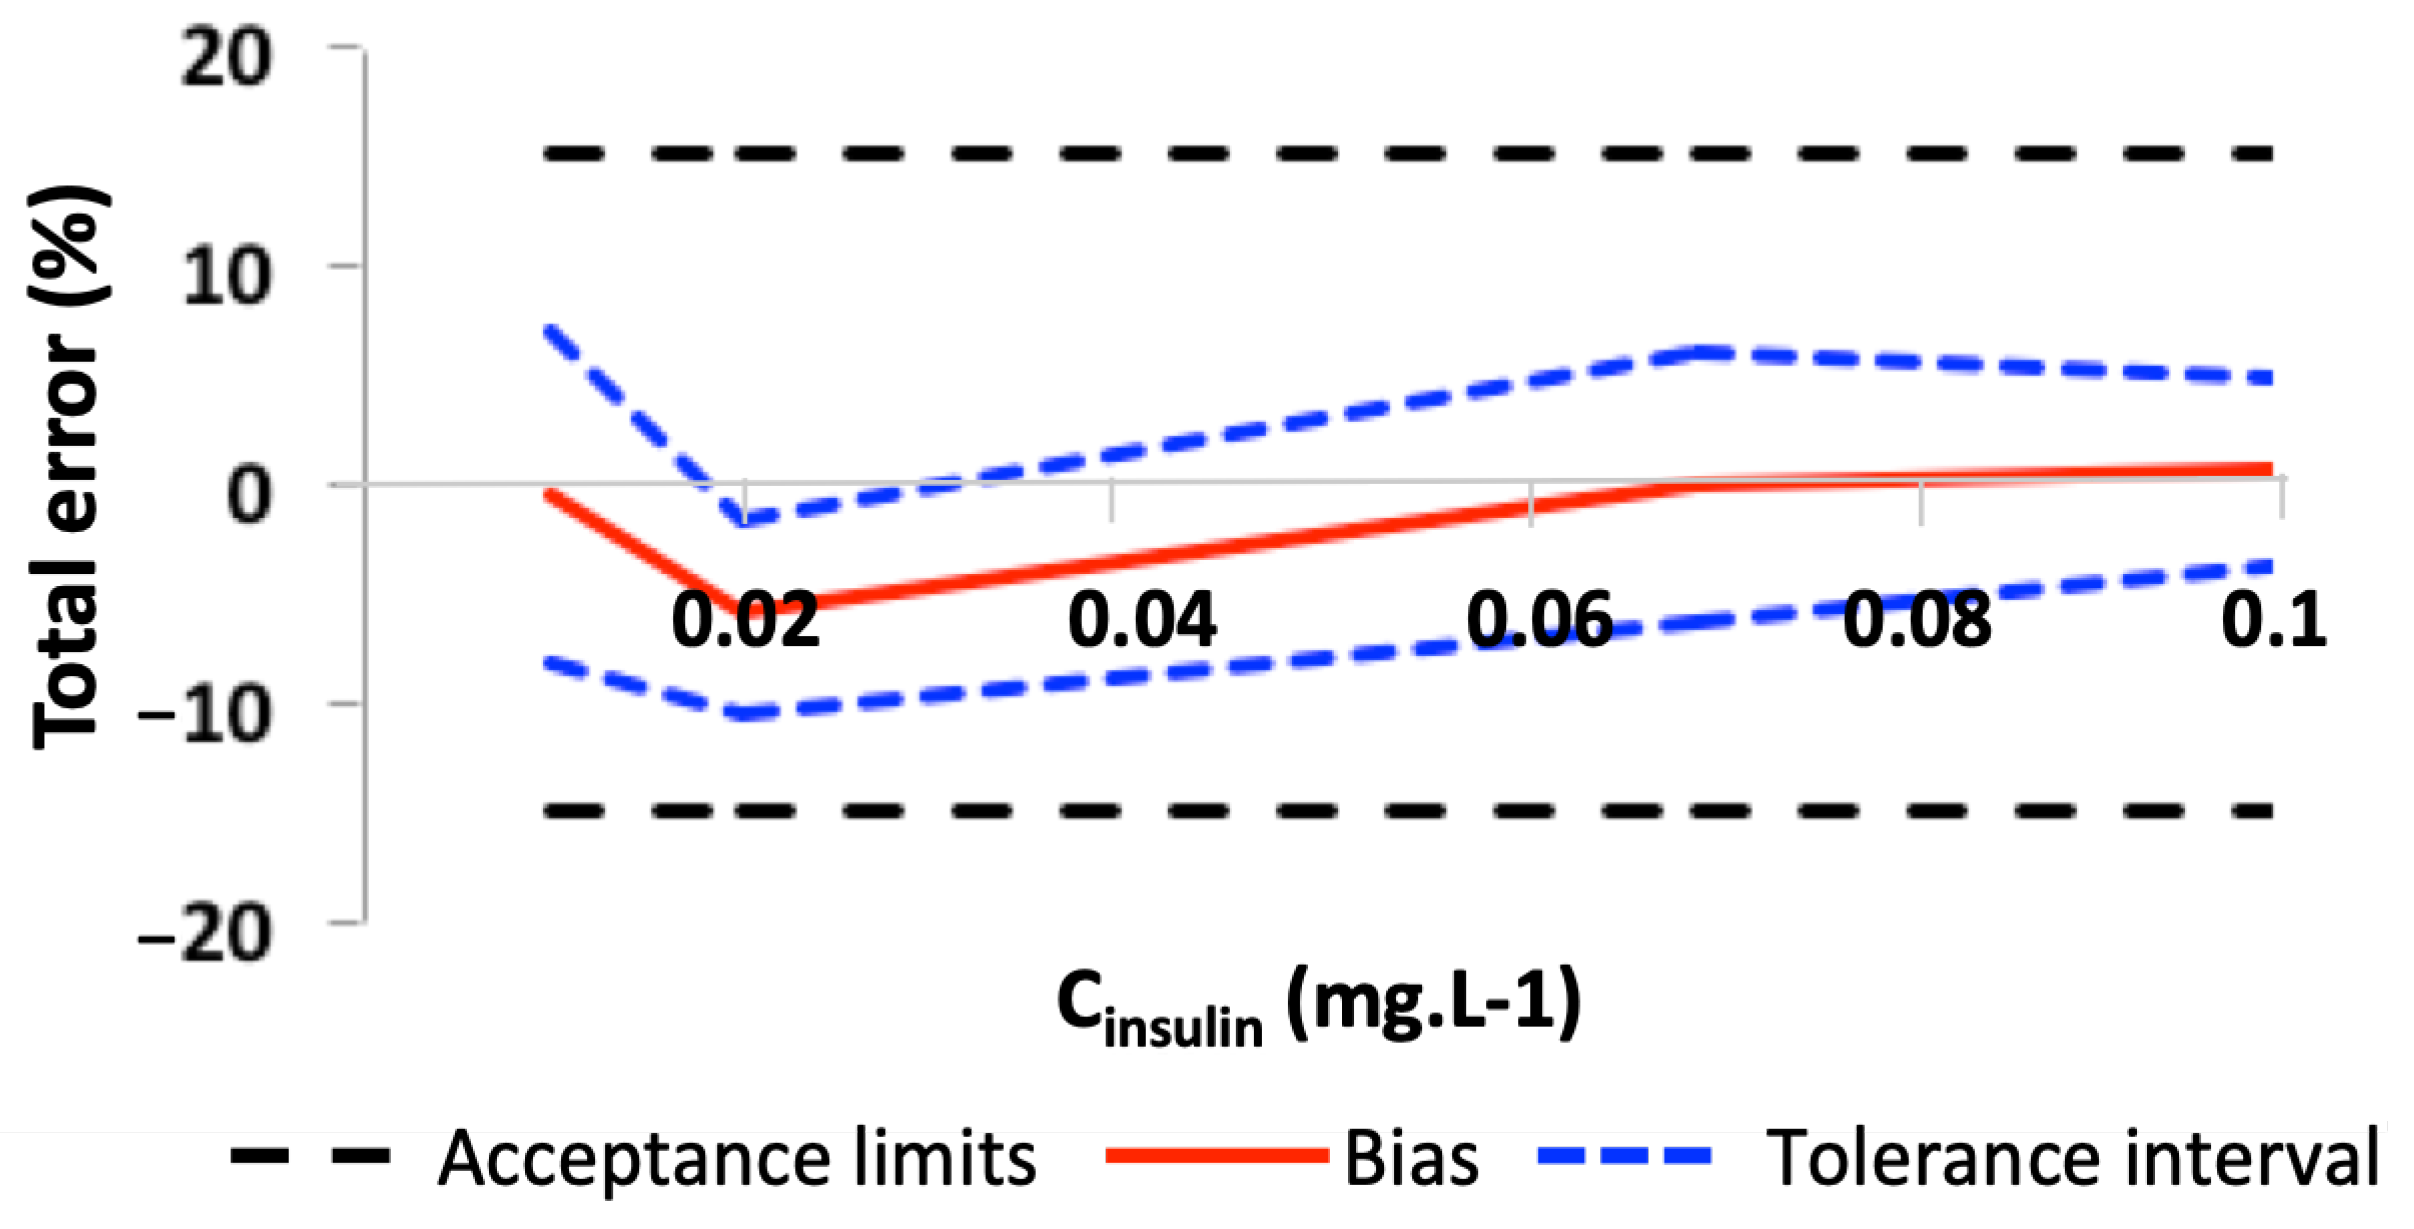
3.2.1. Quantification of R-Insulin
3.2.2. Detection of Glycated R-Insulin
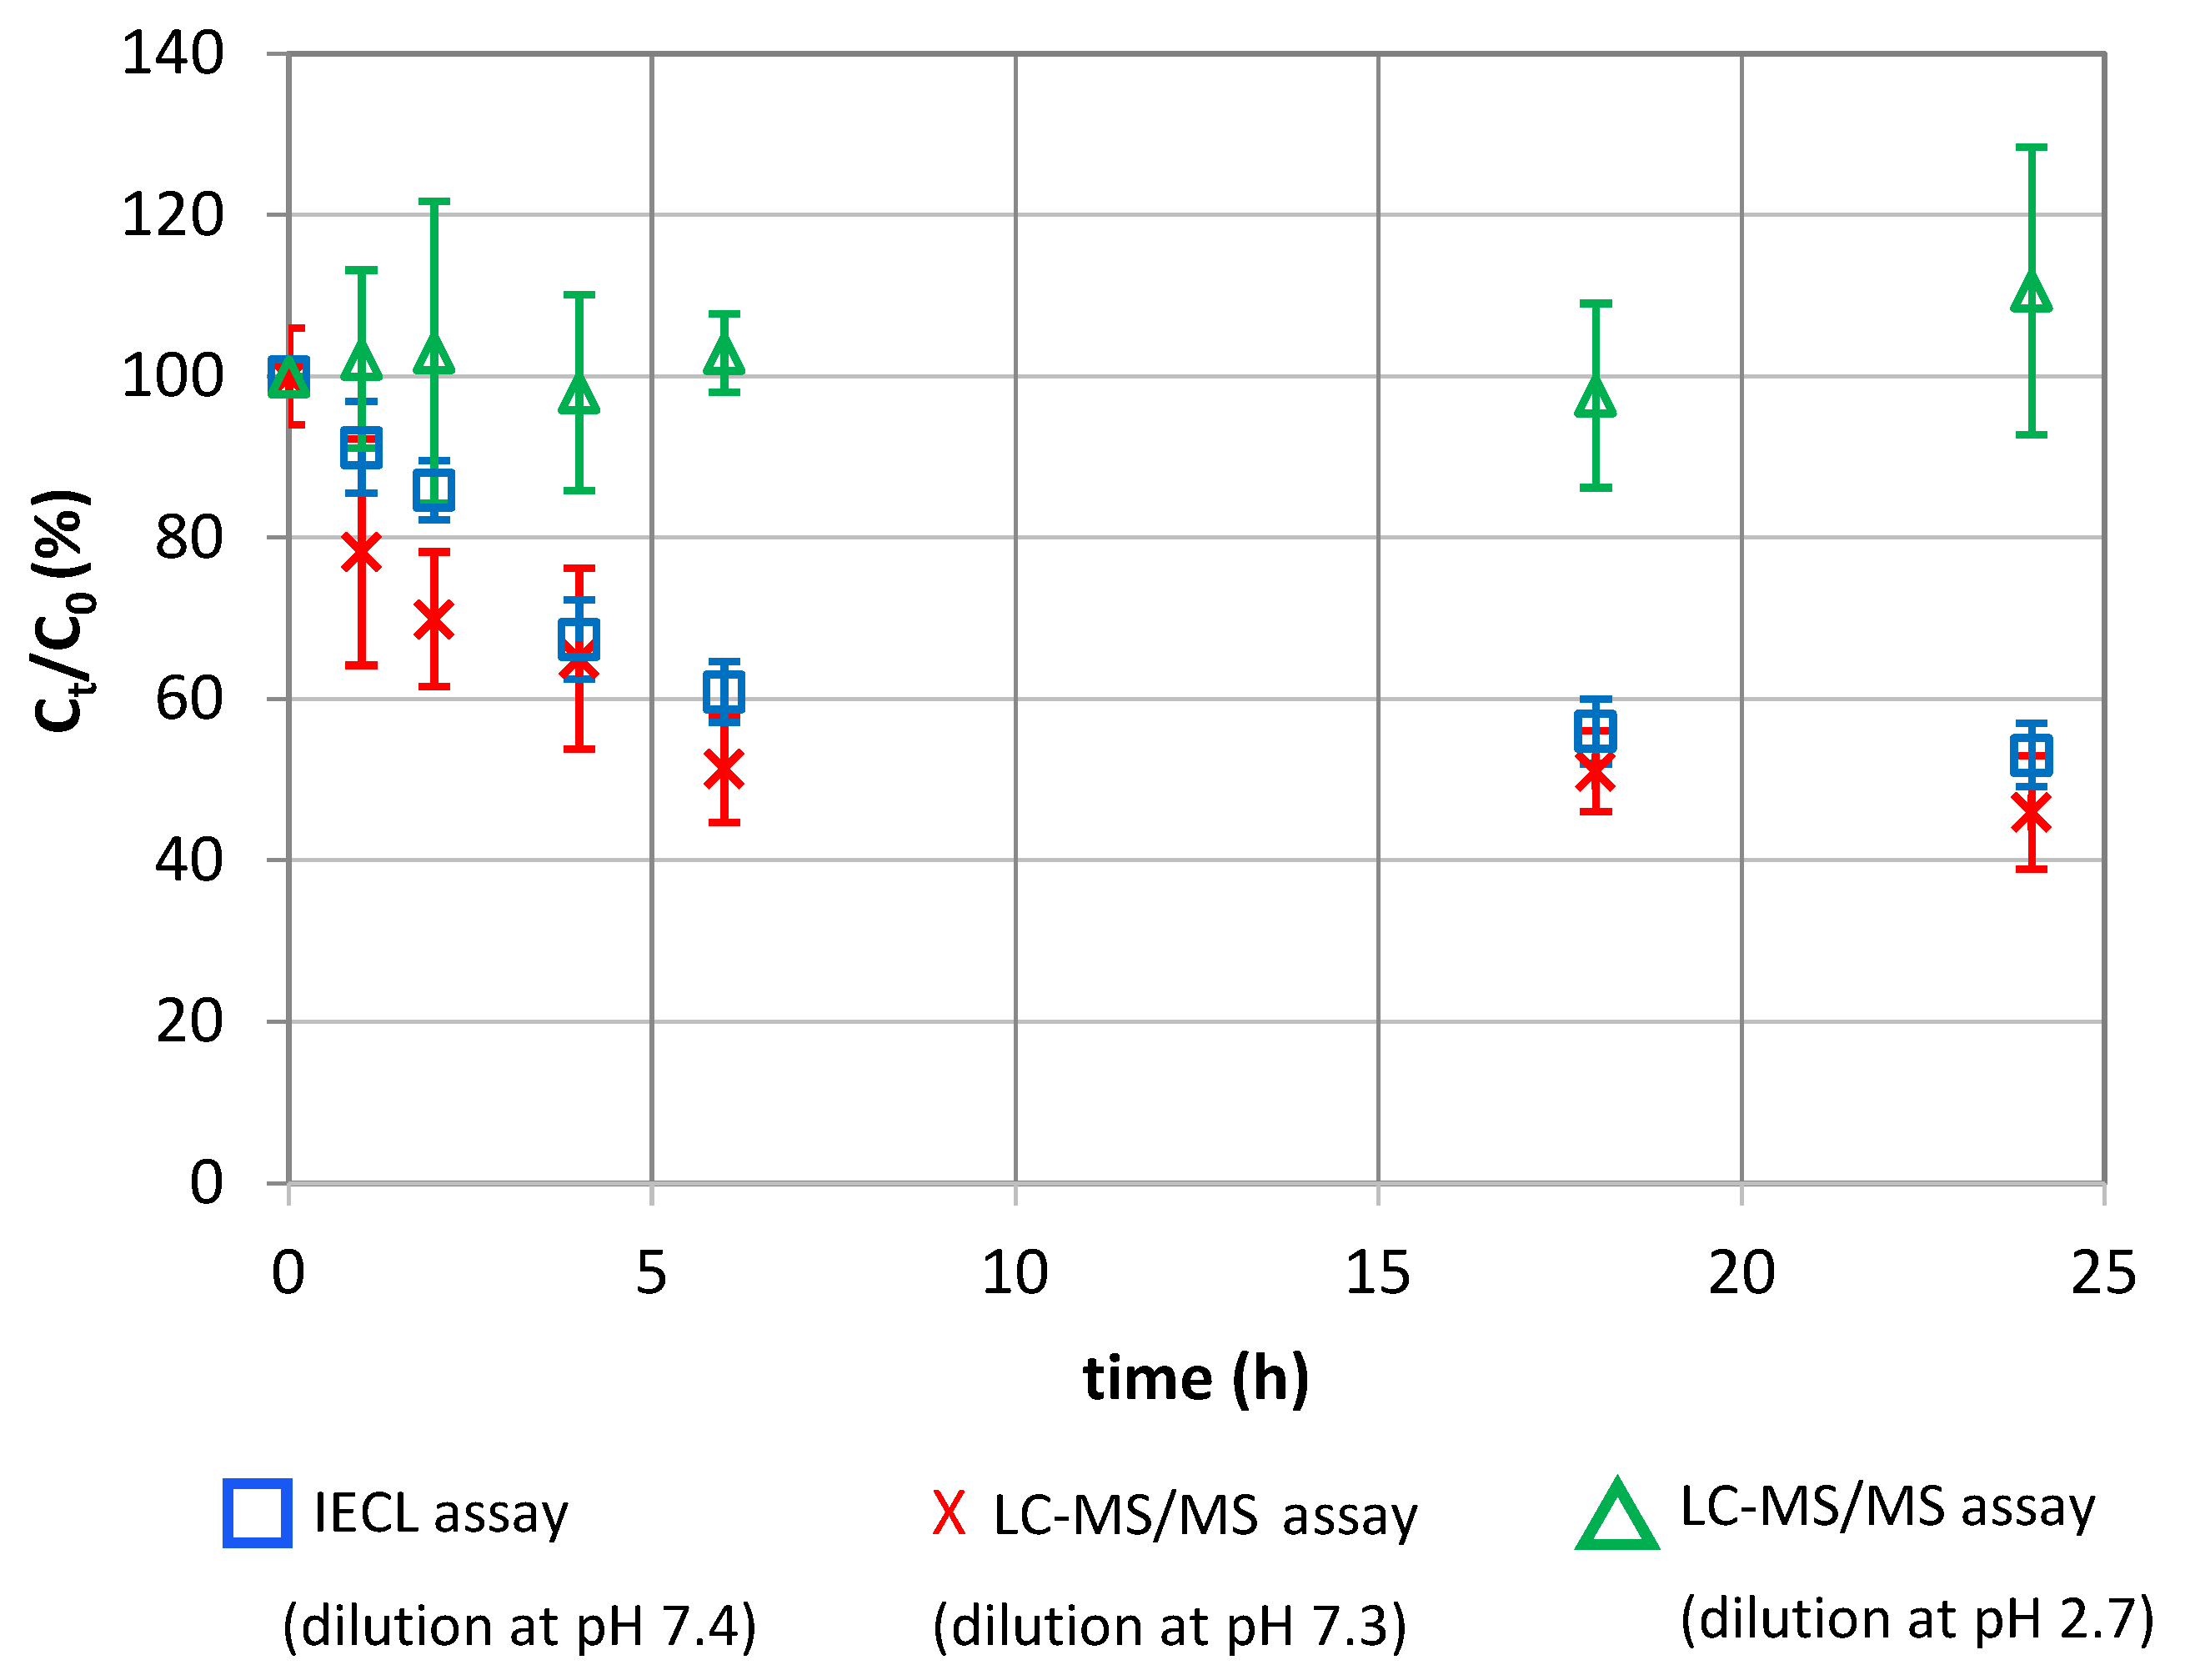
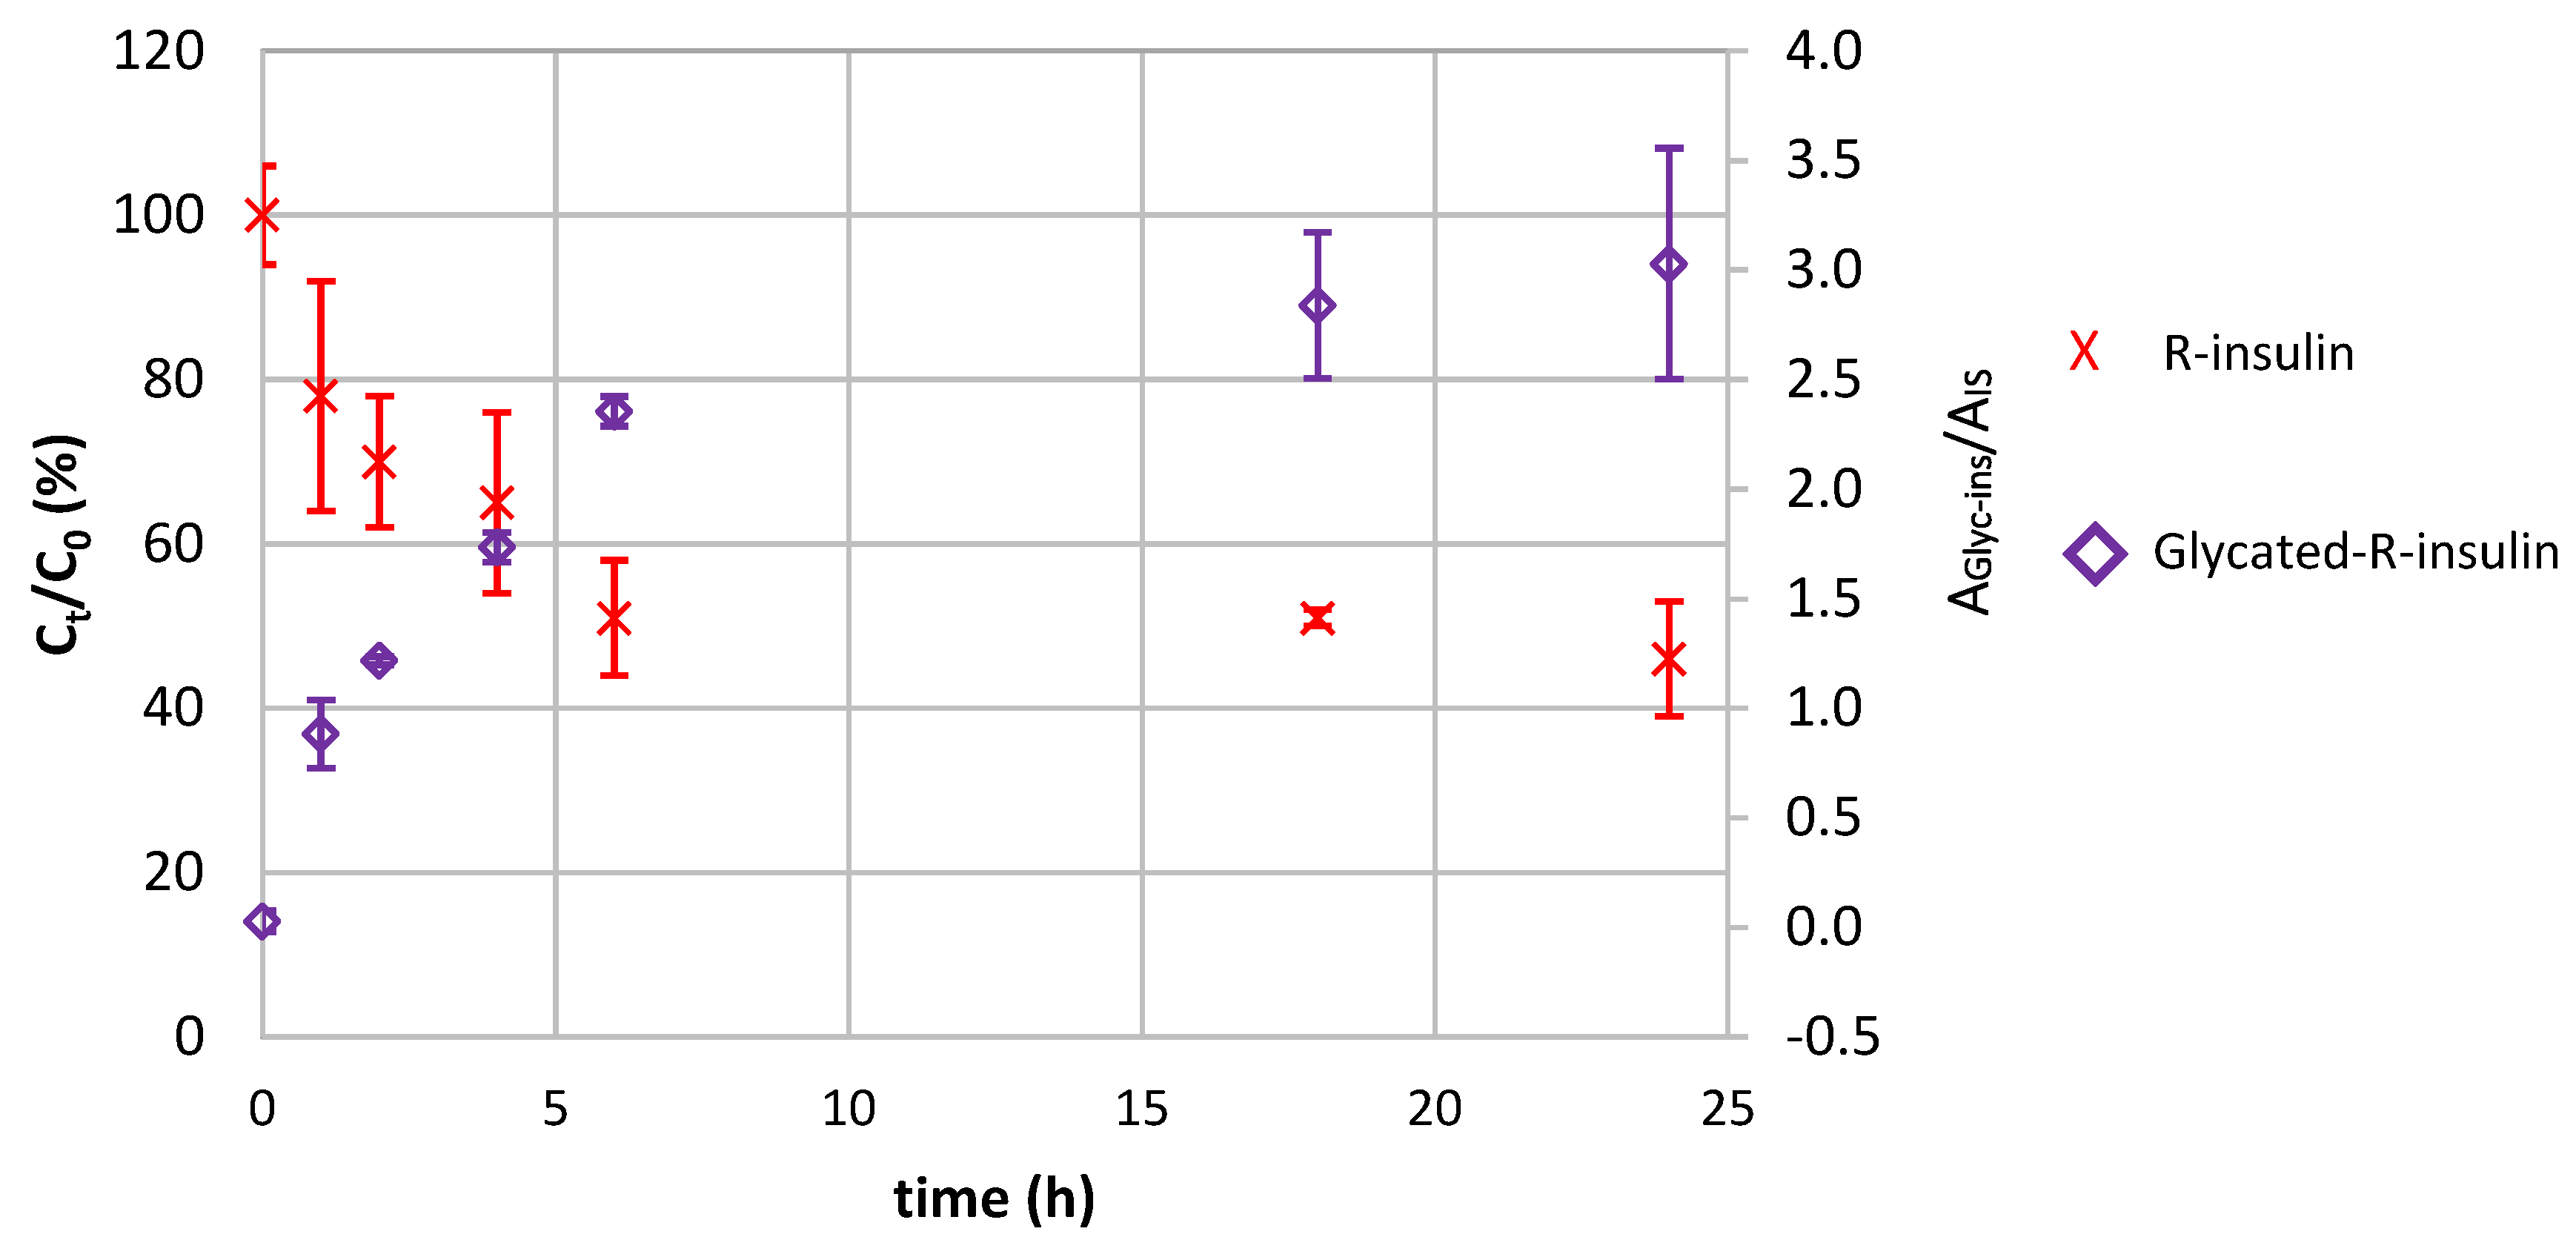
3.3. The Time Course of R-Insulin Glycation in A PN Admixture
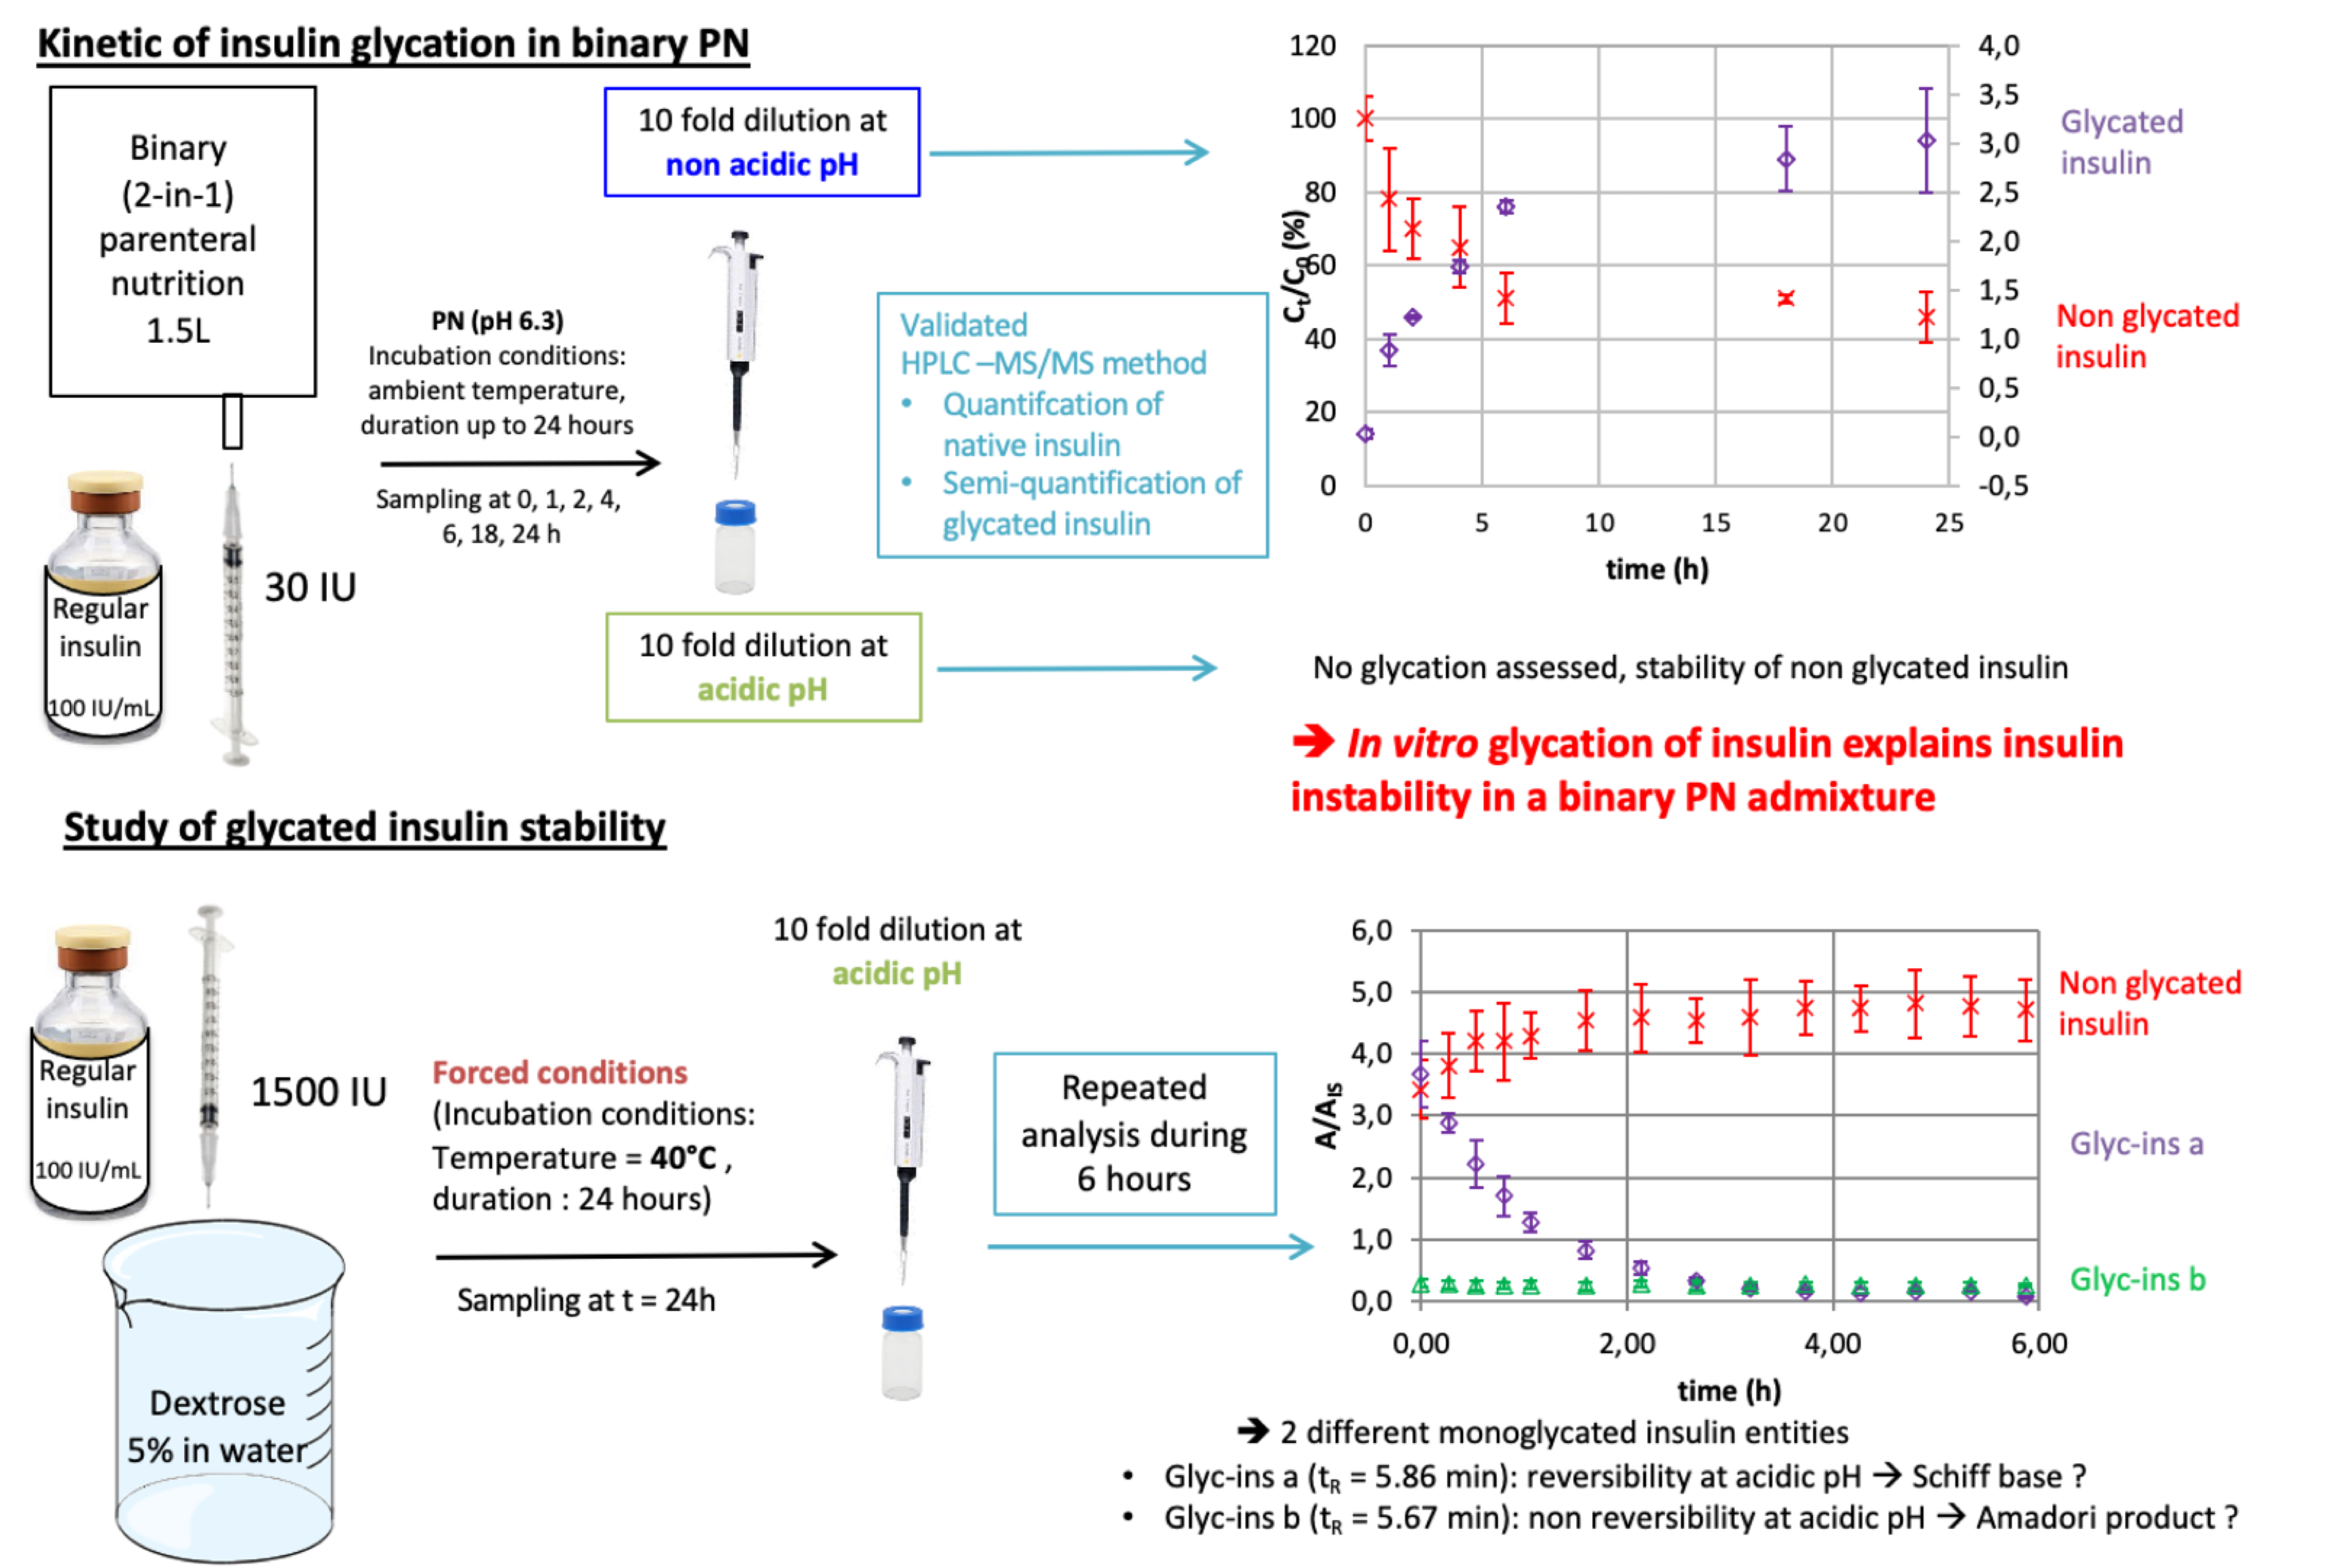
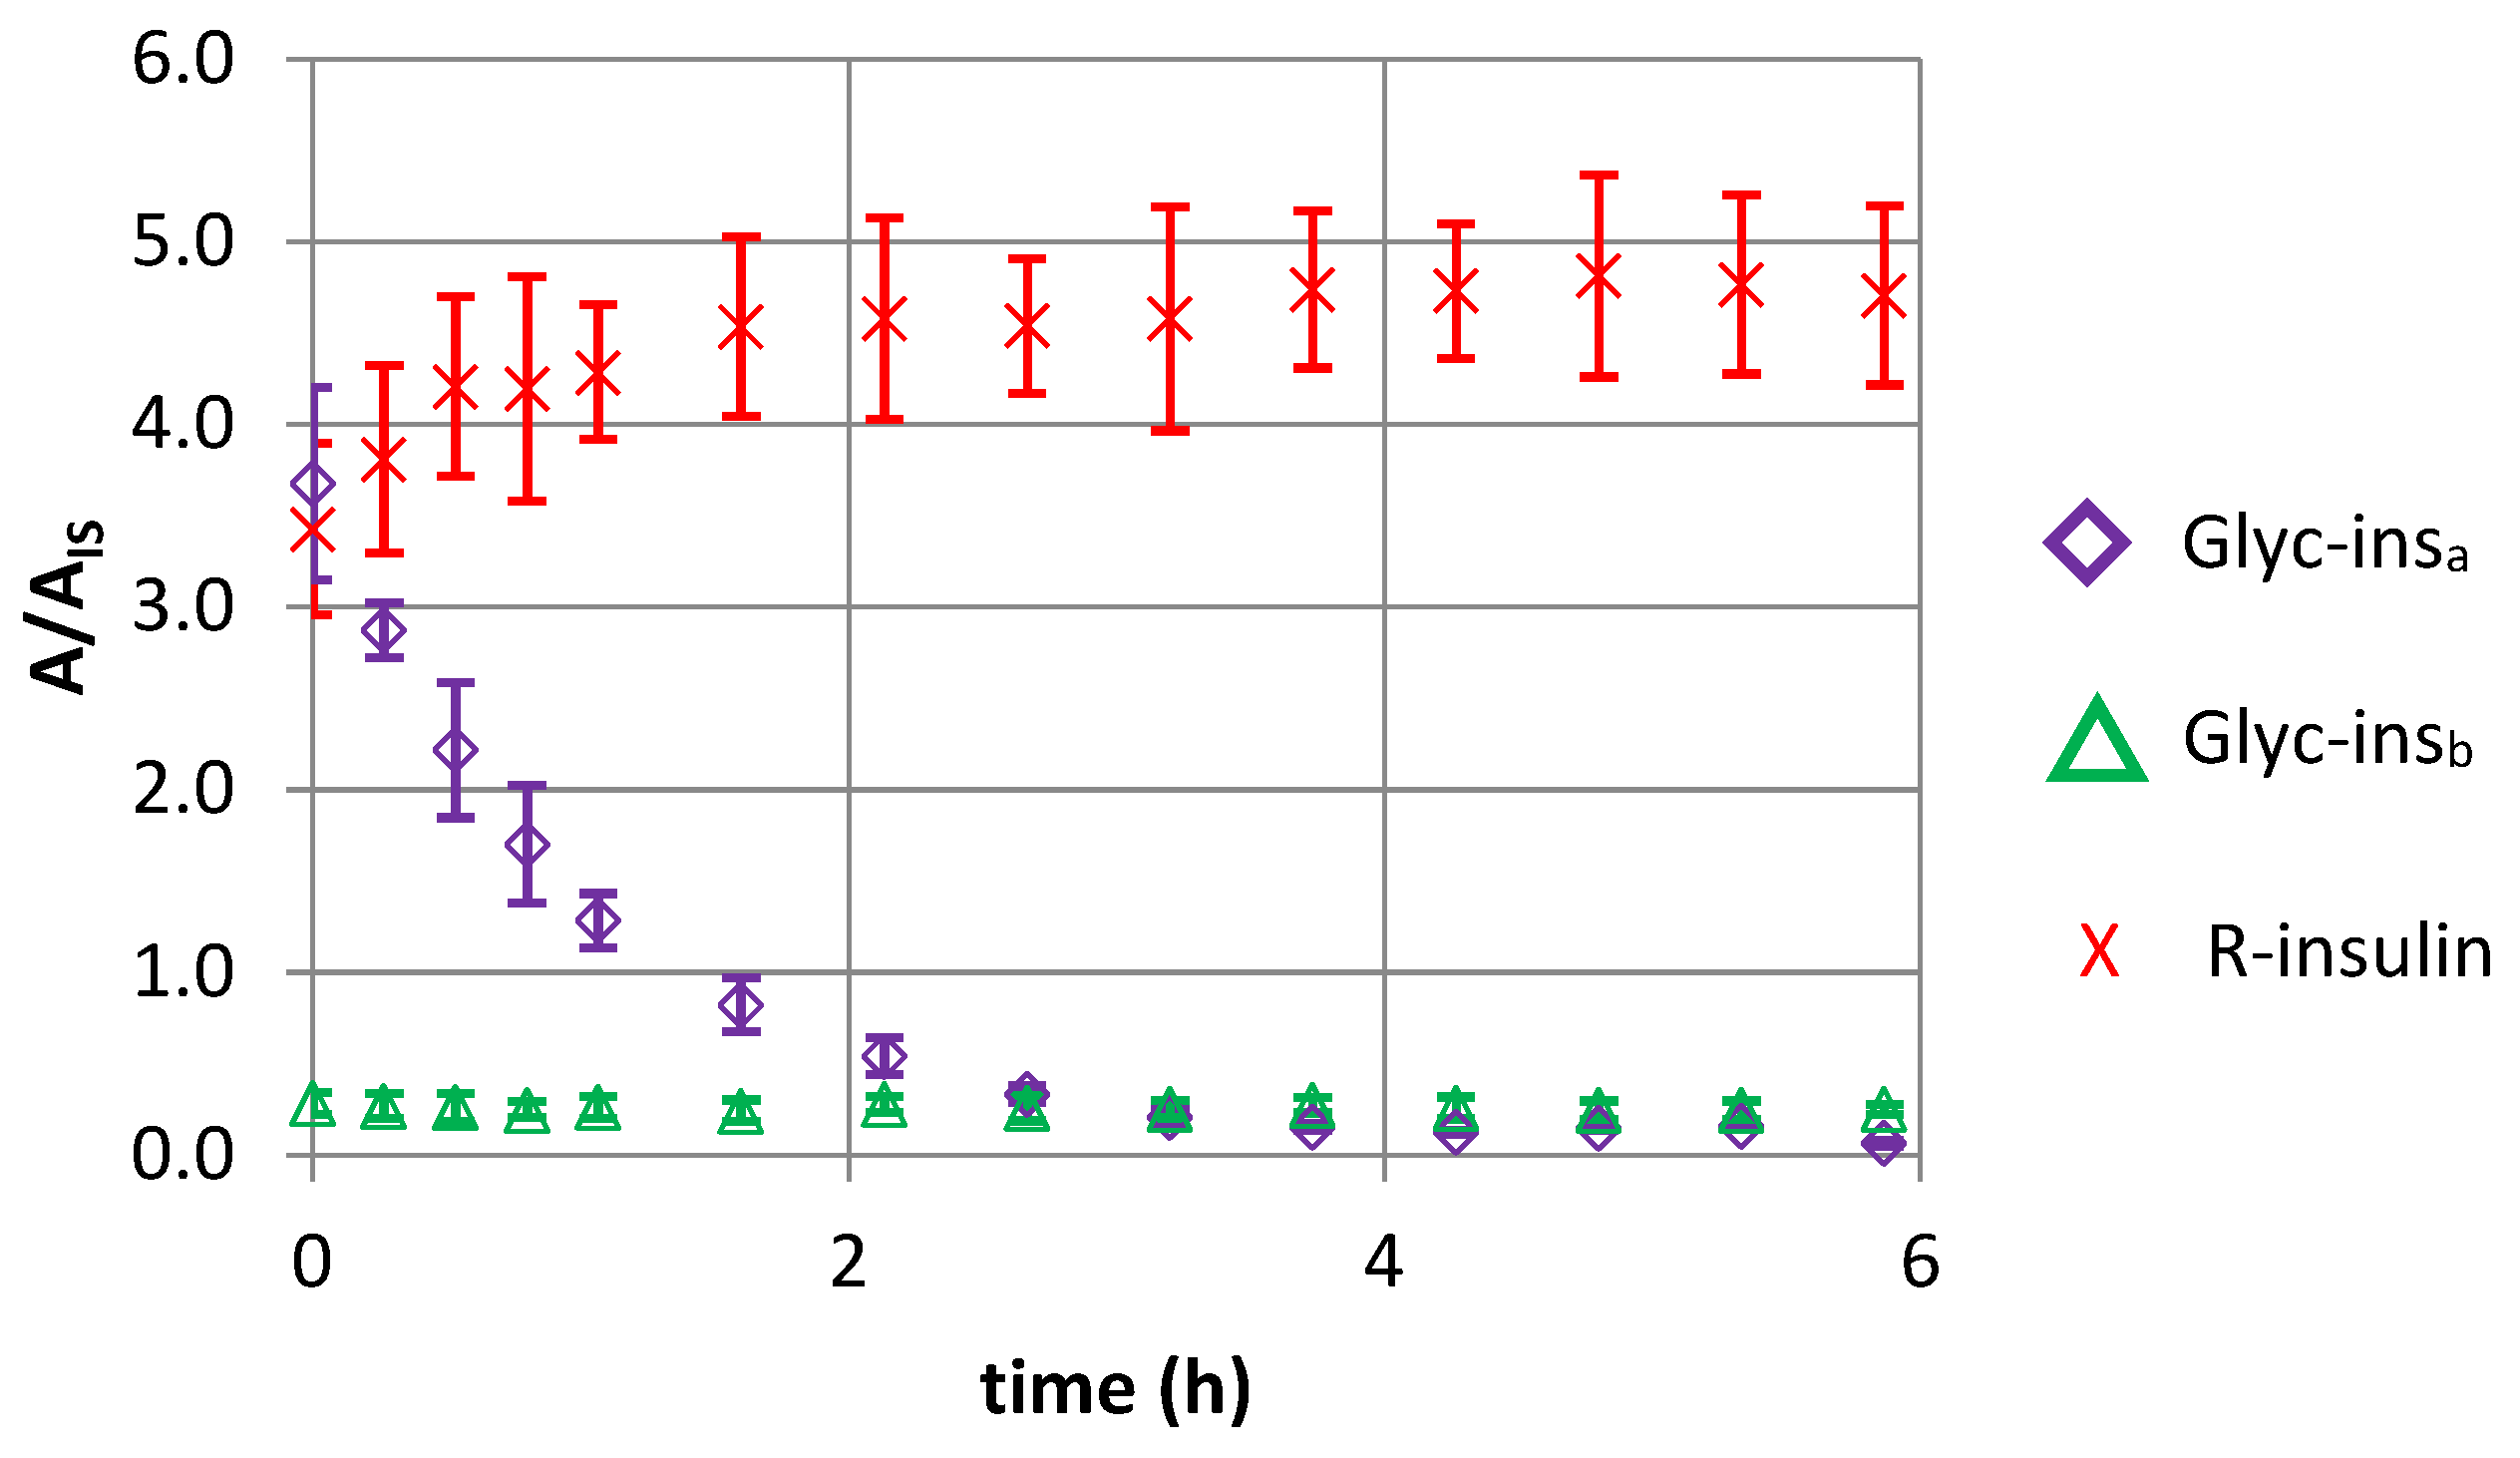
3.4. Study of the Stability of Glycated R-Insulin
4. Discussion
5. Conclusions
Supplementary Materials
Author Contributions
Funding
Acknowledgments
Conflicts of Interest
References
- Vennard, K.C.; Selen, D.J.; Gilbert, M.P. The Management of Hyperglycemia in Noncritically-Ill Hospitalized Patients Treated with Continuous Enteral or Parenteral Nutrition. Endocr. Pract. 2018, 24, 900–906. [Google Scholar] [CrossRef] [PubMed]
- Sarkisian, S.; Fenton, T.R.; Shaheen, A.A.; Raman, M. Parenteral Nutrition-Associated Hyperglycemia in Noncritically Ill Inpatients Is Associated with Higher Mortality. Can. J. Gastroenterol. 2010, 24, 453–457. [Google Scholar] [CrossRef] [PubMed]
- Pasquel, F.J.; Spiegelman, R.; McCauley, M.; Smiley, D.; Umpierrez, D.; Johnson, R.; Rhee, M.; Gatcliffe, C.; Lin, E.; Umpierrez, E.; et al. Hyperglycemia during Total Parenteral Nutrition: An Important Marker of Poor Outcome and Mortality in Hospitalized Patients. Diabetes Care 2010, 33, 739–741. [Google Scholar] [CrossRef] [PubMed] [Green Version]
- Roszali, M.A.; Zakaria, A.N.; Mohd Tahir, N.A. Parenteral Nutrition-Associated Hyperglycemia: Prevalence, Predictors and Management. Clin. Nutr. ESPEN 2021, 41, 275–280. [Google Scholar] [CrossRef]
- Schönenberger, K.A.; Reber, E.; Dürig, C.; Baumgartner, A.; Efthymiou, A.; Huwiler, V.V.; Laimer, M.; Bally, L.; Stanga, Z. Management of Hyperglycemia in Hospitalized Patients Receiving Parenteral Nutrition. Front. Clin. Diabetes Healthc. 2022, 3, 829412. [Google Scholar] [CrossRef]
- Fatati, G.; Grandone, I.; Palazzi, M.; Weber, P.; Mirri, E. Use of Neutral Protamine Lispro Insulin (NPL) in Patients with Hyperglycemia Receiving Parenteral Nutrition. Clin. Ter. 2014, 165, e17–e23. [Google Scholar]
- Kinnare, K.F.; Bacon, C.A.; Chen, Y.; Sowa, D.C.; Peterson, S.J. Risk Factors for Predicting Hypoglycemia in Patients Receiving Concomitant Parenteral Nutrition and Insulin Therapy. J. Acad. Nutr. Diet. 2013, 113, 263–268. [Google Scholar] [CrossRef]
- Neff, K.; Donegan, D.; MacMahon, J.; O’Hanlon, C.; Keane, N.; Agha, A.; Thompson, C.; Smith, D. Management of Parenteral Nutrition Associated Hyperglycaemia: A Comparison of Subcutaneous and Intravenous Insulin Regimen. Ir. Med. J. 2014, 107, 141–143. [Google Scholar]
- Ramos, A.; Rabasa, F.; Mendoza, L.; Cardenete, J.; Gill, P.; Morilla, A.; Cardona, D.; Pérez, A. Differences in Glycemic Control in Diabetic and Non-Diabetic Patients with Parenteral Nutrition Using a Basal plus Correction Insulin Regimen: An Observational, Retrospective Study. Diabetes Ther. 2018, 9, 1359–1367. [Google Scholar] [CrossRef]
- Hakeam, H.A.; Mulia, H.A.; Azzam, A.; Amin, T. Glargine Insulin Use Versus Continuous Regular Insulin in Diabetic Surgical Noncritically Ill Patients Receiving Parenteral Nutrition: Randomized Controlled Study. JPEN J. Parenter. Enter. Nutr. 2017, 41, 1110–1118. [Google Scholar] [CrossRef]
- Truong, S.; Park, A.; Kamalay, S.; Hung, N.; Meyer, J.G.; Nguyen, N.; Momenzadeh, A. Glycemic Control in Adult Surgical Patients Receiving Regular Insulin Added to Parenteral Nutrition vs. Insulin Glargine: A Retrospective Chart Review. Nutr. Clin. Pract. 2019, 34, 775–782. [Google Scholar] [CrossRef] [PubMed]
- Gosmanov, A.R.; Umpierrez, G.E. Management of Hyperglycemia during Enteral and Parenteral Nutrition Therapy. Curr. Diab. Rep. 2013, 13, 155–162. [Google Scholar] [CrossRef] [PubMed] [Green Version]
- Olveira, G.; Tapia, M.J.; Ocón, J.; Cabrejas-Gómez, C.; Ballesteros-Pomar, M.D.; Vidal-Casariego, A.; Arraiza-Irigoyen, C.; Olivares, J.; Conde-García, M.C.; García-Manzanares, Á.; et al. Hypoglycemia in Noncritically Ill Patients Receiving Total Parenteral Nutrition: A Multicenter Study. (Study Group on the Problem of Hyperglycemia in Parenteral Nutrition; Nutrition Area of the Spanish Society of Endocrinology and Nutrition). Nutrition 2015, 31, 58–63. [Google Scholar] [CrossRef]
- Olveira, G.; Tapia, M.J.; Ocón, J.; Cabrejas-Gómez, C.; Ballesteros-Pomar, M.D.; Vidal-Casariego, A.; Arraiza-Irigoyen, C.; Olivares, J.; Conde-García, M.D.C.; García-Manzanares, A.; et al. Parenteral Nutrition-Associated Hyperglycemia in Non-Critically Ill Inpatients Increases the Risk of in-Hospital Mortality (Multicenter Study). Diabetes Care 2013, 36, 1061–1066. [Google Scholar] [CrossRef] [PubMed] [Green Version]
- McMahon, M.M. Management of Parenteral Nutrition in Acutely Ill Patients with Hyperglycemia. Nutr. Clin. Pract. 2004, 19, 120–128. [Google Scholar] [CrossRef]
- Roehl, K.A.; Lach, K.; Coltman, A.E.; Bacon, C.A.; Singh, S.; Peterson, S.J.; Sowa, D.C. Predictors of Insulin Requirements among Hospitalized Adults Receiving Parenteral Nutrition. JPEN J. Parenter. Enter. Nutr. 2013, 37, 755–762. [Google Scholar] [CrossRef]
- Olveira, G.; Abuín, J.; López, R.; Herranz, S.; García-Almeida, J.M.; García-Malpartida, K.; Ferrer, M.; Cancer, E.; Luengo-Pérez, L.M.; Álvarez, J.; et al. Regular Insulin Added to Total Parenteral Nutrition vs Subcutaneous Glargine in Non-Critically Ill Diabetic Inpatients, a Multicenter Randomized Clinical Trial: INSUPAR Trial. Clin. Nutr. 2020, 39, 388–394. [Google Scholar] [CrossRef] [Green Version]
- Oghazian, M.B.; Javadi, M.R.; Radfar, M.; Torkamandi, H.; Sadeghi, M.; Hayatshahi, A.; Gholami, K. Effectiveness of Regular versus Glargine Insulin in Stable Critical Care Patients Receiving Parenteral Nutrition: A Randomized Controlled Trial. Pharmacotherapy 2015, 35, 148–157. [Google Scholar] [CrossRef]
- McCulloch, A.; Bansiya, V.; Woodward, J.M. Addition of Insulin to Parenteral Nutrition for Control of Hyperglycemia. JPEN J. Parenter. Enter. Nutr. 2018, 42, 846–854. [Google Scholar] [CrossRef]
- Andersen, S.; Andersen, A.; Ringholm, L.; Hansen, C.P.; Storkholm, J.; Lillpers, K.; Schiøtz, C.; Mathiesen, E.R. Parenteral Nutrition and Insulin per Protocol Improve Diabetes Management after Total Pancreatectomy. Dan. Med. J. 2018, 65, A5475. [Google Scholar]
- Boullata, J.I.; Gilbert, K.; Sacks, G.; Labossiere, R.J.; Crill, C.; Goday, P.; Kumpf, V.J.; Mattox, T.W.; Plogsted, S.; Holcombe, B.; et al. A.S.P.E.N. Clinical Guidelines: Parenteral Nutrition Ordering, Order Review, Compounding, Labeling, and Dispensing. JPEN J. Parenter. Enter. Nutr. 2014, 38, 334–377. [Google Scholar] [CrossRef] [PubMed] [Green Version]
- Mirtallo, J.; Canada, T.; Johnson, D.; Kumpf, V.; Petersen, C.; Sacks, G.; Seres, D.; Guenter, P. Task Force for the Revision of Safe Practices for Parenteral Nutrition Safe Practices for Parenteral Nutrition. JPEN J. Parenter. Enter. Nutr. 2004, 28, S39–S70. [Google Scholar] [CrossRef]
- Cardona, D.; Nadal, M.; Estelrich, J.; Mangues, M.A. Review of Drug Stability in Parenteral Nutrition Admixtures. e-SPEN J. 2013, 8, e135–e140. [Google Scholar] [CrossRef]
- Henry, H.; Lannoy, D.; Maboudou, P.; Seguy, D.; Dine, T.; Pigny, P.; Odou, P. Addition of Regular Insulin to Ternary Parenteral Nutrition: A Stability Study. Pharmaceutics 2021, 13, 458. [Google Scholar] [CrossRef] [PubMed]
- Abdel-Wahab, Y.H.; O’Harte, F.P.; Boyd, A.C.; Barnett, C.R.; Flatt, P.R. Glycation of Insulin Results in Reduced Biological Activity in Mice. Acta Diabetol. 1997, 34, 265–270. [Google Scholar] [CrossRef]
- Fry, L.K.; Stegink, L.D. Formation of Maillard Reaction Products in Parenteral Alimentation Solutions. J. Nutr. 1982, 112, 1631–1637. [Google Scholar] [CrossRef]
- Higgins, P.J.; Bunn, H.F. Kinetic Analysis of the Nonenzymatic Glycosylation of Hemoglobin. J. Biol. Chem. 1981, 256, 5204–5208. [Google Scholar] [CrossRef]
- Tessier, F.J. The Maillard Reaction in the Human Body. The Main Discoveries and Factors That Affect Glycation. Pathol. Biol. 2010, 58, 214–219. [Google Scholar] [CrossRef]
- Sirangelo, I.; Iannuzzi, C. Understanding the Role of Protein Glycation in the Amyloid Aggregation Process. Int. J. Mol. Sci. 2021, 22, 6609. [Google Scholar] [CrossRef]
- Abdel-Wahab, Y.H.; O’Harte, F.P.; Ratcliff, H.; McClenaghan, N.H.; Barnett, C.R.; Flatt, P.R. Glycation of Insulin in the Islets of Langerhans of Normal and Diabetic Animals. Diabetes 1996, 45, 1489–1496. [Google Scholar] [CrossRef]
- Sirangelo, I.; Borriello, M.; Liccardo, M.; Scafuro, M.; Russo, P.; Iannuzzi, C. Hydroxytyrosol Selectively Affects Non-Enzymatic Glycation in Human Insulin and Protects by AGEs Cytotoxicity. Antioxidants 2021, 10, 1127. [Google Scholar] [CrossRef] [PubMed]
- Hunter, S.J.; Boyd, A.C.; O’Harte, F.P.M.; McKillop, A.M.; Wiggam, M.I.; Mooney, M.H.; McCluskey, J.T.; Lindsay, J.R.; Ennis, C.N.; Gamble, R.; et al. Demonstration of Glycated Insulin in Human Diabetic Plasma and Decreased Biological Activity Assessed by Euglycemic-Hyperinsulinemic Clamp Technique in Humans. Diabetes 2003, 52, 492–498. [Google Scholar] [CrossRef] [PubMed] [Green Version]
- Guedes, S.; Vitorino, R.; Domingues, M.R.M.; Amado, F.; Domingues, P. Mass Spectrometry Characterization of the Glycation Sites of Bovine Insulin by Tandem Mass Spectrometry. J. Am. Soc. Mass Spectrom. 2009, 20, 1319–1326. [Google Scholar] [CrossRef] [Green Version]
- Lapolla, A.; Tessari, P.; Poli, T.; Valerio, A.; Duner, E.; Iori, E.; Fedele, D.; Crepaldi, G. Reduced in Vivo Biological Activity of in Vitro Glycosylated Insulin. Diabetes 1988, 37, 787–791. [Google Scholar] [CrossRef] [PubMed]
- O’Harte, F.P.M.; Højrup, P.; Barnett, C.R.; Flatt, P.R. Identification of the Site of Glycation of Human Insulin. Peptides 1996, 17, 1323–1330. [Google Scholar] [CrossRef]
- Dolhofer, R.; Wieland, O.H. Preparation and Biological Properties of Glycosylated Insulin. FEBS Lett. 1979, 100, 133–136. [Google Scholar] [CrossRef] [Green Version]
- Agin, A.; Jeandidier, N.; Gasser, F.; Grucker, D.; Sapin, R. Use of Insulin Immunoassays in Clinical Studies Involving Rapid-Acting Insulin Analogues: Bi-Insulin IRMA Preliminary Assessment. Clin. Chem. Lab. Med. 2006, 44, 1379–1382. [Google Scholar] [CrossRef]
- Owen, W.E.; Roberts, W.L. Cross-Reactivity of Three Recombinant Insulin Analogs with Five Commercial Insulin Immunoassays. Clin. Chem. 2004, 50, 257–259. [Google Scholar] [CrossRef]
- Lamalle, C.; Servais, A.-C.; Radermecker, R.P.; Crommen, J.; Fillet, M. Simultaneous Determination of Insulin and Its Analogues in Pharmaceutical Formulations by Micellar Electrokinetic Chromatography. J. Pharm. Biomed. Anal. 2015, 111, 344–350. [Google Scholar] [CrossRef] [Green Version]
- Ortner, K.; Buchberger, W.; Himmelsbach, M. Capillary Electrokinetic Chromatography of Insulin and Related Synthetic Analogues. J. Chromatogr. A 2009, 1216, 2953–2957. [Google Scholar] [CrossRef]
- Yilmaz, B.; Kadioglu, Y.; Capoglu, I. Determination of Insulin in Humans with Insulin-Dependent Diabetes Mellitus Patients by HPLC with Diode Array Detection. J. Chromatogr. Sci. 2012, 50, 586–590. [Google Scholar] [CrossRef] [PubMed]
- Tantipolphan, R.; Romeijn, S.; den Engelsman, J.; Torosantucci, R.; Rasmussen, T.; Jiskoot, W. Elution Behavior of Insulin on High-Performance Size Exclusion Chromatography at Neutral PH. J. Pharm. Biomed Anal. 2010, 52, 195–202. [Google Scholar] [CrossRef] [PubMed]
- Teska, B.M.; Kumar, A.; Carpenter, J.F.; Wempe, M.F. Analyzing Insulin Samples by Size-Exclusion Chromatography: A Column Degradation Study. J. Pharm. Sci. 2015, 104, 1555–1560. [Google Scholar] [CrossRef] [PubMed] [Green Version]
- Hjorth, C.F.; Hubálek, F.; Andersson, J.; Poulsen, C.; Otzen, D.; Naver, H. Purification and Identification of High Molecular Weight Products Formed During Storage of Neutral Formulation of Human Insulin. Pharm. Res. 2015, 32, 2072–2085. [Google Scholar] [CrossRef]
- Oliva, A.; Fariña, J.; Llabrés, M. Development of Two High-Performance Liquid Chromatographic Methods for the Analysis and Characterization of Insulin and Its Degradation Products in Pharmaceutical Preparations. J. Chromatogr. B Biomed. Sci. Appl. 2000, 749, 25–34. [Google Scholar] [CrossRef]
- Najjar, A.; Alawi, M.; AbuHeshmeh, N.; Sallam, A. A Rapid, Isocratic HPLC Method for Determination of Insulin and Its Degradation Product. Adv. Pharm. 2014, 2014, 749823. [Google Scholar] [CrossRef] [Green Version]
- Thevis, M.; Thomas, A.; Schänzer, W. Mass Spectrometric Determination of Insulins and Their Degradation Products in Sports Drug Testing. Mass Spectrom. Rev. 2008, 27, 35–50. [Google Scholar] [CrossRef]
- Thomas, A.; Schänzer, W.; Delahaut, P.; Thevis, M. Immunoaffinity Purification of Peptide Hormones Prior to Liquid Chromatography-Mass Spectrometry in Doping Controls. Methods 2012, 56, 230–235. [Google Scholar] [CrossRef]
- Bottinelli, C.; Bévalot, F.; Cartiser, N.; Fanton, L.; Guitton, J. Detection of Insulins in Postmortem Tissues: An Optimized Workflow Based on Immunopurification and LC-MS/HRMS Detection. Int. J. Leg. Med. 2021, 135, 1813–1822. [Google Scholar] [CrossRef]
- Shen, Y.; Prinyawiwatkul, W.; Xu, Z. Insulin: A Review of Analytical Methods. Analyst 2019, 144, 4139–4148. [Google Scholar] [CrossRef]
- Zhu, X.; Liu, J.; Wu, J.; Cao, R.; Li, T. Pharmacokinetic Study of HS061, a New Human Insulin, in Non-Diabetic Rat Using Ultra Performance Liquid Chromatography–Tandem Mass Spectrometry. J. Chromatogr. B 2014, 967, 50–56. [Google Scholar] [CrossRef] [PubMed]
- Hubert, P.; Nguyen-Huu, J.-J.; Boulanger, B.; Chapuzet, E.; Chiap, P.; Cohen, N.; Compagnon, P.-A.; Dewé, W.; Feinberg, M.; Lallier, M.; et al. Harmonization of Strategies for the Validation of Quantitative Analytical Procedures. A SFSTP Proposal—Part, I. J. Pharm. Biomed Anal. 2004, 36, 579–586. [Google Scholar] [CrossRef] [PubMed]
- Hubert, P.; Nguyen-Huu, J.-J.; Boulanger, B.; Chapuzet, E.; Chiap, P.; Cohen, N.; Compagnon, P.-A.; Dewé, W.; Feinberg, M.; Lallier, M.; et al. Harmonization of Strategies for the Validation of Quantitative Analytical Procedures. A SFSTP Proposal—Part II. J. Pharm. Biomed Anal. 2007, 45, 70–81. [Google Scholar] [CrossRef] [PubMed]
- Hubert, P.; Nguyen-Huu, J.-J.; Boulanger, B.; Chapuzet, E.; Cohen, N.; Compagnon, P.-A.; Dewé, W.; Feinberg, M.; Laurentie, M.; Mercier, N.; et al. Harmonization of Strategies for the Validation of Quantitative Analytical Procedures. A SFSTP Proposal—Part III. J. Pharm. Biomed Anal. 2007, 45, 82–96. [Google Scholar] [CrossRef]
- European Medicines Agency; Committee for Medicinal Products for Human Use. Guideline on Bioanalytical Method Validation; European Medicines Agency, Committee for Medicinal Products for Human Use: Amsterdam, The Netherlands, 2011. [Google Scholar]
- Horvat, S.; Jakas, A. Peptide and Amino Acid Glycation: New Insights into the Maillard Reaction. J. Pept. Sci. 2004, 10, 119–137. [Google Scholar] [CrossRef]
- Alavi, P.; Yousefi, R.; Amirghofran, S.; Karbalaei-Heidari, H.R.; Moosavi-Movahedi, A.A. Structural Analysis and Aggregation Propensity of Reduced and Nonreduced Glycated Insulin Adducts. Appl. Biochem. Biotechnol. 2013, 170, 623–638. [Google Scholar] [CrossRef]
- McKillop, A.M.; Meade, A.; Flatt, P.R.; O’Harte, F.P.M. Evaluation of the Site(s) of Glycation in Human Proinsulin by Ion-Trap LCQ Electrospray Ionization Mass Spectrometry. Regul. Pept. 2003, 113, 1–8. [Google Scholar] [CrossRef]
- Boyd, A.C.; Abdel-Wahab, Y.H.A.; McKillop, A.M.; McNulty, H.; Barnett, C.R.; O’Harte, F.P.M.; Flatt, P.R. Impaired Ability of Glycated Insulin to Regulate Plasma Glucose and Stimulate Glucose Transport and Metabolism in Mouse Abdominal Muscle. Biochim. Biophys. Acta (BBA)-Gen. Subj. 2000, 1523, 128–134. [Google Scholar] [CrossRef]
- Soboleva, A.; Vikhnina, M.; Grishina, T.; Frolov, A. Probing Protein Glycation by Chromatography and Mass Spectrometry: Analysis of Glycation Adducts. Int. J. Mol. Sci. 2017, 18, 2557. [Google Scholar] [CrossRef] [Green Version]
- Guedes, S.; Vitorino, R.; Domingues, M.R.M.; Amado, F.; Domingues, P. Oxidative Modifications in Glycated Insulin. Anal. Bioanal. Chem. 2010, 397, 1985–1995. [Google Scholar] [CrossRef]
- Farah, M.A.; Bose, S.; Lee, J.-H.; Jung, H.-C.; Kim, Y. Analysis of Glycated Insulin by MALDI-TOF Mass Spectrometry. Biochim. Biophys. Acta (BBA)-Gen. Subj. 2005, 1725, 269–282. [Google Scholar] [CrossRef] [PubMed]
- Henry, H.; Lannoy, D.; Simon, N.; Seguy, D.; D’Herbomez, M.; Barthélémy, C.; Décaudin, B.; Dine, T.; Odou, P. Immunoassay Quantification of Human Insulin Added to Ternary Parenteral Nutrition Containers: Comparison of Two Methods. Anal. Bioanal. Chem. 2017, 409, 3677–3684. [Google Scholar] [CrossRef] [PubMed]
- van Boekel, M.A. Kinetic Aspects of the Maillard Reaction: A Critical Review. Nahrung 2001, 45, 150–159. [Google Scholar] [CrossRef]
- McKillop, A.M.; Abdel-Wahab, Y.H.A.; Mooney, M.H.; O’Harte, F.P.M.; Flatt, P.R. Secretion of Glycated Insulin from Pancreatic Beta-Cells in Diabetes Represents a Novel Aspect of Beta-Cell Dysfunction and Glucose Toxicity. Diabetes Metab. 2002, 28, 3S61-9; discussion 3S108-12. [Google Scholar]
- Préta, L.-H.; Henry, H.; Masse, M.; Barthélémy, C.; Carta, N.; Foulon, C.; Goossens, J.-F.; Kouach, M.; Lannoy, D.; Storme, L.; et al. Instability of Insulin Aspart Diluted in Dextrose. Diabetes Care 2020, 43, e77–e78. [Google Scholar] [CrossRef]
- Amaya, J.; Lee, T.C.; Chichester, C.O. Biological Inactivation of Proteins by the Maillard Reaction. Effect of Mild Heat on the Tertiary Structure of Insulin. J. Agric. Food Chem. 1976, 24, 465–467. [Google Scholar] [CrossRef]
- O’Harte, F.P.M.; Boyd, A.C.; McKillop, A.M.; Abdel-Wahab, Y.H.A.; McNulty, H.; Barnett, C.R.; Conlon, J.M.; Højrup, P.; Flatt, P.R. Structure, Antihyperglycemic Activity and Cellular Actions of a Novel Diglycated Human Insulin. Peptides 2000, 21, 1519–1526. [Google Scholar] [CrossRef]


| Molecule | Precursor Ion | Collision Energy (eV) | Transitions | |
|---|---|---|---|---|
| Transition Type | m/z (amu) | |||
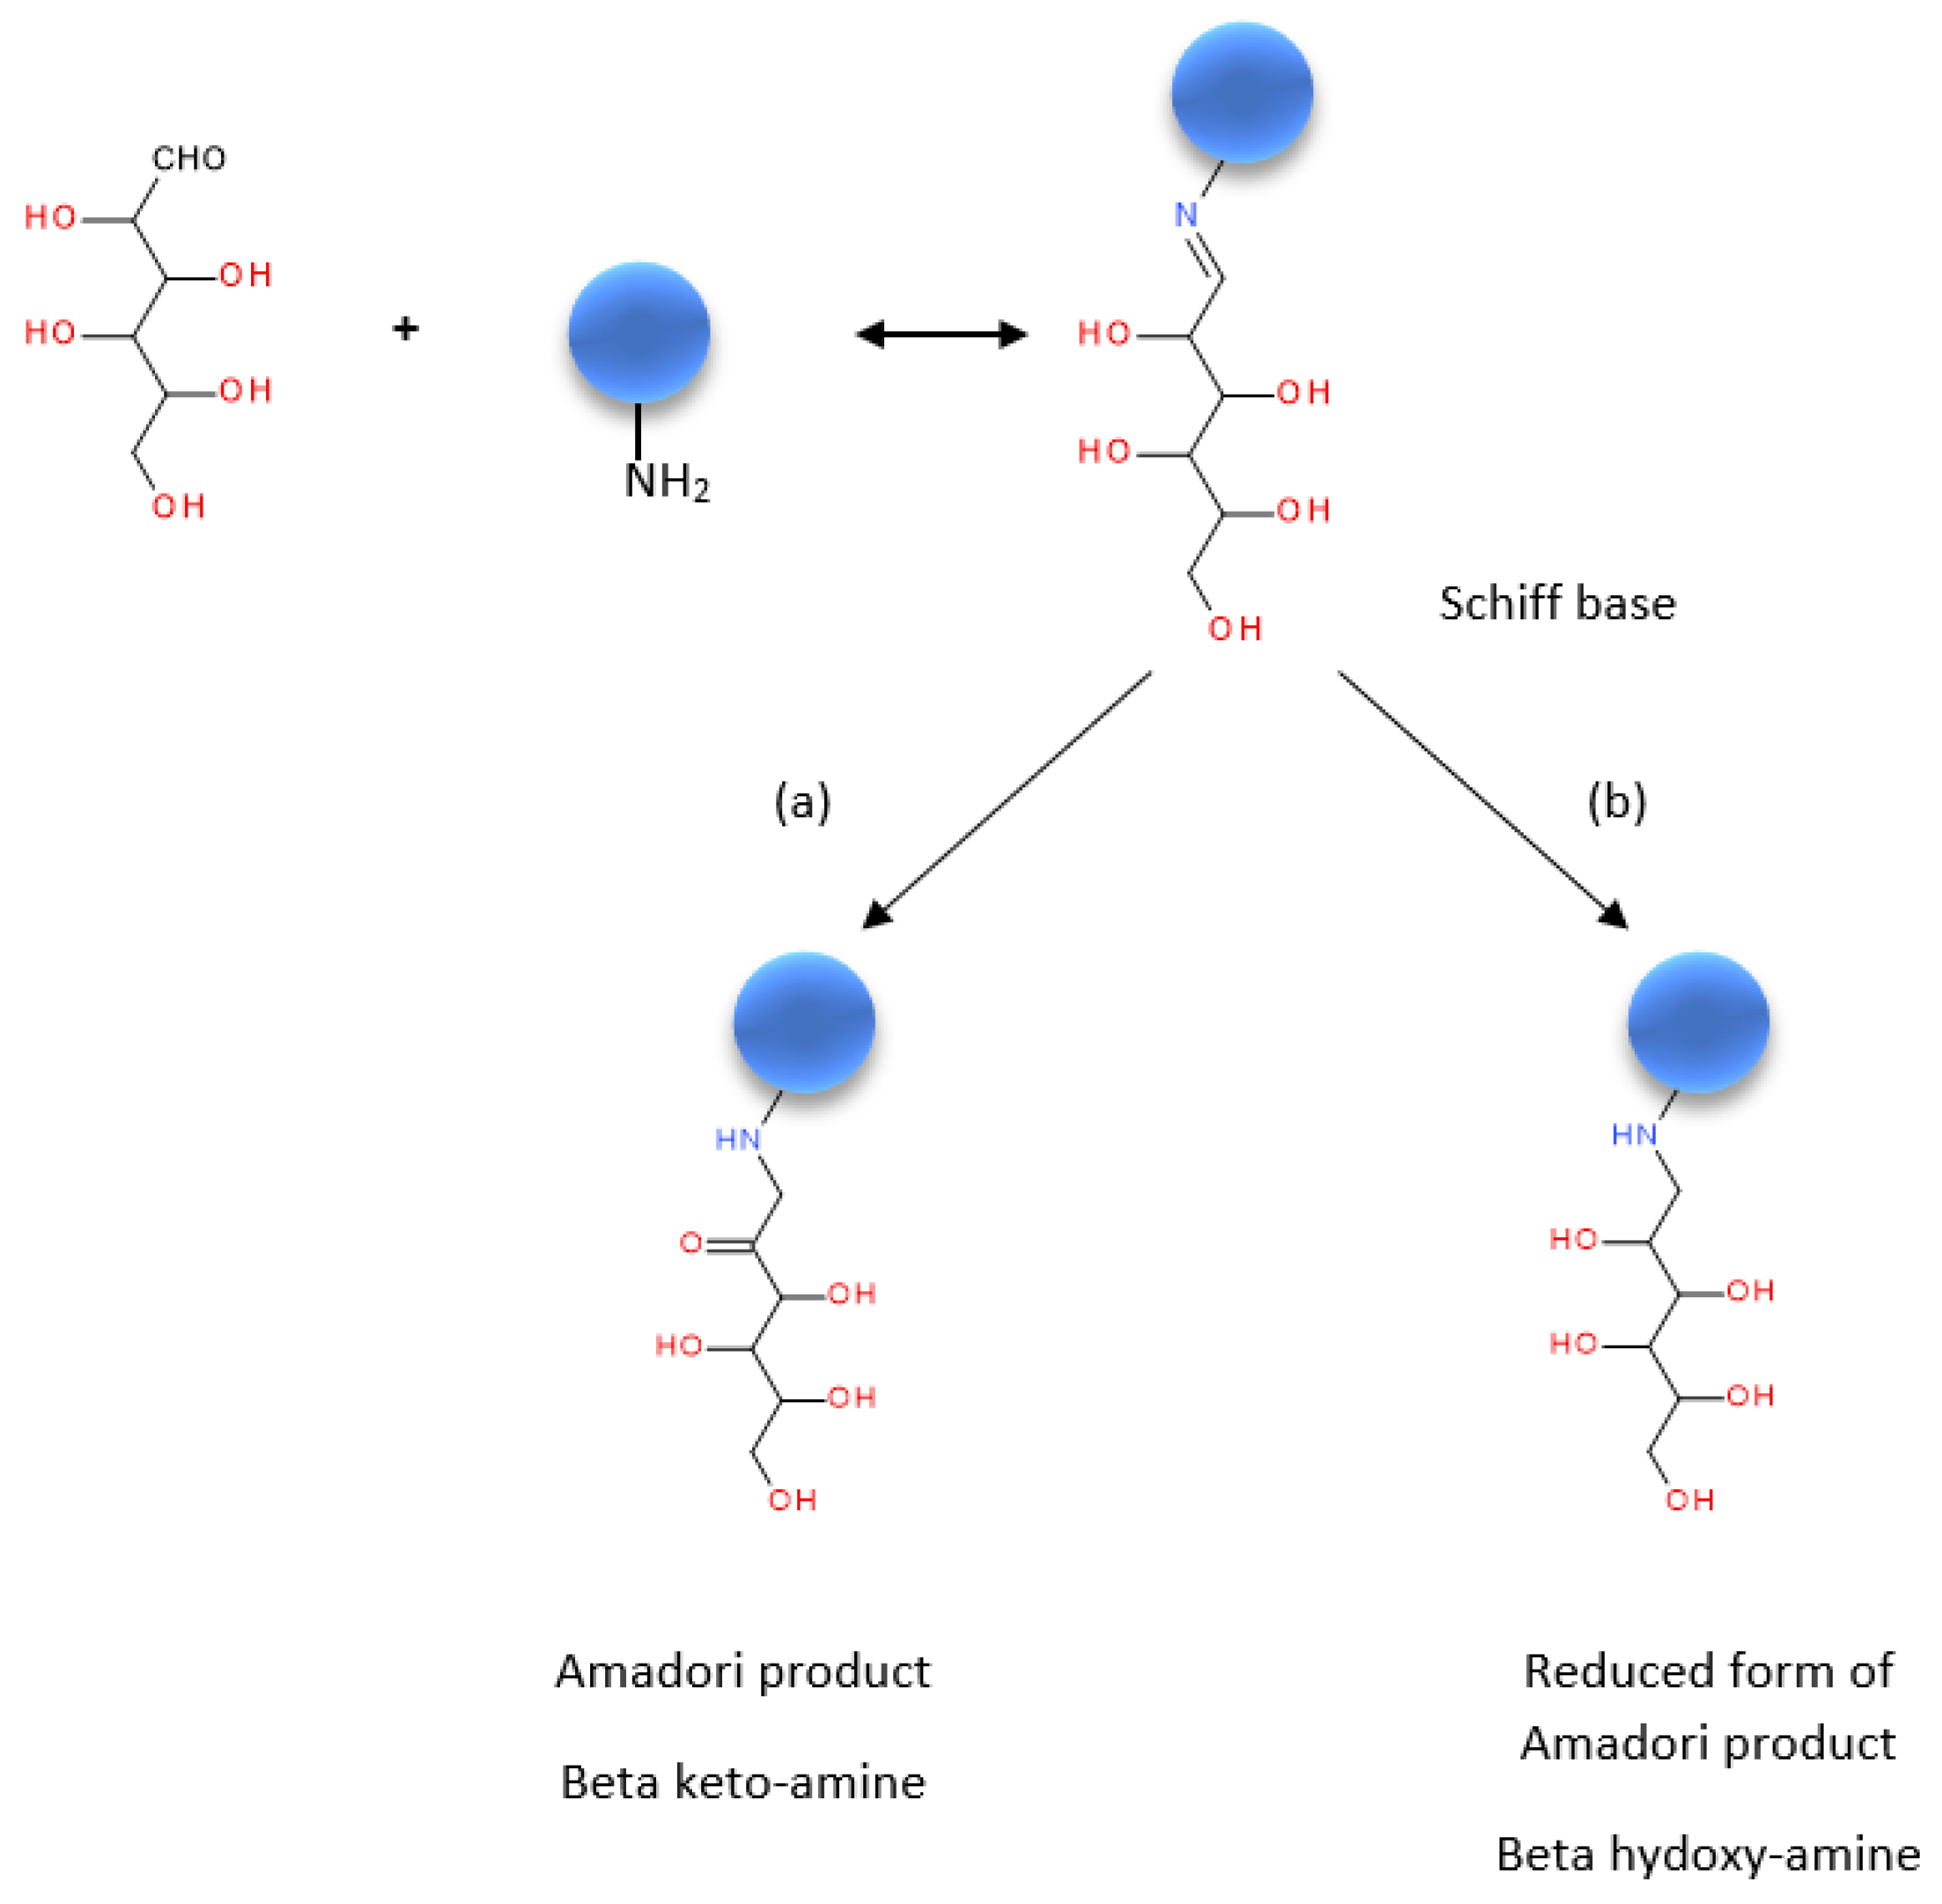
| H-insulin or R-insulin | [M + 6H]6+ | 39 | Quantifying | 968.8 → 136.0 |
| [M + 5H]5+ | 5 | Qualifying | 1162.5 → 1162.5 | |
| Glycated R-insulin | [M + 6H]6+ | 5 | Quantifying | 995.8 → 995.8 |
| [M + 5H]5+ | 5 | Qualifying | 1194.6 → 1194.6 | |
| Chain B | [M + 3H]3+ | 50 | Quantifying | 1166.0 → 315.2 |
Publisher’s Note: MDPI stays neutral with regard to jurisdictional claims in published maps and institutional affiliations. |
© 2022 by the authors. Licensee MDPI, Basel, Switzerland. This article is an open access article distributed under the terms and conditions of the Creative Commons Attribution (CC BY) license (https://creativecommons.org/licenses/by/4.0/).
Share and Cite
Henry, H.; Goossens, J.-F.; Kouach, M.; Lannoy, D.; Seguy, D.; Dine, T.; Odou, P.; Foulon, C. Behavior of Regular Insulin in a Parenteral Nutrition Admixture: Validation of an LC/MS-MS Assay and the In Vitro Evaluation of Insulin Glycation. Pharmaceutics 2022, 14, 1081. https://doi.org/10.3390/pharmaceutics14051081
Henry H, Goossens J-F, Kouach M, Lannoy D, Seguy D, Dine T, Odou P, Foulon C. Behavior of Regular Insulin in a Parenteral Nutrition Admixture: Validation of an LC/MS-MS Assay and the In Vitro Evaluation of Insulin Glycation. Pharmaceutics. 2022; 14(5):1081. https://doi.org/10.3390/pharmaceutics14051081
Chicago/Turabian StyleHenry, Heloise, Jean-François Goossens, Mostafa Kouach, Damien Lannoy, David Seguy, Thierry Dine, Pascal Odou, and Catherine Foulon. 2022. "Behavior of Regular Insulin in a Parenteral Nutrition Admixture: Validation of an LC/MS-MS Assay and the In Vitro Evaluation of Insulin Glycation" Pharmaceutics 14, no. 5: 1081. https://doi.org/10.3390/pharmaceutics14051081