
Model-Based Product Temperature and Endpoint Determination in Primary Drying of Lyophilization Processes


Abstract
:1. Introduction
2. Materials and Methods
2.1. Product Mixture and Instruments
2.2. Freeze-Drying Equipment
2.3. Experimental Runs
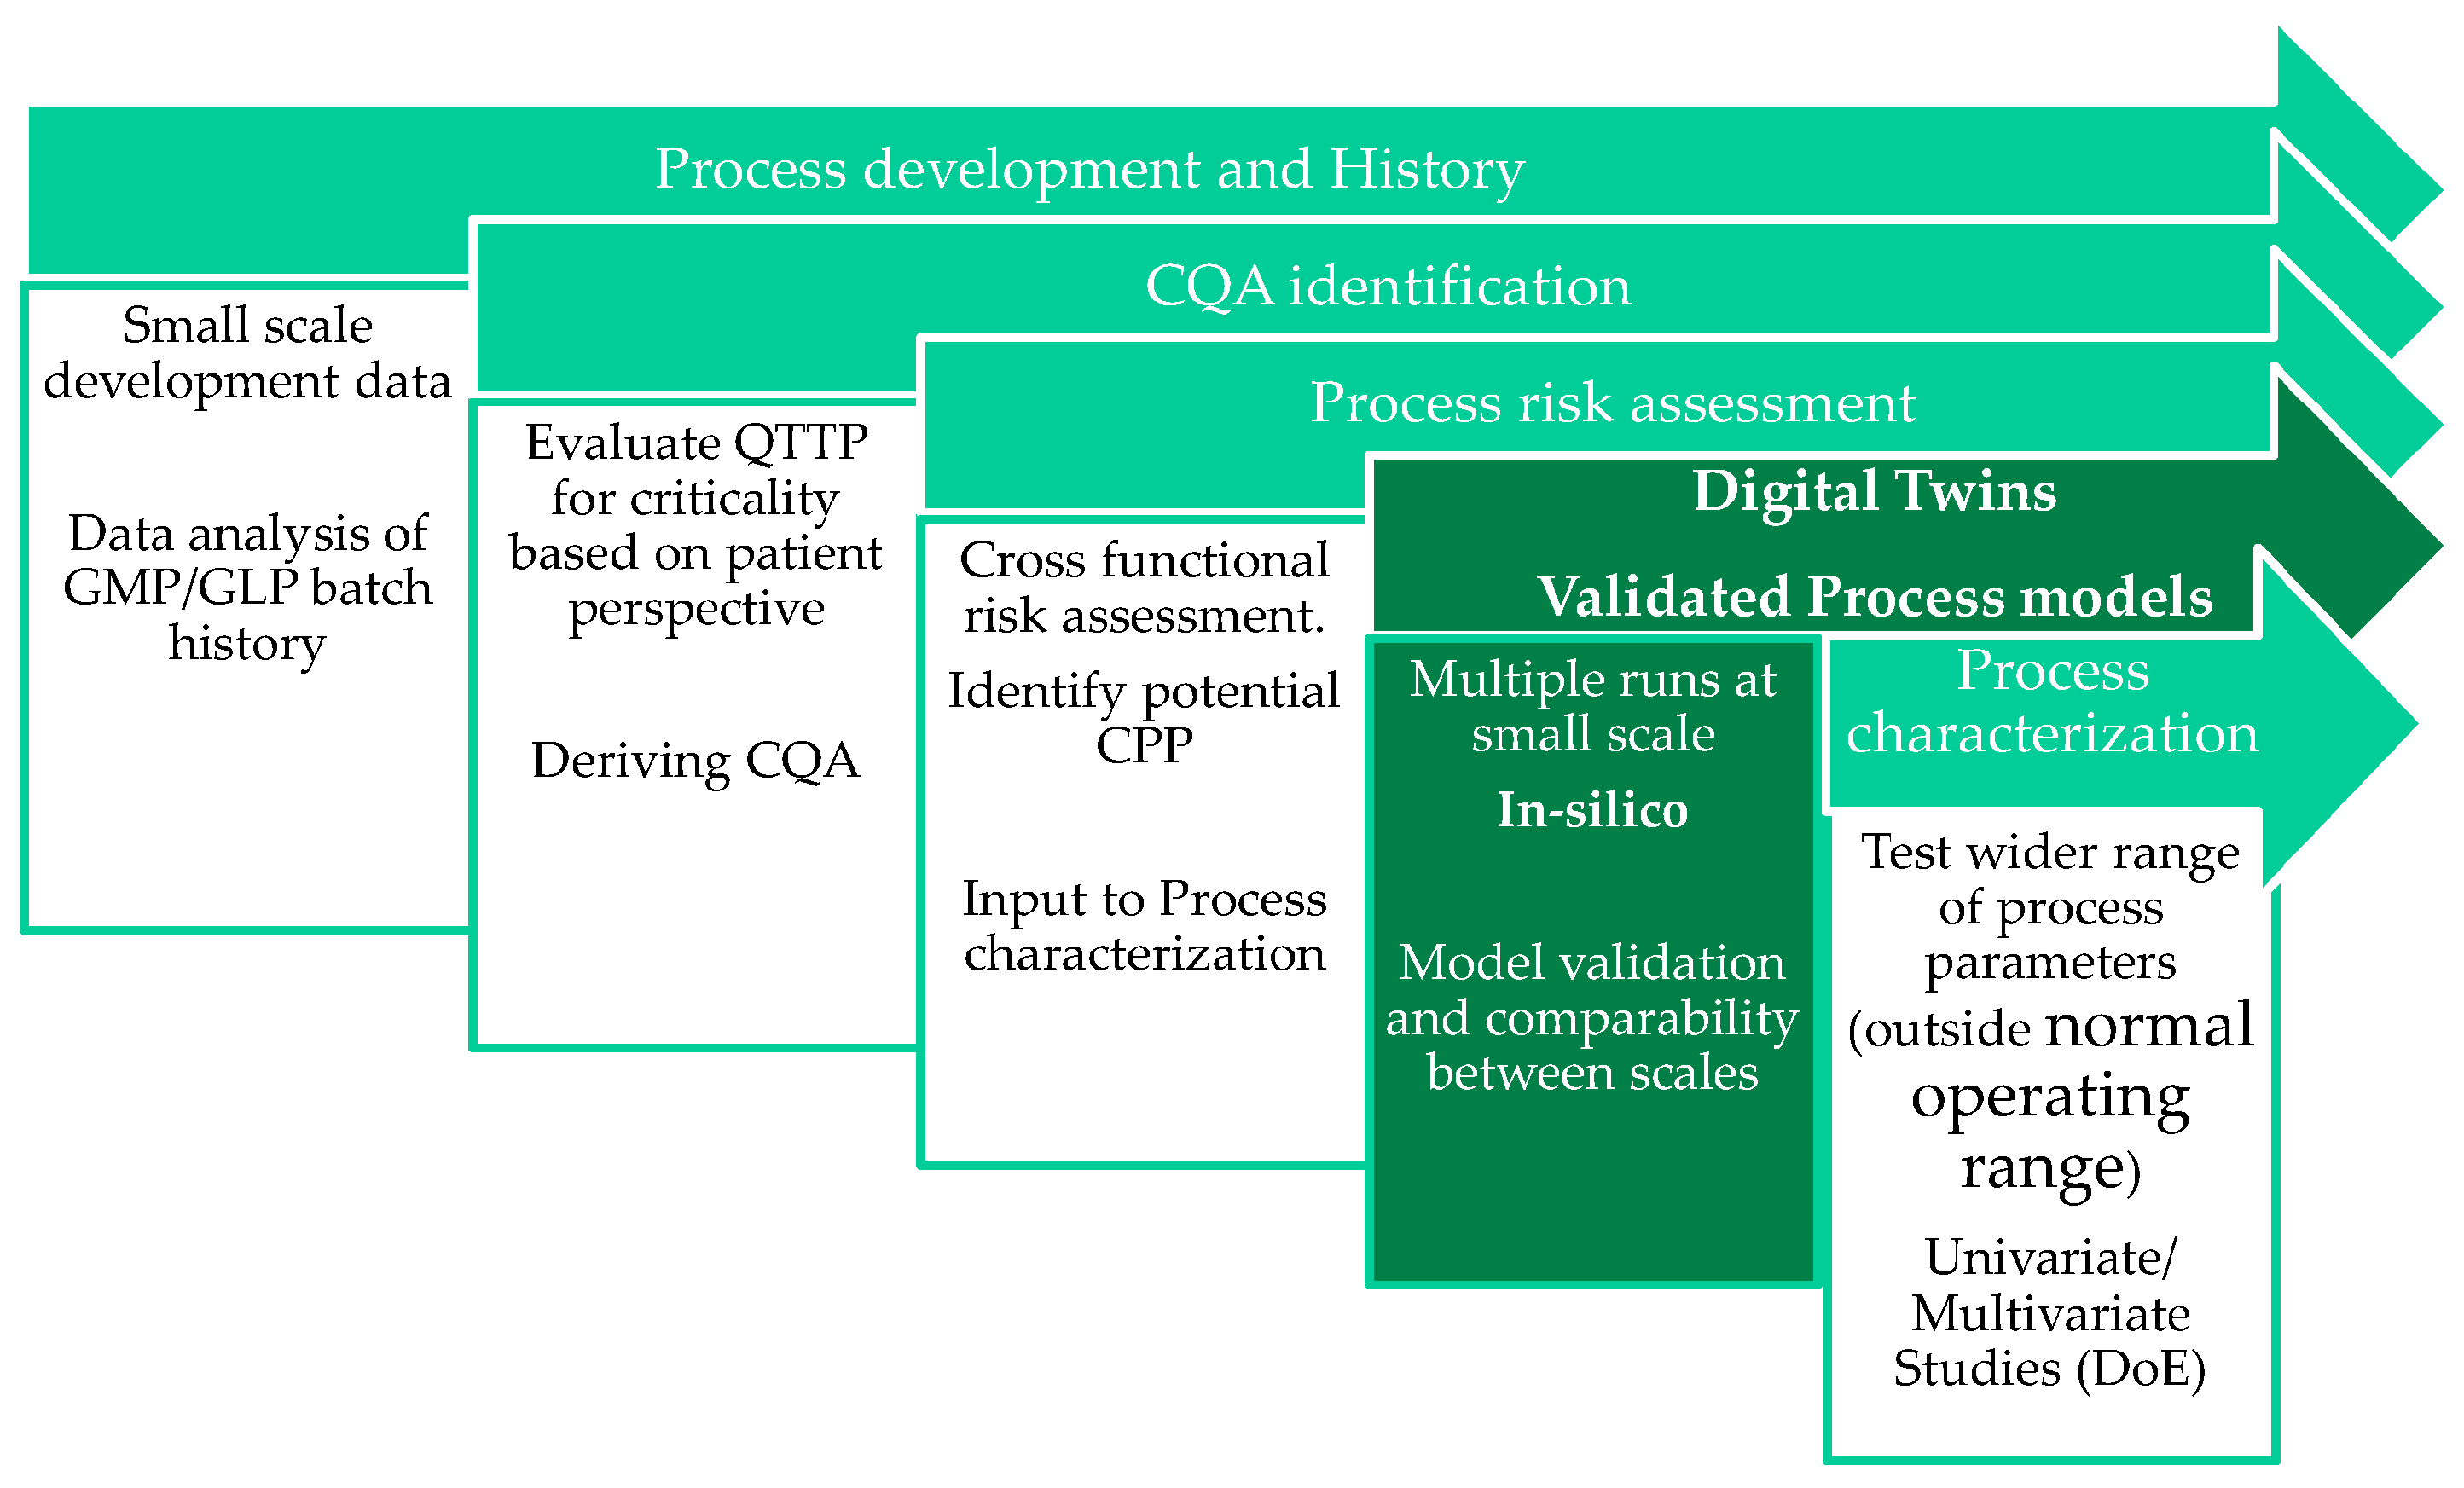
2.4. Modeling
2.5. Overall Vial Heat Transfer Coefficient Kv
2.6. Dry Layer Resistance RP
2.7. Software
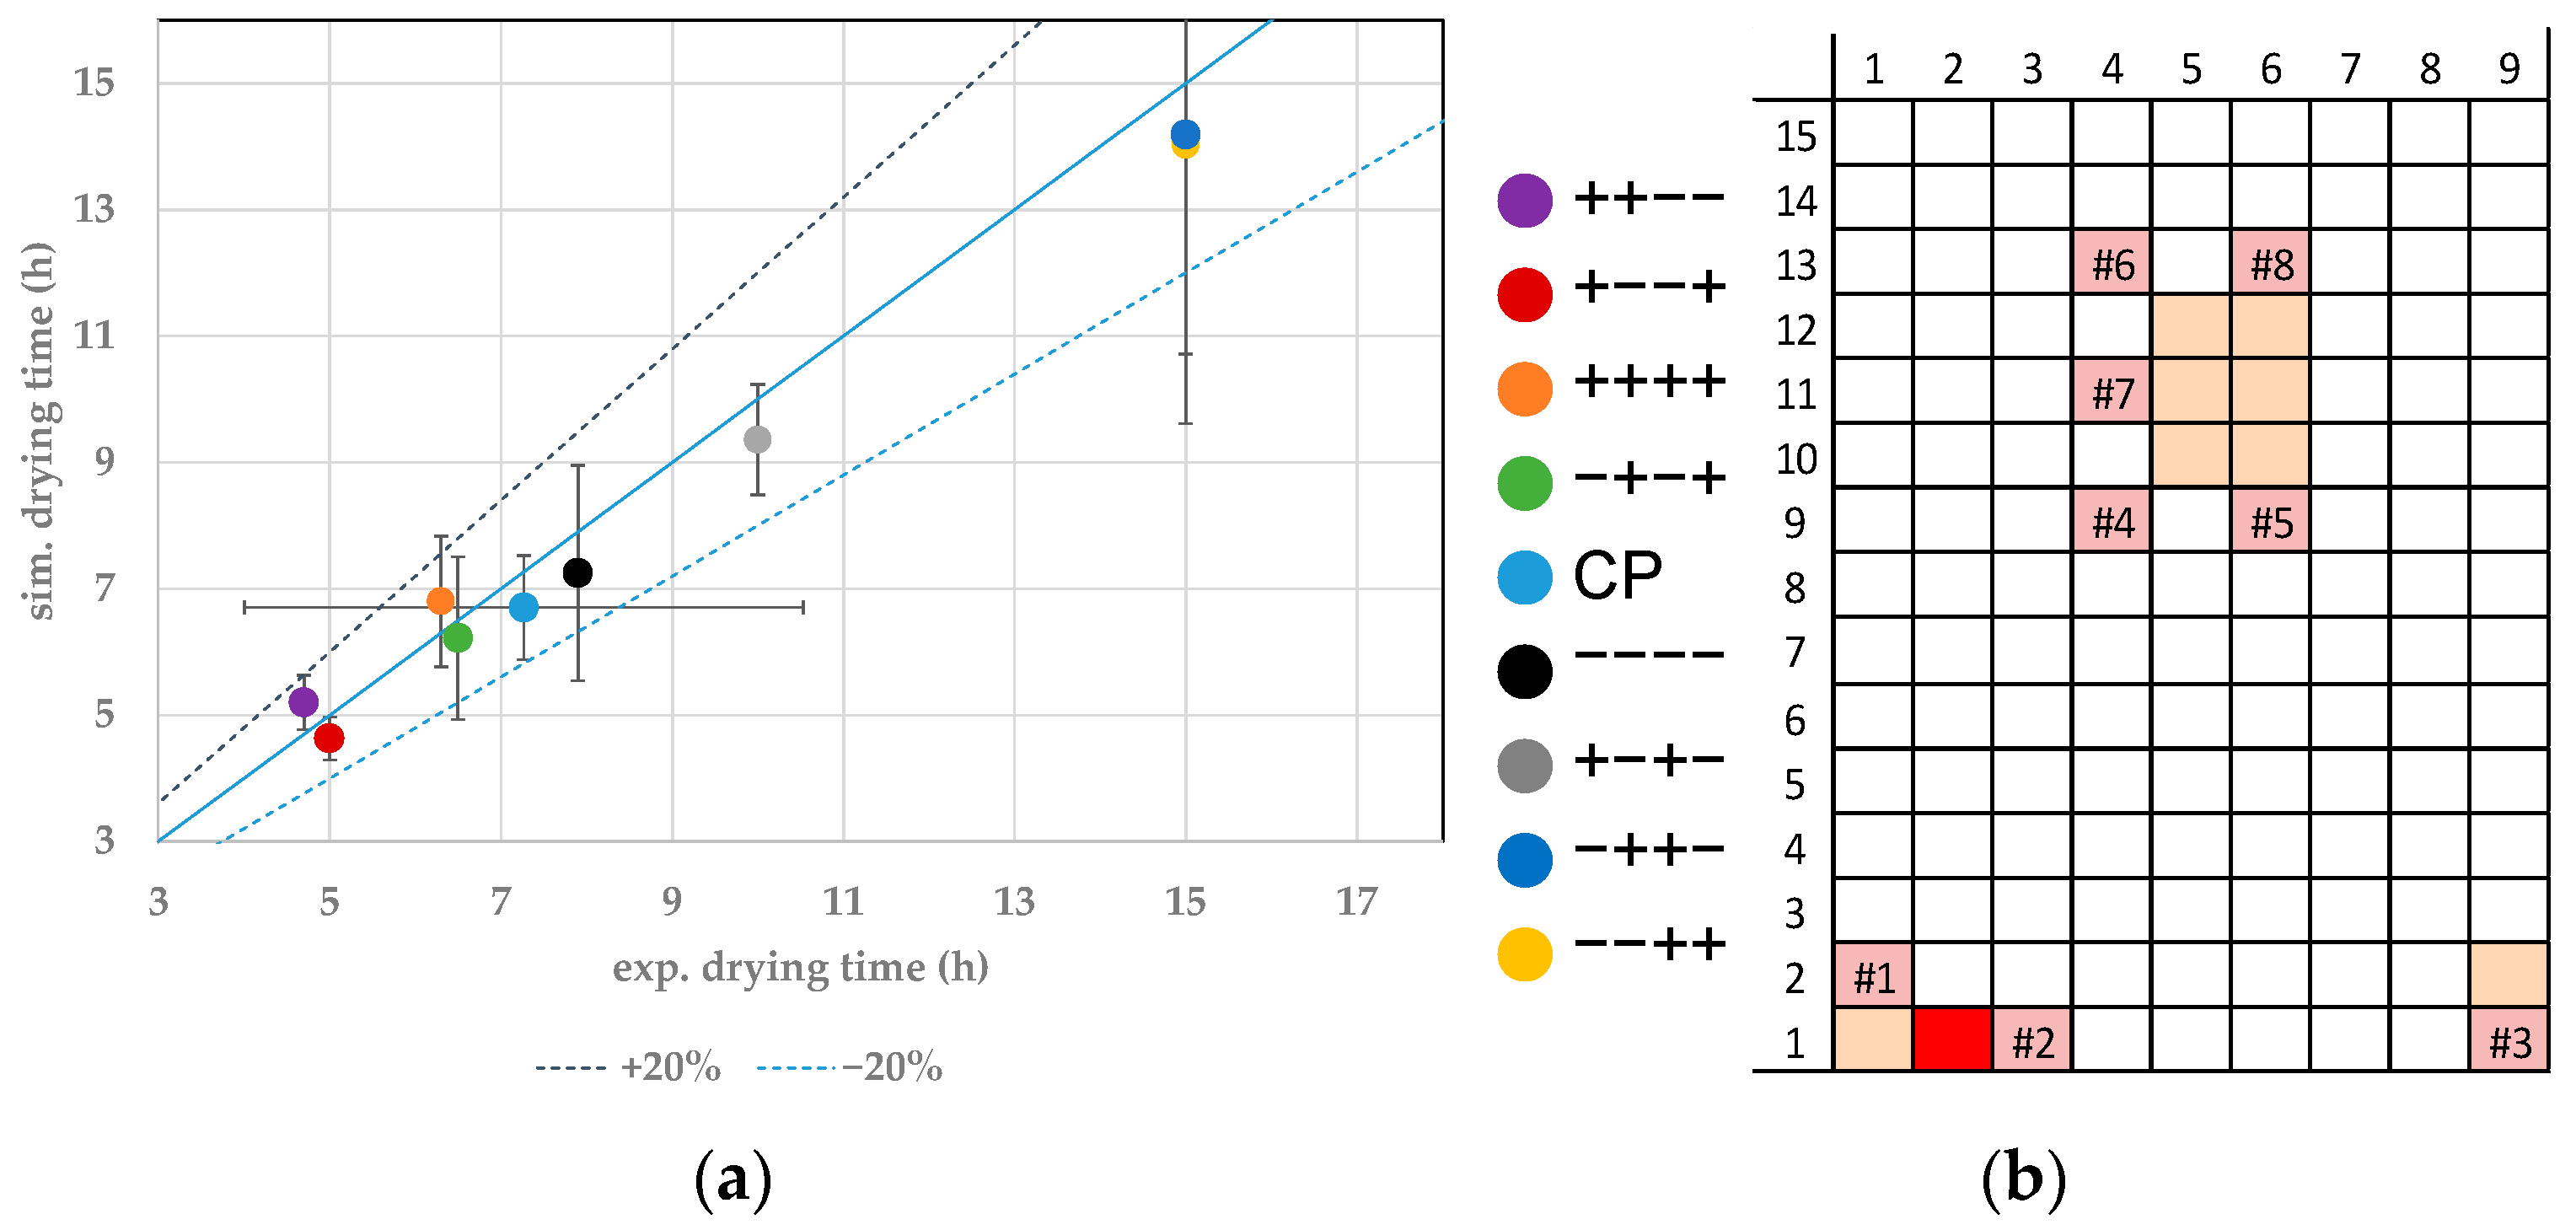
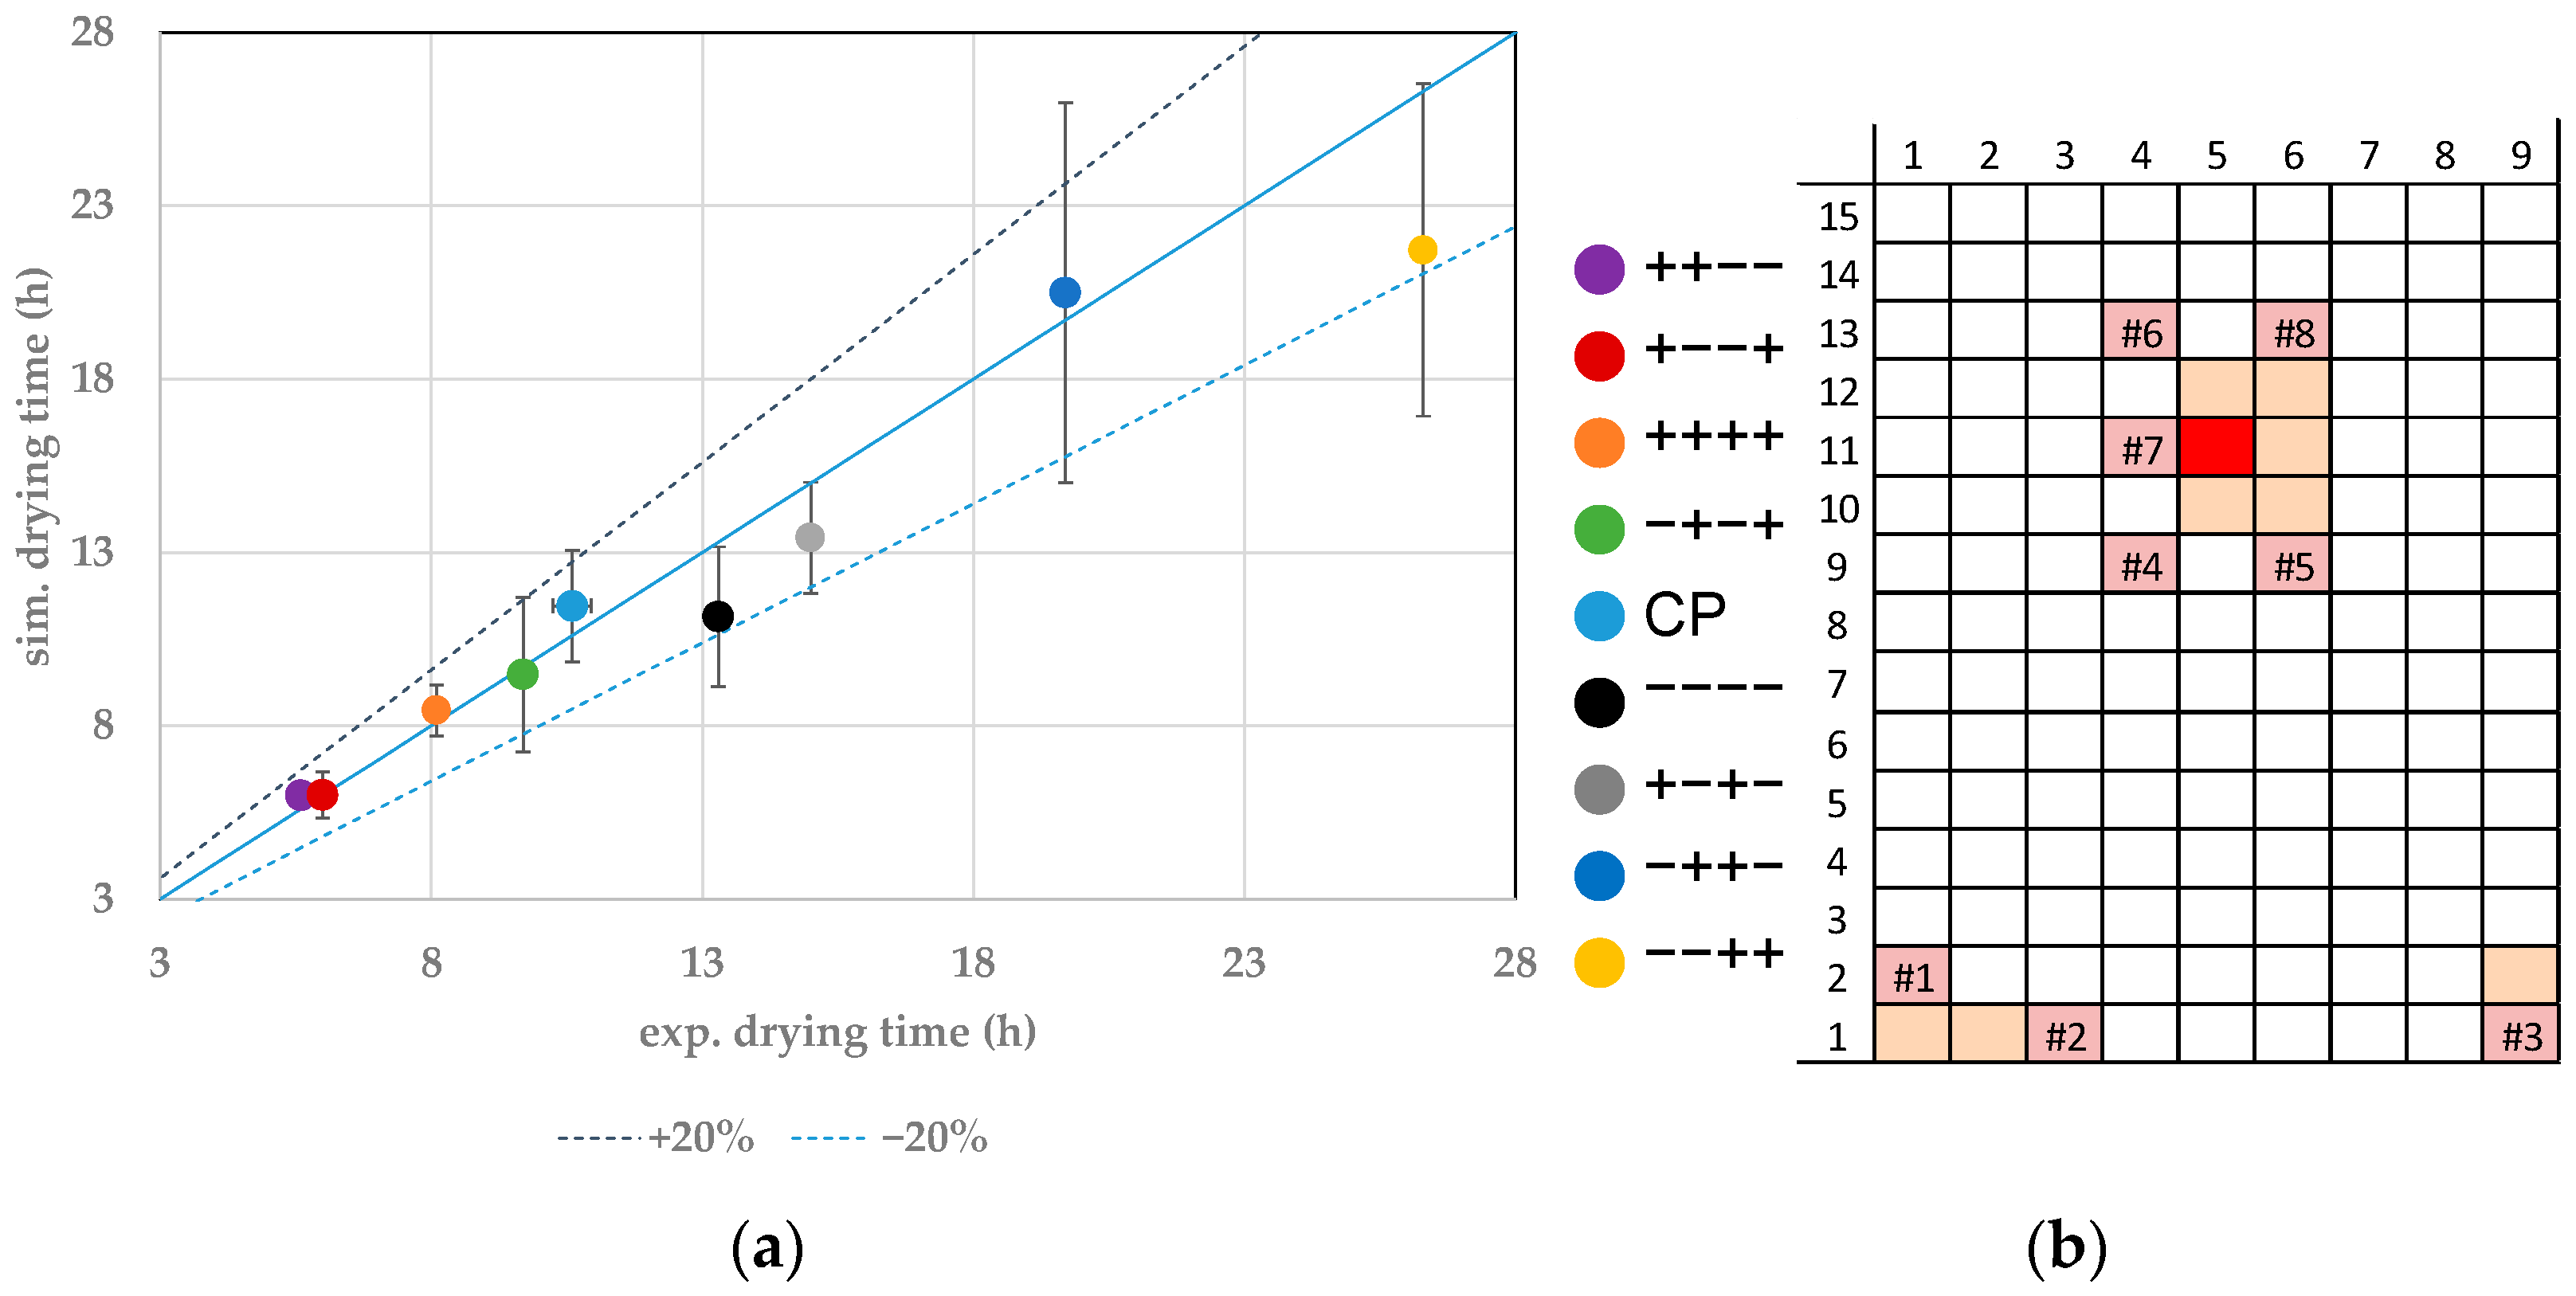
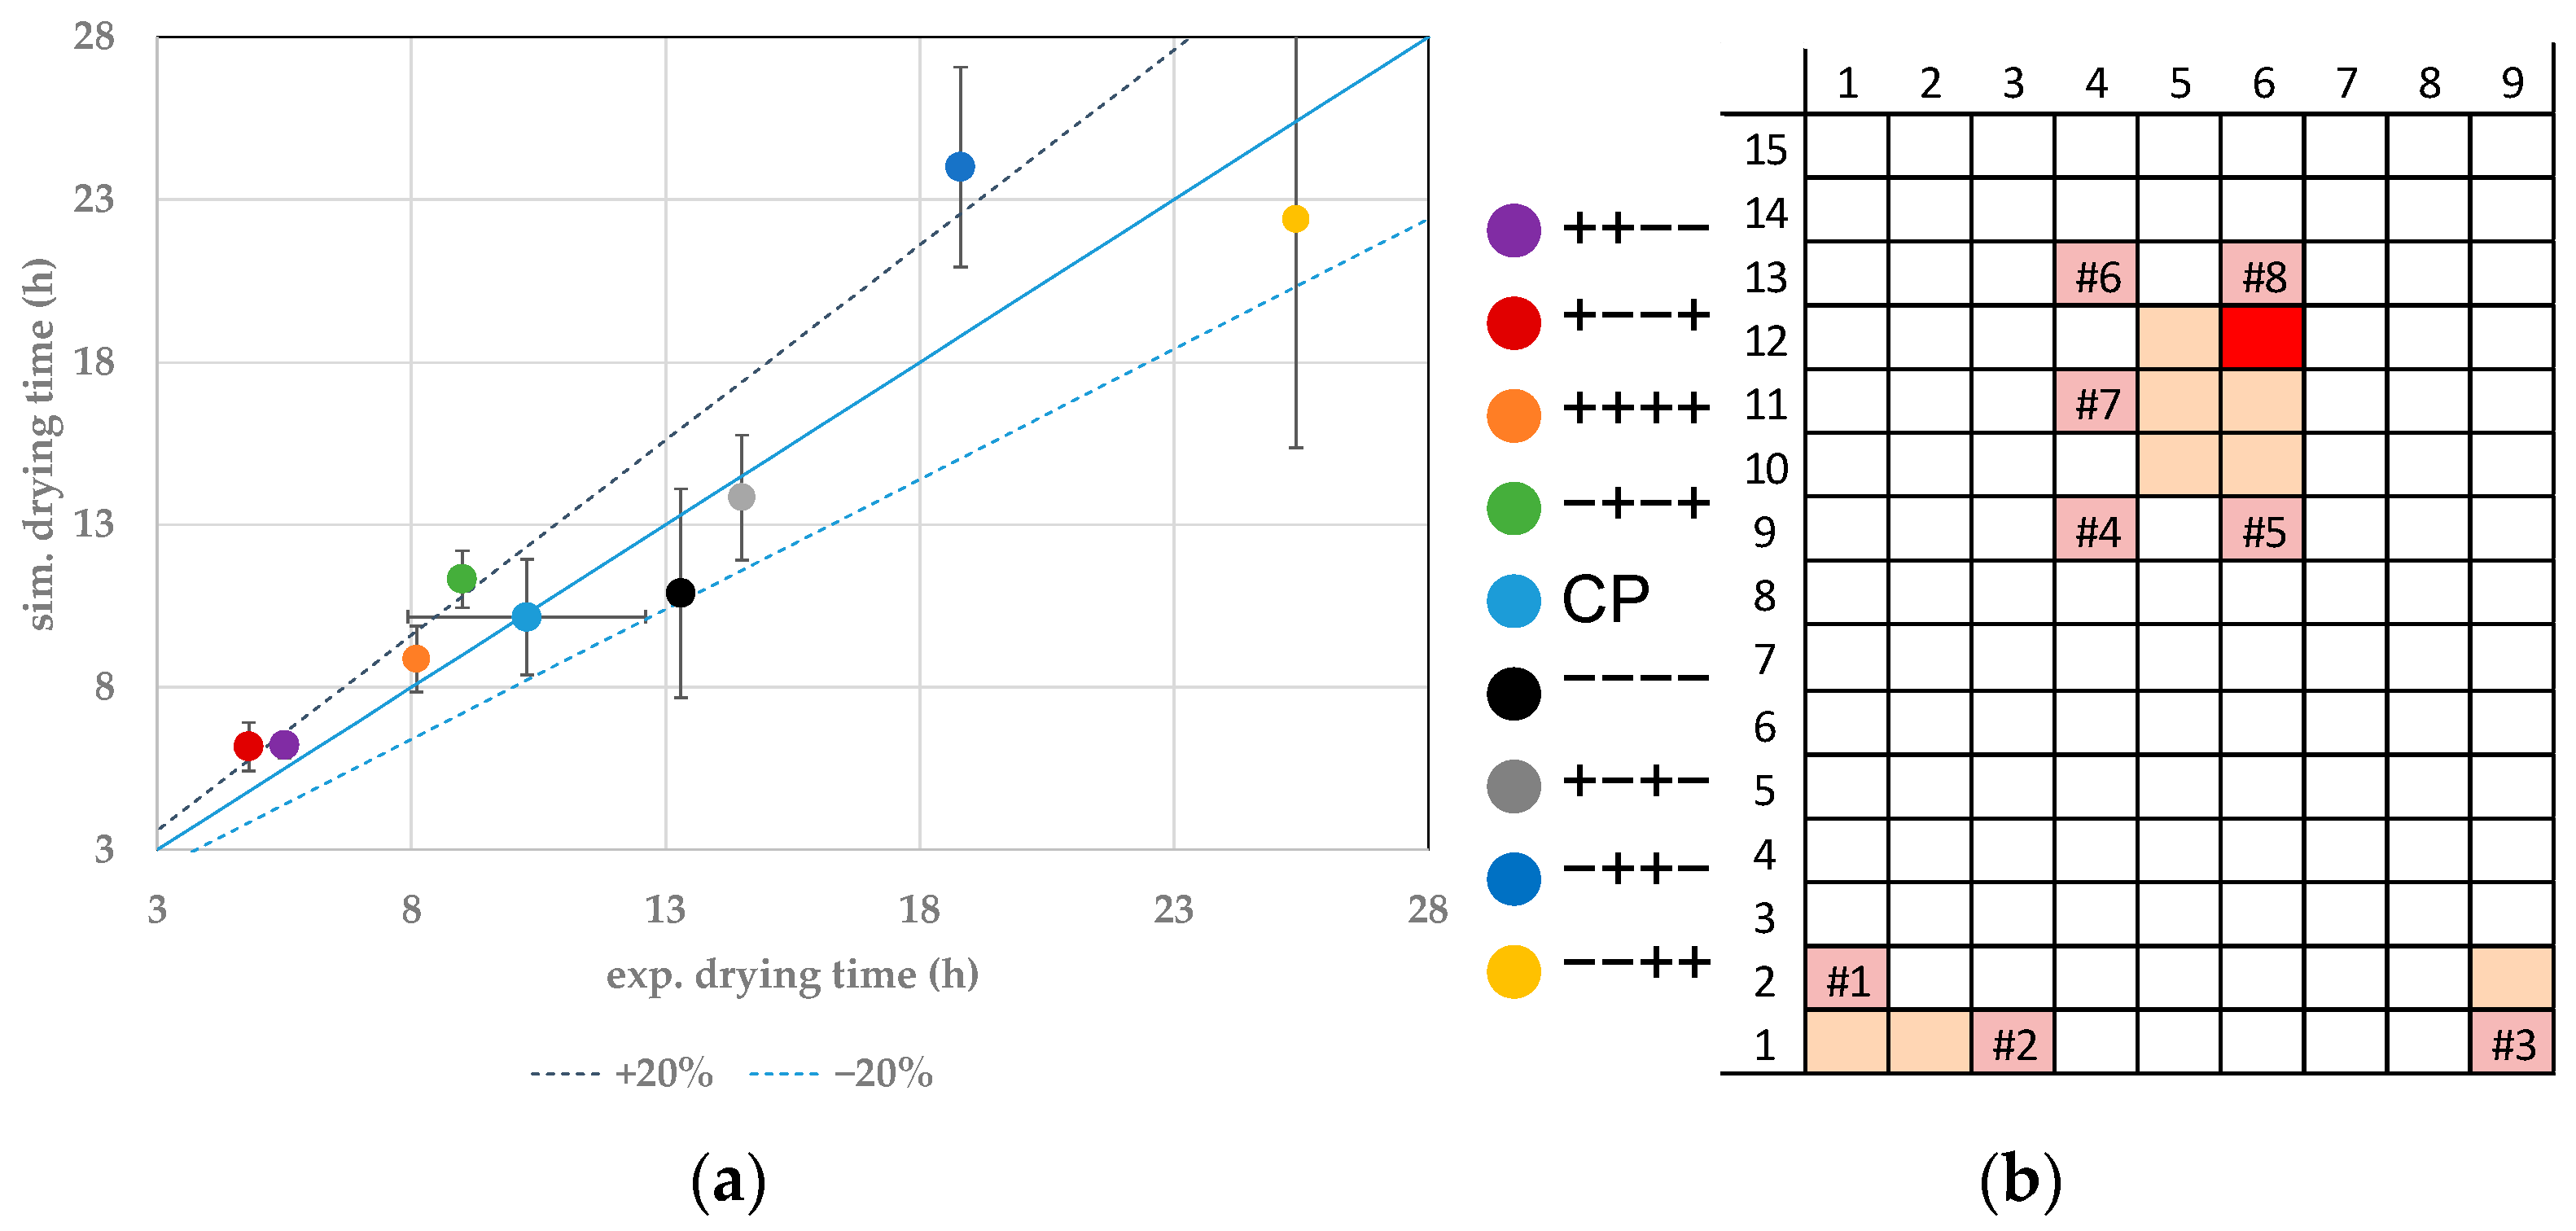
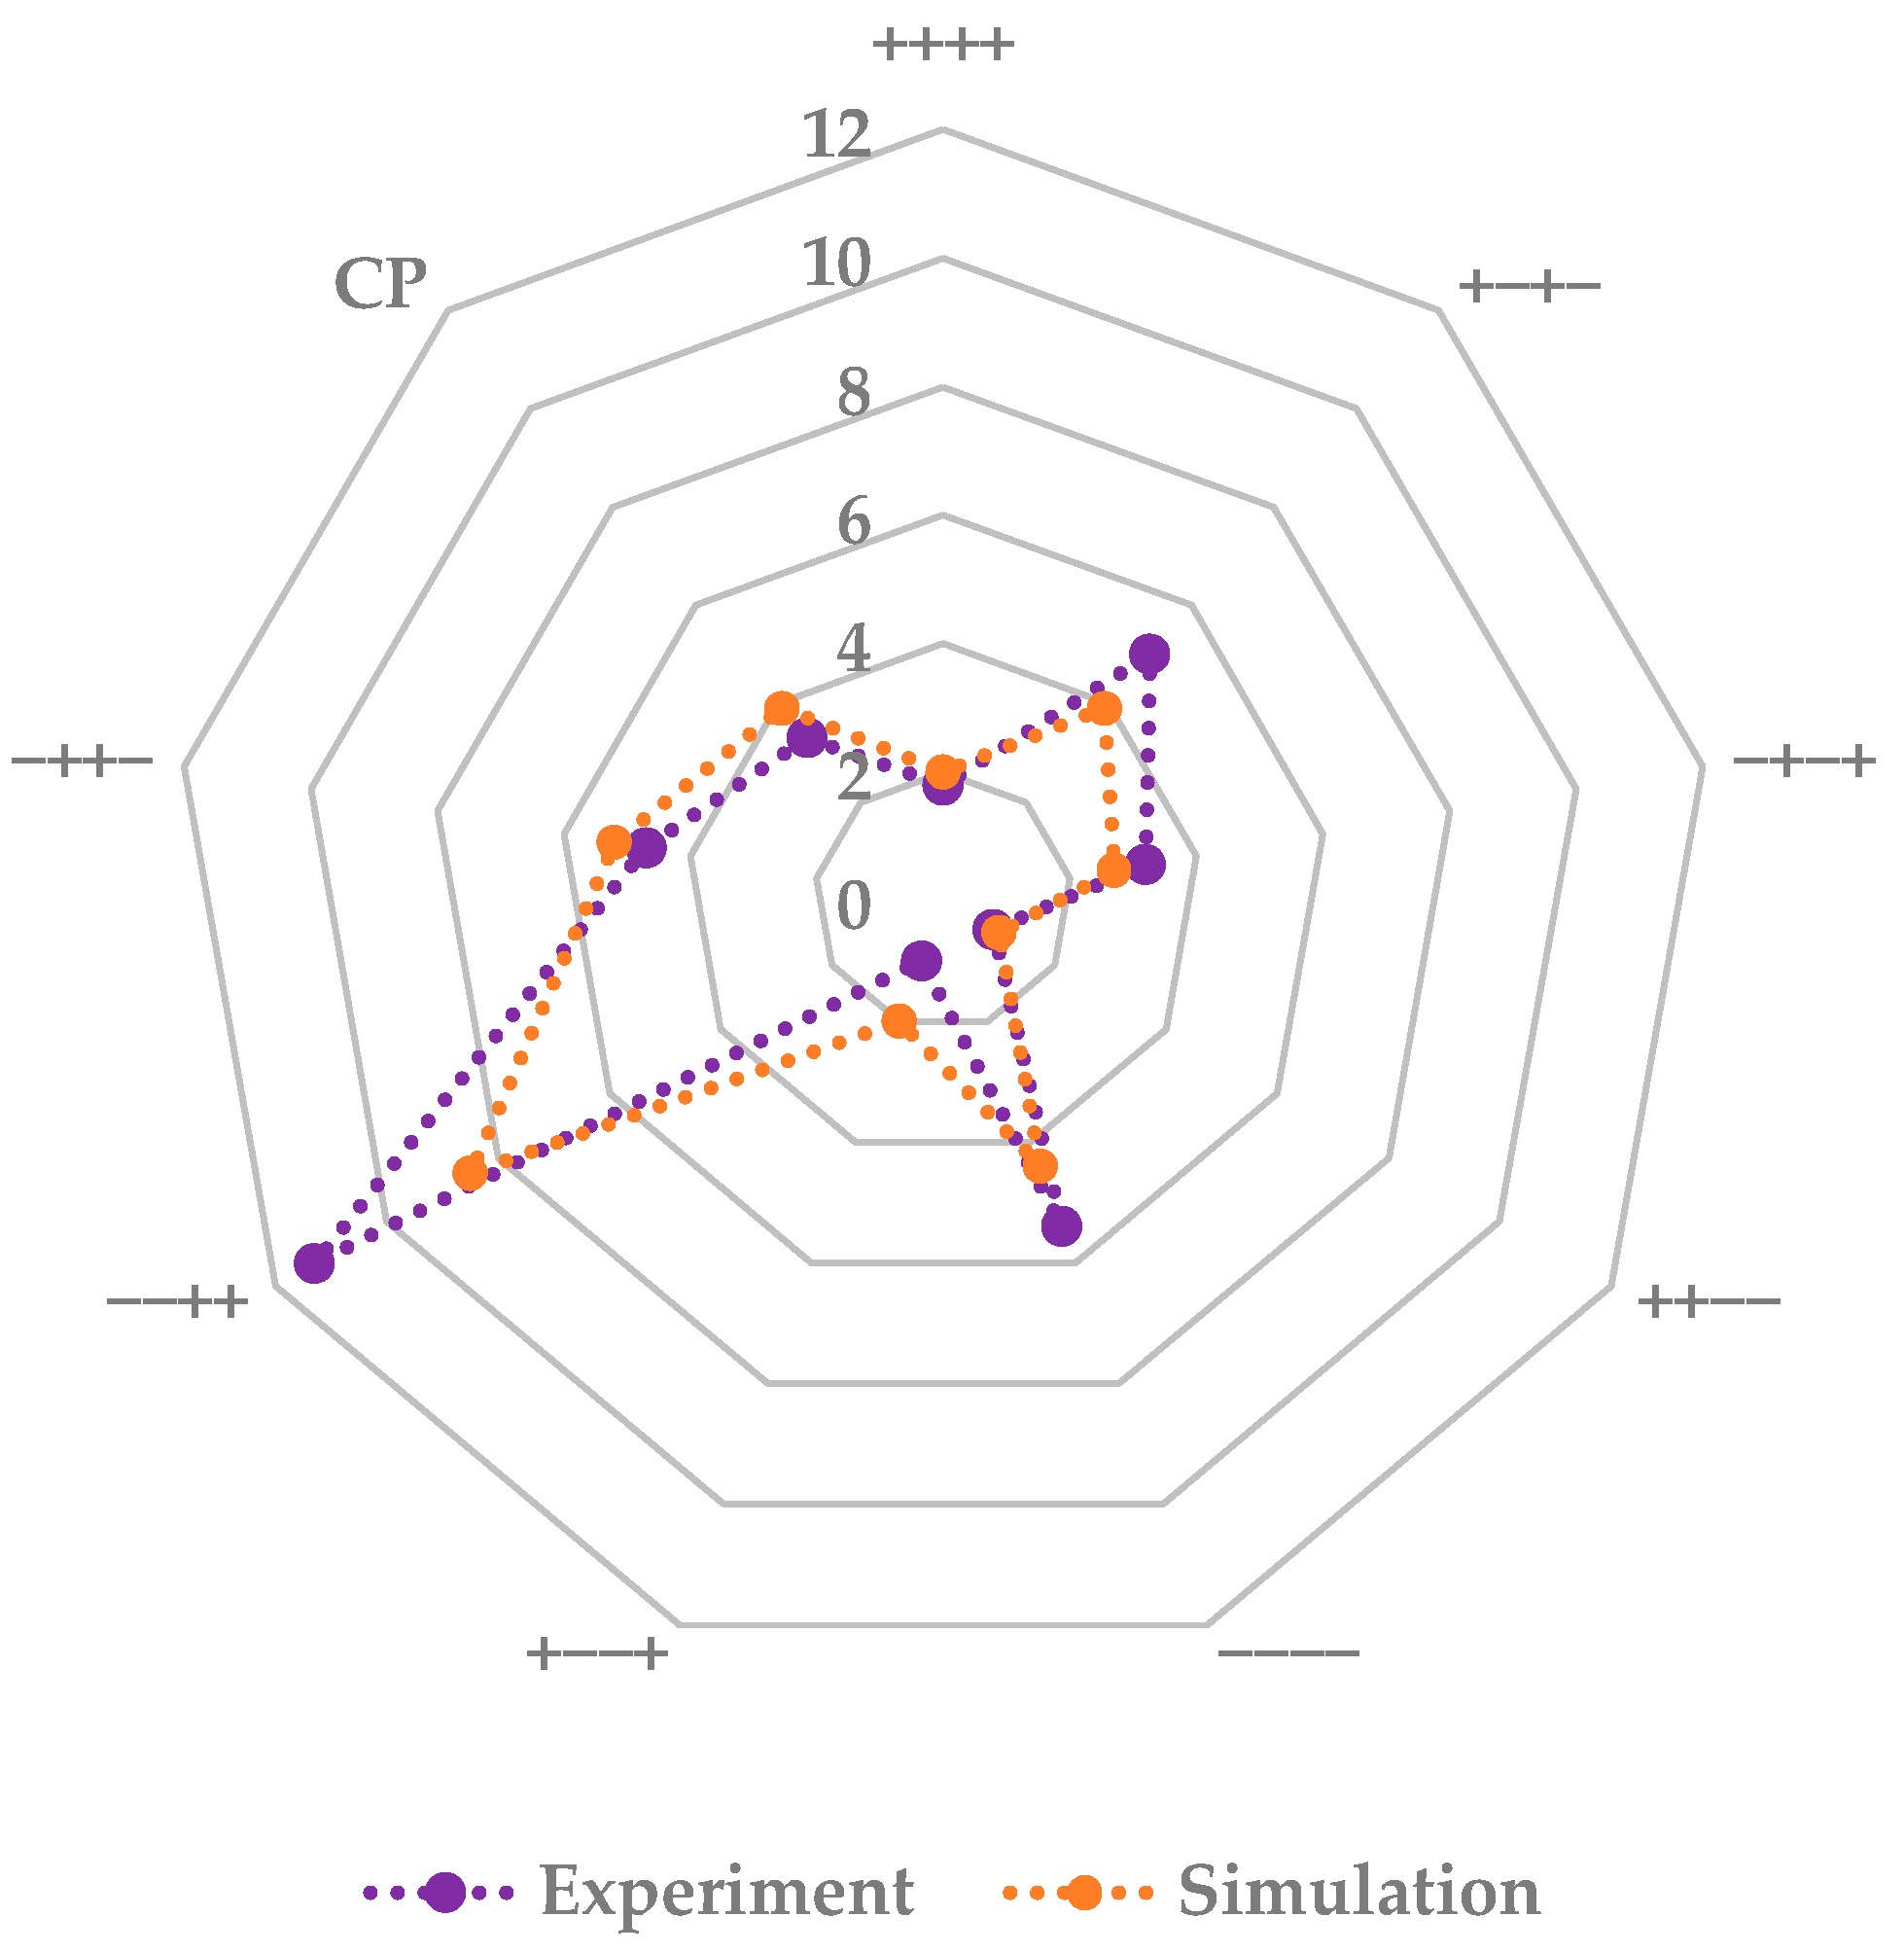
3. Results
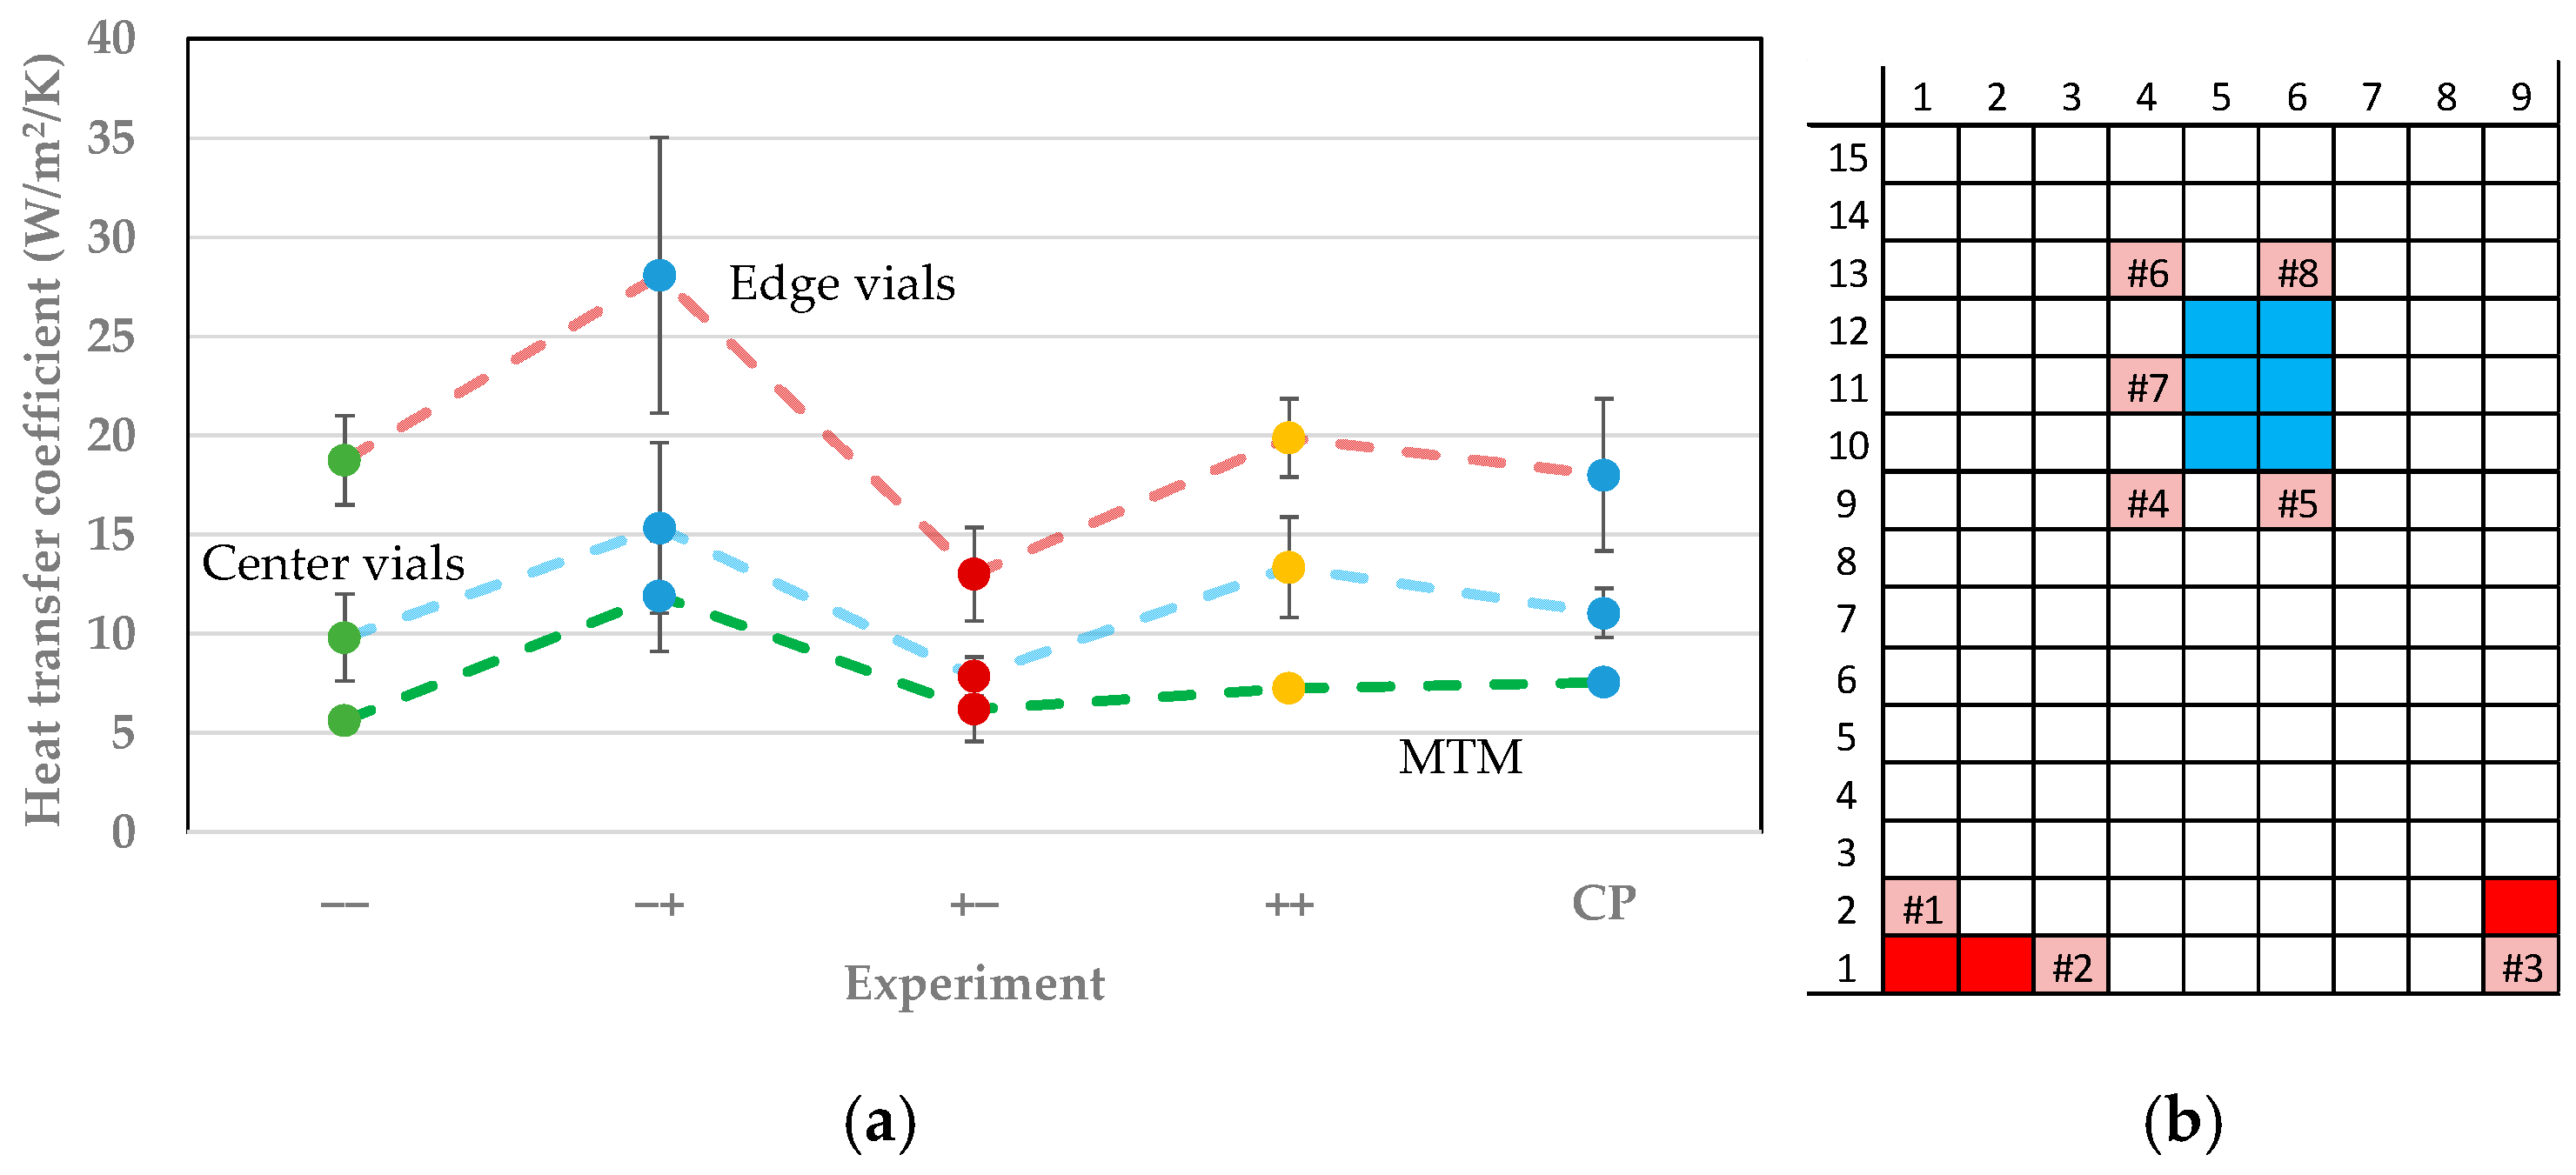
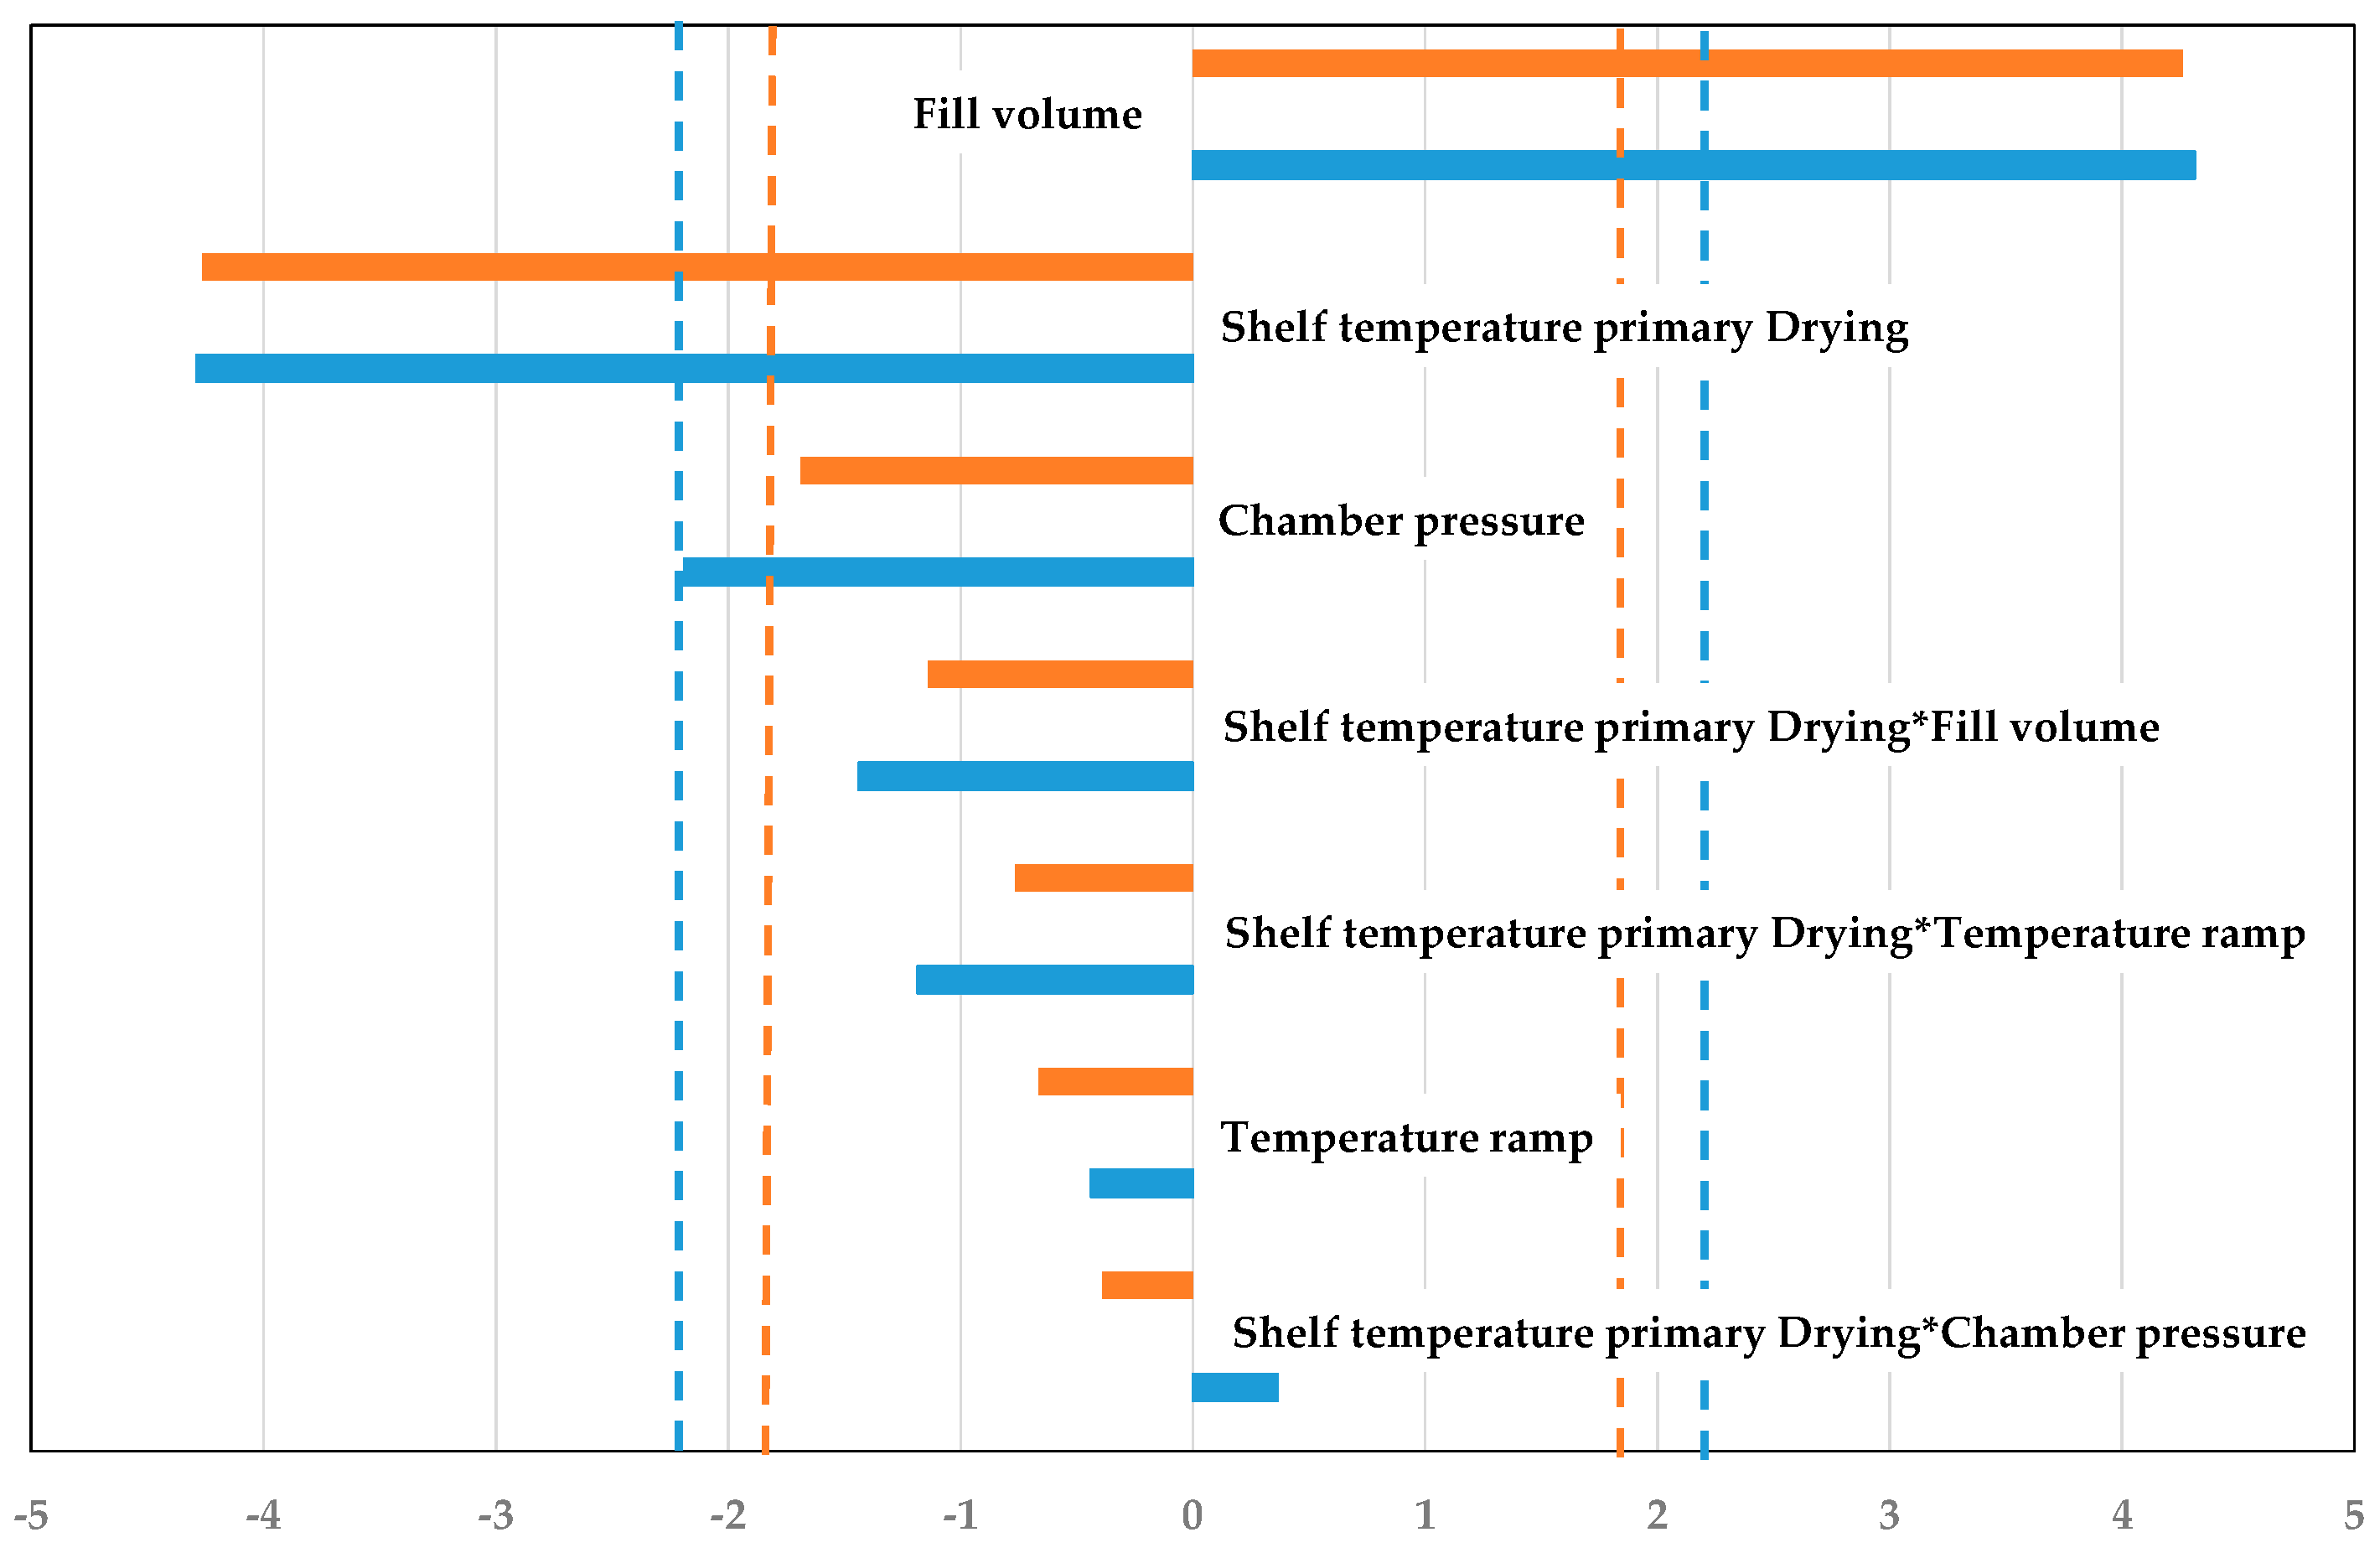
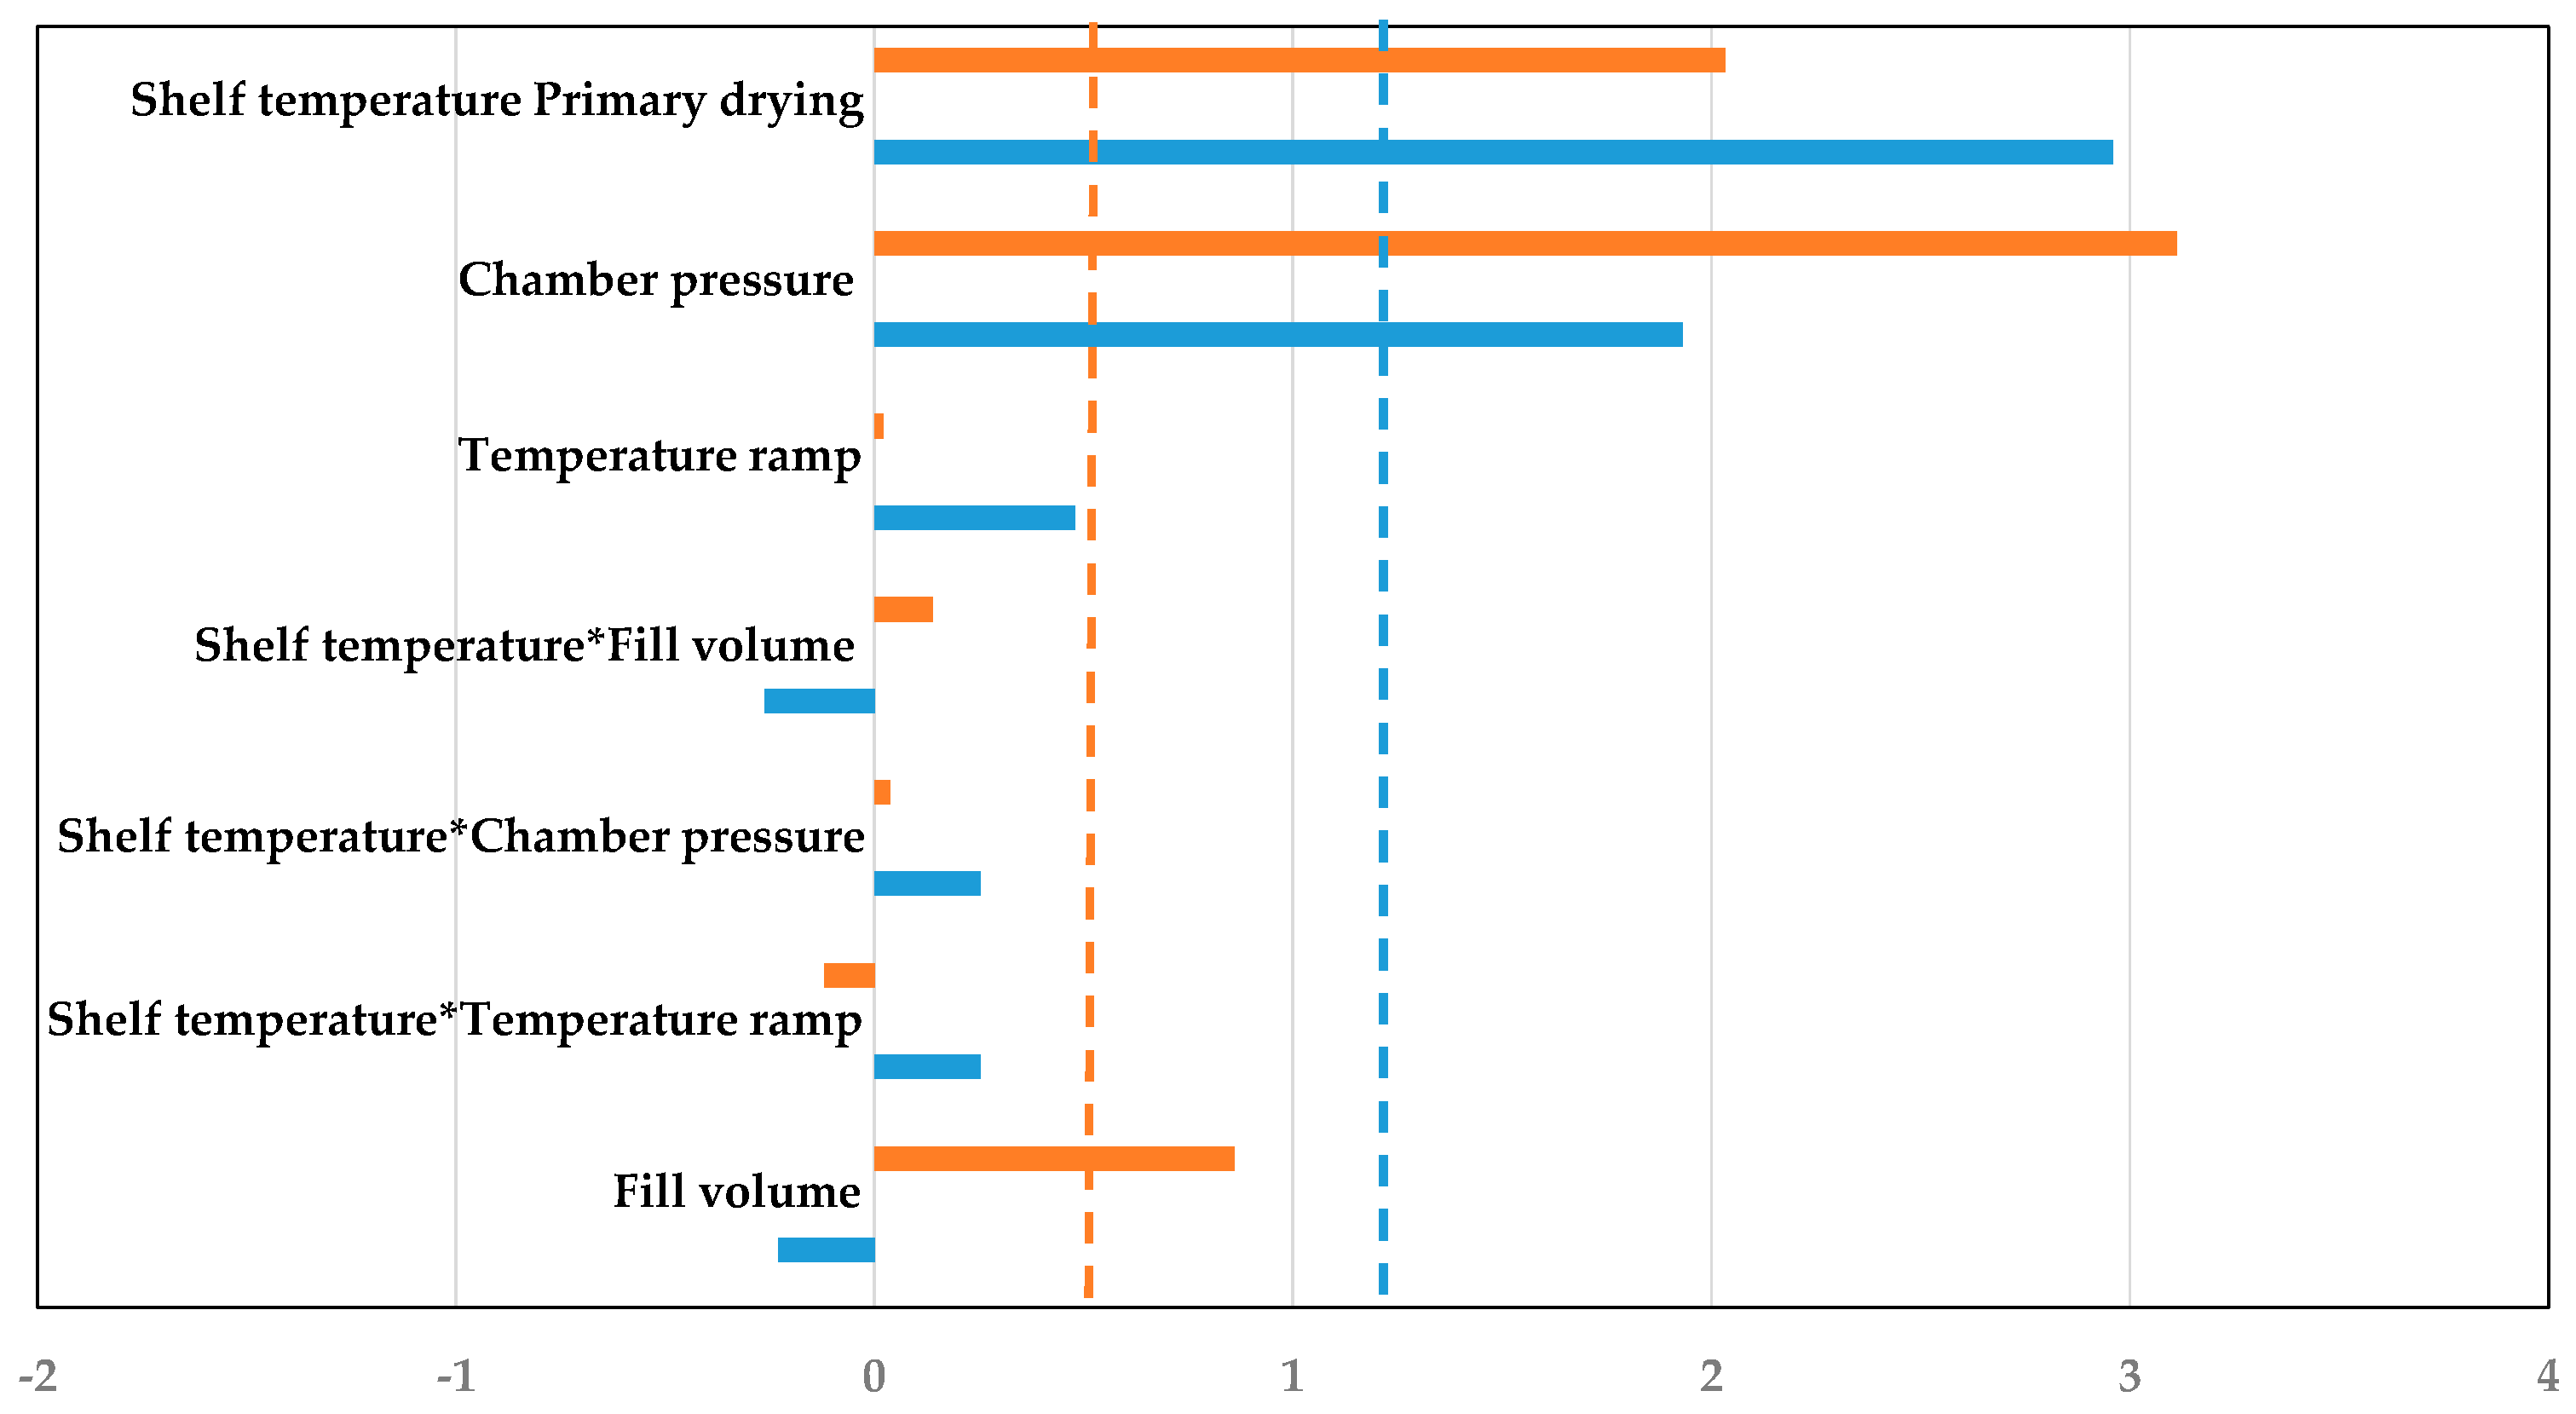
3.1. Vial Heat Transfer Coefficient
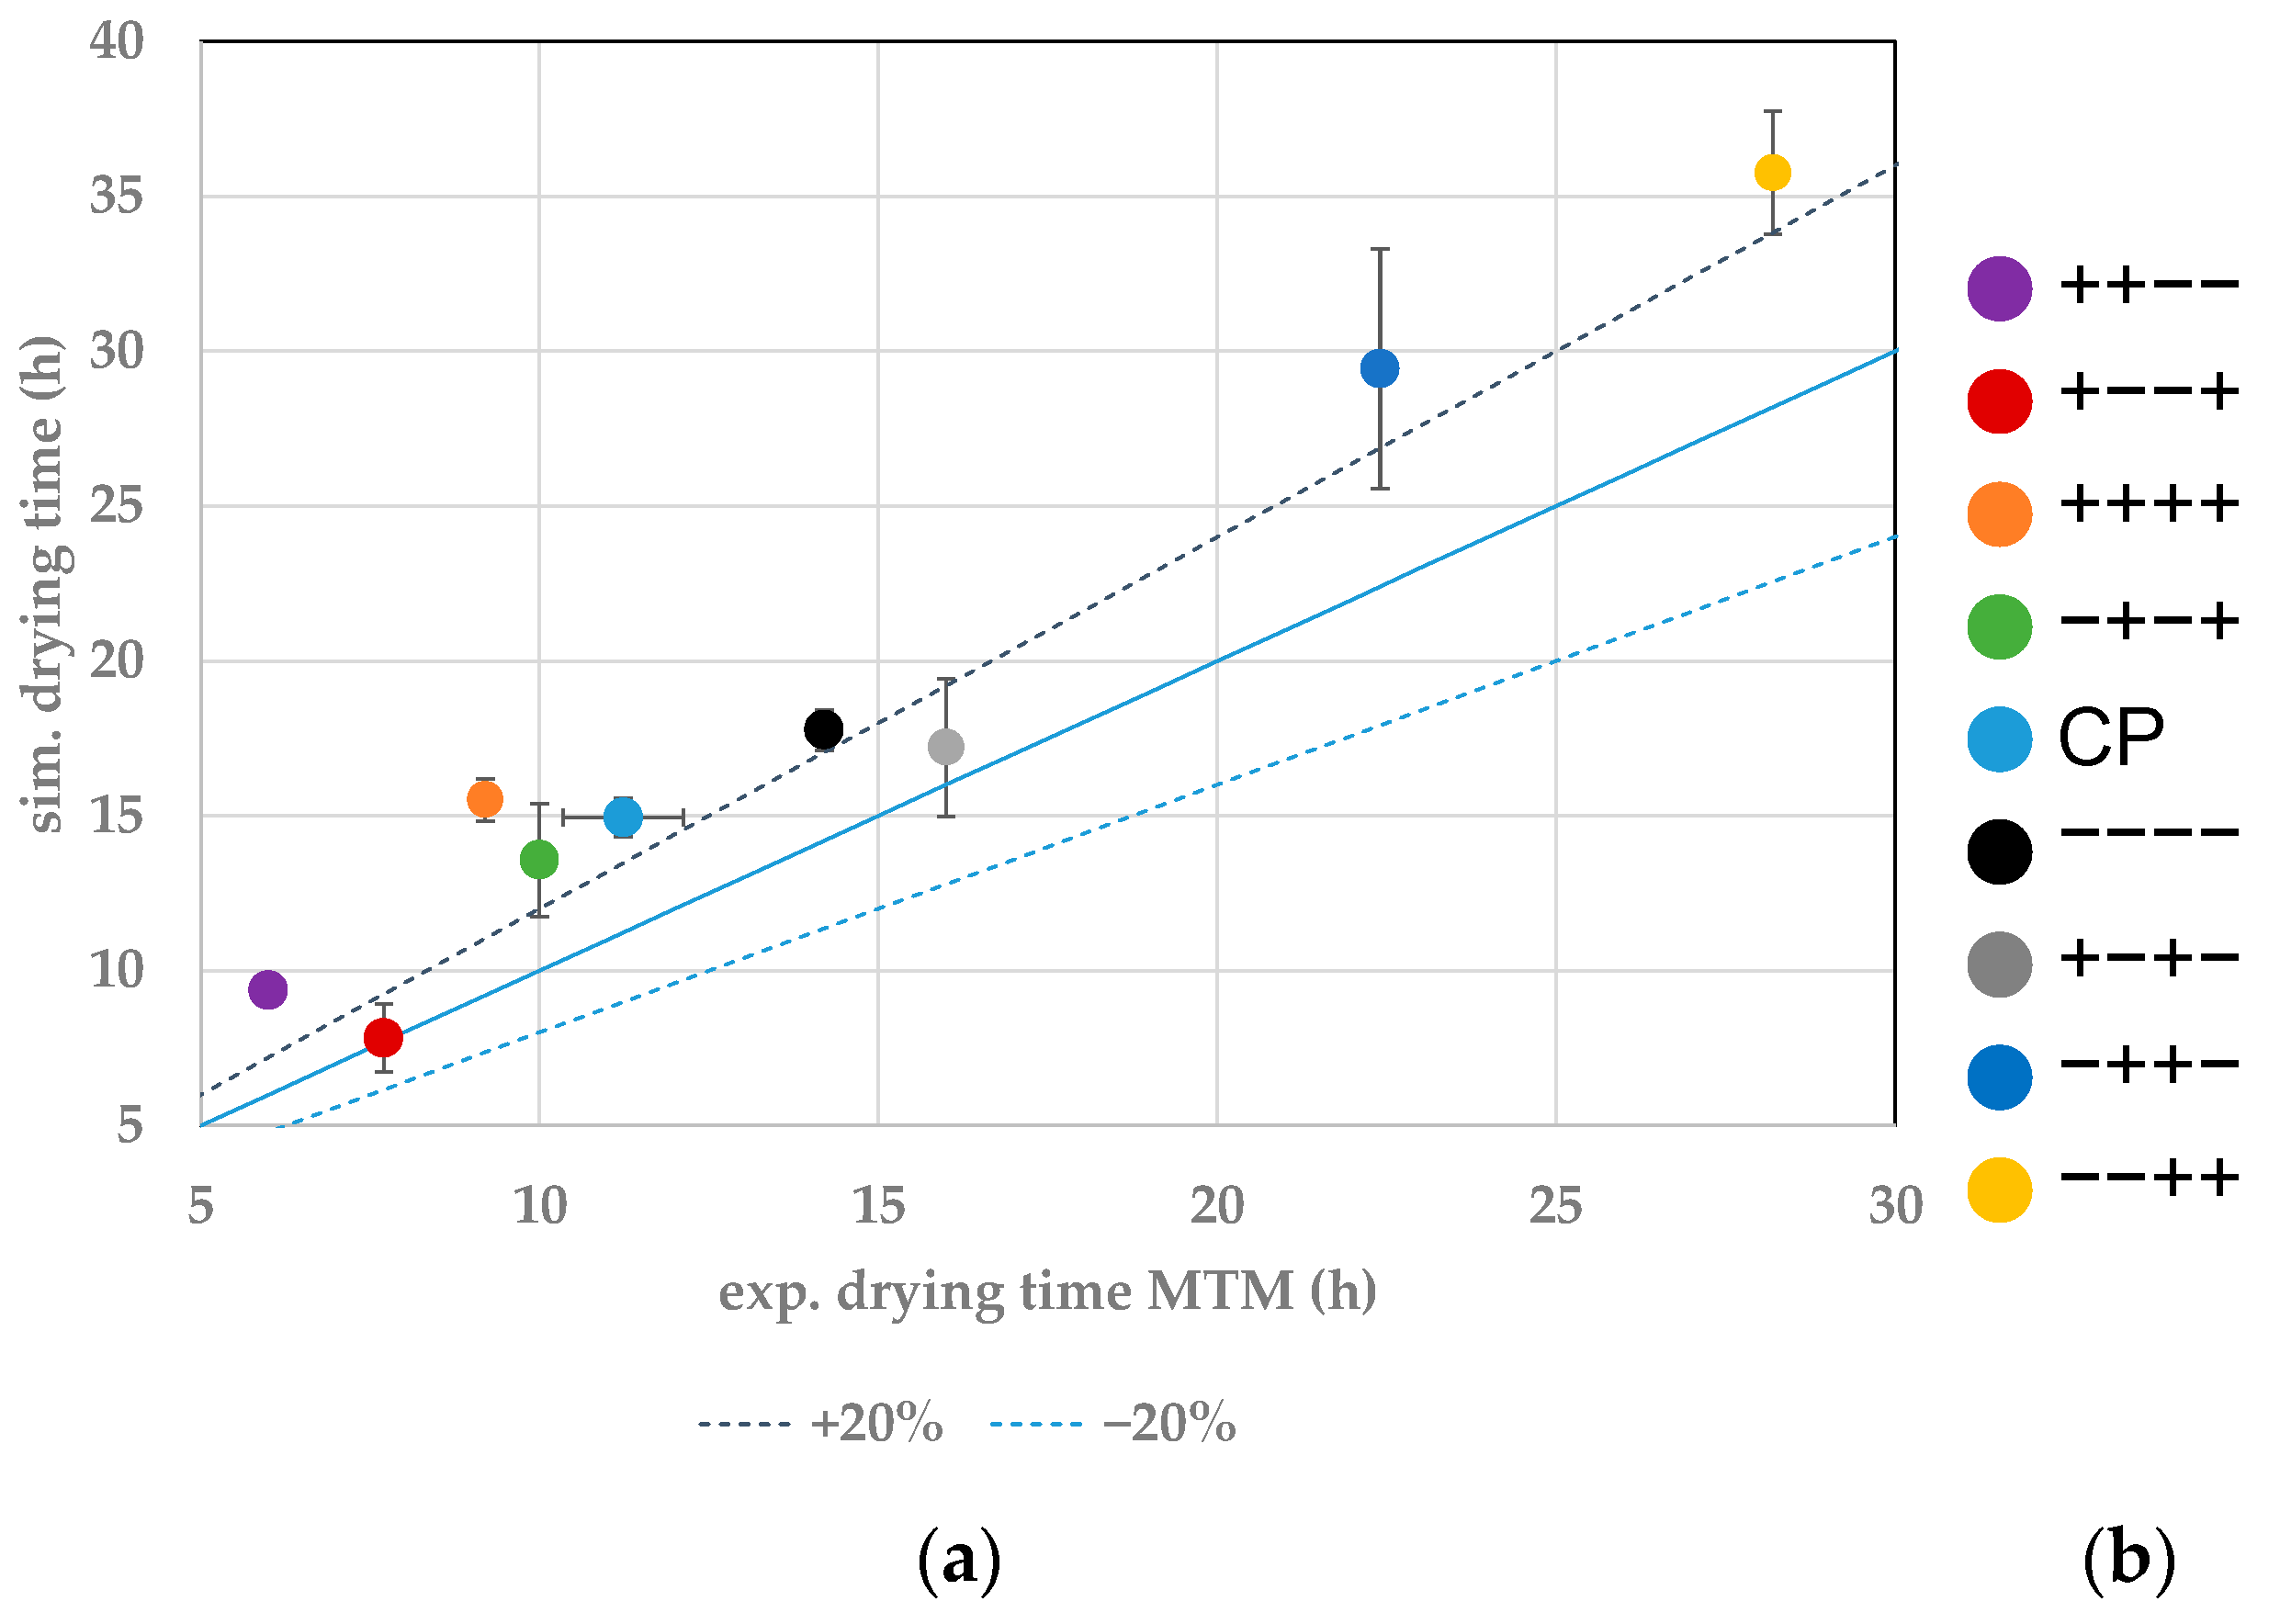
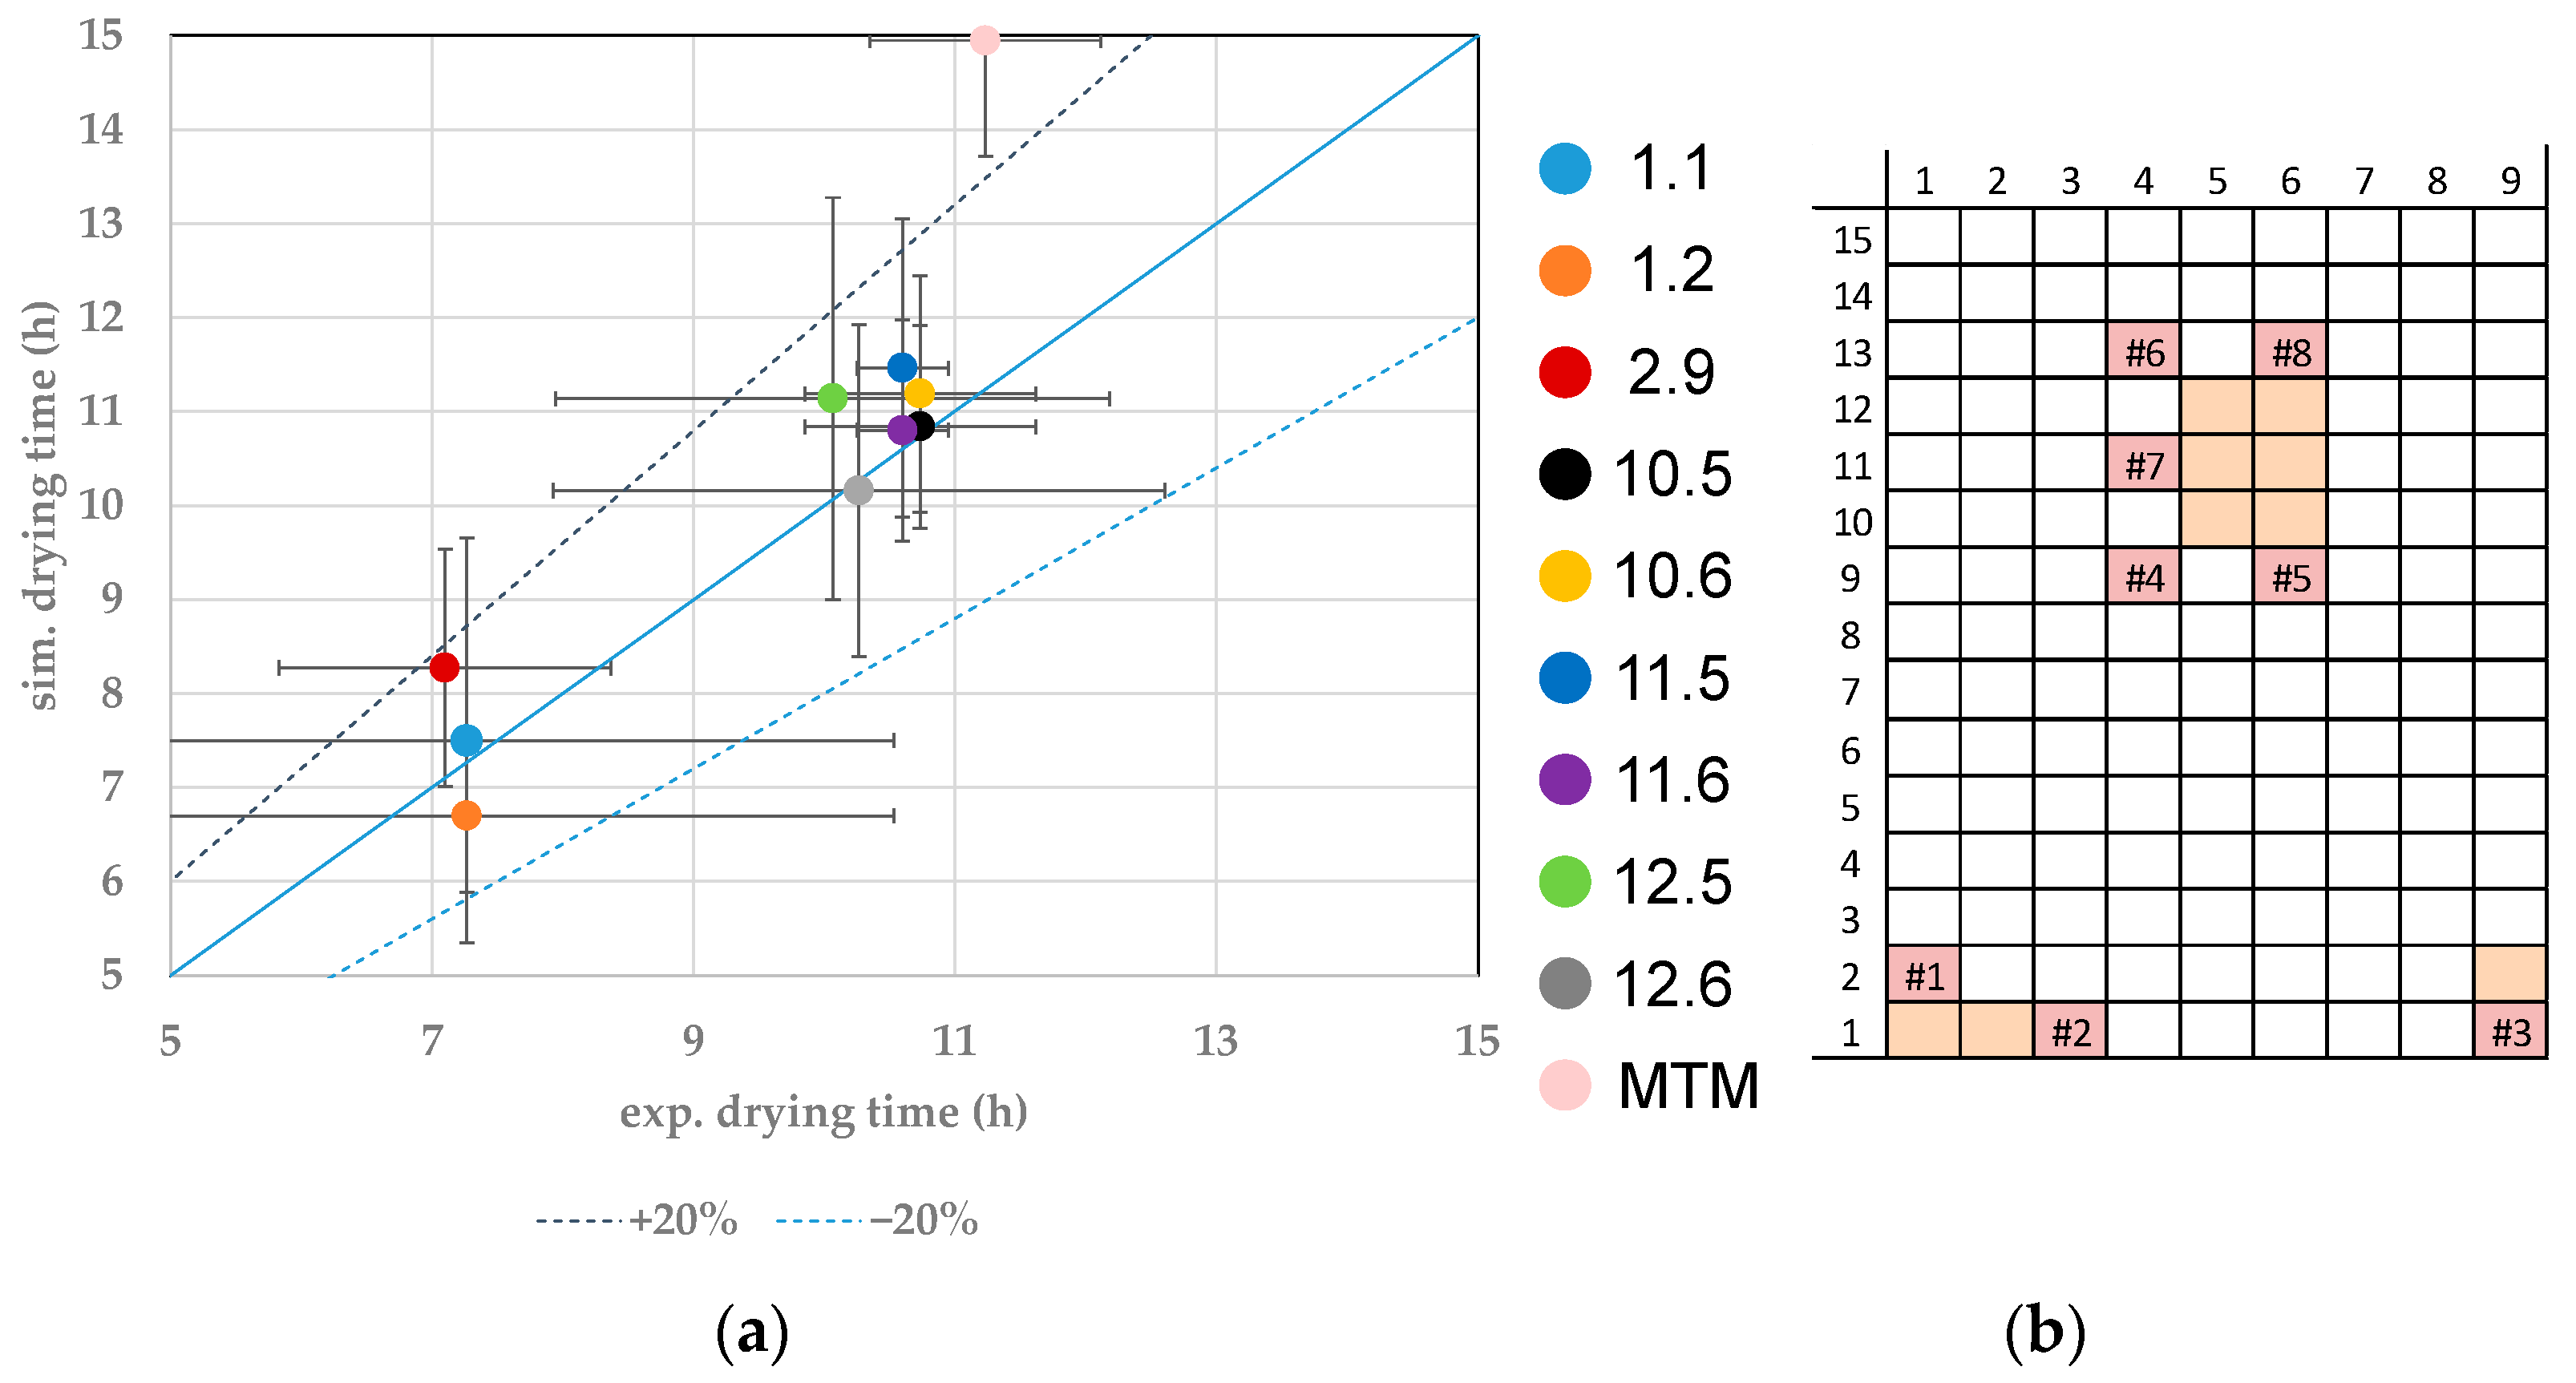
3.2. Dry Layer Resistance
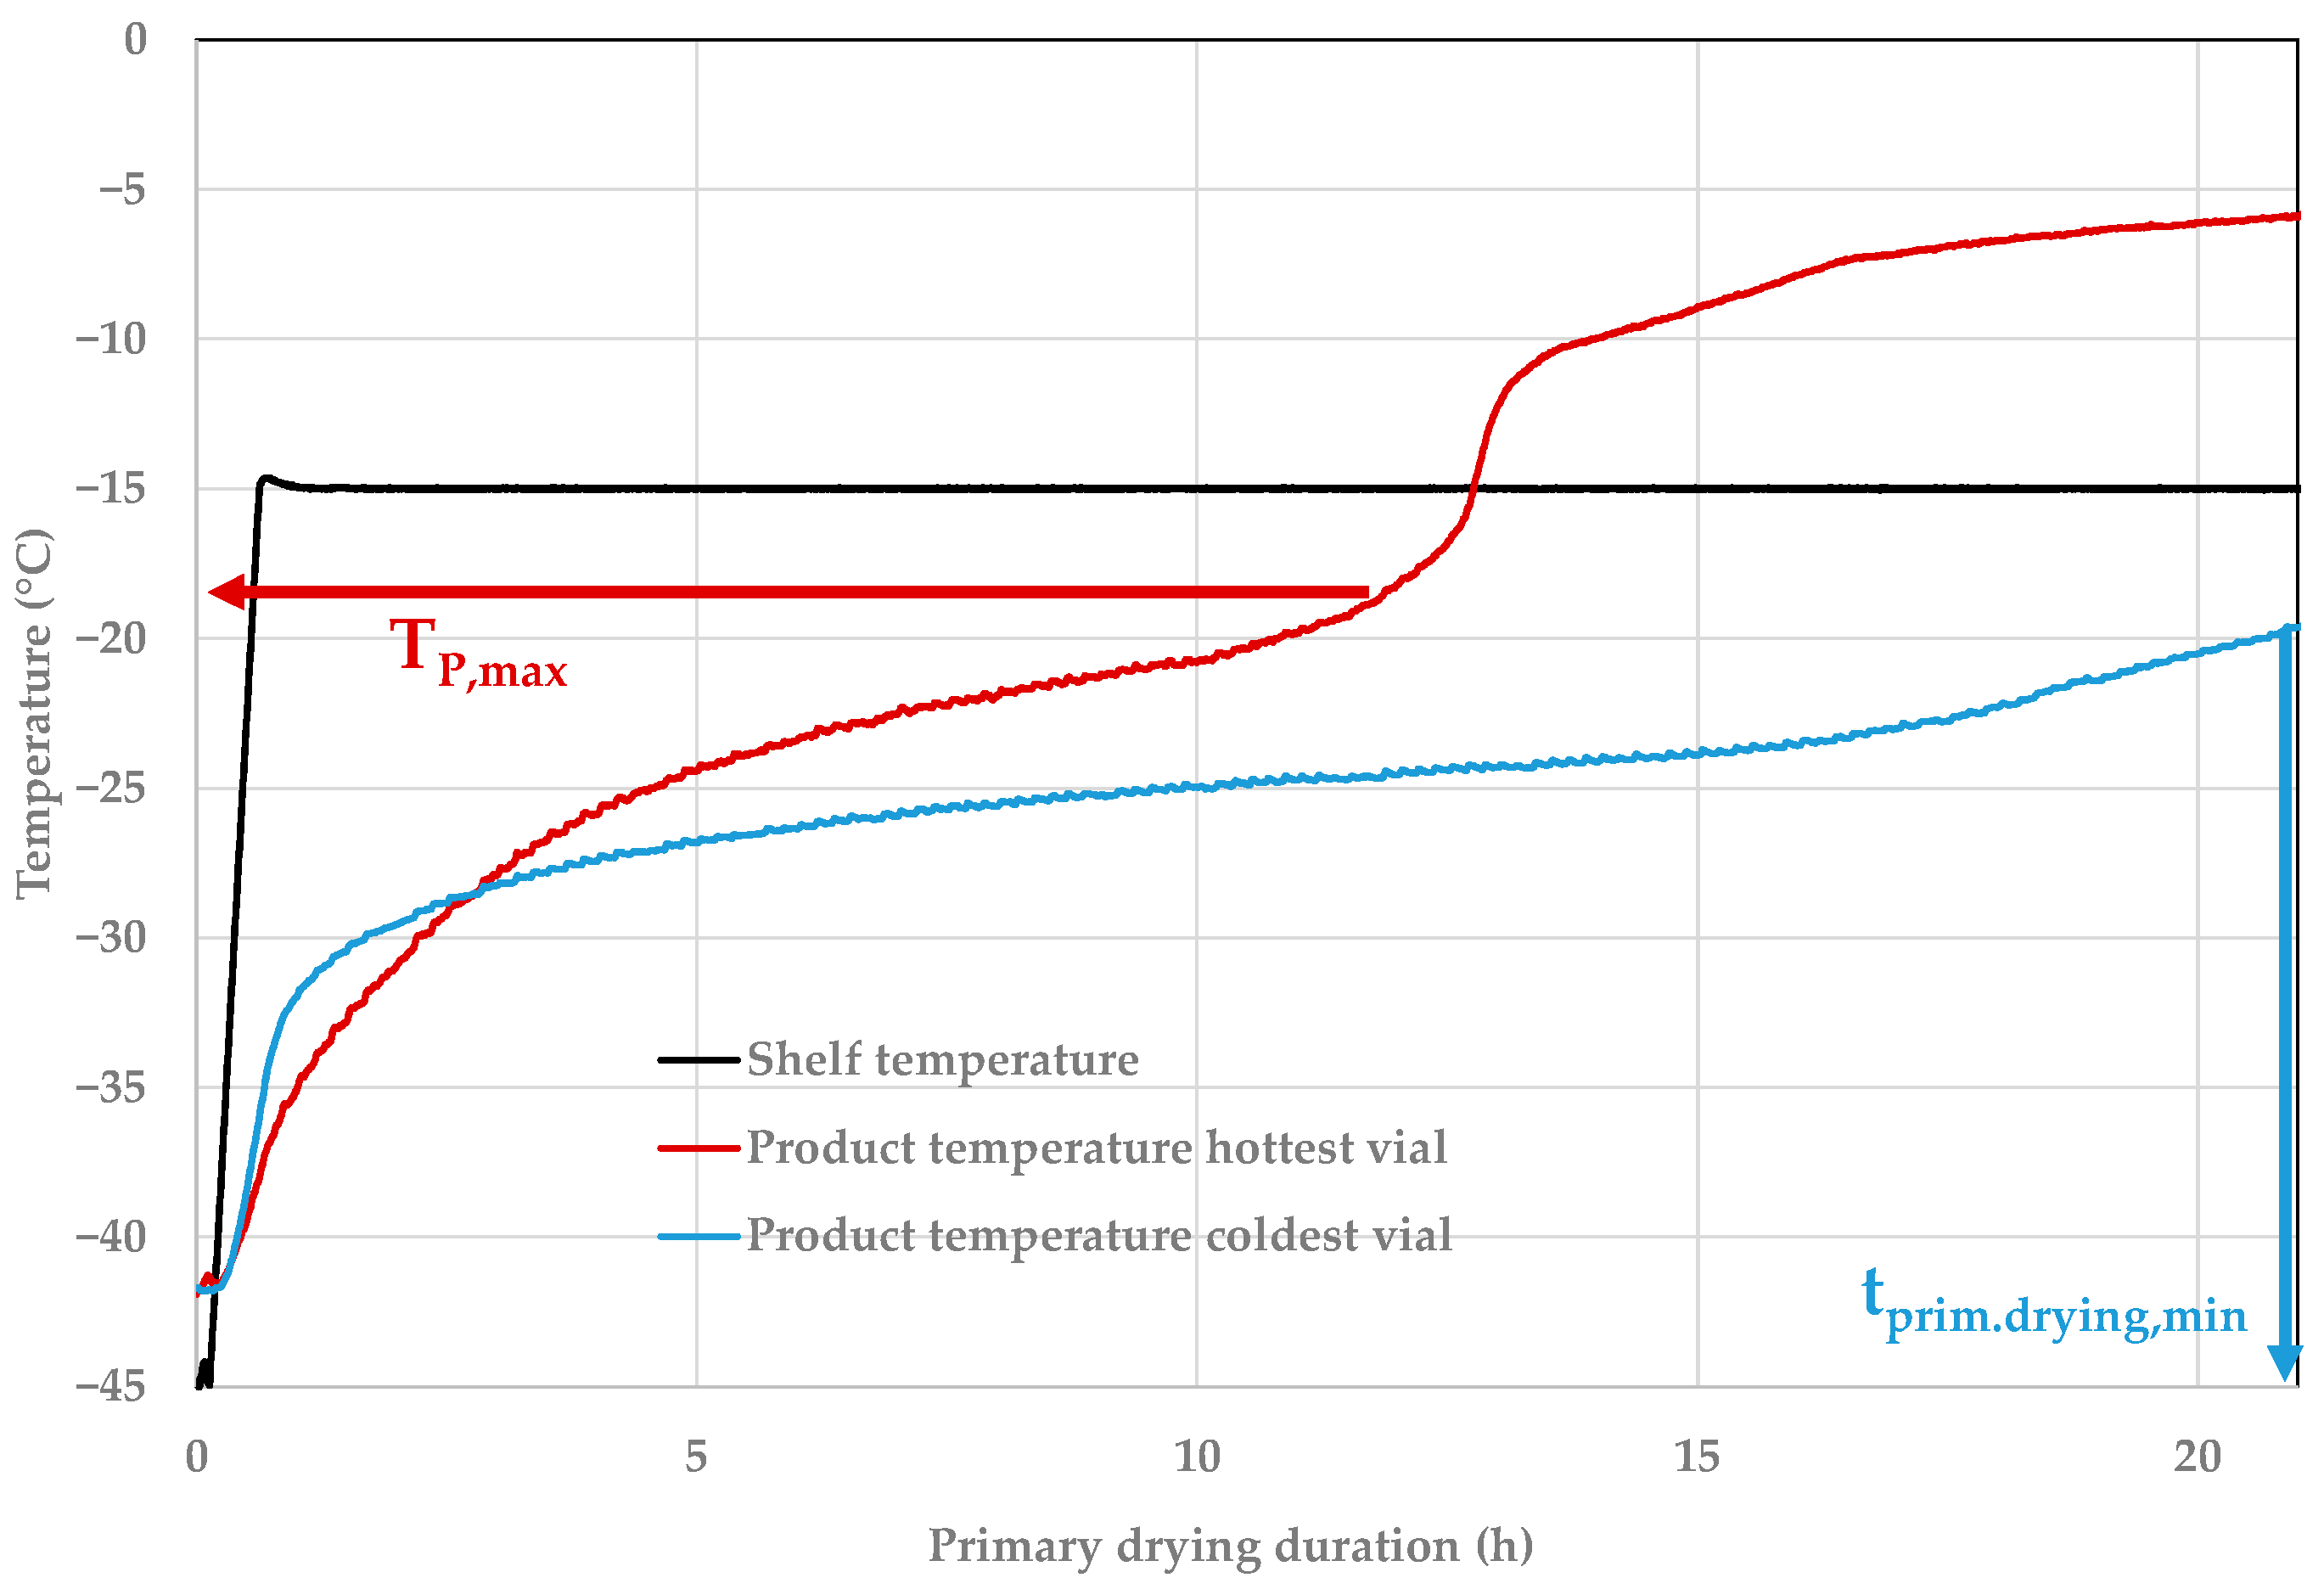
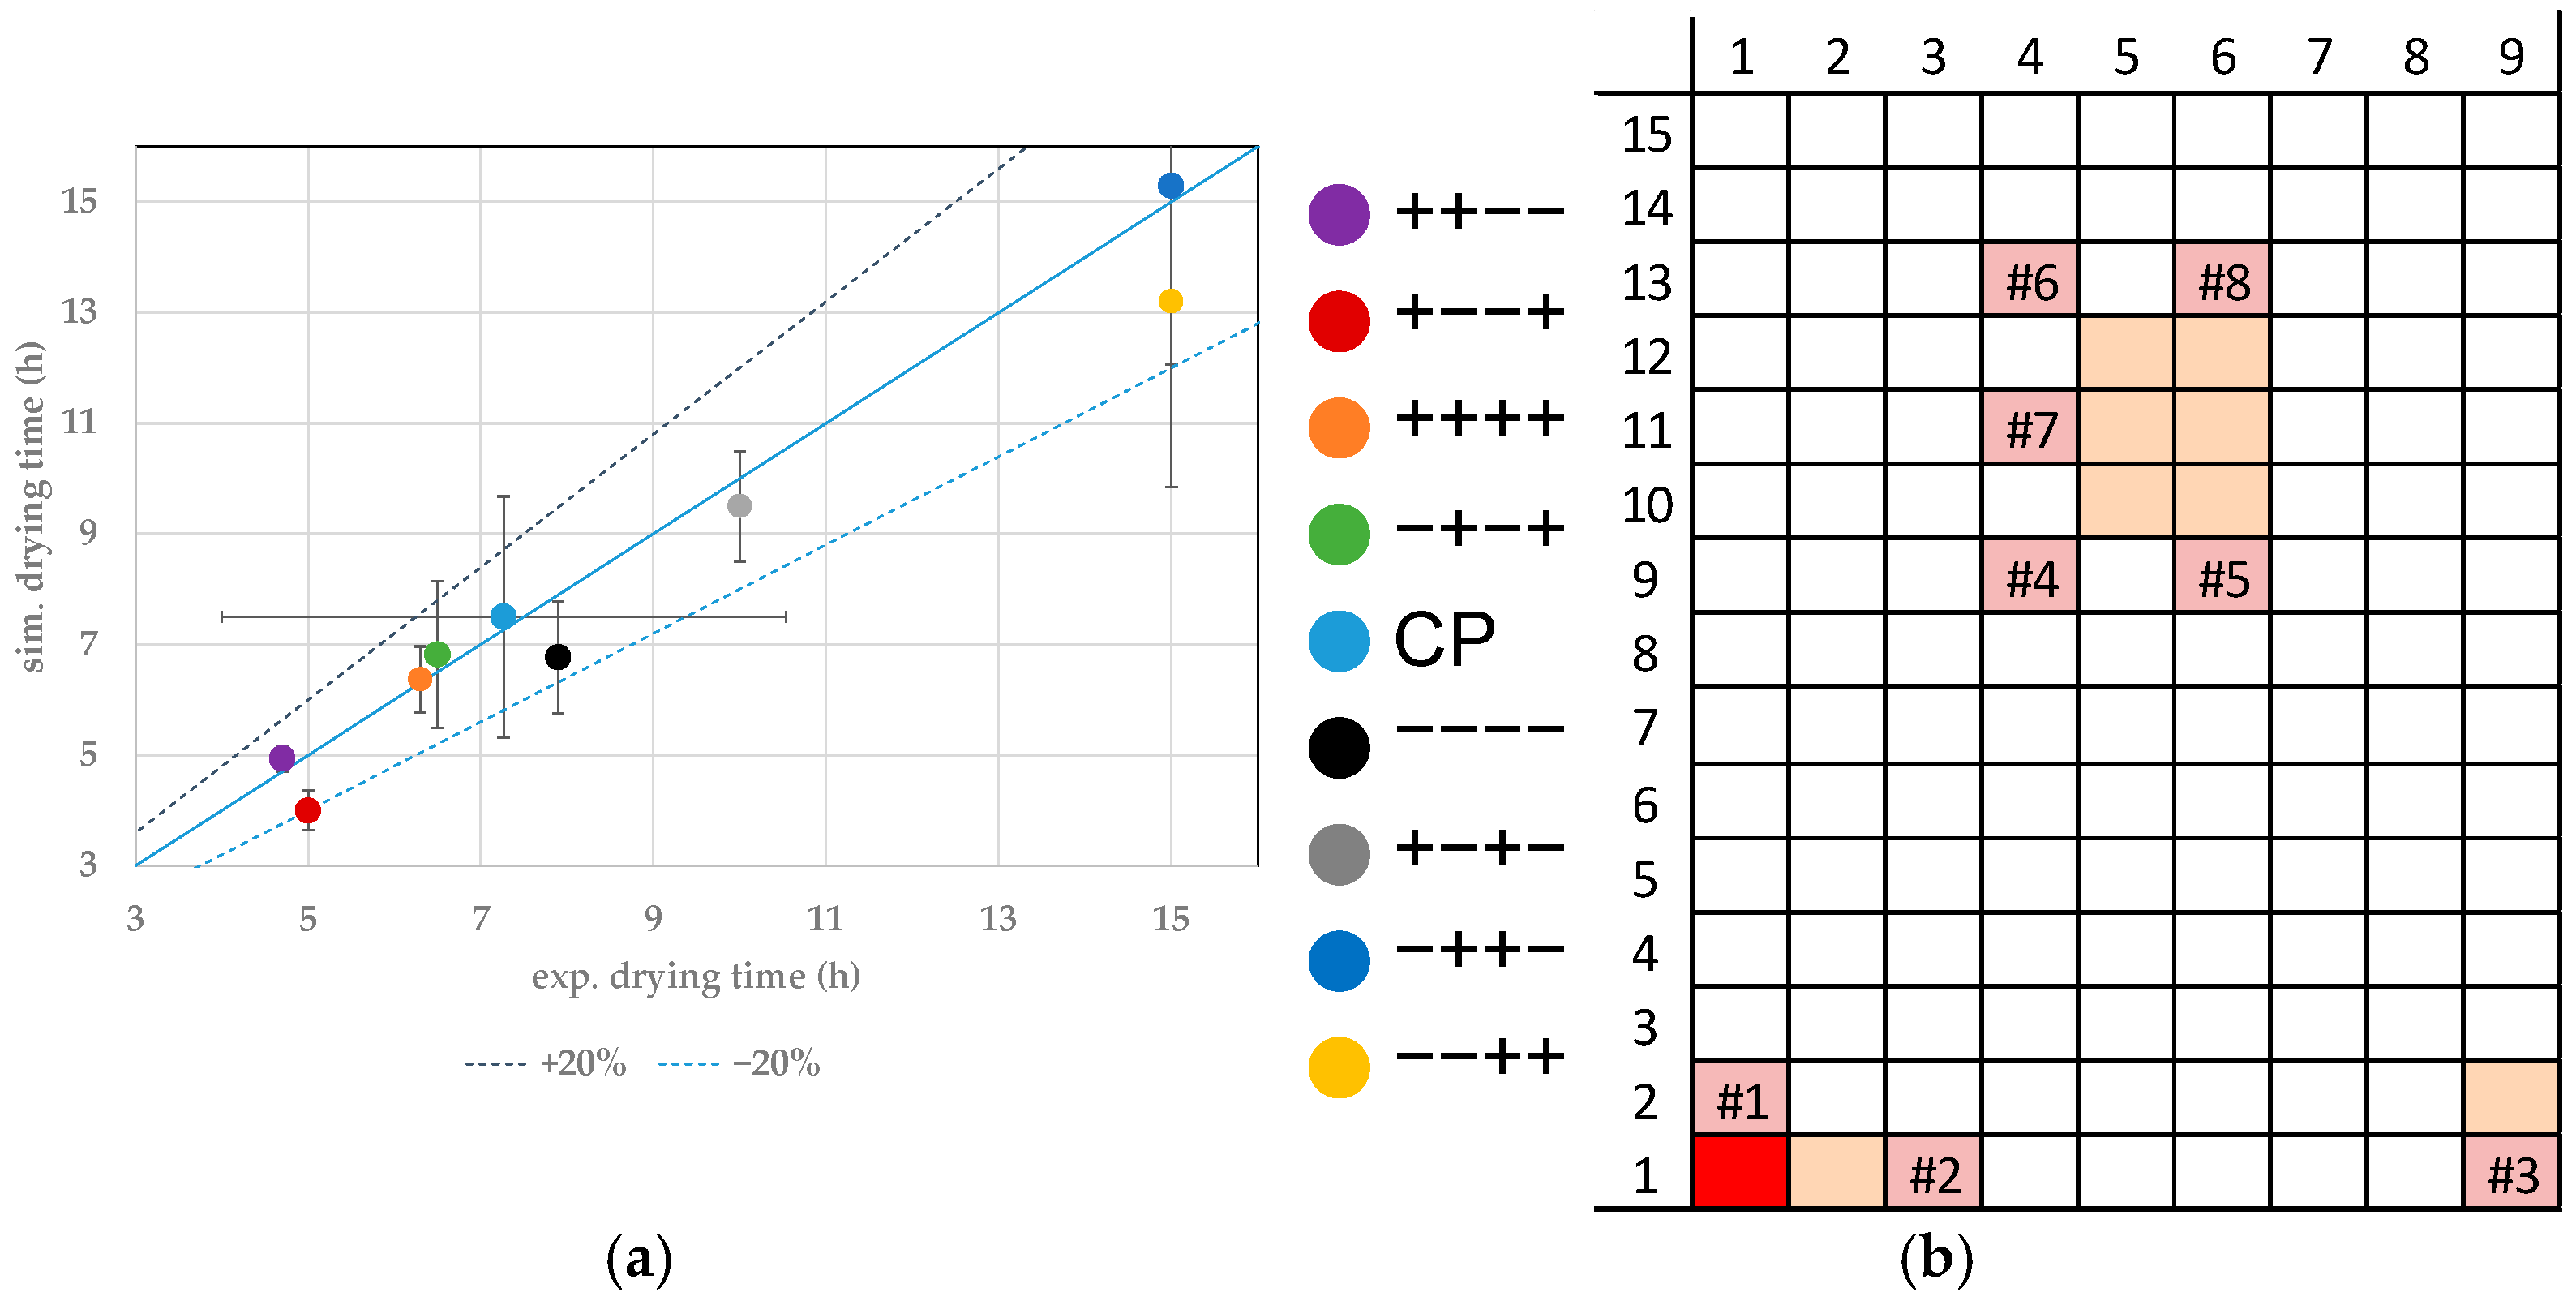
3.3. Endpoint Determination
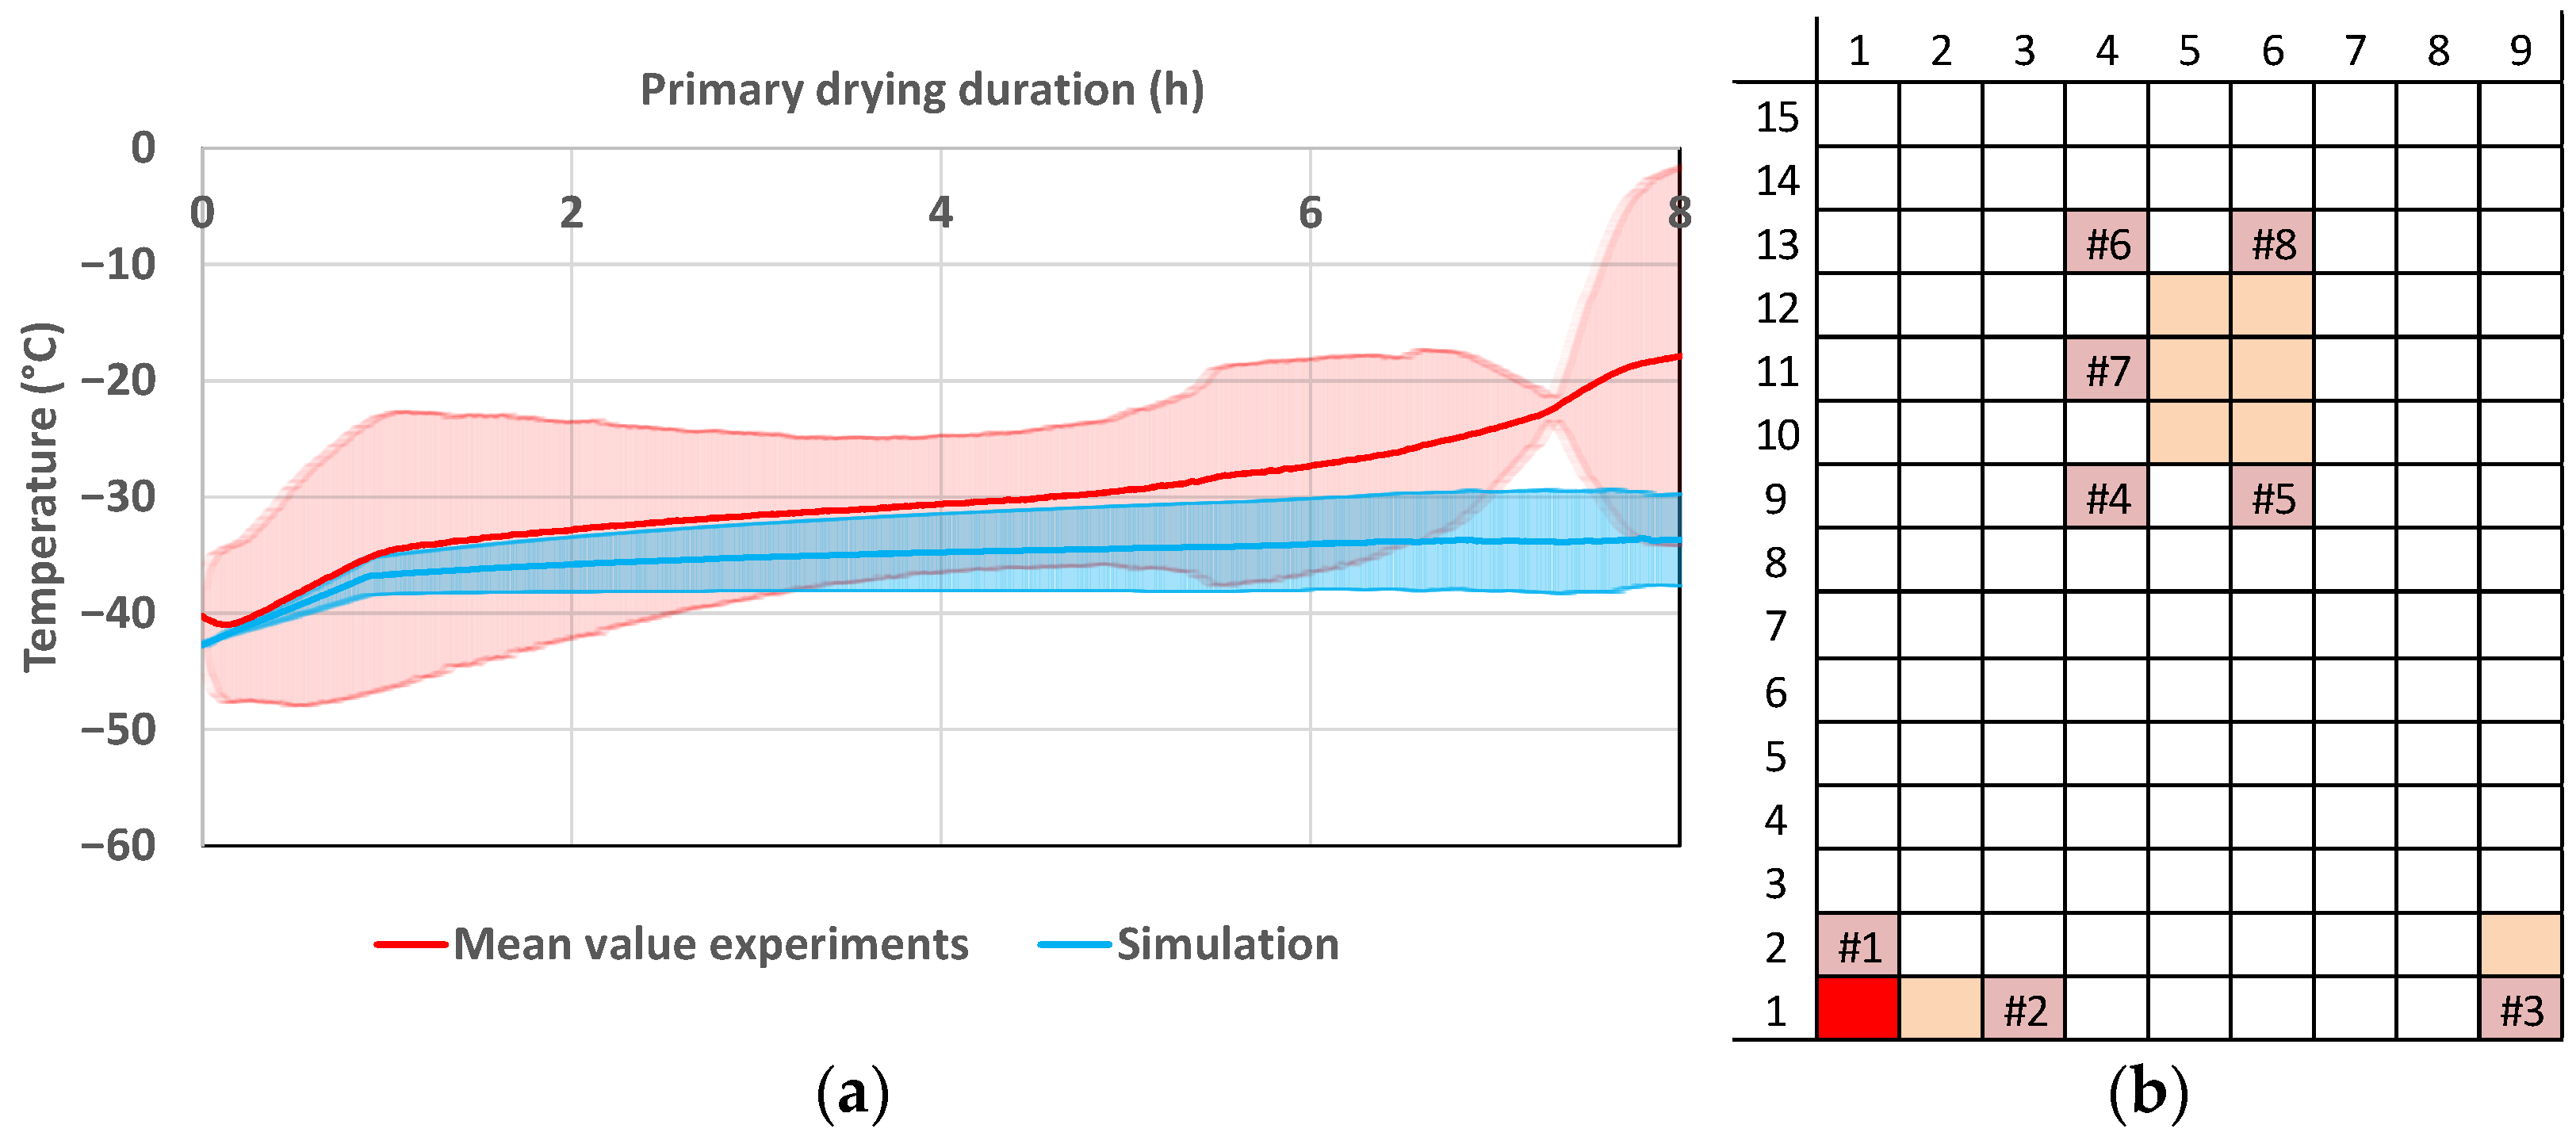
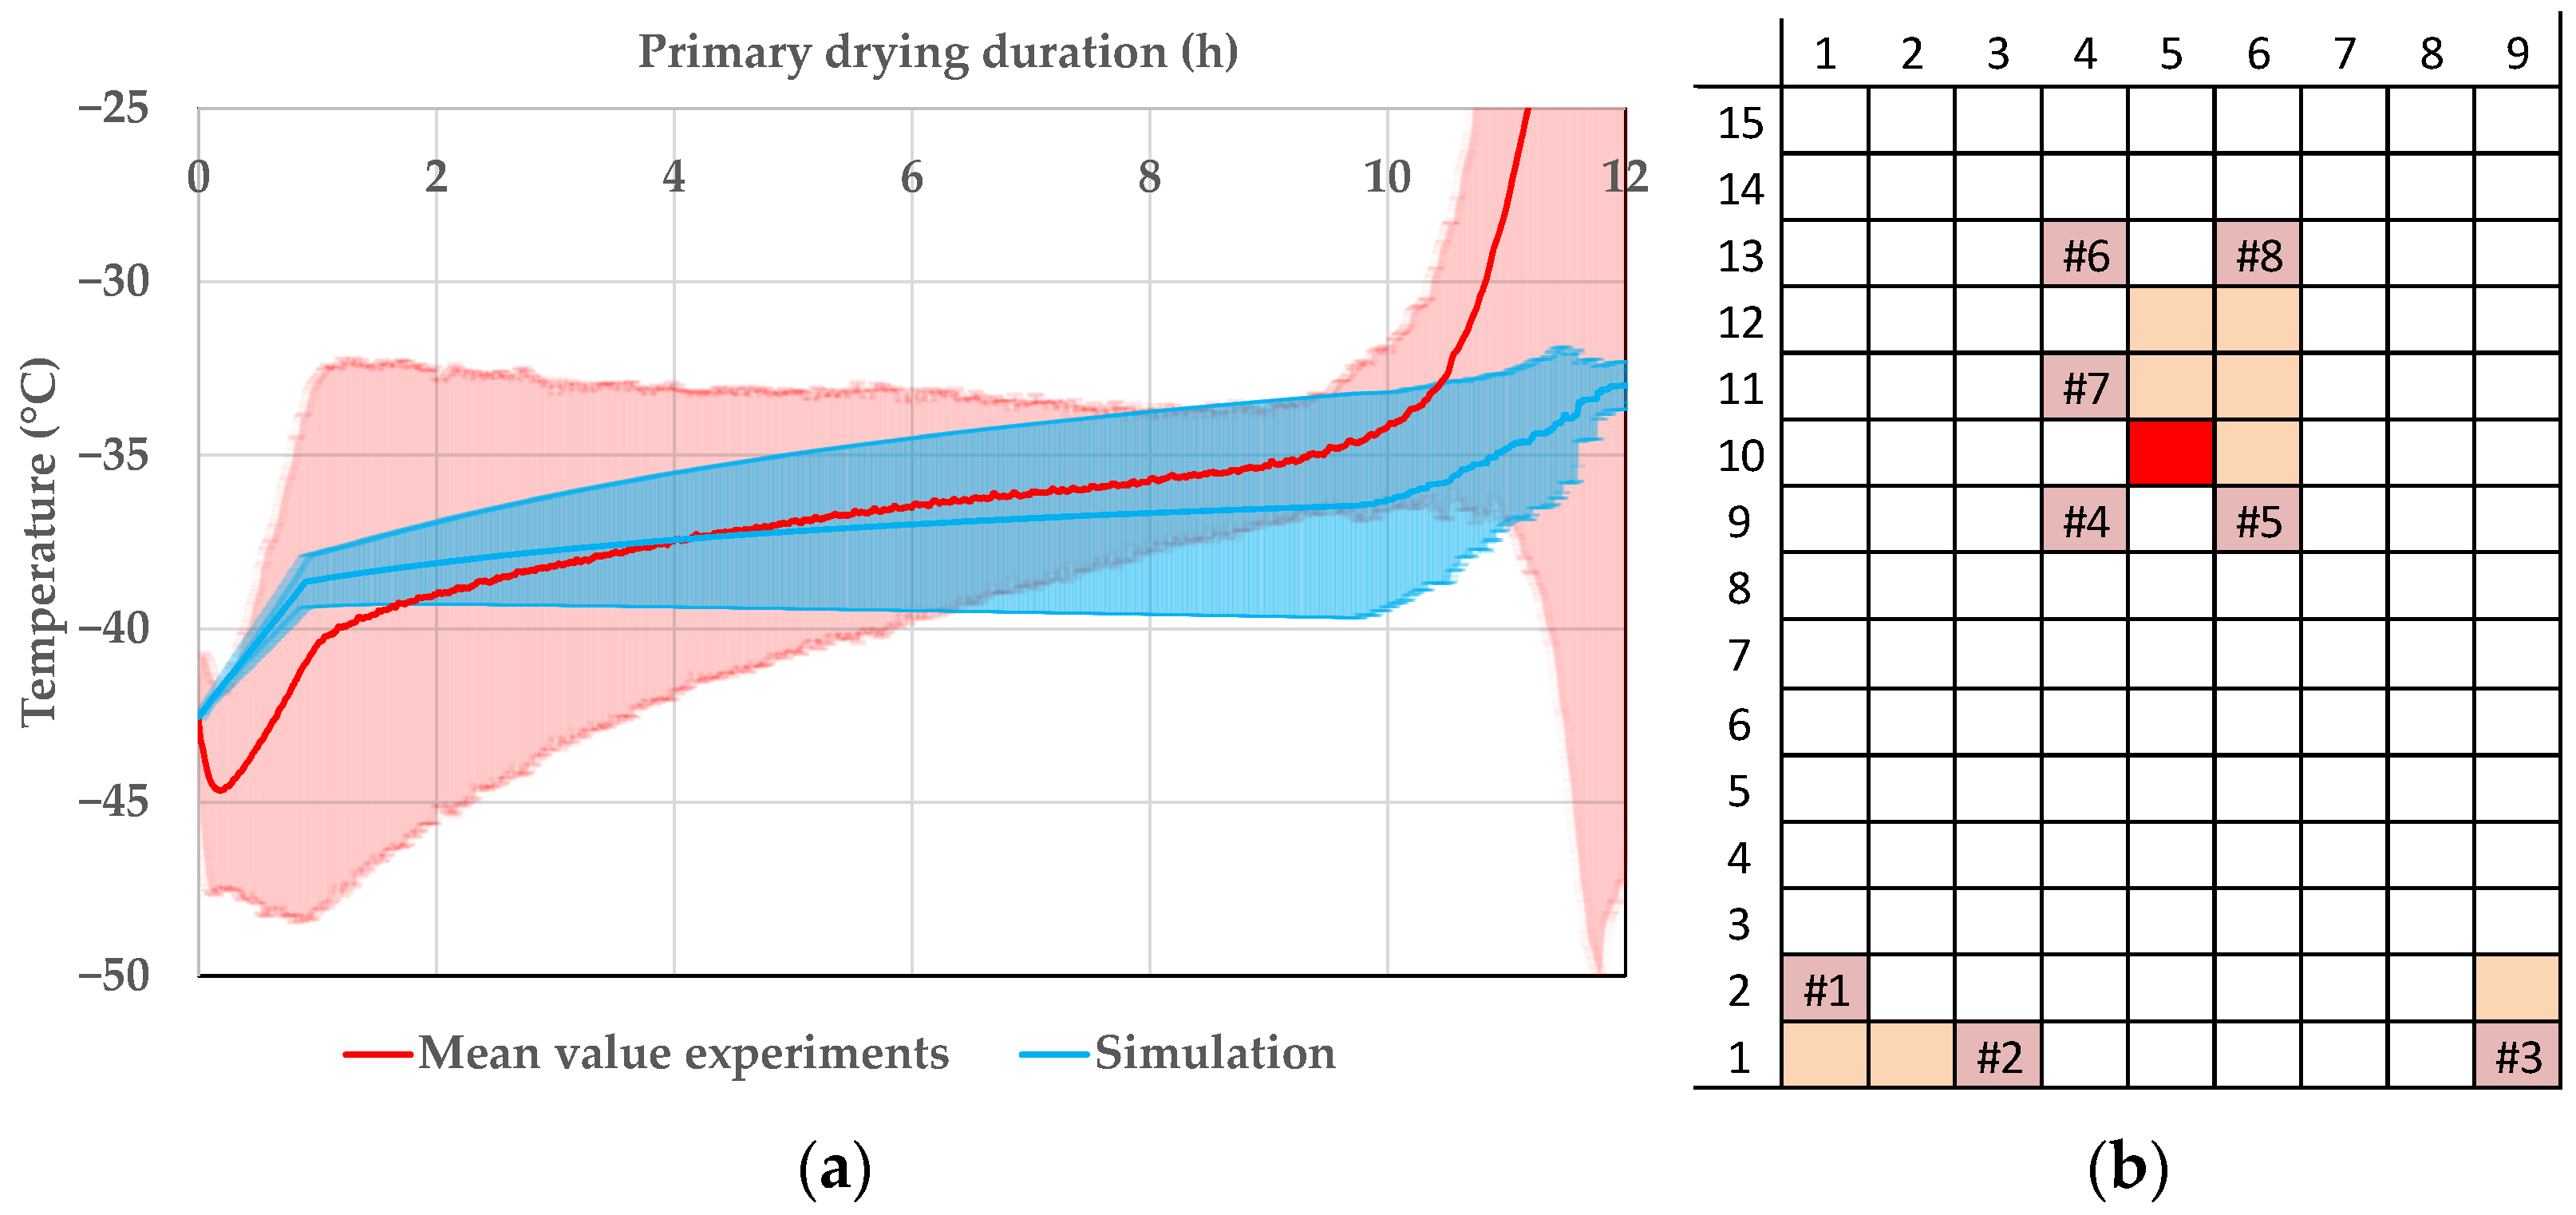
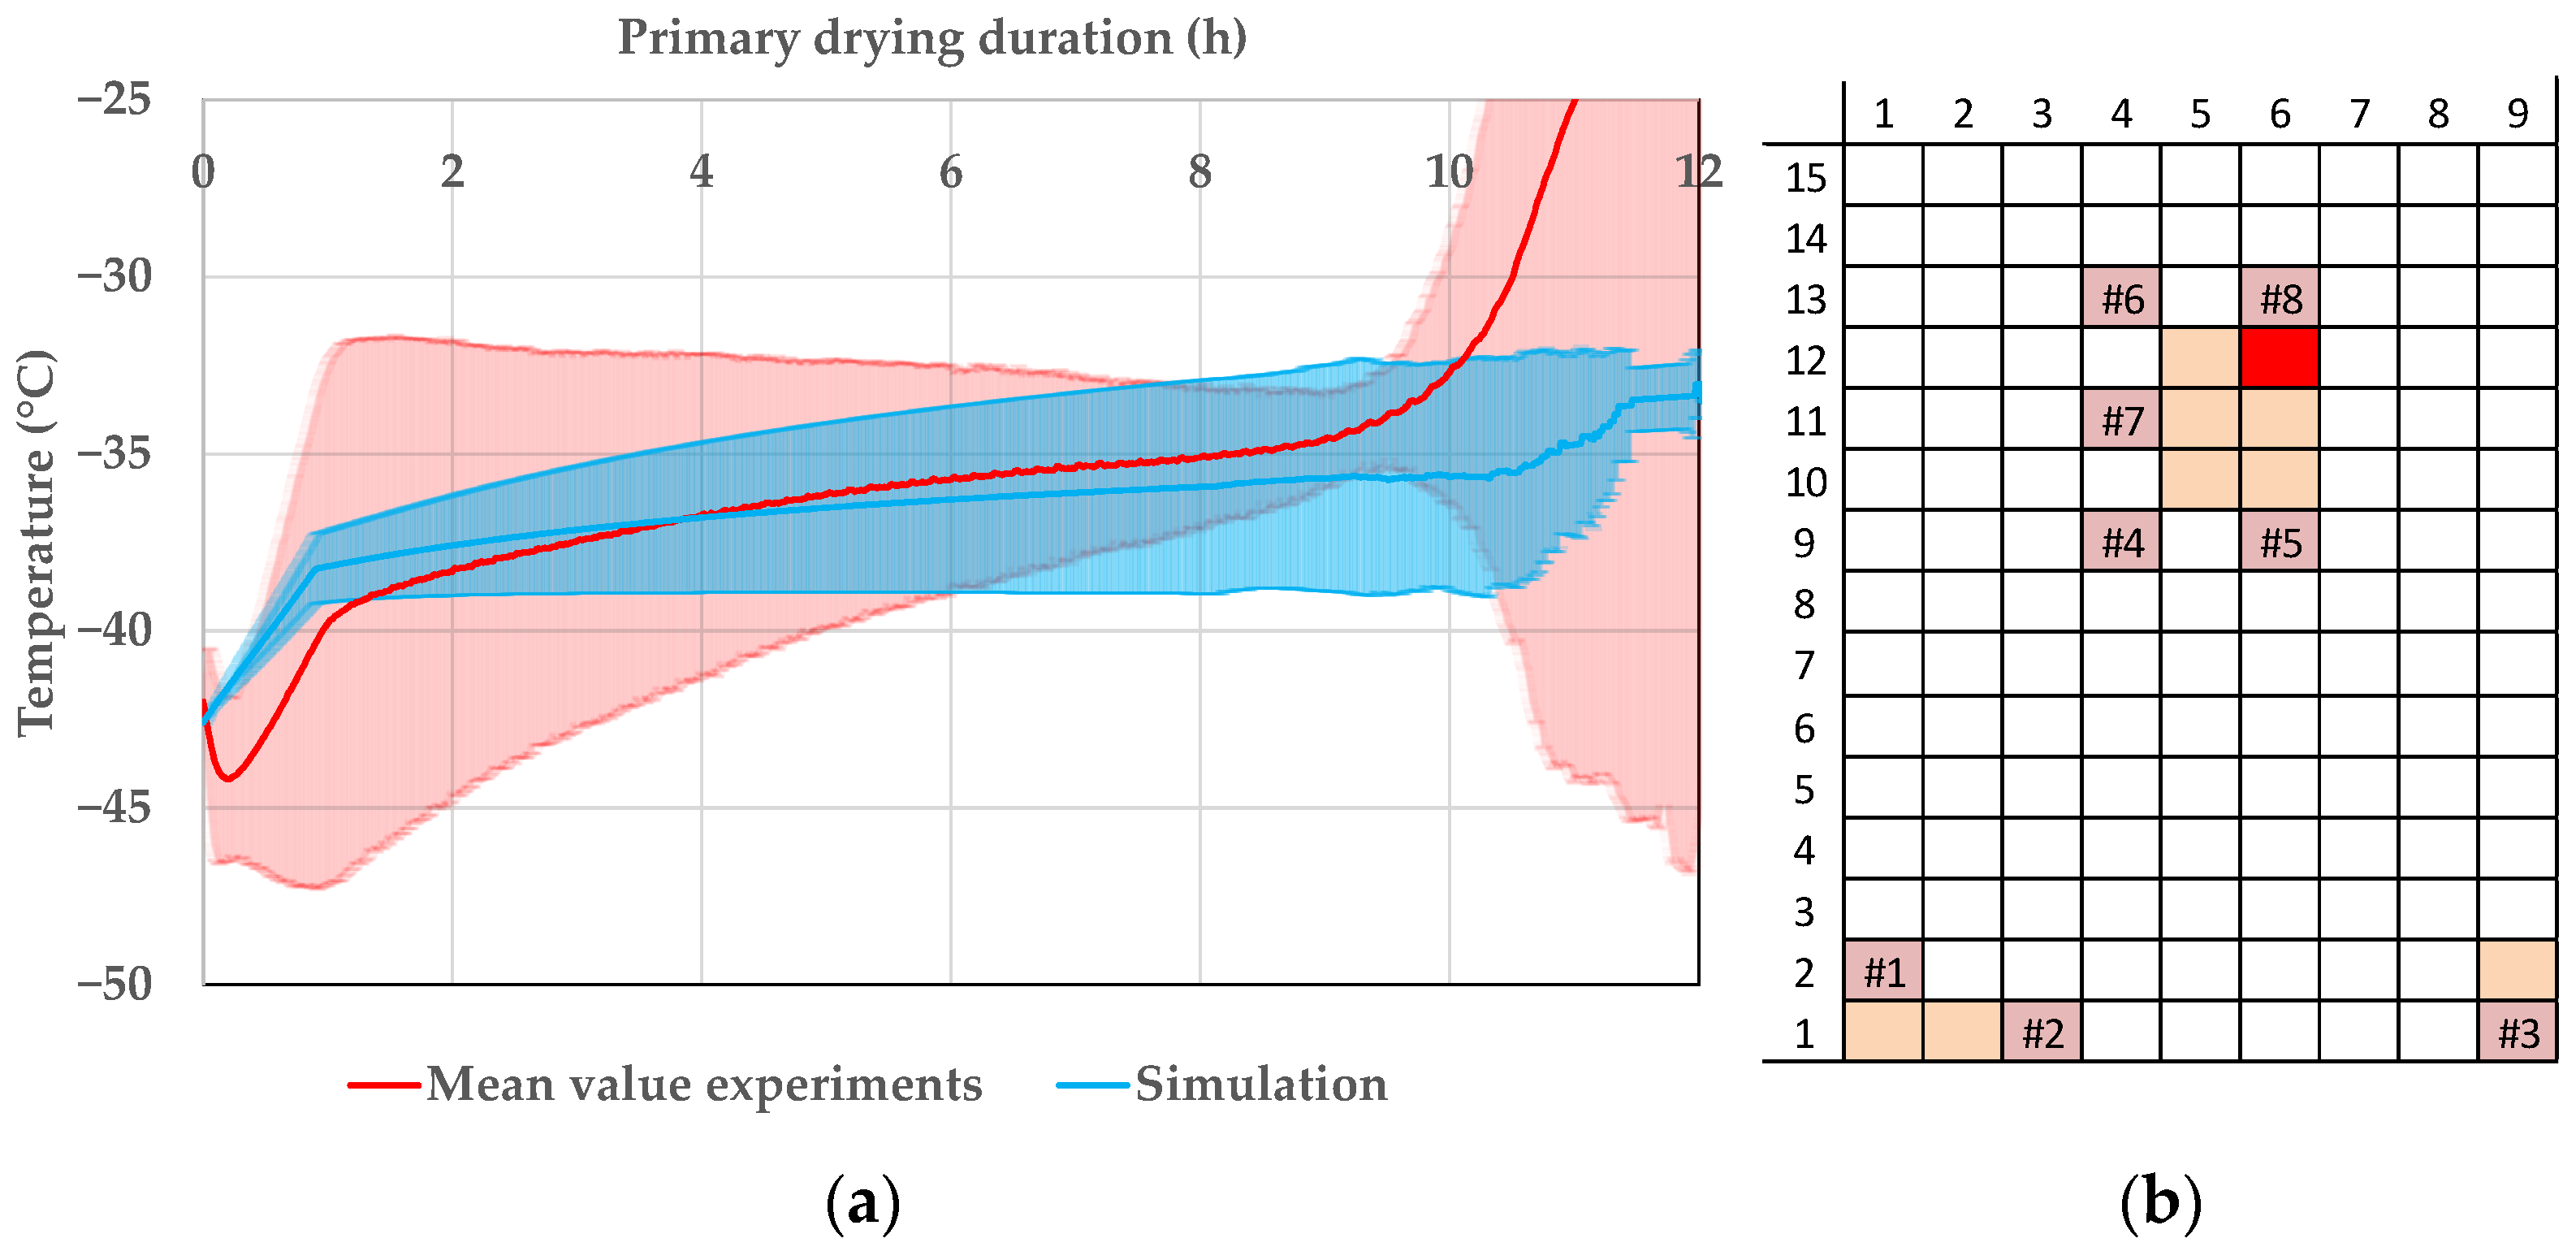
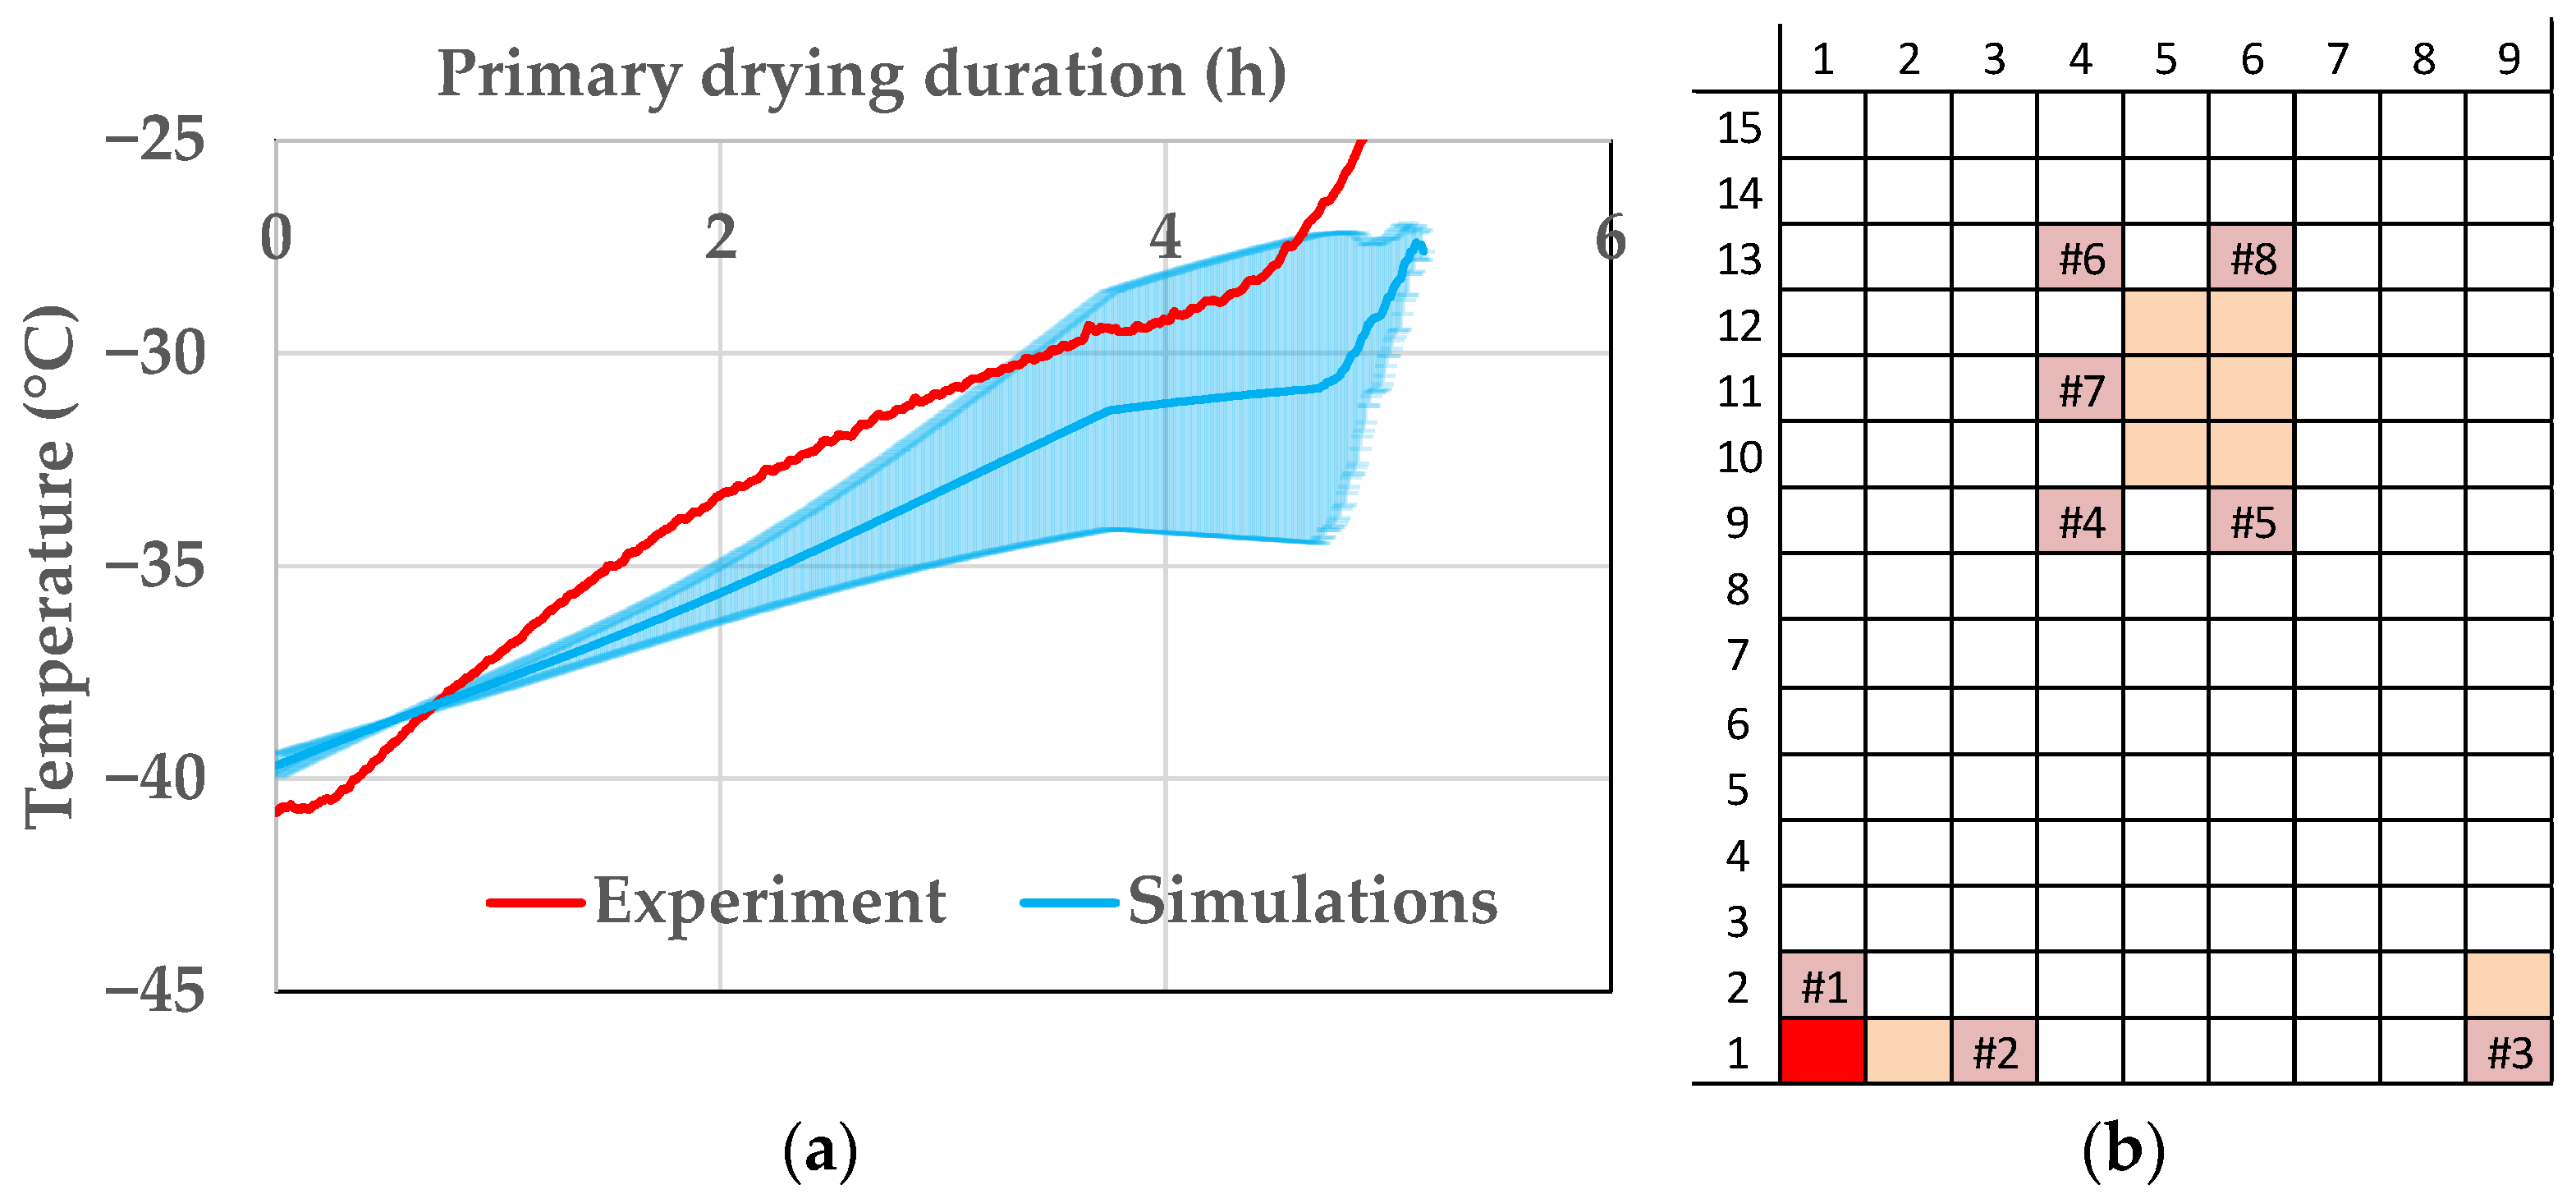
3.4. Product Temperature Profile
4. Discussion
Author Contributions
Funding
Acknowledgments
Conflicts of Interest
References
- Kawasaki, H.; Shimanouchi, T.; Kimura, Y. Recent Development of Optimization of Lyophilization Process. J. Chem. 2019, 2019, 9502856. [Google Scholar] [CrossRef]
- Fissore, D.; Pisano, R.; Barresi, A.A. Advanced approach to build the design space for the primary drying of a pharmaceutical freeze-drying process. J. Pharm. Sci. 2011, 100, 4922–4933. [Google Scholar] [CrossRef] [PubMed]
- Vanbillemont, B.; Nicolaï, N.; Leys, L.; De Beer, T. Model-Based Optimisation and Control Strategy for the Primary Drying Phase of a Lyophilisation Process. Pharmaceutics 2020, 12, 181. [Google Scholar] [CrossRef] [PubMed] [Green Version]
- Freeze Drying/Lyophilization of Pharmaceutical and Biological Products, 3rd ed.; Rey, L.; May, J.C. (Eds.) Informa Healthcare: New York, NY, USA, 2010; ISBN 9781439825754. [Google Scholar]
- Andrieu, J.; Vessot, S. A review on experimental determination and optimization of physical quality factors during pharmaceuticals freeze-drying cycles. Dry. Technol. 2018, 36, 129–145. [Google Scholar] [CrossRef]
- Arsiccio, A.; Pisano, R. The Ice-Water Interface and Protein Stability: A Review. J. Pharm. Sci. 2020, 109, 2116–2130. [Google Scholar] [CrossRef] [PubMed]
- Bano, G.; De-Luca, R.; Tomba, E.; Marcelli, A.; Bezzo, F.; Barolo, M. Primary Drying Optimization in Pharmaceutical Freeze-Drying: A Multivial Stochastic Modeling Framework. Ind. Eng. Chem. Res. 2020, 59, 5056–5071. [Google Scholar] [CrossRef]
- Xiang, J.; Hey, J.M.; Liedtke, V.; Wang, D.Q. Investigation of freeze-drying sublimation rates using a freeze-drying microbalance technique. Int. J. Pharm. 2004, 279, 95–105. [Google Scholar] [CrossRef]
- Assegehegn, G.; La Brito-de Fuente, E.; Franco, J.M.; Gallegos, C. Freeze-drying: A relevant unit operation in the manufacture of foods, nutritional products, and pharmaceuticals. Adv. Food Nutr. Res. 2020, 93, 1–58. [Google Scholar] [CrossRef]
- Patel, S.M.; Nail, S.L.; Pikal, M.J.; Geidobler, R.; Winter, G.; Hawe, A.; Davagnino, J.; Rambhatla Gupta, S. Lyophilized Drug Product Cake Appearance: What Is Acceptable? J. Pharm. Sci. 2017, 106, 1706–1721. [Google Scholar] [CrossRef]
- Pisano, R.; Fissore, D.; Barresi, A.A. Quality by Design in the Secondary Drying Step of a Freeze-Drying Process. Dry. Technol. 2012, 30, 1307–1316. [Google Scholar] [CrossRef]
- Patel, S.M.; Pikal, M.J. Lyophilization process design space. J. Pharm. Sci. 2013, 102, 3883–3887. [Google Scholar] [CrossRef] [PubMed]
- International Conference in Harmonization (ICH). ICH Q8 (R2)—Pharmaceutical Development. Available online: https://database.ich.org/sites/default/files/Q8%28R2%29%20Guideline.pdf (accessed on 9 December 2020).
- Pikal, M.J.; Mascarenhas, W.J.; Akay, H.U.; Cardon, S.; Bhugra, C.; Jameel, F.; Rambhatla, S. The Nonsteady State Modeling of Freeze Drying: In-Process Product Temperature and Moisture Content Mapping and Pharmaceutical Product Quality Applications. Pharm. Dev. Tech. 2005, 10, 17–32. [Google Scholar] [CrossRef] [PubMed]
- Srinivasan, G.; Muneeshwaran, M.; Raja, B. Numerical investigation of heat and mass transfer behavior of freeze drying of milk in vial. Heat Mass Transf. 2019, 55, 2073–2081. [Google Scholar] [CrossRef]
- Vilas, C.; Alonso, A.A.; Balsa-Canto, E.; López-Quiroga, E.; Trelea, I.C. Model-Based Real Time Operation of the Freeze-Drying Process. Processes 2020, 8, 325. [Google Scholar] [CrossRef] [Green Version]
- Klepzig, L.S.; Juckers, A.; Knerr, P.; Harms, F.; Strube, J. Digital Twin for Lyophilization by Process Modeling in Manufacturing of Biologics. Processes 2020, 8, 1325. [Google Scholar] [CrossRef]
- Barresi, A.A.; Pisano, R.; Rasetto, V.; Fissore, D.; Marchisio, D.L. Model-Based Monitoring and Control of Industrial Freeze-Drying Processes: Effect of Batch Nonuniformity. Dry. Technol. 2010, 28, 577–590. [Google Scholar] [CrossRef] [Green Version]
- Leys, L.; Vanbillemont, B.; van Bockstal, P.J.; Lammens, J.; Nuytten, G.; Corver, J.; Vervaet, C.; De Beer, T. A primary drying model-based comparison of conventional batch freeze-drying to continuous spin-freeze-drying for unit doses. Eur. J. Pharm. Biopharm. 2020, 157, 97–107. [Google Scholar] [CrossRef]
- Velardi, S.A.; Barresi, A.A. Development of simplified models for the freeze-drying process and investigation of the optimal operating conditions. Chem. Eng. Res. Des. 2008, 86, 9–22. [Google Scholar] [CrossRef]
- Juckers, A.; Knerr, P.; Harms, F.; Strube, J. Advanced Process Analytical Technology in Combination with Process Modeling for Endpoint and Model Parameter Determination in Lyophilization Process Design and Optimization. Processes 2021, 9, 1600. [Google Scholar] [CrossRef]
- Rambhatla, S.; Pikal, M.J. Heat and mass transfer scale-up issues during freeze-drying, I: Atypical radiation and the edge vial effect. AAPS Pharm. Sci. Tech. 2003, 4, E14. [Google Scholar] [CrossRef] [Green Version]
- Pikal, M.J.; Bogner, R.; Mudhivarthi, V.; Sharma, P.; Sane, P. Freeze-Drying Process Development and Scale-Up: Scale-Up of Edge Vial Versus Center Vial Heat Transfer Coefficients, Kv. J. Pharm. Sci. 2016, 105, 3333–3343. [Google Scholar] [CrossRef] [PubMed]
- Wegiel, L.A.; Ferris, S.J.; Nail, S.L. Experimental Aspects of Measuring the Vial Heat Transfer Coefficient in Pharmaceutical Freeze-Drying. AAPS Pharm. Sci. Tech. 2018, 19, 1810–1817. [Google Scholar] [CrossRef] [PubMed]
- Tang, X.C.; Nail, S.L.; Pikal, M.J. Evaluation of manometric temperature measurement, a process analytical technology tool for freeze-drying: Part II measurement of dry-layer resistance. AAPS Pharm. Sci. Tech. 2006, 7, 93. [Google Scholar] [CrossRef] [PubMed] [Green Version]
- Sixt, M.; Uhlenbrock, L.; Strube, J. Toward a Distinct and Quantitative Validation Method for Predictive Process Modelling—On the Example of Solid-Liquid Extraction Processes of Complex Plant Extracts. Processes 2018, 6, 66. [Google Scholar] [CrossRef] [Green Version]
- Lewis, L.M.; Johnson, R.E.; Oldroyd, M.E.; Ahmed, S.S.; Joseph, L.; Saracovan, I.; Sinha, S. Characterizing the freeze-drying behavior of model protein formulations. AAPS Pharm. Sci. Tech. 2010, 11, 1580–1590. [Google Scholar] [CrossRef] [Green Version]
- Scutellà, B.; Trelea, I.C.; Bourlès, E.; Fonseca, F.; Passot, S. Determination of the dried product resistance variability and its influence on the product temperature in pharmaceutical freeze-drying. Eur. J. Pharm. Biopharm. 2018, 128, 379–388. [Google Scholar] [CrossRef]
- Kodama, T.; Sawada, H.; Hosomi, H.; Takeuchi, M.; Wakiyama, N.; Yonemochi, E.; Terada, K. Determination for dry layer resistance of sucrose under various primary drying conditions using a novel simulation program for designing pharmaceutical lyophilization cycle. Int. J. Pharm. 2013, 452, 180–187. [Google Scholar] [CrossRef]


| # | Primary Drying | ||||
|---|---|---|---|---|---|
| Shelf Temperature (°C) | Chamber Pressure (mbar) | Fill Volume (mL) | Temperature Ramp (°C/min) | ||
| 1 | ++++ | 0 | 0.15 | 2 | 1 |
| 2 | +−+− | 0 | 0.05 | 2 | 0.2 |
| 3 | −+−+ | −25 | 0.15 | 1 | 1 |
| 4 | ++−− | 0 | 0.15 | 1 | 0.2 |
| 5 | −−−− | −25 | 0.05 | 1 | 0.2 |
| 6 | +−−+ | 0 | 0.05 | 1 | 1 |
| 7 | −−++ | −25 | 0.05 | 2 | 1 |
| 8 | −++− | −25 | 0.15 | 2 | 0.2 |
| 9 | CP | −12.5 | 0.1 | 1.5 | 0.6 |
| 10 | CP | −12.5 | 0.1 | 1.5 | 0.6 |
| 11 | CP | −12.5 | 0.1 | 1.5 | 0.6 |
| Shelf Temperature (°C) | Chamber Pressure (mbar) | ||
|---|---|---|---|
| 1 | ++ | 0 | 0.15 |
| 2 | +− | 0 | 0.05 |
| 3 | −+ | −25 | 0.15 |
| 4 | −− | −25 | 0.05 |
| 5 | CP | −12.5 | 0.1 |
| Parameter | Value |
|---|---|
| R1 (m/s) | 26,834 ± 7404 |
| R2 (1/s) | 1.62 × 10⁷ ± 1.9 × 10⁷ |
| R3 (1/m) | 42.76 ± 181.47 |
Publisher’s Note: MDPI stays neutral with regard to jurisdictional claims in published maps and institutional affiliations. |
© 2022 by the authors. Licensee MDPI, Basel, Switzerland. This article is an open access article distributed under the terms and conditions of the Creative Commons Attribution (CC BY) license (https://creativecommons.org/licenses/by/4.0/).
Share and Cite
Juckers, A.; Knerr, P.; Harms, F.; Strube, J. Model-Based Product Temperature and Endpoint Determination in Primary Drying of Lyophilization Processes. Pharmaceutics 2022, 14, 809. https://doi.org/10.3390/pharmaceutics14040809
Juckers A, Knerr P, Harms F, Strube J. Model-Based Product Temperature and Endpoint Determination in Primary Drying of Lyophilization Processes. Pharmaceutics. 2022; 14(4):809. https://doi.org/10.3390/pharmaceutics14040809
Chicago/Turabian StyleJuckers, Alex, Petra Knerr, Frank Harms, and Jochen Strube. 2022. "Model-Based Product Temperature and Endpoint Determination in Primary Drying of Lyophilization Processes" Pharmaceutics 14, no. 4: 809. https://doi.org/10.3390/pharmaceutics14040809