
Finite Element Analysis and Modeling in Pharmaceutical Tableting


Abstract
:1. Introduction
2. Finite Element Modeling and Analysis
2.1. Overview
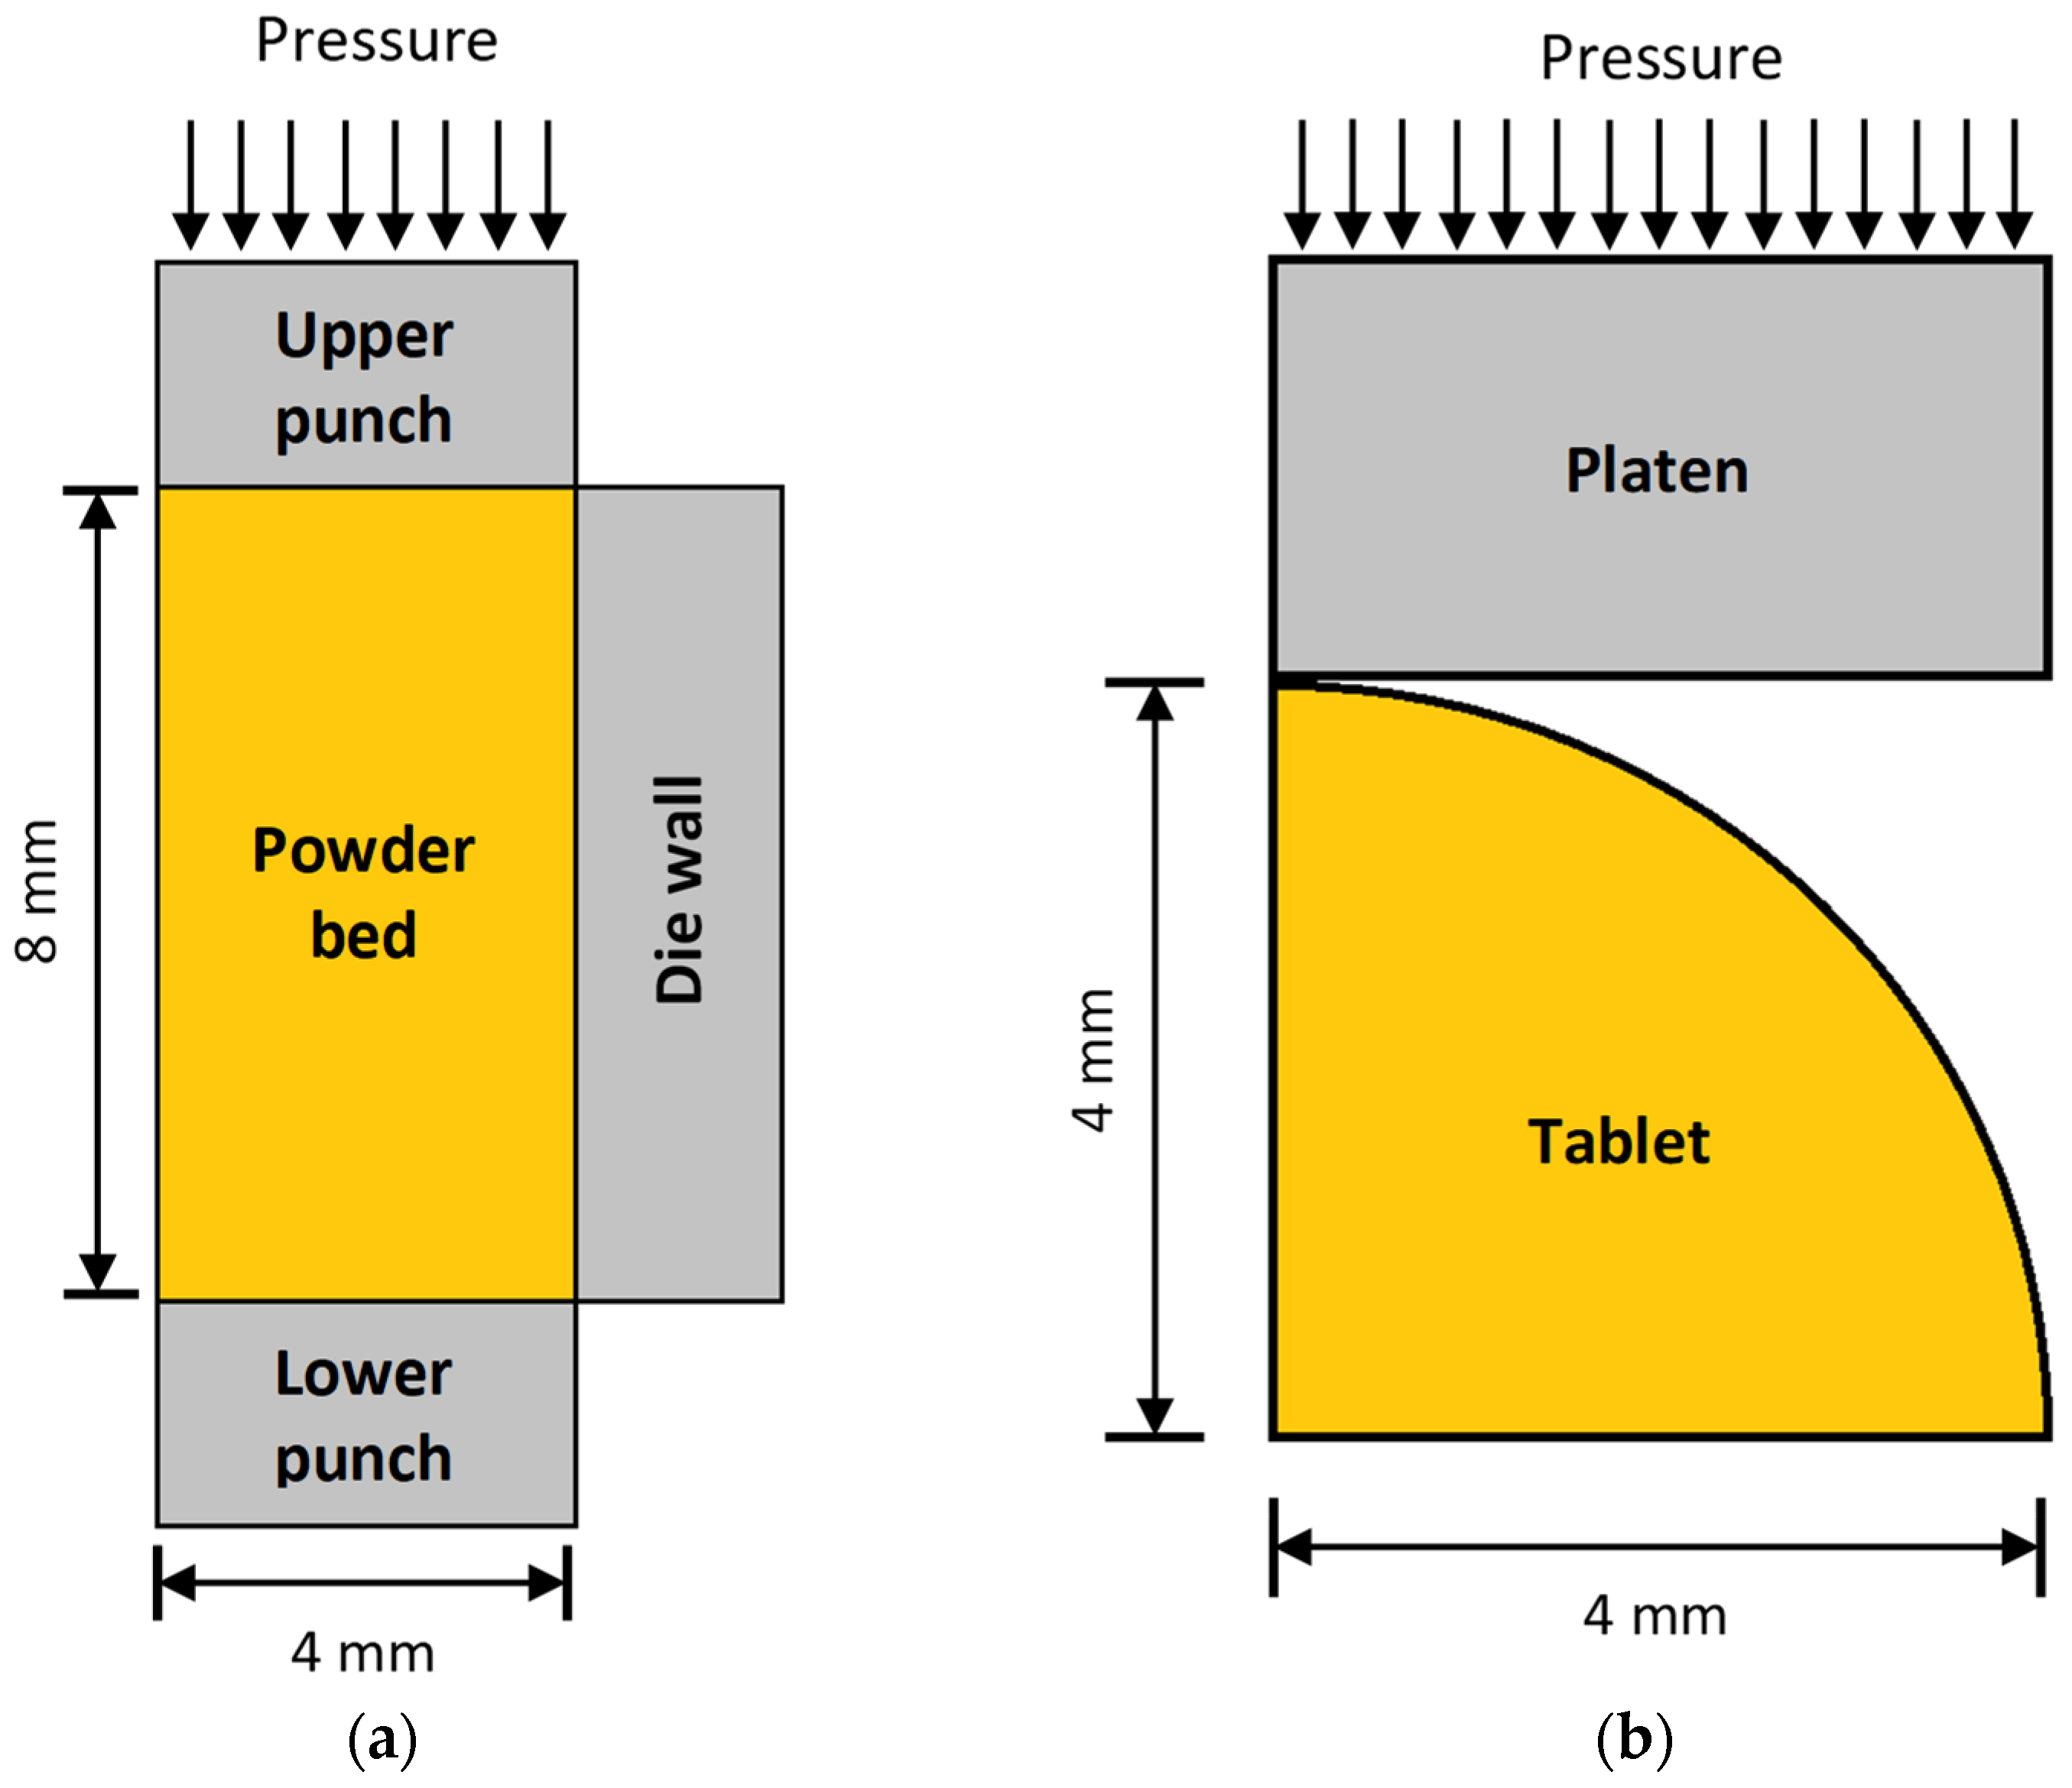
2.2. Geometry
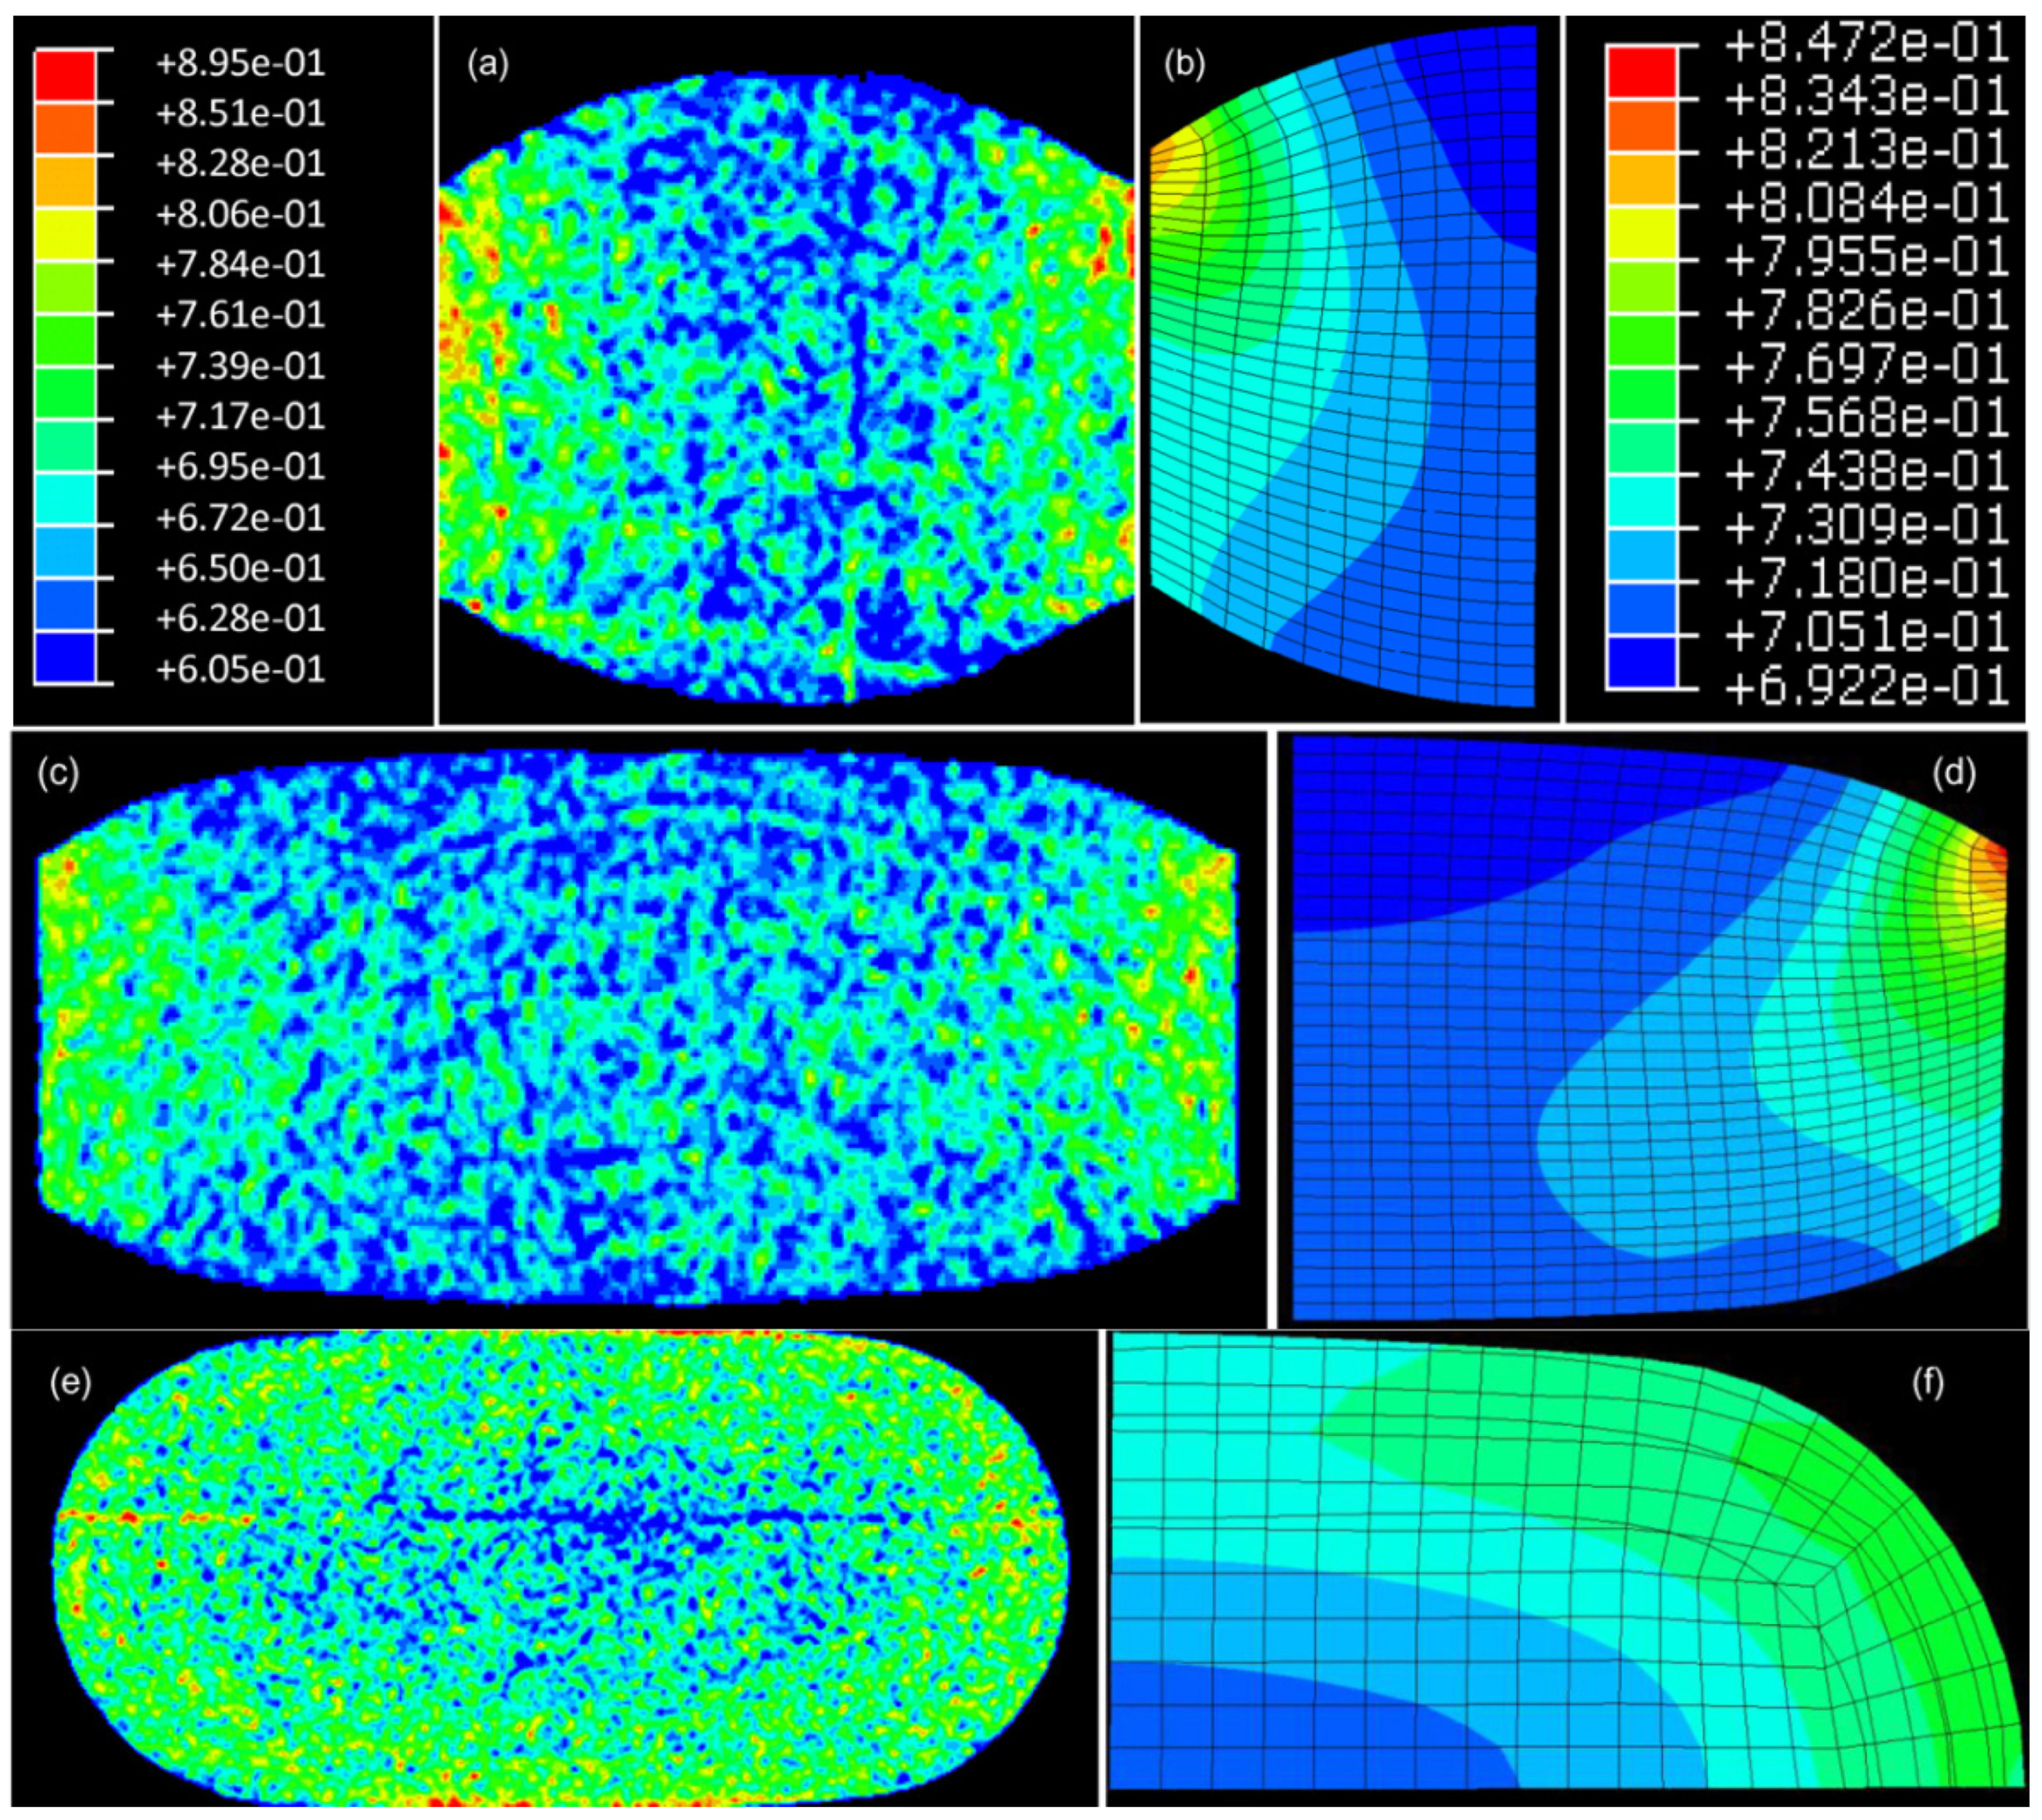
2.3. Meshing
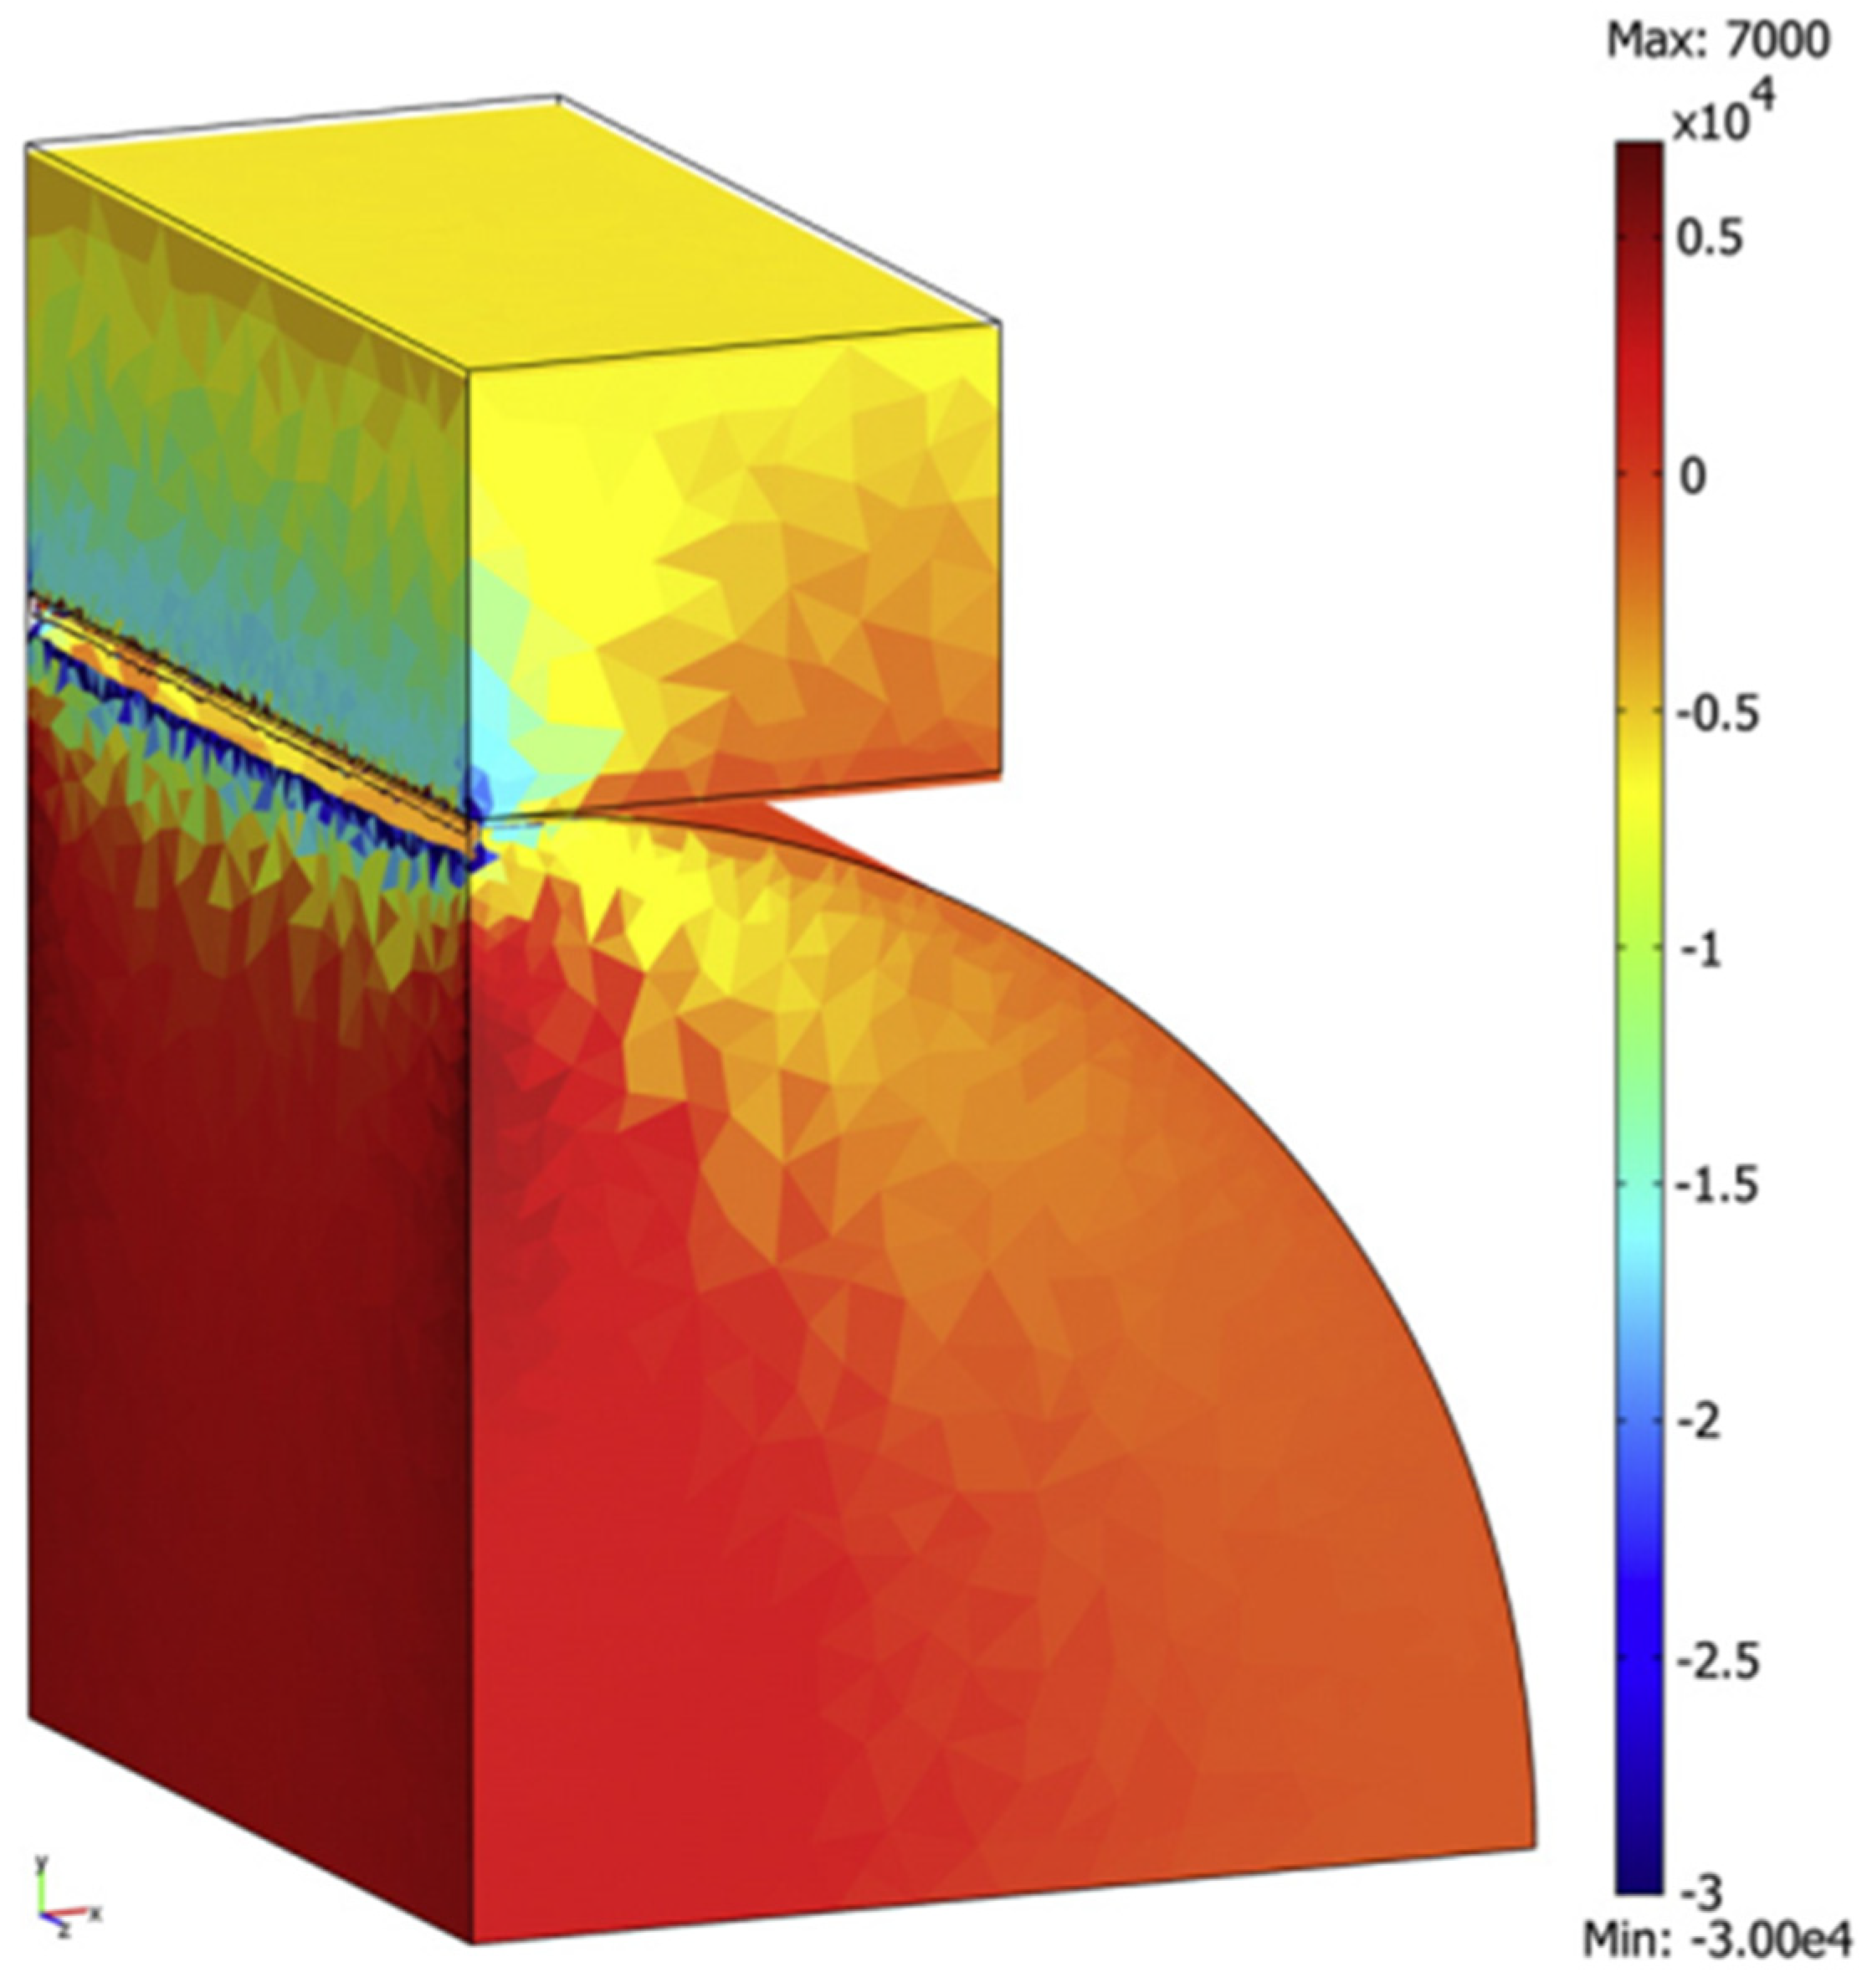
2.4. Boundary Conditions
2.5. Material Properties
2.6. Loading Conditions
2.7. FEA Model Solution
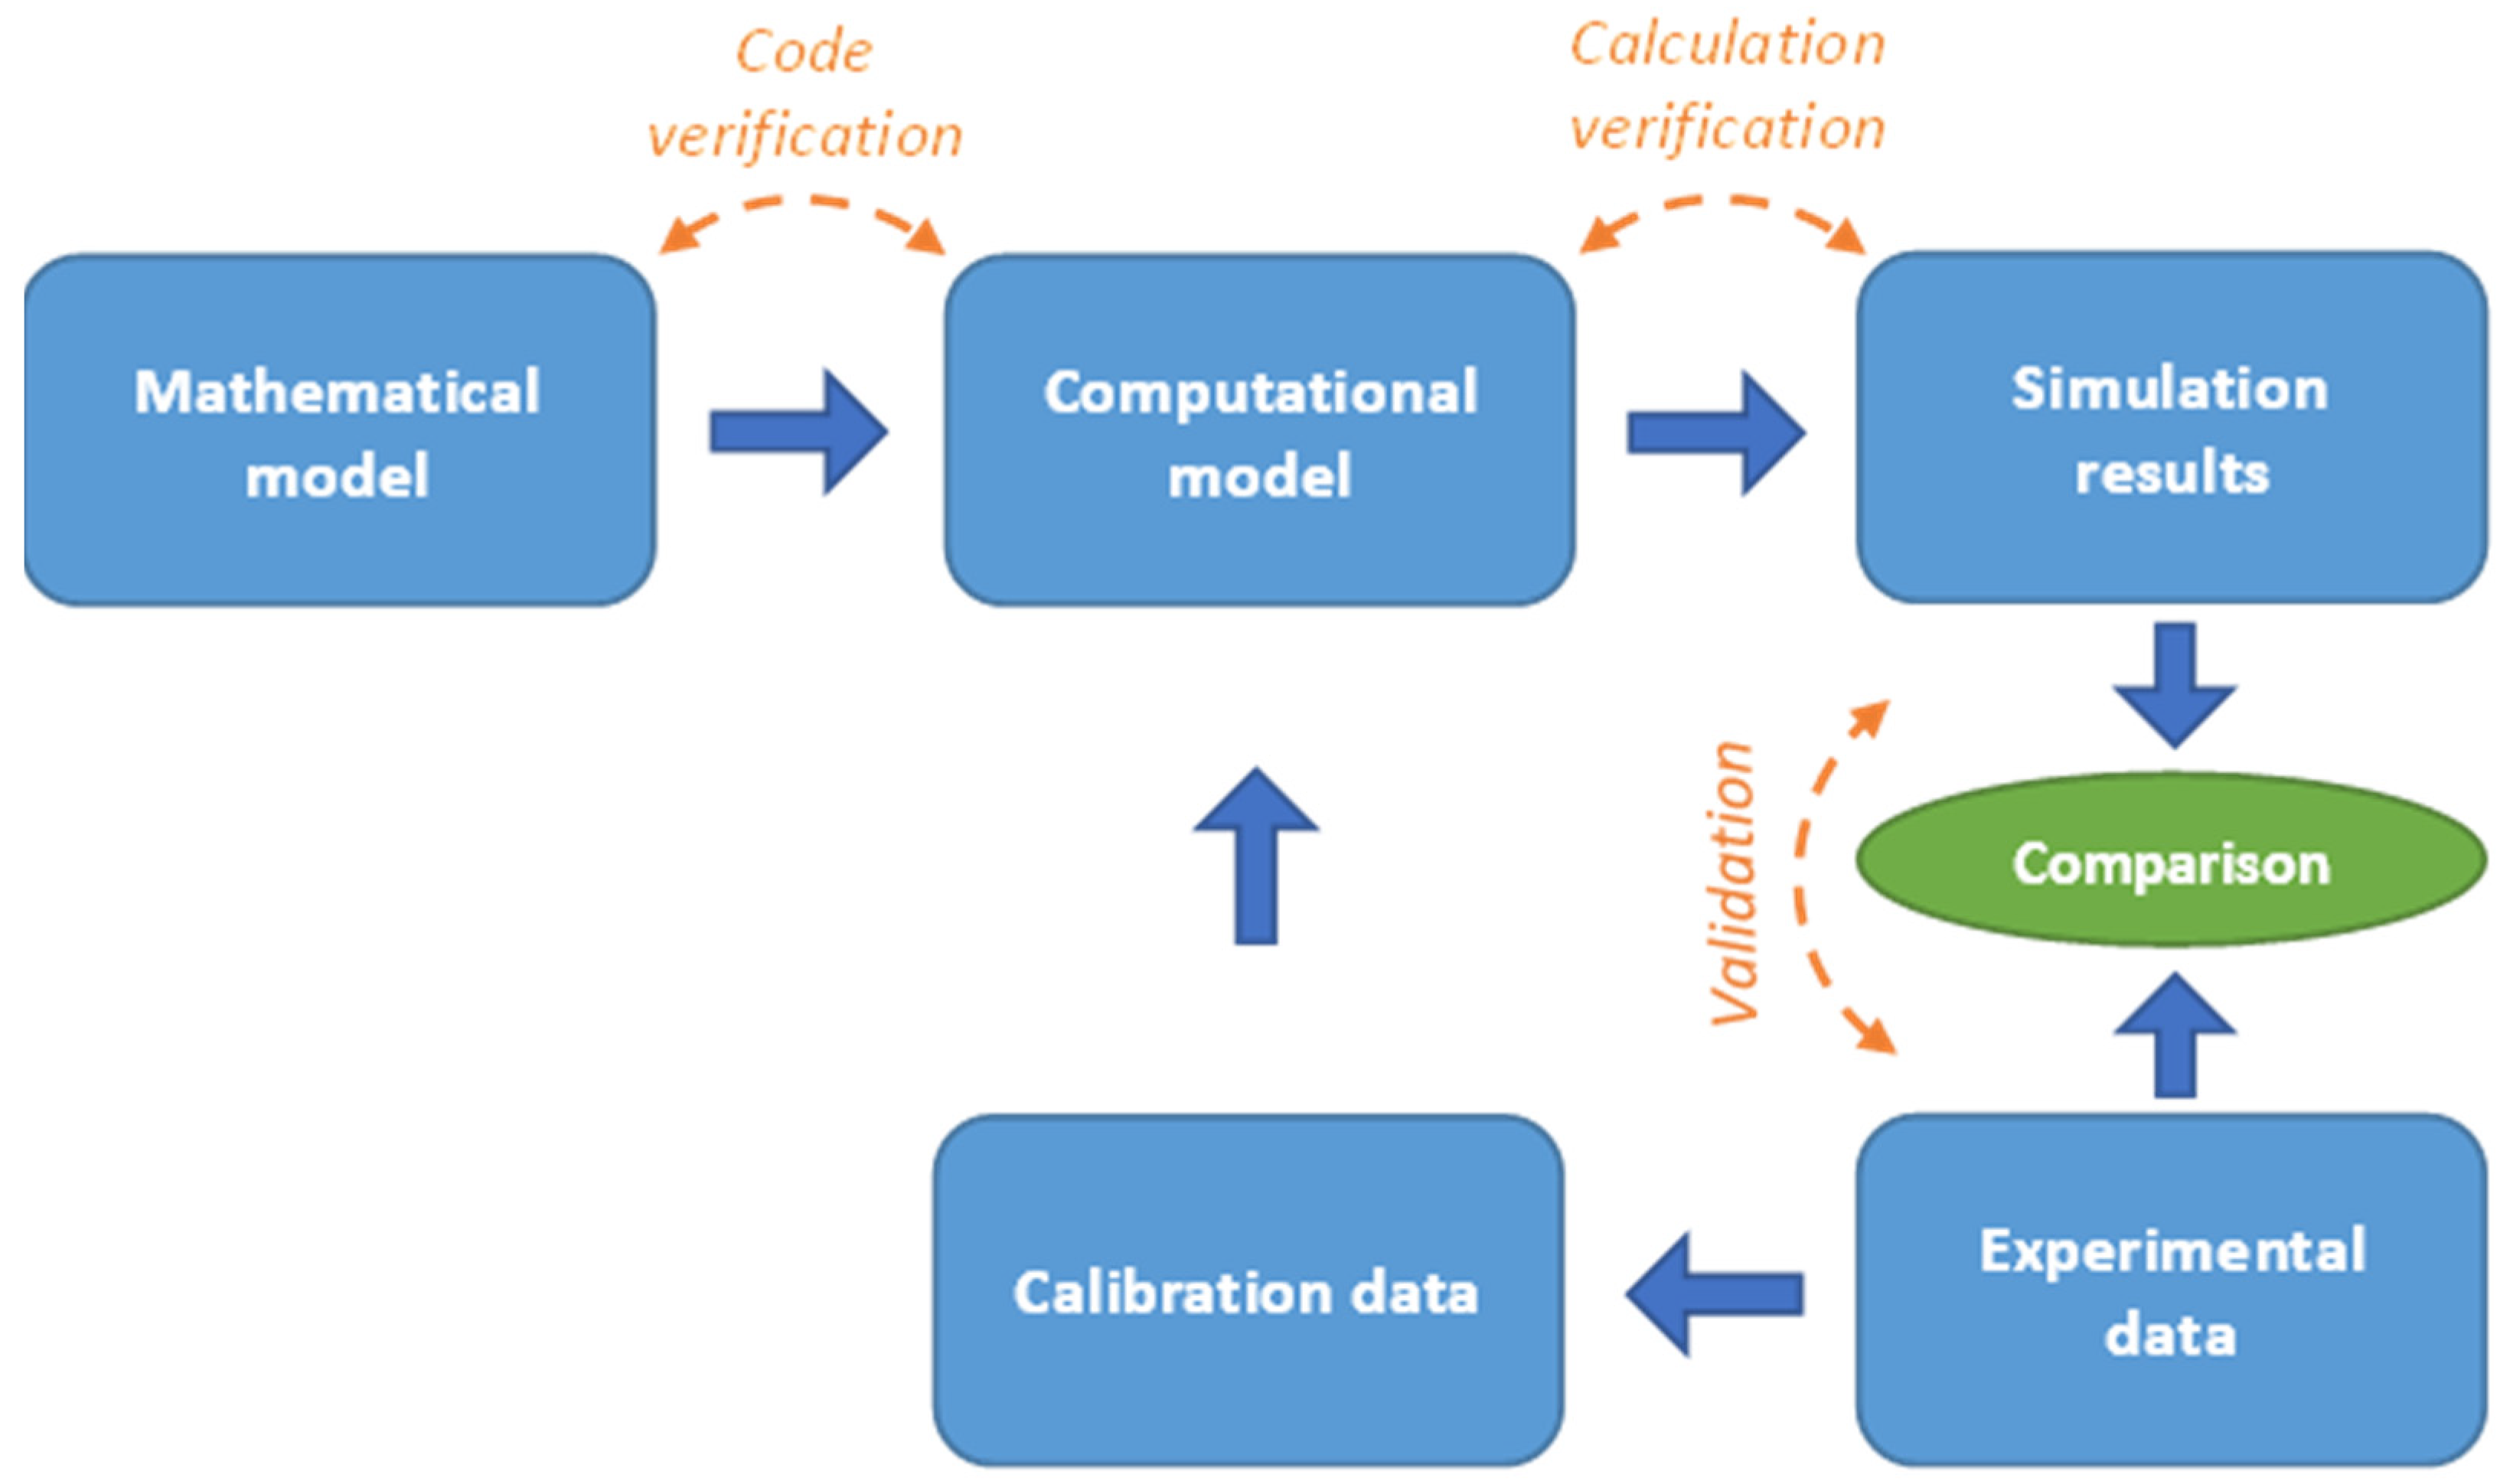
2.8. FEA Model Verification and Validation
3. Theoretical Background: Constitutive Equations
3.1. Tableting
3.1.1. Powder as Continuum Medium
3.1.2. Linear Elasticity Model
3.1.3. Linear Viscoelasticity Model
3.1.4. Elastoplastic Models
3.1.5. The Drucker–Prager Cap (DPC) Model
3.1.6. Constitutive Model for Plastic Materials
3.1.7. Powder–Wall Friction Law
3.2. Mechanical Strength Test
3.3. Limitations of the Constitutive Models in the Pharmaceutical Field
4. Application of FEA Modelling for Pharmaceutical Tablets

| Study | Material 1 | Equipment | FEA Model | Application | References | ||
|---|---|---|---|---|---|---|---|
| Model 2 | Meshing 3 | Young’s Modulus (E, GPa)/Poisson Ratio (ν, -) | |||||
| 01 | LAC | flat-faced punches | DPC | 4-node | 4.6/0.17 * | Stress & density distribution during tableting | Michrafy et al., 2002 [15] |
| 02 | MCC | 9.525 mm die, flat-faced punches | DPC | no data | E & ν expressed as function of relative density | Stress & density distribution/friction evolution during tableting | Cunningham et al., 2004 [4] |
| 03 | MCC | flat-faced punches | DPC & Janssen–Walker model | 4-node | E expressed as function of relative density/0.18 | Study of friction evolution during tableting | Michrafy et al., 2004 [104] |
| 04 | MCC | 25 mm die, concave-faced punches | DPC & Janssen–Walker model | 4-node | E & ν expressed as function of relative density | Study of friction evolution during tableting | Sinka et al., 2004 [105] |
| 05 | MCC | 11.28 mm die, flat-faced punches | DPC | 4-node | E expressed as function of relative density/0.18 | Stress & density distribution during tableting | Kadiri et al., 2005 [80] |
| 06 | LAC | 8 mm die, flat-faced punches | DPC | 4-node | 3.57/0.12 * | Study of failure mechanisms | Wu et al., 2005 [102] |
| 07 | MCC | diametral compression of flat-faced tablets | Filon theory | 4-node | 1.0/0.25 | Stress & strain distributions byopposing compressive line loads | Drake et al., 2007 [87] |
| 08 | MCC | 8 mm die, flat-faced punches | DPC | no data | no data | Stress & density distribution/failure mechanisms during tableting | Han et al., 2008 [75] |
| 09 | MCC | 8 mm die, flat- & concave-faced punches | DPC | 4-node | 4.2 and 22.6/0.42 and 0.233 * | Stress & density distribution during tableting | Han et al., 2008 [76] |
| 10 | LAC | 8 mm die, flat- & concave-faced punches | DPC | 4-node | 3.57/0.12 | Study of failure (capping) mechanisms | Wu et al., 2008 [101] |
| 11 | MCC | 9.525 mm die, flat-faced punches | DPC | 4-node (T) | no data | Study of temperature evolution during tableting | Zavaliangos et al., 2008 [108] |
| 12 | MCC | 9.525 mm die, concave-faced punches | DPC | 8-node (T) | E & ν expressed as function of relative density | Study of temperature evolution during tableting | Klinzing et al., 2010 [106] |
| 13 | LAC | flat-faced punches | DPC | 4-node (R) | no data | Stress & density distribution during tableting | Sinha et al., 2010 [84] |
| 14 | MCC | flat-faced punches | DPC | 4-node | 2.207/0.14 * | Stress & density distribution during tableting | Sinha et al., 2010 [27] |
| 15 | LAC | 5.6 mm die, flat-faced punches | DPC | 4-node | 4.86/0.12 * | Stress & density distribution during tableting | Si and Lan, 2012 [83] |
| 16 | MCC | flat-faced punches | DPC & creep behavior model | no data | no data | Study of the viscoelastic behavior during tableting | Diarra et al., 2013 [109] |
| 17 | LAC, CS & MCC | 8 mm die, flat-faced punches | DPC | no data | 3–4/0.1–0.2 | Stress & density distribution during tableting | Hayashi et al., 2013 [77] |
| 18 | MCC | 11.28 mm die, flat & concave-faced punches | DPC | 4-node (R) | E & ν expressed as function of relative density | Study of failure (capping) mechanisms | Kadiri and Michrafy, 2013 [99] |
| 19 | not applicable/theoretical study | diametral compression of elongated tablets | Elastic stresses model | 3-node | 0.002/no data | Stress & strain distributions during diametral compression | Pitt and Heasley, 2013 [65] |
| 20 | Anhydrous dextrose | diametral compression of flat-faced tablets | Elastic stresses model | 20-node (R) | 2.58 and 9/0.35 and 0.3 | Stress & strain distributions during diametral compression | Podczeck et al., 2013 [89] |
| 21 | MCC | diametral compression of flat-faced and biconvex tablets | DPC & Elastic model | 8-node | E & ν expressed as function of relative density | Stress & strain distributions during diametral compression | Shang et al., 2013 [92] |
| 22 | MCC | 9.525 mm die, flat-faced punches | Griffith & Irwin models | 4-node | no data | Study of failure (cracking) mechanisms during decompression & ejection | Garner et al., 2014 [98] |
| 23 | TEO, LAC, CS, MCC, MgSt | 8 mm die, flat-faced punches | DPC | no data | 6.51–9.84/0.1164–0.1282 | Stress & density distribution during tableting | Hayashi et al., 2014 [78] |
| 24 | MCC | 5.25 mm die, flat- & convex-faced punches | DPC | 8-node | E & ν expressed as function of relative density | Stress & density distribution during tableting | Krok et al., 2014 [61] |
| 25 | ACP | three point bending test of flat-faced tablets | Elastic stresses model | 4-node | 3.4/0.23 | Stress & strain distribution during three point bending test | Mazel et al., 2014 [94] |
| 26 | not applicable/theoretical study | diametral compression of flat, round, bevel-edged tablets | Elastic stresses model | 4-node | 2.58/0.35 | Stress & strain distributions during diametral compression | Podczeck et al., 2014 [90] |
| 27 | ACP & MCC | 11.28 mm die, flat- & concave-faced punches | DPC | no data | no data | Stress & density distribution during tableting | Diarra et al., 2015 [74] |
| 28 | MCC | diametral compression of biconvex tablets | DPC | no data | E & ν expressed as function of relative density | Study of failure (capping) mechanisms | Furukawa et al., 2015 [97] |
| 29 | ACP | 11.28 mm die, concave-faced punches | DPC | no data | no data | Stress & density distribution/friction evolution during tableting | Mazel et al., 2015 [28] |
| 30 | ACT, LAC, CS, MCC, L-HPC, MgSt | 12 mm die, concave-faced punches | DPC | no data | 2.96–6.51/0.0742–0.0943 | Stress & density distribution during tableting | Otoguro et al., 2015 [82] |
| 31 | LAC, ASA | three point bending test of flat, round, bevel-edged tablets | Elastic & brittle-cracking model | 10-node | 2.99 for LAC & 1.51 for ASS/0.3 | Stress & strain distributions during three point bending test | Podczeck et al., 2015 [95] |
| 32 | MCC | 8 mm die, flat- & convex-faced punches | DPC | 4-node (T) | E & ν expressed as function of relative density | Study of temperature evolution during tableting | Krok et al., 2016 [107] |
| 33 | ACP, CPD, SD-LAC, G-LAC & SD-MAN | 3.8 mm die, flat-faced punches | DPC | no data | E & ν expressed as function of relative density | Stress & density distribution during tableting | Mazel et al., 2016 [81] |
| diametral compression of flat-faced tablets | Elastic stresses model | no data | 4.2/0.25 | Stress & strain distributions during diametral compression | |||
| 34 | LAC, CS, MCC, L-HPC | diametral compression of flat-faced scored tablets | Elastic stresses model | no data | 2.35/0.08 | Stress & strain distributions during diametral compression | Okada et al., 2016 [88] |
| 35 | MCC | 12 mm die, flat-faced punches | DPC | 4-node (R) | E & ν expressed as function of relative density | Stress & density distribution during tableting | Baroutaji et al., 2017 [5] |
| 36 | ACP, SD-LAC | diametral compression of flat-faced tablets | Elastic stresses model | no data | 4.4/0.25 for ACP & 3.7/0.23 for SD-LAC | Stress & strain distributions during diametral compression | Croquelois et al., 2017 [86] |
| 37 | ACP | 12 mm die, concave-faced punches | DPC | no data | no data | Study of failure (lamination) mechanisms | Mazel et al., 2018 [100] |
| 38 | MCC | 12 mm die, concave-faced punches | DPC | 4-node (R) | no data | Study of failure (capping & chipping) mechanisms | Baroutaji et al., 2019 [96] |
| 39 | PCZ, MCC & ACP | 9.525 mm die, concave-faced punches | DPC | 4-node | no data | Stress & density distribution during tableting | Huang et al., 2019 [79] |
| 40 | MCC | 11.28 mm die, flat- & concave-faced punches | DPC & Janssen–Walker model | no data | no data | Study of friction evolution during tableting | Mazel et al., 2019 [103] |
| 41 | MCC, LAC, CS | 12 mm die, concave-faced punches | DPC | no data | 1.803–3.321/0.1363–0.1774 | Stress & density distribution during tableting | Takayama et al., 2019 [85] |
| 42 | LAC, ACP, MCC, CS | 11.28 mm die, flat-faced punches | Linear viscoelastic | no data | no data | Study of the viscoelastic behavior during tableting | Desbois et al., 2020 [29] |
| 43 | MCC, LAC, ACT, MgSt | 8.3 mm die, flat-faced punches | DPC & Perzyna model | no data | no data | Study of the viscoelastic behavior during tableting | Ohsaki et al., 2020 [110] |
| 44 | MCC, MgSt, LAC, NaCl | diametral compression of flat-faced tablets | Elastic stresses model | 8-node | 10.0/0.3 | Stress & strain distributions during diametral compression | Radojevic et al., 2021 [91] |
| 45 | not applicable/theoretical study | diametral compression of various shape tablets | Elastic stresses model | 20-node | no data | Stress & strain distributions during diametral compression | Yohannes and Abebe, 2021 [93] |
4.1. FEA in Compression
4.1.1. Studies on the Stress/Density Distribution during Compression
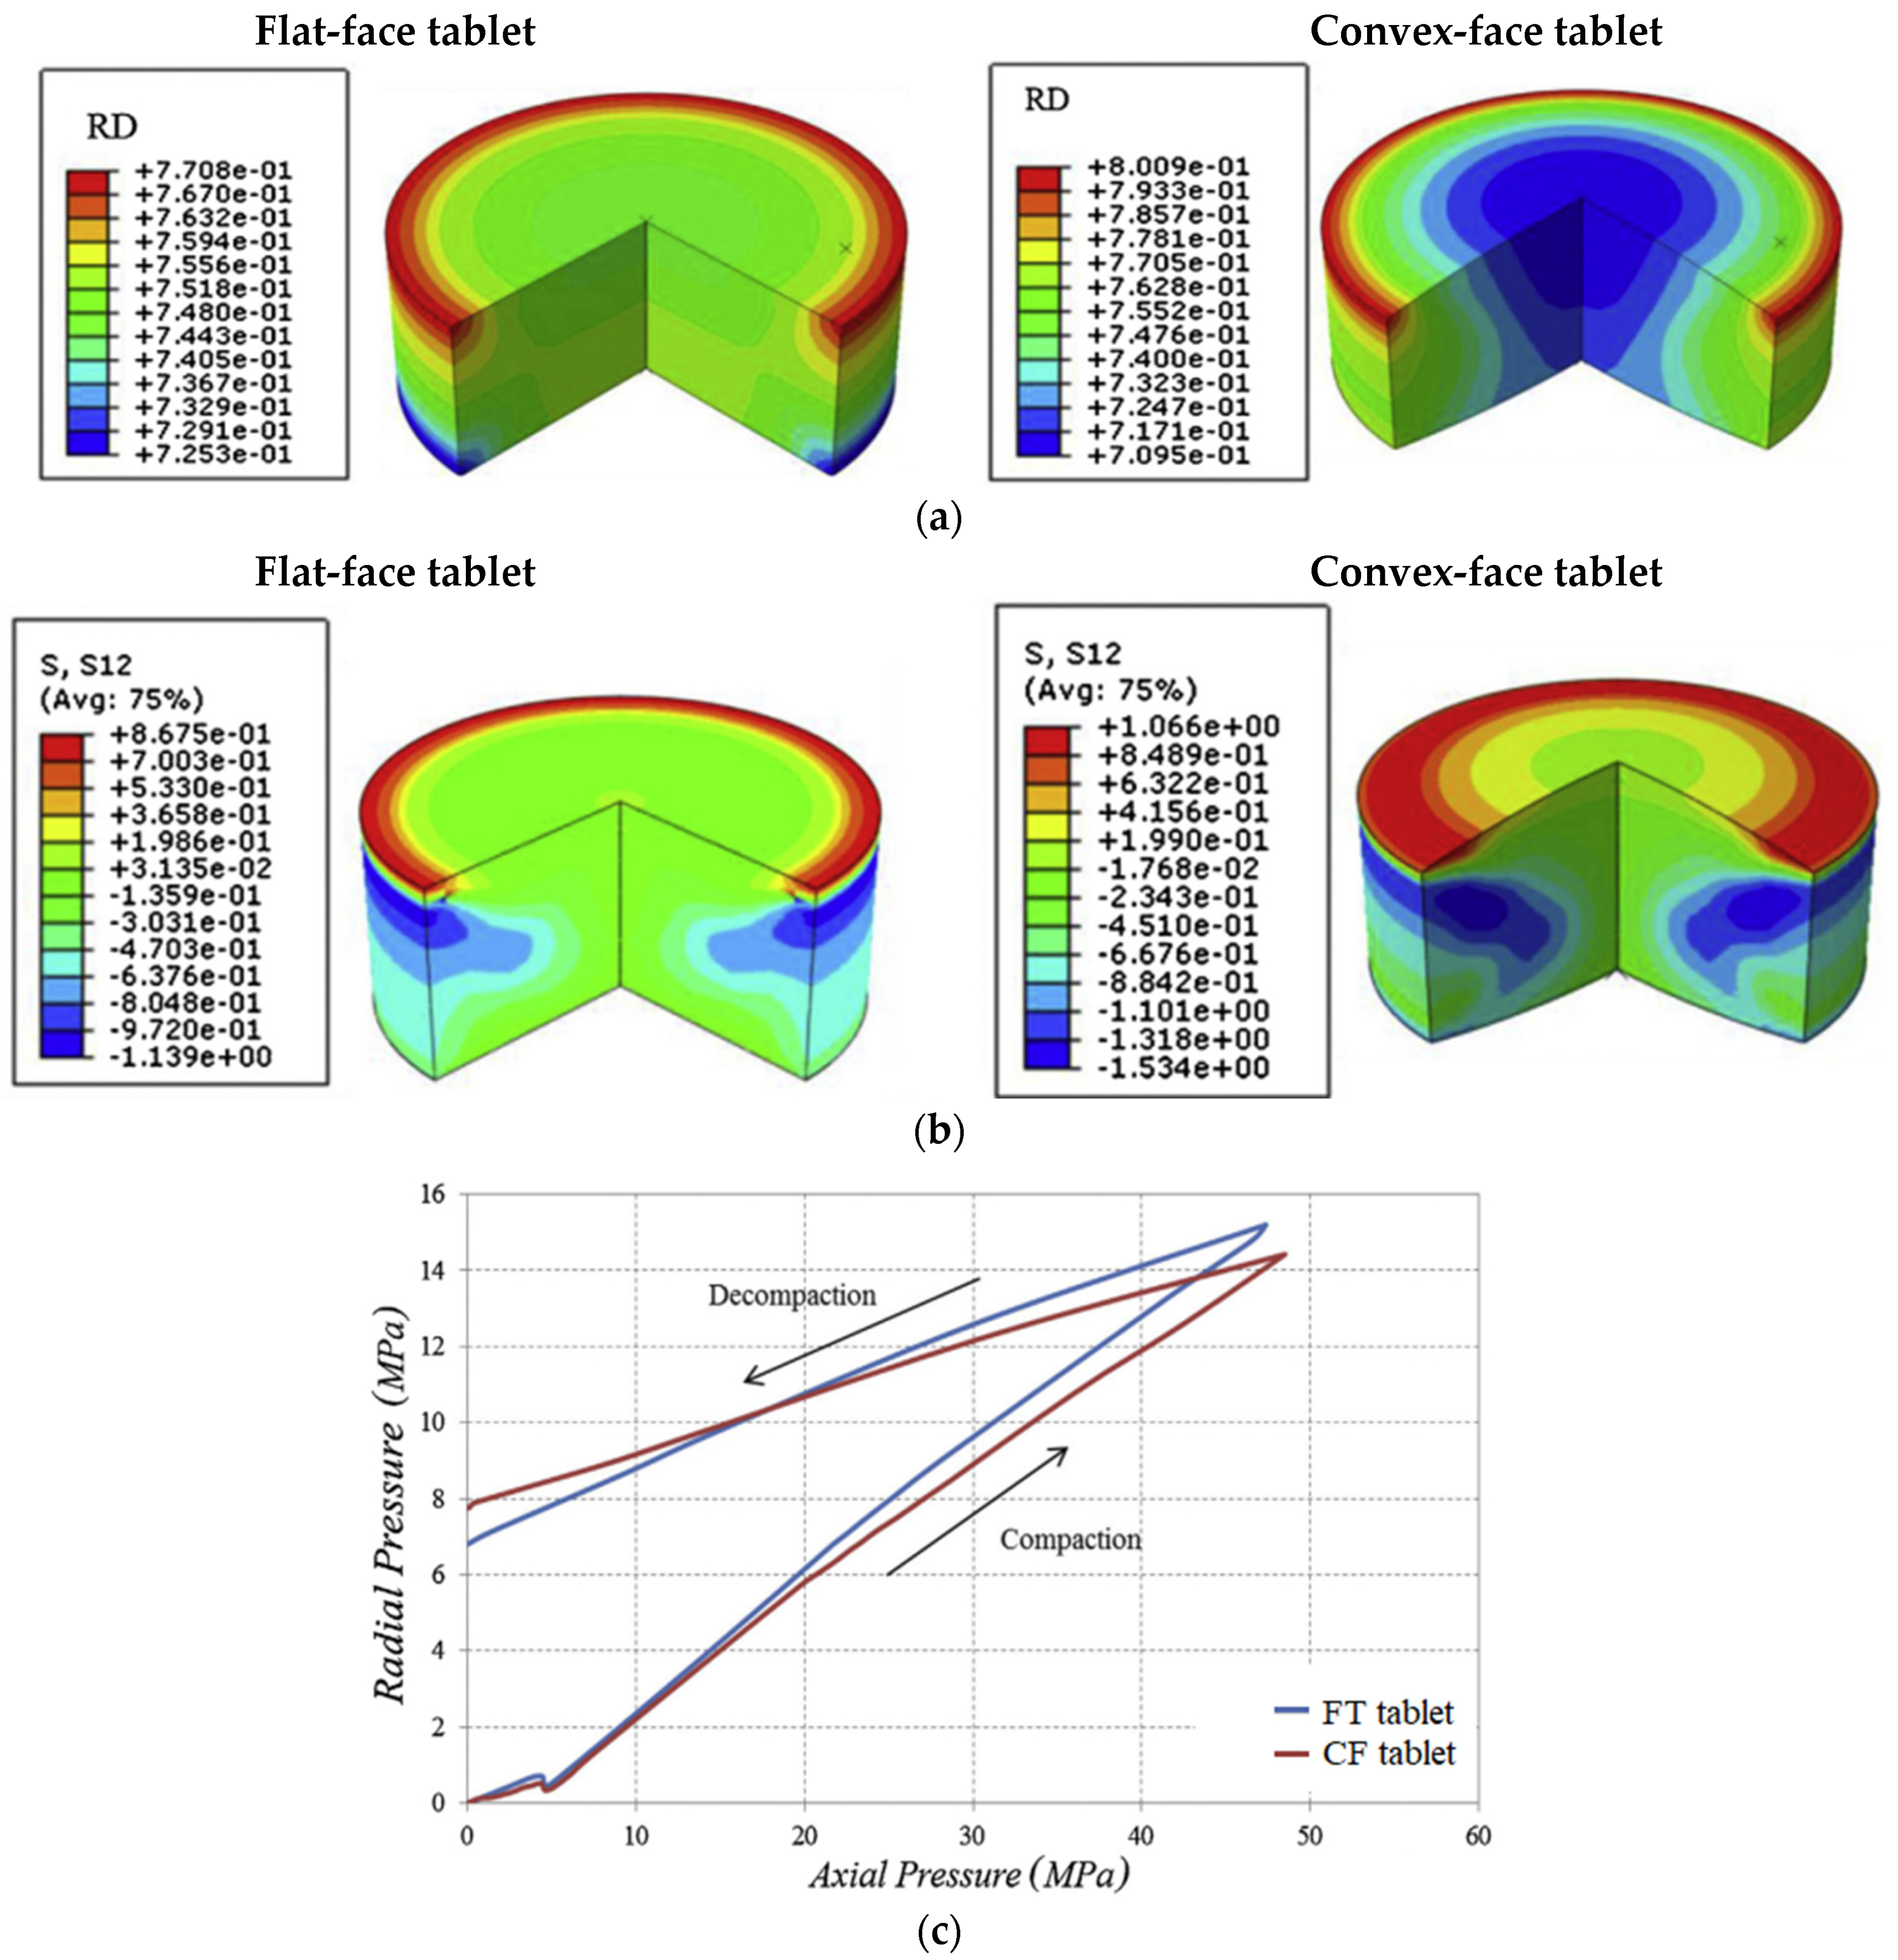
4.1.2. Effect of Punch Shape on the Stress/Density Distribution during Tableting
4.1.3. Studies on Failure Mechanisms
4.1.4. Studies on Die-Wall and Powder Friction
4.1.5. Studies on Temperature Evolution during Tableting
4.1.6. Studies of the Viscoelastic Behavior during Tableting
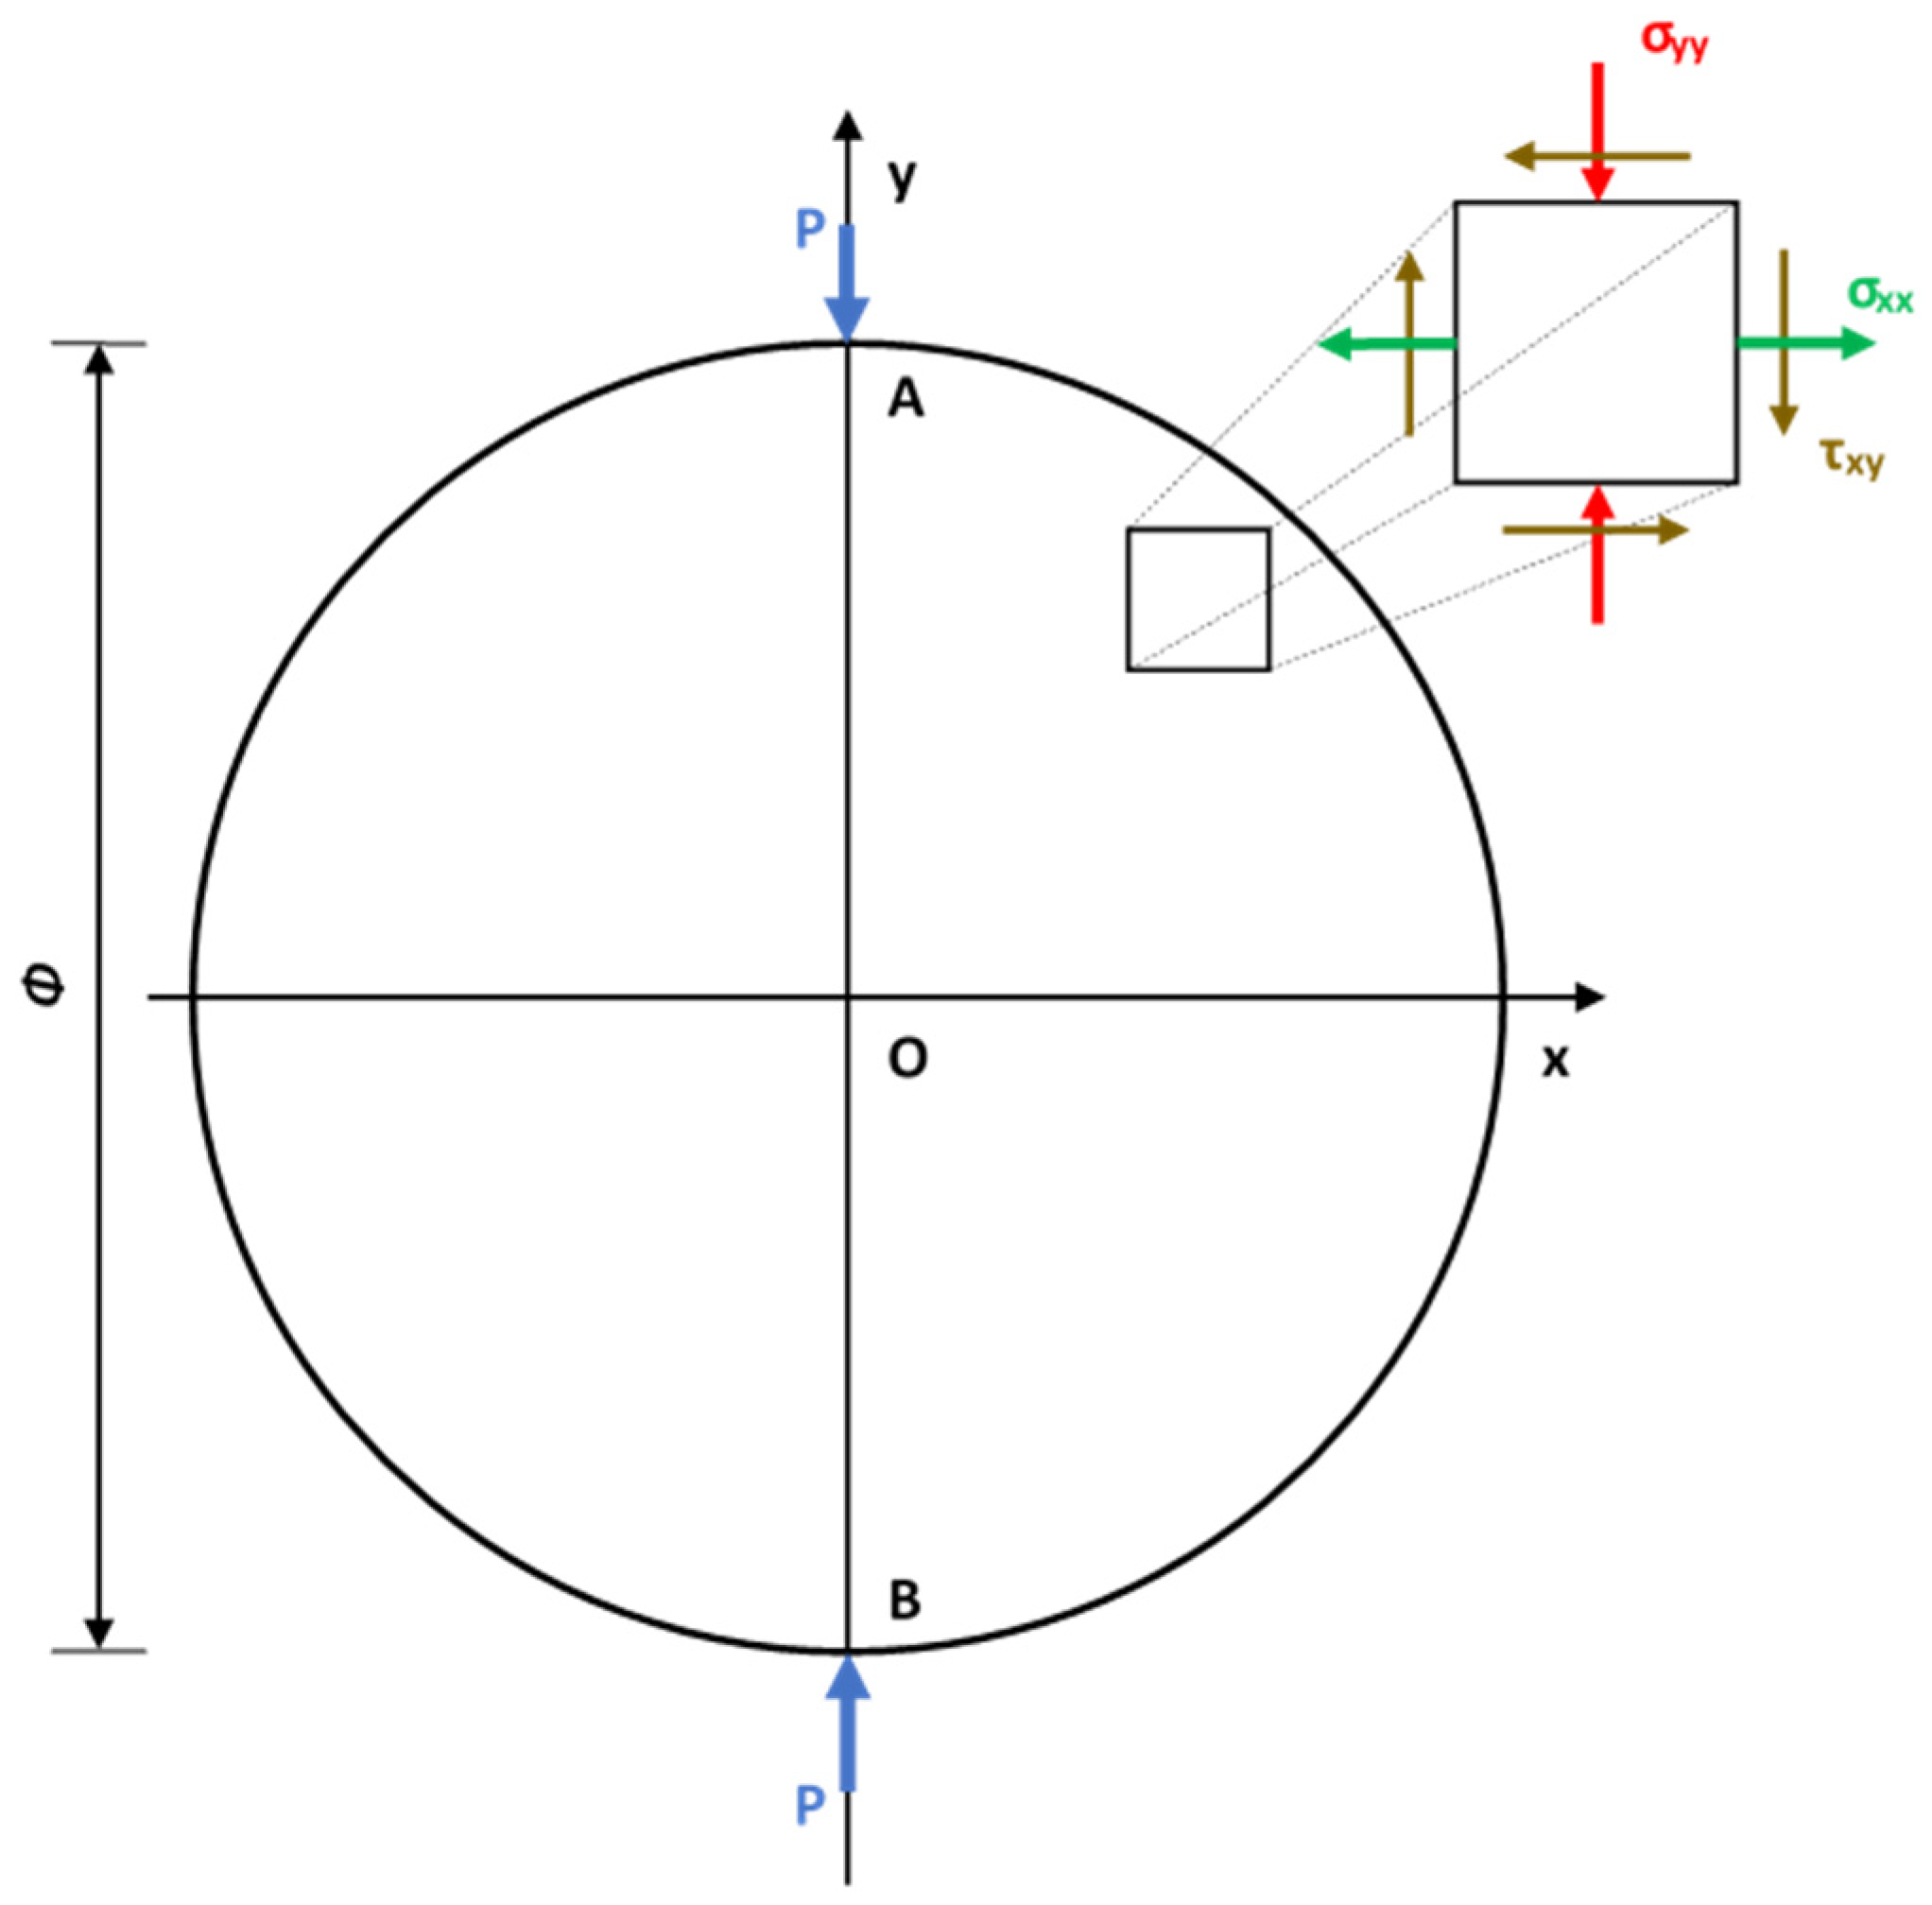
4.2. Application of FEA in Diametral Loading Test of Mechanical Strength
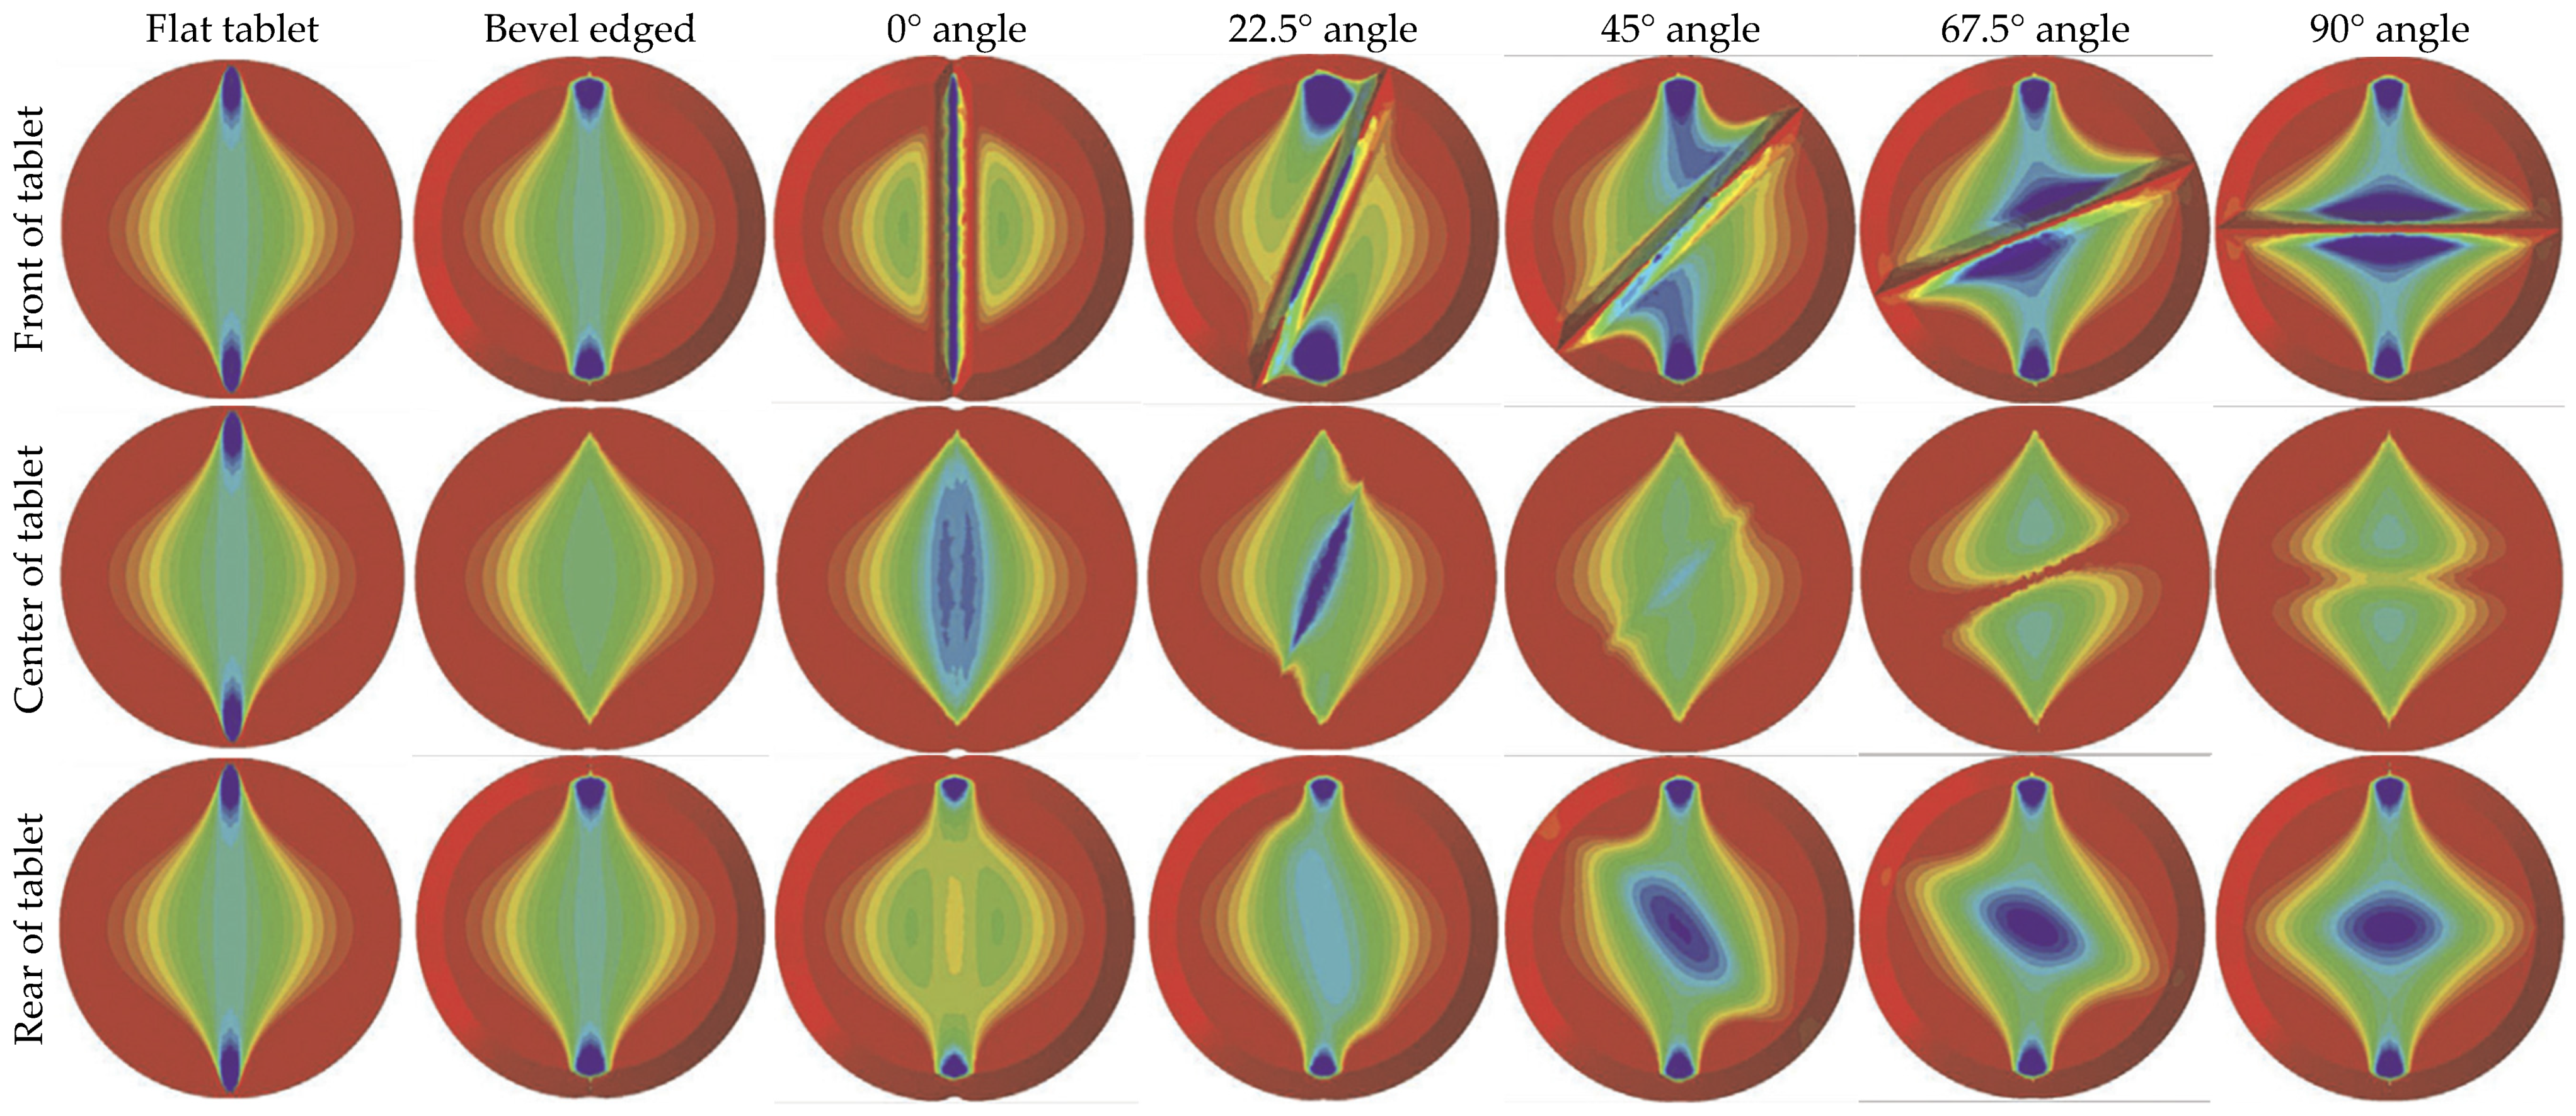
Stress & Strain Distributions during Diametral Loading
5. Outlooks
6. Conclusions
Author Contributions
Funding
Institutional Review Board Statement
Informed Consent Statement
Data Availability Statement
Conflicts of Interest
References
- Heckel, R. Density-pressure relationships in powder compaction. Trans. Metall. Soc. AIME 1961, 221, 671–675. [Google Scholar]
- Leuenberger, H.; Rohera, B.D. Fundamentals of Powder Compression. II. The Compression of Binary Powder Mixtures. Pharm. Res. 1986, 3, 65–74. [Google Scholar] [CrossRef] [PubMed]
- Leuenberger, H.; Rohera, B.D. Fundamentals of Powder Compression. I. The Compactibility and Compressibility of Pharmaceutical Powders. Pharm. Res. 1986, 3, 12–22. [Google Scholar] [CrossRef] [PubMed]
- Cunningham, J.C.; Sinka, I.C.; Zavaliangos, A. Analysis of tablet compaction. I. Characterization of mechanical behavior of powder and powder/tooling friction. J. Pharm. Sci. 2004, 93, 2022–2039. [Google Scholar] [CrossRef] [PubMed]
- Baroutaji, A.; Lenihan, S.; Bryan, K. Combination of finite element method and Drucker-Prager Cap material model for simulation of pharmaceutical tableting process. Mater. Und Werkst. 2017, 48, 1133–1145. [Google Scholar] [CrossRef]
- LaMarche, K.; Buckley, D.; Hartley, R.; Qian, F.; Badawy, S. Assessing materials’ tablet compaction properties using the Drucker–Prager Cap model. Powder Technol. 2014, 267, 208–220. [Google Scholar] [CrossRef]
- DiMaggio, F.L.; Sandler, I.S. Material model for granular soils. J. Eng. Mech. Div. 1971, 97, 935–950. [Google Scholar] [CrossRef]
- Drucker, D.C.; Prager, W. Soil mechanics and plastic analysis or limit design. Q. Appl. Math. 1952, 10, 157–165. [Google Scholar] [CrossRef] [Green Version]
- Schofield, A.N.; Wroth, P. Critical State Soil Mechanics; McGraw-Hill London: Lonlon, UK, 1968; Volume 310. [Google Scholar]
- Sinka, C. Modelling Powder Compaction. KONA Powder Part. J. 2007, 25, 4–22. [Google Scholar] [CrossRef] [Green Version]
- Edmans, B.D.; Sinka, I.C. Numerical derivation of a normal contact law for compressible plastic particles. Mech. Mater. 2020, 146, 103297. [Google Scholar] [CrossRef]
- Sinka, I.C.; Cunningham, J.C.; Zavaliangos, A. The effect of wall friction in the compaction of pharmaceutical tablets with curved faces: A validation study of the Drucker–Prager Cap model. Powder Technol. 2003, 133, 33–43. [Google Scholar] [CrossRef]
- Al-Khattat, I.M.; Al-Hassani, S.T.S. Towards a computer-aided analysis and design of tablet compaction. Chem. Eng. Sci. 1987, 42, 707–712. [Google Scholar] [CrossRef]
- Al-Khattat, I. Continuum Model for Friction with Applications in Metal Forming Plasticity. Ph.D. Thesis, Stanford University, Stanford, CA, USA, 1981. [Google Scholar]
- Michrafy, A.; Ringenbacher, D.; Tchoreloff, P. Modelling the compaction behaviour of powders: Application to pharmaceutical powders. Powder Technol. 2002, 127, 257–266. [Google Scholar] [CrossRef] [Green Version]
- Sinka, I.; Cunningham, J.; Zavaliangos, A. Experimental characterization and numerical simulation of die wall friction in pharmaceutical powder compaction. Adv. Powder Metall. Part. Mater. 2001, 1–46. [Google Scholar]
- USP35-NF30. Chapter <1217> Tablet Breaking Force. In The United States Pharmacopeia: USP 35, The National Formulary: NF 30; U.S. Pharmacopeial Convention, Inc.: Rockville, MD, USA, 2012. [Google Scholar]
- Courant, R. Variational methods for the solution of problems of equilibrium and vibrations. Bull. Am. Math. Soc. 1943, 49, 1–23. [Google Scholar] [CrossRef] [Green Version]
- Ritz, W. Über eine neue Methode zur Lösung gewisser Variationsprobleme der mathematischen Physik. J. Für Die Reine Und Angew. Math. 1909, 1909, 1–61. [Google Scholar] [CrossRef]
- Galerkin, B.G. On electrical circuits for the approximate solution of the Laplace equation. Vestn. Inzhenerov I Tekhnikovi 1915, 19, 897–908. [Google Scholar]
- Clough, R.W. The finite element method in plane stress analysis. In Proceedings of the 2nd ASCE Conference on Electronic Computation, Pittsburgh, PA, USA, 8–9 September 1960. [Google Scholar]
- Hutton, D.V. Fundamentals of Finite Element Analysis; McGraw-Hill: New York, NY, USA, 2004. [Google Scholar]
- Frey, P.J.; George, P.-L. Mesh Generation: Application to Finite Elements; Iste: Eugene, OR, USA, 2007. [Google Scholar]
- Reddy, J.N. An Introduction to Nonlinear Finite Element Analysis Second Edition: With Applications to Heat Transfer, Fluid Mechanics, and Solid Mechanics; OUP Oxford: Oxford, UK, 2014. [Google Scholar]
- Cook, R.D. Concepts and Applications of Finite Element Analysis; John Wiley & Sons: Hoboken, NJ, USA, 2007. [Google Scholar]
- Logan, D.L. A First Course in the Finite Element Method; Cengage Learning: Boston, MA, USA, 2016. [Google Scholar]
- Sinha, T.; Bharadwaj, R.; Curtis, J.S.; Hancock, B.C.; Wassgren, C. Finite element analysis of pharmaceutical tablet compaction using a density dependent material plasticity model. Powder Technol. 2010, 202, 46–54. [Google Scholar] [CrossRef]
- Mazel, V.; Diarra, H.; Busignies, V.; Tchoreloff, P. Evolution of the Die-Wall Pressure during the Compression of Biconvex Tablets: Experimental Results and Comparison with FEM Simulation. J. Pharm. Sci. 2015, 104, 4339–4344. [Google Scholar] [CrossRef]
- Desbois, L.; Tchoreloff, P.; Mazel, V. Characterization and modeling of the viscoelasticity of pharmaceutical tablets. Int. J. Pharm. 2020, 587, 119695. [Google Scholar] [CrossRef] [PubMed]
- Malvern, L.E. Introduction to the Mechanics of a Continuous Medium; Prentice-Hall, Inc.: Englewood Cliffs, NJ, USA, 1969. [Google Scholar]
- American Society of Mechanical Engineers. Standard for Verification and Validation in Computational Solid Mechanics; American Society of Mechanical Engineers: New York, NY, USA, 2019. [Google Scholar]
- Fleck, N.A. On the cold compaction of powders. J. Mech. Phys. Solids 1995, 43, 1409–1431. [Google Scholar] [CrossRef]
- Kuhn, H. Deformation characteristics and plasticity theory of sintered powder materials. Int. J. Powder Metall. 1971, 7, 15–26. [Google Scholar]
- Oyane, M.; Shima, S.; Tabata, T. Consideration of basic equations, and their application, in the forming of metal powders and porous metals. J. Mech. Work. Technol. 1978, 1, 325–341. [Google Scholar] [CrossRef]
- Landau, L.D.; Lifshitz, E.M. Course of Theoretical Physics Vol 7: Theory and Elasticity; Pergamon Press: Oxford, UK, 1959. [Google Scholar]
- Timoshenko, S.; Goodier, J. Theory of Elasticity: New York; McGraw-Hill: London, UK, 1970. [Google Scholar]
- Armstrong, N.A. Time-dependent factors involved in powder compression and tablet manufacture. Int. J. Pharm. 1989, 49, 1–13. [Google Scholar] [CrossRef]
- Bolhuis, G.; Chowhan, Z.; Alderborn, E.; Nyström, C. Pharmaceutical Powder Compaction Technology; Alderborn, G., Nystrom, C., Eds.; Marcel Dekker: New York, NY, USA, 1996. [Google Scholar]
- Vincent, J. Structural Biomaterials; Princeton University Press: Princeton, NJ, USA, 2012. [Google Scholar]
- Marques, S.P.; Creus, G.J. Computational Viscoelasticity; Springer Science & Business Media: Berlin, Germany, 2012. [Google Scholar]
- Rippie, E.G.; Danielson, D.W. Viscoelastic stress/strain behavior of pharmaceutical tablets: Analysis during unloading and postcompression periods. J. Pharm. Sci. 1981, 70, 476–482. [Google Scholar] [CrossRef] [PubMed]
- Biot, M.A. Theory of Stress-Strain Relations in Anisotropic Viscoelasticity and Relaxation Phenomena. J. Appl. Phys. 1954, 25, 1385–1391. [Google Scholar] [CrossRef]
- Park, S.W.; Schapery, R.A. Methods of interconversion between linear viscoelastic material functions. Part I—A numerical method based on Prony series. Int. J. Solids Struct. 1999, 36, 1653–1675. [Google Scholar] [CrossRef]
- Elkholy, A. Incremental Theory of Plasticity, the Classical Form vs a Modified Form. Can. Metall. Q. 1983, 22, 397–401. [Google Scholar] [CrossRef]
- Dubey, R.N. Incremental theory of plasticity a new approach. Mech. Res. Commun. 1977, 4, 35–39. [Google Scholar] [CrossRef]
- Vavřík, D. Comparison of the deformation and incremental theory of plasticity used for experimental mechanics problems. In Proceedings of the National Conference with International Participation, Svratka, Czech Republic, 11–14 May 2009; pp. 1387–1391. [Google Scholar]
- Lee, Y.-L.; Barkey, M.E. Chapter 7-Fundamentals of Cyclic Plasticity Theories. In Metal Fatigue Analysis Handbook; Lee, Y.-L., Barkey, M.E., Kang, H.-T., Eds.; Butterworth-Heinemann: Boston, MA, USA, 2012; pp. 253–297. [Google Scholar] [CrossRef]
- Meggyes, Á. Multiple decomposition in finite deformation theory. Acta Mech. 2001, 146, 169–182. [Google Scholar] [CrossRef]
- Zhuang, Z.; Liu, Z.; Cui, Y. Chapter 3-Strain Gradient Plasticity Theory at the Microscale. In Dislocation Mechanism-Based Crystal Plasticity; Zhuang, Z., Liu, Z., Cui, Y., Eds.; Academic Press: Cambridge, MA, USA, 2019; pp. 57–90. [Google Scholar] [CrossRef]
- Spencer, A. Part III. Theory of invariants. Contin. Phys. 1971, 1, 239–353. [Google Scholar]
- Alejano, L.R.; Bobet, A. Drucker–Prager Criterion. Rock Mech. Rock Eng. 2012, 45, 995–999. [Google Scholar] [CrossRef] [Green Version]
- Jin, W.; Klinger, J.L.; Westover, T.L.; Huang, H. A density dependent Drucker-Prager/Cap model for ring shear simulation of ground loblolly pine. Powder Technol. 2020, 368, 45–58. [Google Scholar] [CrossRef]
- Labuz, J.F.; Zang, A. Mohr–Coulomb Failure Criterion. Rock Mech. Rock Eng. 2012, 45, 975–979. [Google Scholar] [CrossRef] [Green Version]
- Wojciechowski, M. A note on the differences between Drucker-Prager and Mohr-Coulomb shear strength criteria. Studia Geotech. Et Mech. 2018, 40, 163–169. [Google Scholar] [CrossRef] [Green Version]
- Hill, R. The Mathematical Theory of Plasticity; Oxford University Press: London, UK, 1950. [Google Scholar]
- Prager, W. An introduction to the mathematical theory of plasticity. J. Appl. Phys. 1947, 18, 375–383. [Google Scholar] [CrossRef]
- Michrafy, A.; Kadiri, M.S.; Dodds, J.A. Wall Friction and its Effects on the Density Distribution in the Compaction of Pharmaceutical Excipients. Chem. Eng. Res. Des. 2003, 81, 946–952. [Google Scholar] [CrossRef] [Green Version]
- Train, D. An Investigation into the Compaction of Powders. J. Pharm. Pharmacol. 1956, 8, 745–761. [Google Scholar] [CrossRef] [PubMed]
- Nedderman, R.M. Statics and Kinematics of Granular Materials; Cambridge University Press: Cambridge, MA, USA, 1992; Volume 352. [Google Scholar]
- Diarra, H.; Mazel, V.; Boillon, A.; Rehault, L.; Busignies, V.; Bureau, S.; Tchoreloff, P. Finite Element Method (FEM) modeling of the powder compaction of cosmetic products: Comparison between simulated and experimental results. Powder Technol. 2012, 224, 233–240. [Google Scholar] [CrossRef]
- Krok, A.; Peciar, M.; Fekete, R. Numerical investigation into the influence of the punch shape on the mechanical behavior of pharmaceutical powders during compaction. Particuology 2014, 16, 116–131. [Google Scholar] [CrossRef]
- Podczeck, F. Methods for the practical determination of the mechanical strength of tablets—From empiricism to science. Int. J. Pharm. 2012, 436, 214–232. [Google Scholar] [CrossRef] [PubMed]
- Barcellos, F.; Carneiro, A. Concrete tensile strength. RILEM Bull. 1953, 13, 97–123. [Google Scholar]
- Akazawa, T. Tension Test Methods for Concretes, International Union of Testing and Research Laboratories for-Materials and Structures (RILEM). Paris Bull. 1953, 16, 11–23. [Google Scholar]
- Pitt, K.G.; Heasley, M.G. Determination of the tensile strength of elongated tablets. Powder Technol. 2013, 238, 169–175. [Google Scholar] [CrossRef]
- Frocht, M.M. Photoelasticity; J. Wiley: New York, NY, USA, 1948. [Google Scholar]
- Muskhelishvili, N. Some basic problems of the mathematical theory of elasticity. Noordhoff Gron. 1963, 17404, 1. [Google Scholar]
- Rudnick, A.; Hunter, A.; Holden, F. An analysis of the diametral-compression test. Mater. Res. Stand. 1963, 3, 283–289. [Google Scholar]
- Fell, J.T.; Newton, J.M. Determination of tablet strength by the diametral-compression test. J. Pharm. Sci. 1970, 59, 688–691. [Google Scholar] [CrossRef] [PubMed]
- Pitt, K.G.; Newton, J.M.; Stanley, P. Tensile fracture of doubly-convex cylindrical discs under diametral loading. J. Mater. Sci. 1988, 23, 2723–2728. [Google Scholar] [CrossRef]
- Pitt, K.G.; Newton, J.M.; Stanley, P. Stress distributions in doubly convex cylindrical discs under diametral loading. J. Phys. D Appl. Phys. 1989, 22, 1114–1127. [Google Scholar] [CrossRef]
- Newton, J.M.; Haririan, I.; Podczeck, F. The determination of the mechanical properties of elongated tablets of varying cross section. Eur. J. Pharm. Biopharm. 2000, 49, 59–64. [Google Scholar] [CrossRef]
- Stanley, P.; Newton, J.M. The tensile fracture stress of capsule-shaped tablets. J. Pharm. Pharmacol. 1980, 32, 852–854. [Google Scholar] [CrossRef] [PubMed]
- Diarra, H.; Mazel, V.; Busignies, V.; Tchoreloff, P. Investigating the effect of tablet thickness and punch curvature on density distribution using finite elements method. Int. J. Pharm. 2015, 493, 121–128. [Google Scholar] [CrossRef] [PubMed]
- Han, L.H.; Elliott, J.; Best, S.; Cameron, R.; Bentham, A.C.; Mills, A.; Amidon, G.E.; Hancock, B.C. Numerical Simulation on Pharmaceutical Powder Compaction. Mater. Sci. Forum 2008, 575, 560–565. [Google Scholar] [CrossRef]
- Han, L.H.; Elliott, J.A.; Bentham, A.C.; Mills, A.; Amidon, G.E.; Hancock, B.C. A modified Drucker-Prager Cap model for die compaction simulation of pharmaceutical powders. Int. J. Solids Struct. 2008, 45, 3088–3106. [Google Scholar] [CrossRef] [Green Version]
- Hayashi, Y.; Miura, T.; Shimada, T.; Onuki, Y.; Obata, Y.; Takayama, K. Prediction of Tablet Characteristics from Residual Stress Distribution Estimated by the Finite Element Method. J. Pharm. Sci. 2013, 102, 3678–3686. [Google Scholar] [CrossRef] [PubMed]
- Hayashi, Y.; Otoguro, S.; Miura, T.; Onuki, Y.; Obata, Y.; Takayama, K. Effect of Process Variables on the Drucker–Prager Cap Model and Residual Stress Distribution of Tablets Estimated by the Finite Element Method. Chem. Pharm. Bull. 2014, 62, 1062–1072. [Google Scholar] [CrossRef] [PubMed] [Green Version]
- Huang, C.; Klinzing, G.; Procopio, A.; Yang, F.; Ren, J.; Burlage, R.; Zhu, L.; Su, Y. Understanding Compression-Induced Amorphization of Crystalline Posaconazole. Mol. Pharm. 2019, 16, 825–833. [Google Scholar] [CrossRef] [PubMed]
- Kadiri, M.S.; Michrafy, A.; Dodds, J.A. Pharmaceutical powders compaction: Experimental and numerical analysis of the density distribution. Powder Technol. 2005, 157, 176–182. [Google Scholar] [CrossRef] [Green Version]
- Mazel, V.; Guerard, S.; Croquelois, B.; Kopp, J.B.; Girardot, J.; Diarra, H.; Busignies, V.; Tchoreloff, P. Reevaluation of the diametral compression test for tablets using the flattened disc geometry. Int. J. Pharm. 2016, 513, 669–677. [Google Scholar] [CrossRef] [PubMed] [Green Version]
- Otoguro, S.; Hayashi, Y.; Miura, T.; Uehara, N.; Utsumi, S.; Onuki, Y.; Obata, Y.; Takayama, K. Numerical Investigation of the Residual Stress Distribution of Flat-Faced and Convexly Curved Tablets Using the Finite Element Method. Chem. Pharm. Bull. 2015, 63, 890–900. [Google Scholar] [CrossRef] [PubMed] [Green Version]
- Si, G.N.; Lan, C. Modeling and Simulation of Pharmaceutical Powder Compaction. Appl. Mech. Mater. 2012, 217, 1403–1406. [Google Scholar] [CrossRef]
- Sinha, T.; Curtis, J.S.; Hancock, B.C.; Wassgren, C. A study on the sensitivity of Drucker–Prager Cap model parameters during the decompression phase of powder compaction simulations. Powder Technol. 2010, 198, 315–324. [Google Scholar] [CrossRef]
- Takayama, K.; Sato, T.; Sato, K.; Todo, H.; Obata, Y.; Sugibayashi, K. Prediction of tablet characteristics based on sparse modeling for residual stresses simulated by the finite element method incorporating Drucker-Prager cap model. J. Drug Deliv. Sci. Technol. 2019, 52, 1021–1031. [Google Scholar] [CrossRef]
- Croquelois, B.; Girardot, J.; Kopp, J.B.; Cazautets, C.; Tchoreloff, P.; Mazel, V. Breaking pharmaceutical tablets with a hole: Reevaluation of the stress concentration factor and influence of the hole size. Powder Technol. 2017, 317, 126–132. [Google Scholar] [CrossRef] [Green Version]
- Drake, K.R.; Newton, J.M.; Mokhtary-Saghafi, S.; Davies, P.N. Tensile stresses generated in pharmaceutical tablets by opposing compressive line loads. Eur. J. Pharm. Sci. 2007, 30, 273–279. [Google Scholar] [CrossRef] [PubMed]
- Okada, N.; Hayashi, Y.; Onuki, Y.; Miura, T.; Obata, Y.; Takayama, K. Mechanical Stress Simulation of Scored Tablets Based on the Finite Element Method and Experimental Verification. Chem. Pharm. Bull. 2016, 64, 1142–1148. [Google Scholar] [CrossRef] [PubMed] [Green Version]
- Podczeck, F.; Drake, K.R.; Newton, J.M. Investigations into the tensile failure of doubly-convex cylindrical tablets under diametral loading using finite element methodology. Int. J. Pharm. 2013, 454, 412–424. [Google Scholar] [CrossRef] [PubMed]
- Podczeck, F.; Newton, J.M.; Fromme, P. Theoretical investigations into the influence of the position of a breaking line on the tensile failure of flat, round, bevel-edged tablets using finite element methodology (FEM) and its practical relevance for industrial tablet strength testing. Int. J. Pharm. 2014, 477, 306–316. [Google Scholar] [CrossRef] [Green Version]
- Radojevic, J.; Yost, E.; Zavaliangos, A. Evaluation of the tensile strength of compacts using square samples produced through triaxial decompression. Powder Technol. 2021, 393, 131–142. [Google Scholar] [CrossRef]
- Shang, C.; Sinka, I.C.; Pan, J. Modelling of the break force of tablets under diametrical compression. Int. J. Pharm. 2013, 445, 99–107. [Google Scholar] [CrossRef]
- Yohannes, B.; Abebe, A. Determination of tensile strength of shaped tablets. Powder Technol. 2021, 383, 11–18. [Google Scholar] [CrossRef]
- Mazel, V.; Diarra, H.; Busignies, V.; Tchoreloff, P. Study of the Validity of the Three-Point Bending Test for Pharmaceutical Round Tablets Using Finite Element Method Modeling. J. Pharm. Sci. 2014, 103, 1305–1308. [Google Scholar] [CrossRef] [PubMed]
- Podczeck, F.; Newton, J.M.; Fromme, P. The bending strength of tablets with a breaking line—Comparison of the results of an elastic and a “brittle cracking” finite element model with experimental findings. Int. J. Pharm. 2015, 495, 485–499. [Google Scholar] [CrossRef] [PubMed]
- Baroutaji, A.; Lenihan, S.; Bryan, K. Compaction analysis and optimisation of convex-faced pharmaceutical tablets using numerical techniques. Particuology 2019, 47, 10–21. [Google Scholar] [CrossRef]
- Furukawa, R.; Chen, Y.; Horiguchi, A.; Takagaki, K.; Nishi, J.; Konishi, A.; Shirakawa, Y.; Sugimoto, M.; Narisawa, S. Numerical evaluation of the capping tendency of microcrystalline cellulose tablets during a diametrical compression test. Int. J. Pharm. 2015, 493, 182–191. [Google Scholar] [CrossRef] [PubMed]
- Garner, S.; Ruiz, E.; Strong, J.; Zavaliangos, A. Mechanisms of crack formation in die compacted powders during unloading and ejection: An experimental and modeling comparison between standard straight and tapered dies. Powder Technol. 2014, 264, 114–127. [Google Scholar] [CrossRef]
- Kadiri, M.S.; Michrafy, A. The effect of punch’s shape on die compaction of pharmaceutical powders. Powder Technol. 2013, 239, 467–477. [Google Scholar] [CrossRef] [Green Version]
- Mazel, V.; Diarra, H.; Malvestio, J.; Tchoreloff, P. Lamination of biconvex tablets: Numerical and experimental study. Int. J. Pharm. 2018, 542, 66–71. [Google Scholar] [CrossRef] [PubMed]
- Wu, C.Y.; Hancock, B.C.; Mills, A.; Bentham, A.C.; Best, S.M.; Elliott, J.A. Numerical and experimental investigation of capping mechanisms during pharmaceutical tablet compaction. Powder Technol. 2008, 181, 121–129. [Google Scholar] [CrossRef]
- Wu, C.Y.; Ruddy, O.M.; Bentham, A.C.; Hancock, B.C.; Best, S.M.; Elliott, J.A. Modelling the mechanical behaviour of pharmaceutical powders during compaction. Powder Technol. 2005, 152, 107–117. [Google Scholar] [CrossRef]
- Mazel, V.; Diarra, H.; Tchoreloff, P. Effect of friction between powder and tooling on the die-wall pressure evolution during tableting: Experimental and numerical results for flat and concave punches. Int. J. Pharm. 2019, 554, 116–124. [Google Scholar] [CrossRef] [PubMed]
- Michrafy, A.; Dodds, J.A.; Kadiri, M.S. Wall friction in the compaction of pharmaceutical powders: Measurement and effect on the density distribution. Powder Technol. 2004, 148, 53–55. [Google Scholar] [CrossRef] [Green Version]
- Sinka, I.C.; Cunningham, J.C.; Zavaliangos, A. Analysis of tablet compaction. II. Finite element analysis of density distributions in convex tablets. J. Pharm. Sci. 2004, 93, 2040–2053. [Google Scholar] [CrossRef] [PubMed]
- Klinzing, G.R.; Zavaliangos, A.; Cunningham, J.; Mascaro, T.; Winstead, D. Temperature and density evolution during compaction of a capsule shaped tablet. Comput. Chem. Eng. 2010, 34, 1082–1091. [Google Scholar] [CrossRef]
- Krok, A.; García-Triñanes, P.; Peciar, M.; Wu, C.-Y. Finite element analysis of thermomechanical behaviour of powders during tabletting. Chem. Eng. Res. Des. 2016, 110, 141–151. [Google Scholar] [CrossRef] [Green Version]
- Zavaliangos, A.; Galen, S.; Cunningham, J.; Winstead, D. Temperature Evolution during Compaction of Pharmaceutical Powders. J. Pharm. Sci. 2008, 97, 3291–3304. [Google Scholar] [CrossRef] [PubMed]
- Diarra, H.; Mazel, V.; Busignies, V.; Tchoreloff, P. FEM simulation of the die compaction of pharmaceutical products: Influence of visco-elastic phenomena and comparison with experiments. Int. J. Pharm. 2013, 453, 389–394. [Google Scholar] [CrossRef] [PubMed]
- Ohsaki, S.; Kushida, K.; Matsuda, Y.; Nakamura, H.; Watano, S. Numerical study for tableting process in consideration of compression speed. Int. J. Pharm. 2020, 575, 118936. [Google Scholar] [CrossRef] [PubMed]
- Abdel-Hamid, S.; Koziolek, M.; Betz, G. Study of radial die-wall pressure during high speed tableting: Effect of formulation variables. Drug Dev. Ind. Pharm. 2012, 38, 623–634. [Google Scholar] [CrossRef]
- Hanus, E.J.; King, L.D. Thermodynamic Effects in the Compression of Solids. J. Pharm. Sci. 1968, 57, 677–684. [Google Scholar] [CrossRef] [PubMed]
- Perzyna, P. The constitutive equations for rate sensitive plastic materials. Q. Appl. Math. 1963, 20, 321–332. [Google Scholar] [CrossRef] [Green Version]
- Stanley, P. Mechanical strength testing of compacted powders. Int. J. Pharm. 2001, 227, 27–38. [Google Scholar] [CrossRef]


Publisher’s Note: MDPI stays neutral with regard to jurisdictional claims in published maps and institutional affiliations. |
© 2022 by the authors. Licensee MDPI, Basel, Switzerland. This article is an open access article distributed under the terms and conditions of the Creative Commons Attribution (CC BY) license (https://creativecommons.org/licenses/by/4.0/).
Share and Cite
Partheniadis, I.; Terzi, V.; Nikolakakis, I. Finite Element Analysis and Modeling in Pharmaceutical Tableting. Pharmaceutics 2022, 14, 673. https://doi.org/10.3390/pharmaceutics14030673
Partheniadis I, Terzi V, Nikolakakis I. Finite Element Analysis and Modeling in Pharmaceutical Tableting. Pharmaceutics. 2022; 14(3):673. https://doi.org/10.3390/pharmaceutics14030673
Chicago/Turabian StylePartheniadis, Ioannis, Vasiliki Terzi, and Ioannis Nikolakakis. 2022. "Finite Element Analysis and Modeling in Pharmaceutical Tableting" Pharmaceutics 14, no. 3: 673. https://doi.org/10.3390/pharmaceutics14030673