
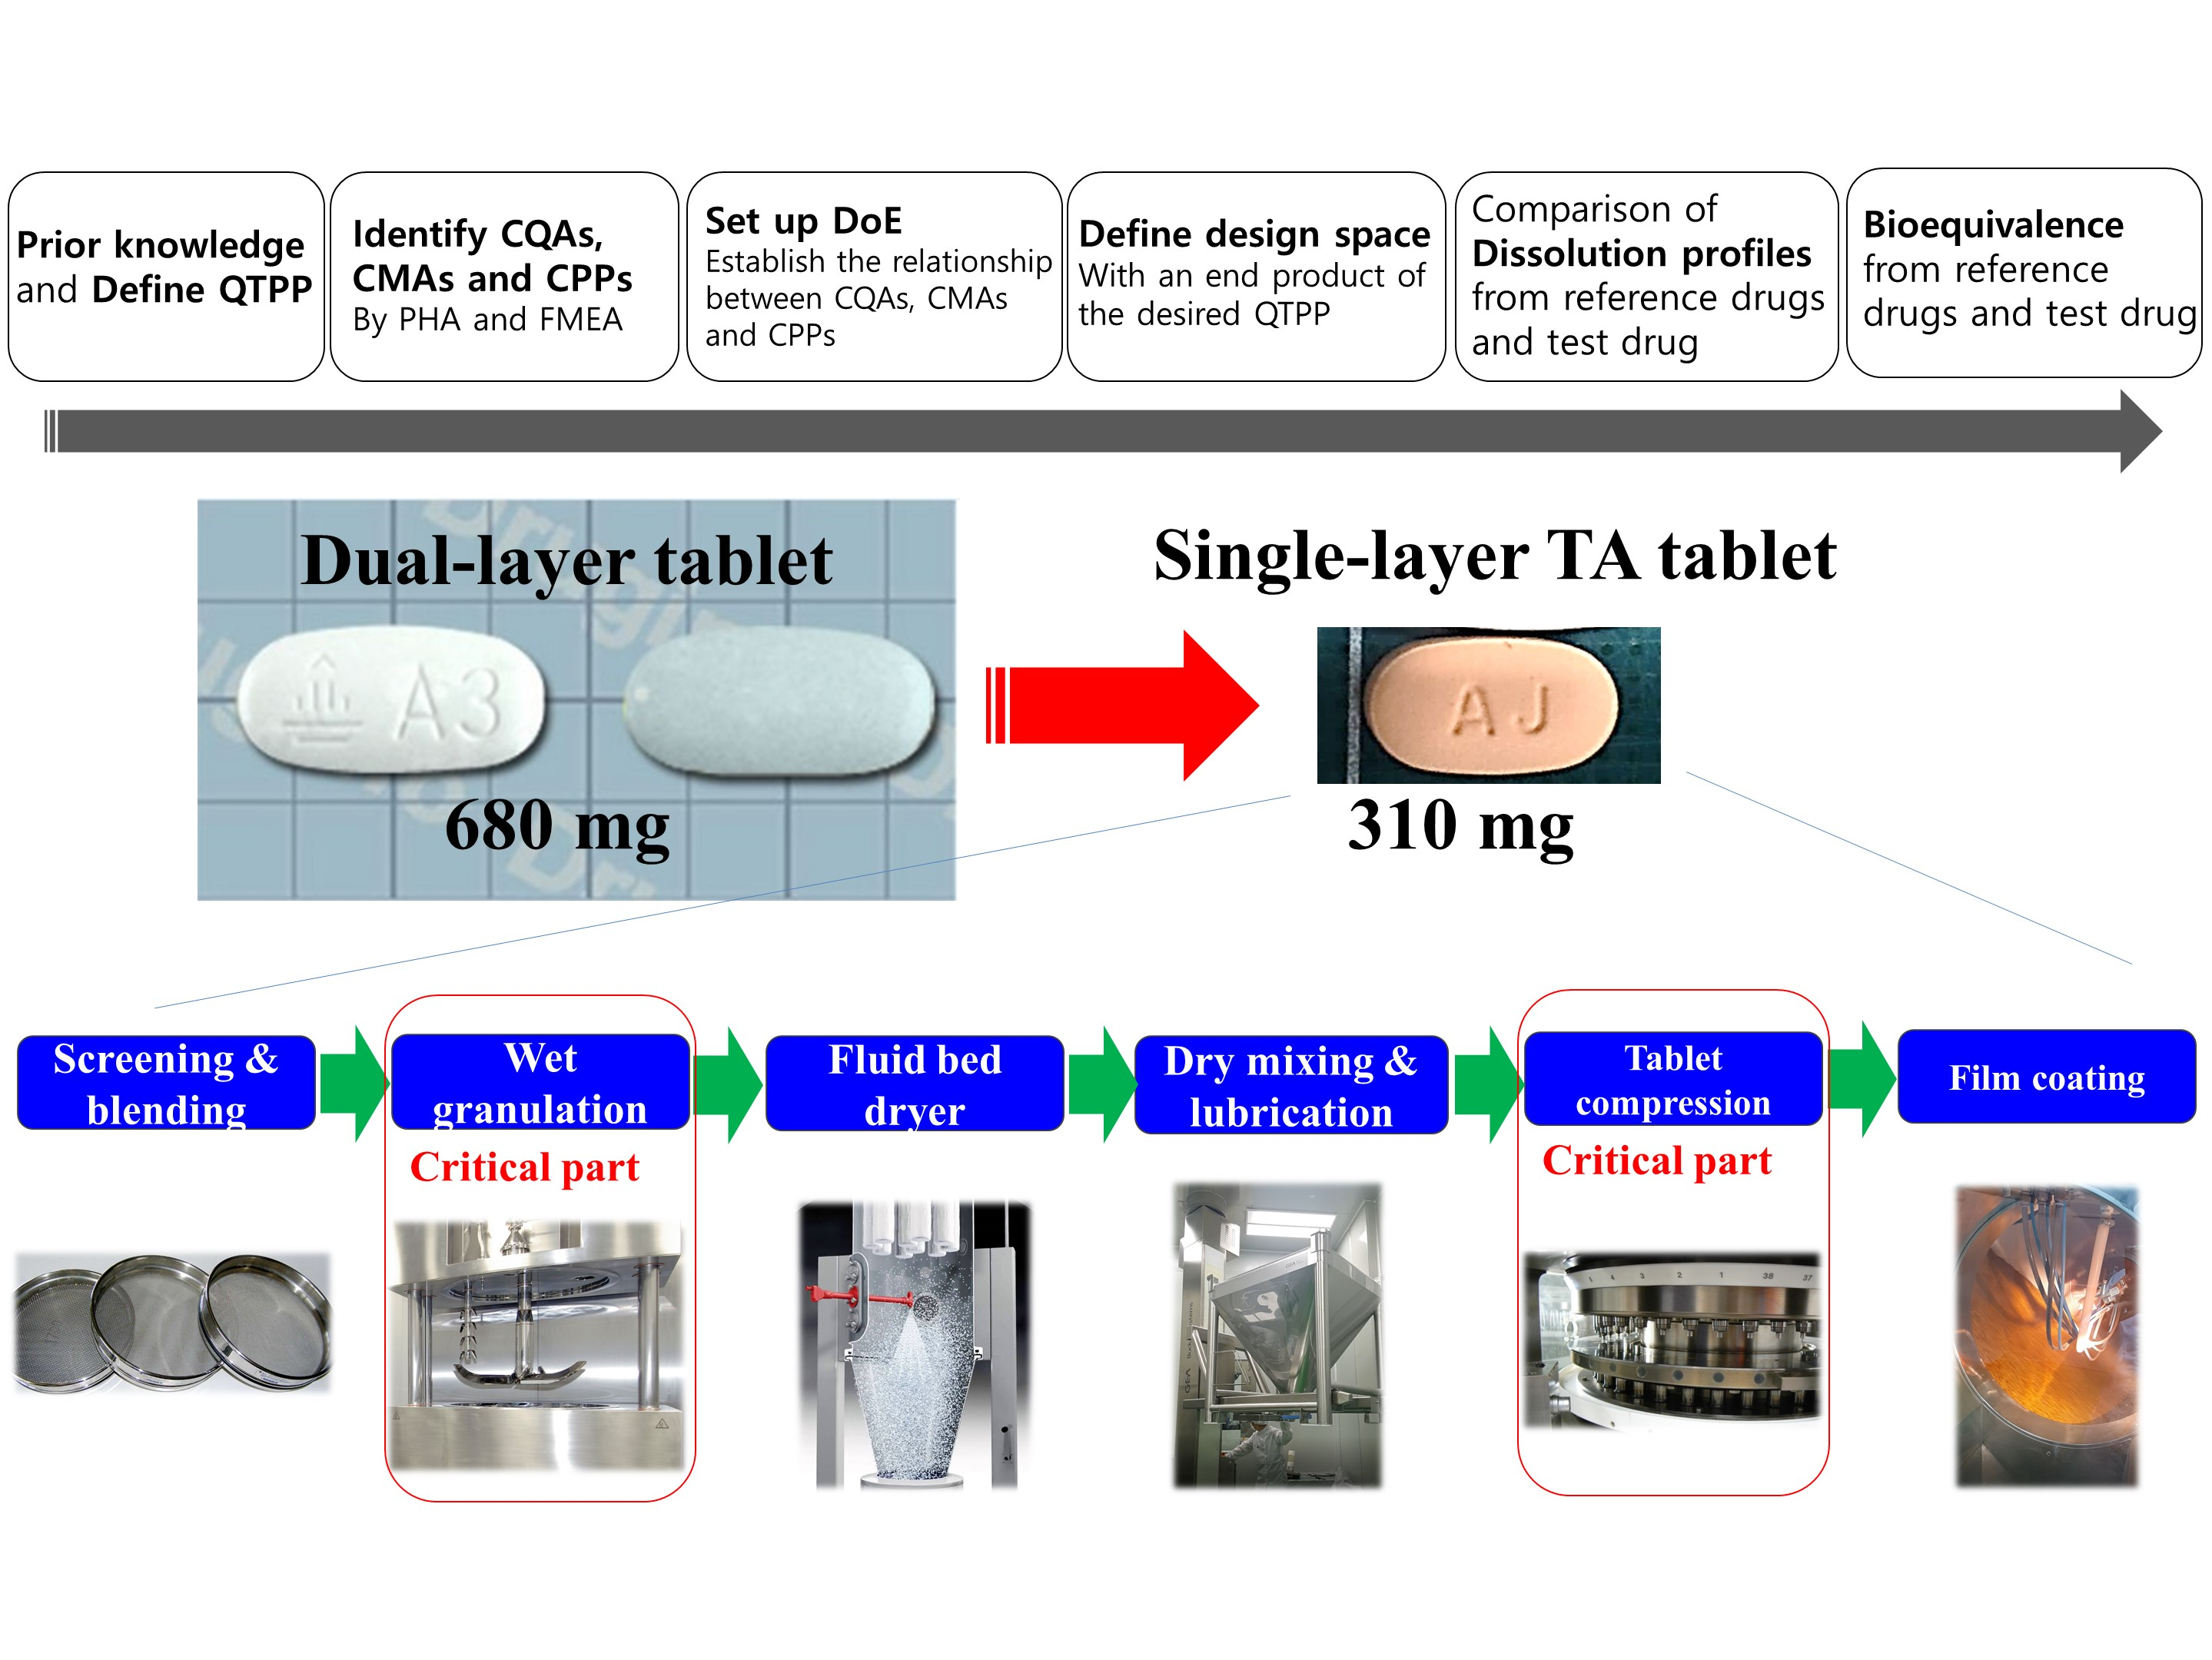
QbD Consideration for Developing a Double-Layered Tablet into a Single-Layered Tablet with Telmisartan and Amlodipine


Abstract
: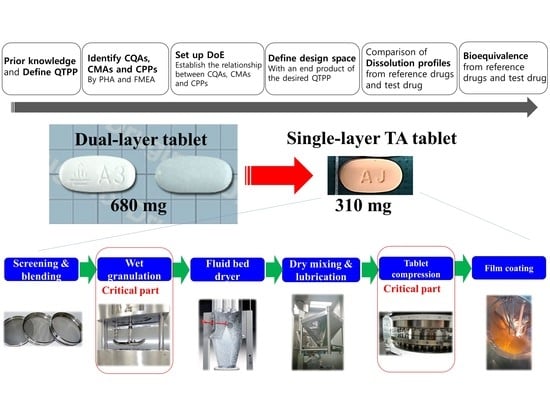
1. Introduction
2. Materials and Methods
2.1. Materials
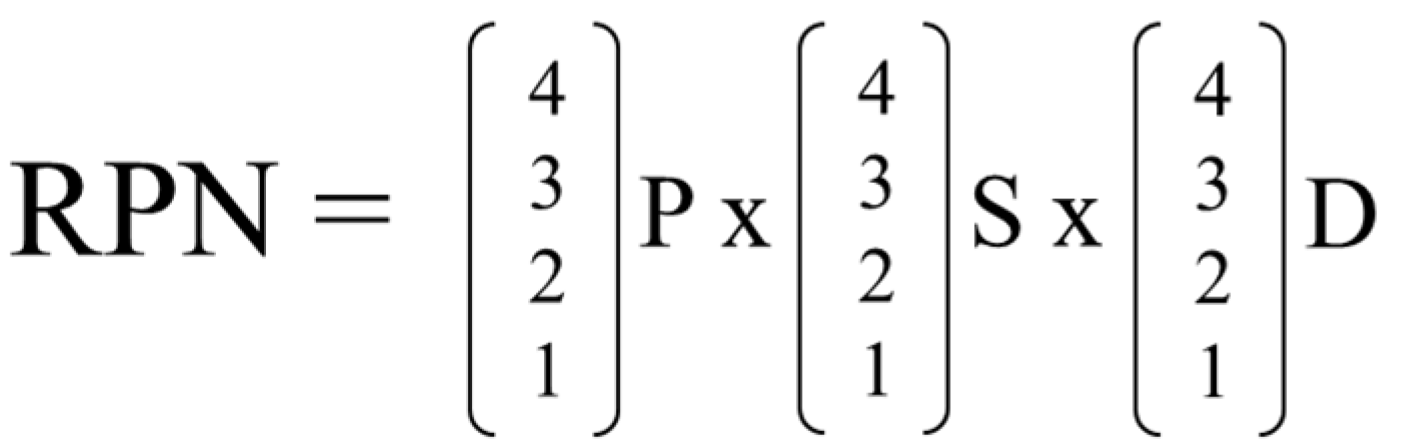
2.2. Initial Risk Assessment by Preliminary Hazard Analysis
2.3. Main Risk Assessment by Failure Mode and Effect Analysis
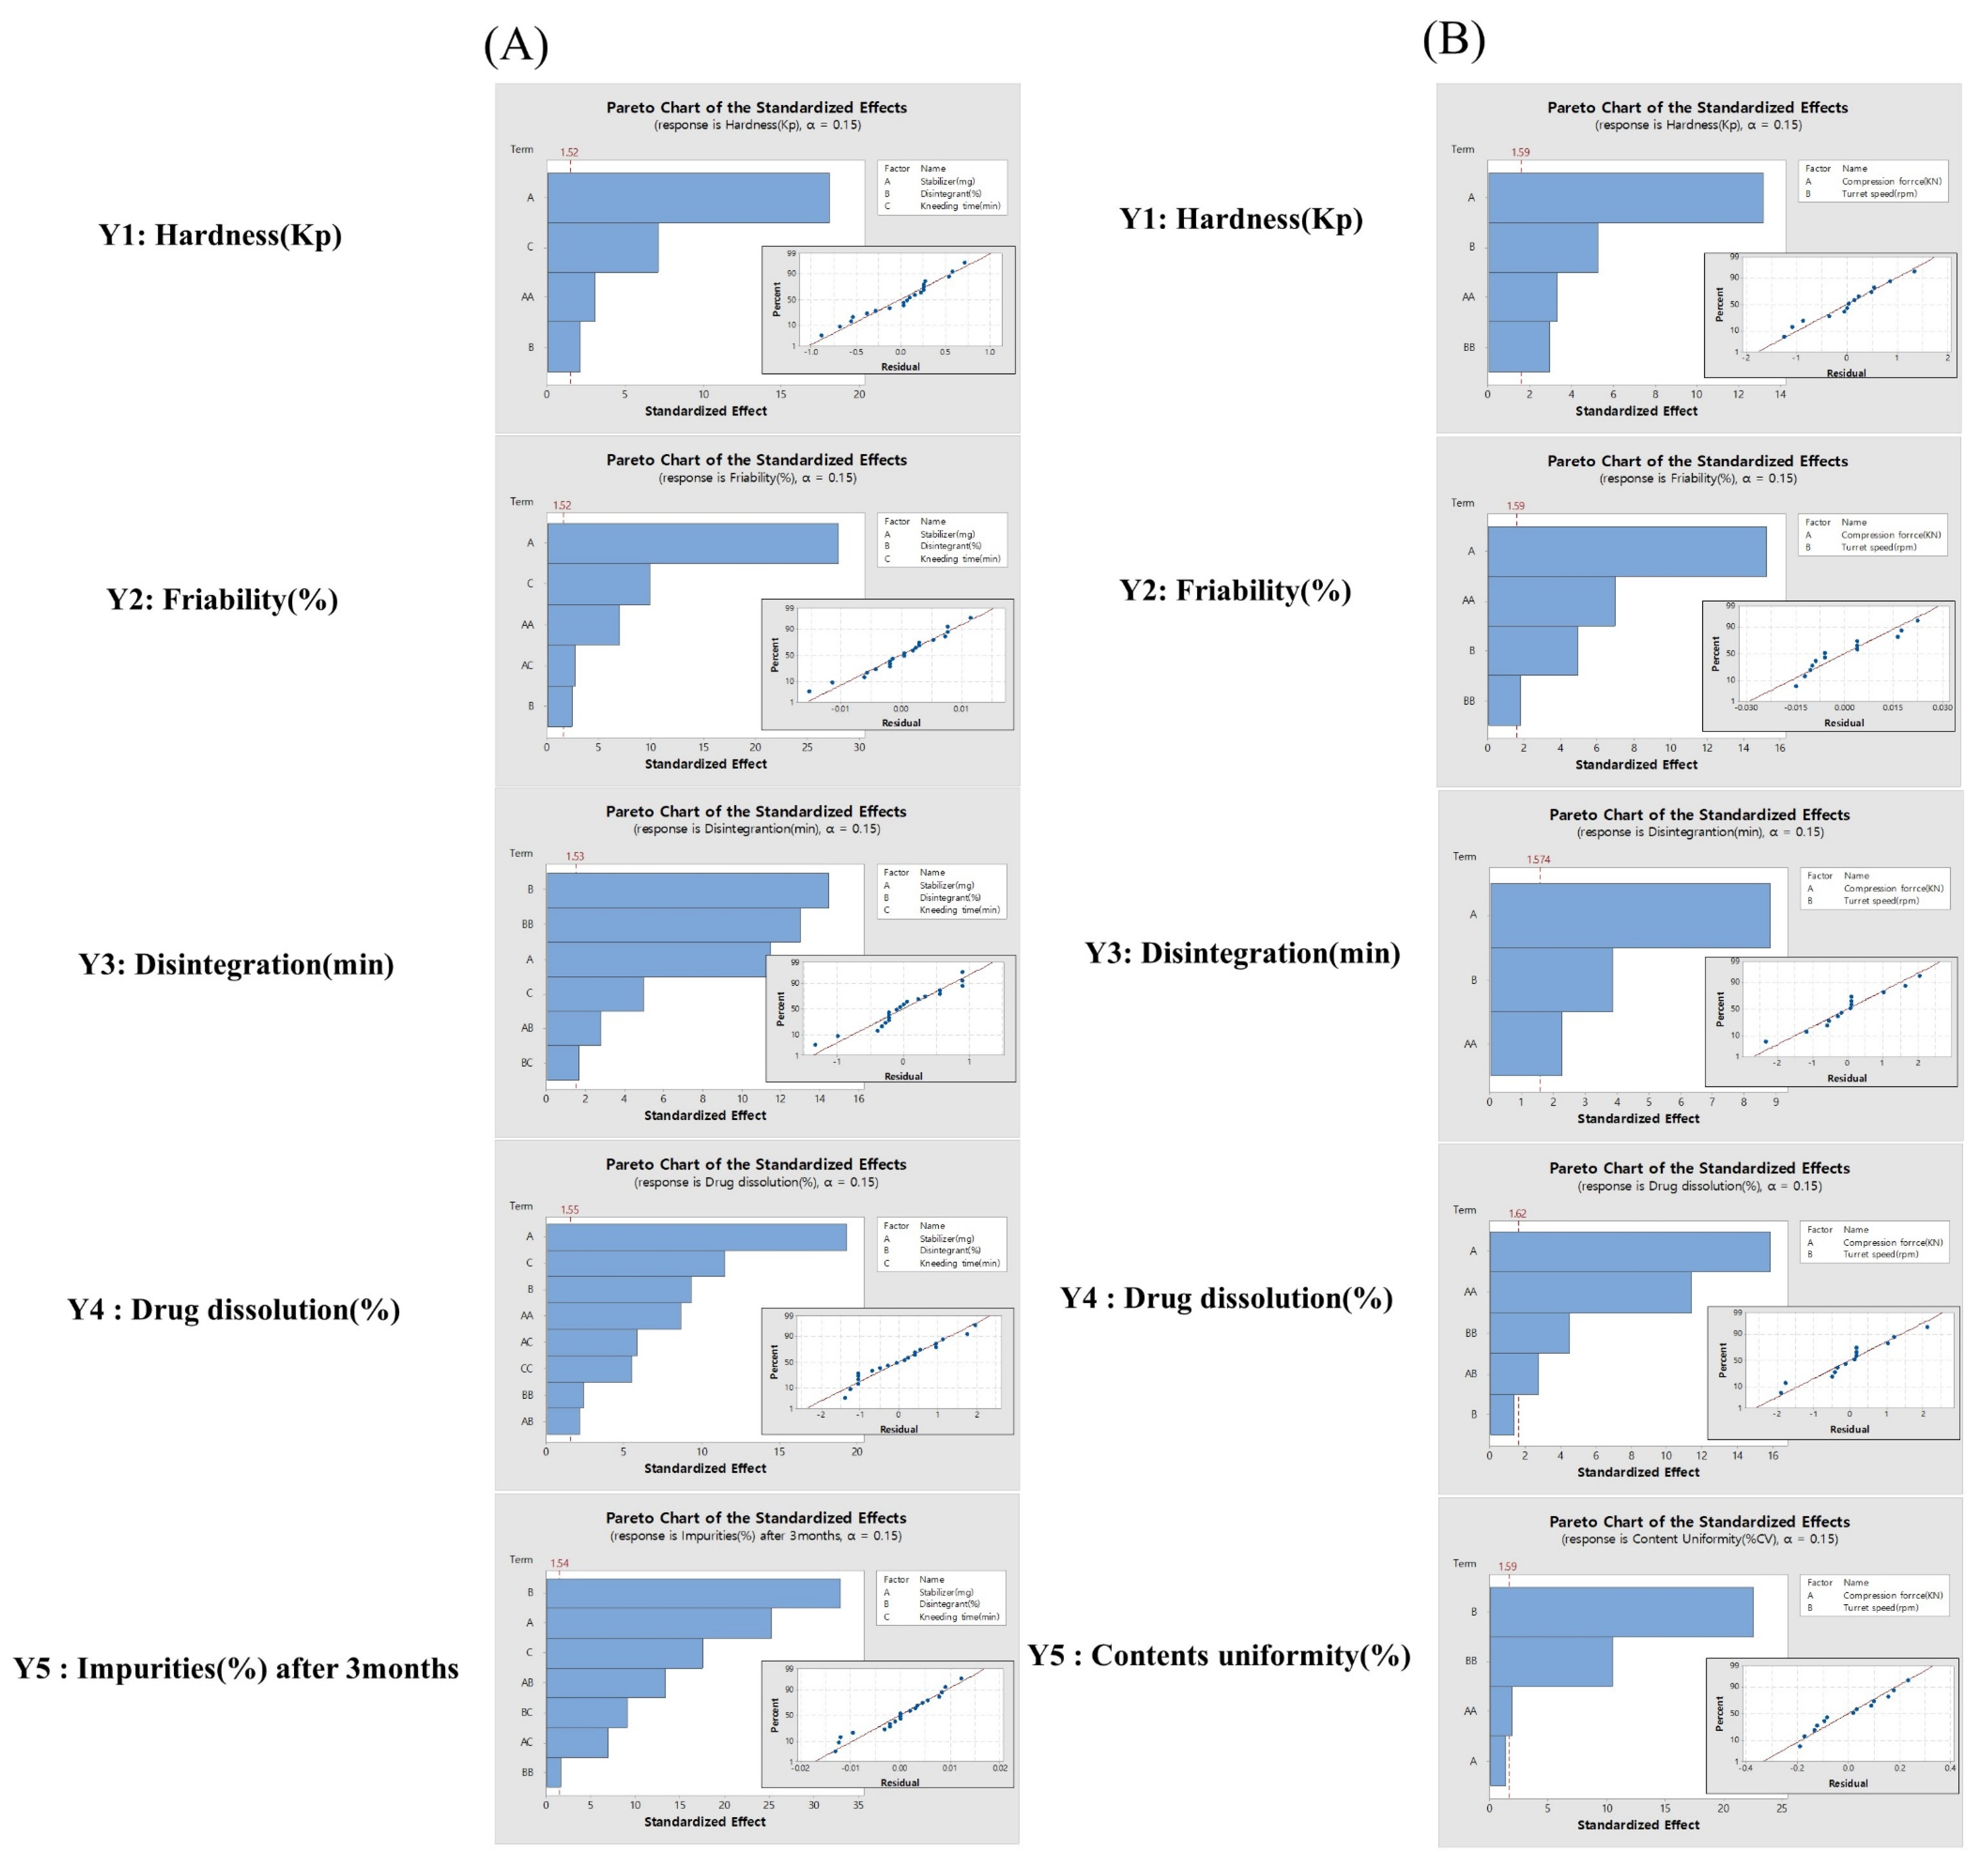
2.4. Design of Experiments
2.5. Development of the Design Space
2.6. Preparation of Telmisartan Potassium and Amlodipine Besylate Tablets
2.7. Evaluation of Single-Layered TA Tablets
2.7.1. Hardness Test
2.7.2. Friability
2.7.3. Disintegration Test
2.7.4. In Vitro Dissolution of TA Tablets
2.7.5. High-Performance Liquid Chromatography (HPLC) Analysis
2.8. Pharmacokinetics
2.9. Statistical Analysis
3. Results and Discussion
3.1. Initial Risk Assessment of the Critical Material Attributes and Critical Process Parameters Affecting Critical Quality Attributes
3.2. Main Risk Assessment of the Critical Material Attributes and Critical Process Parameters Affecting Critical Quality Attributes
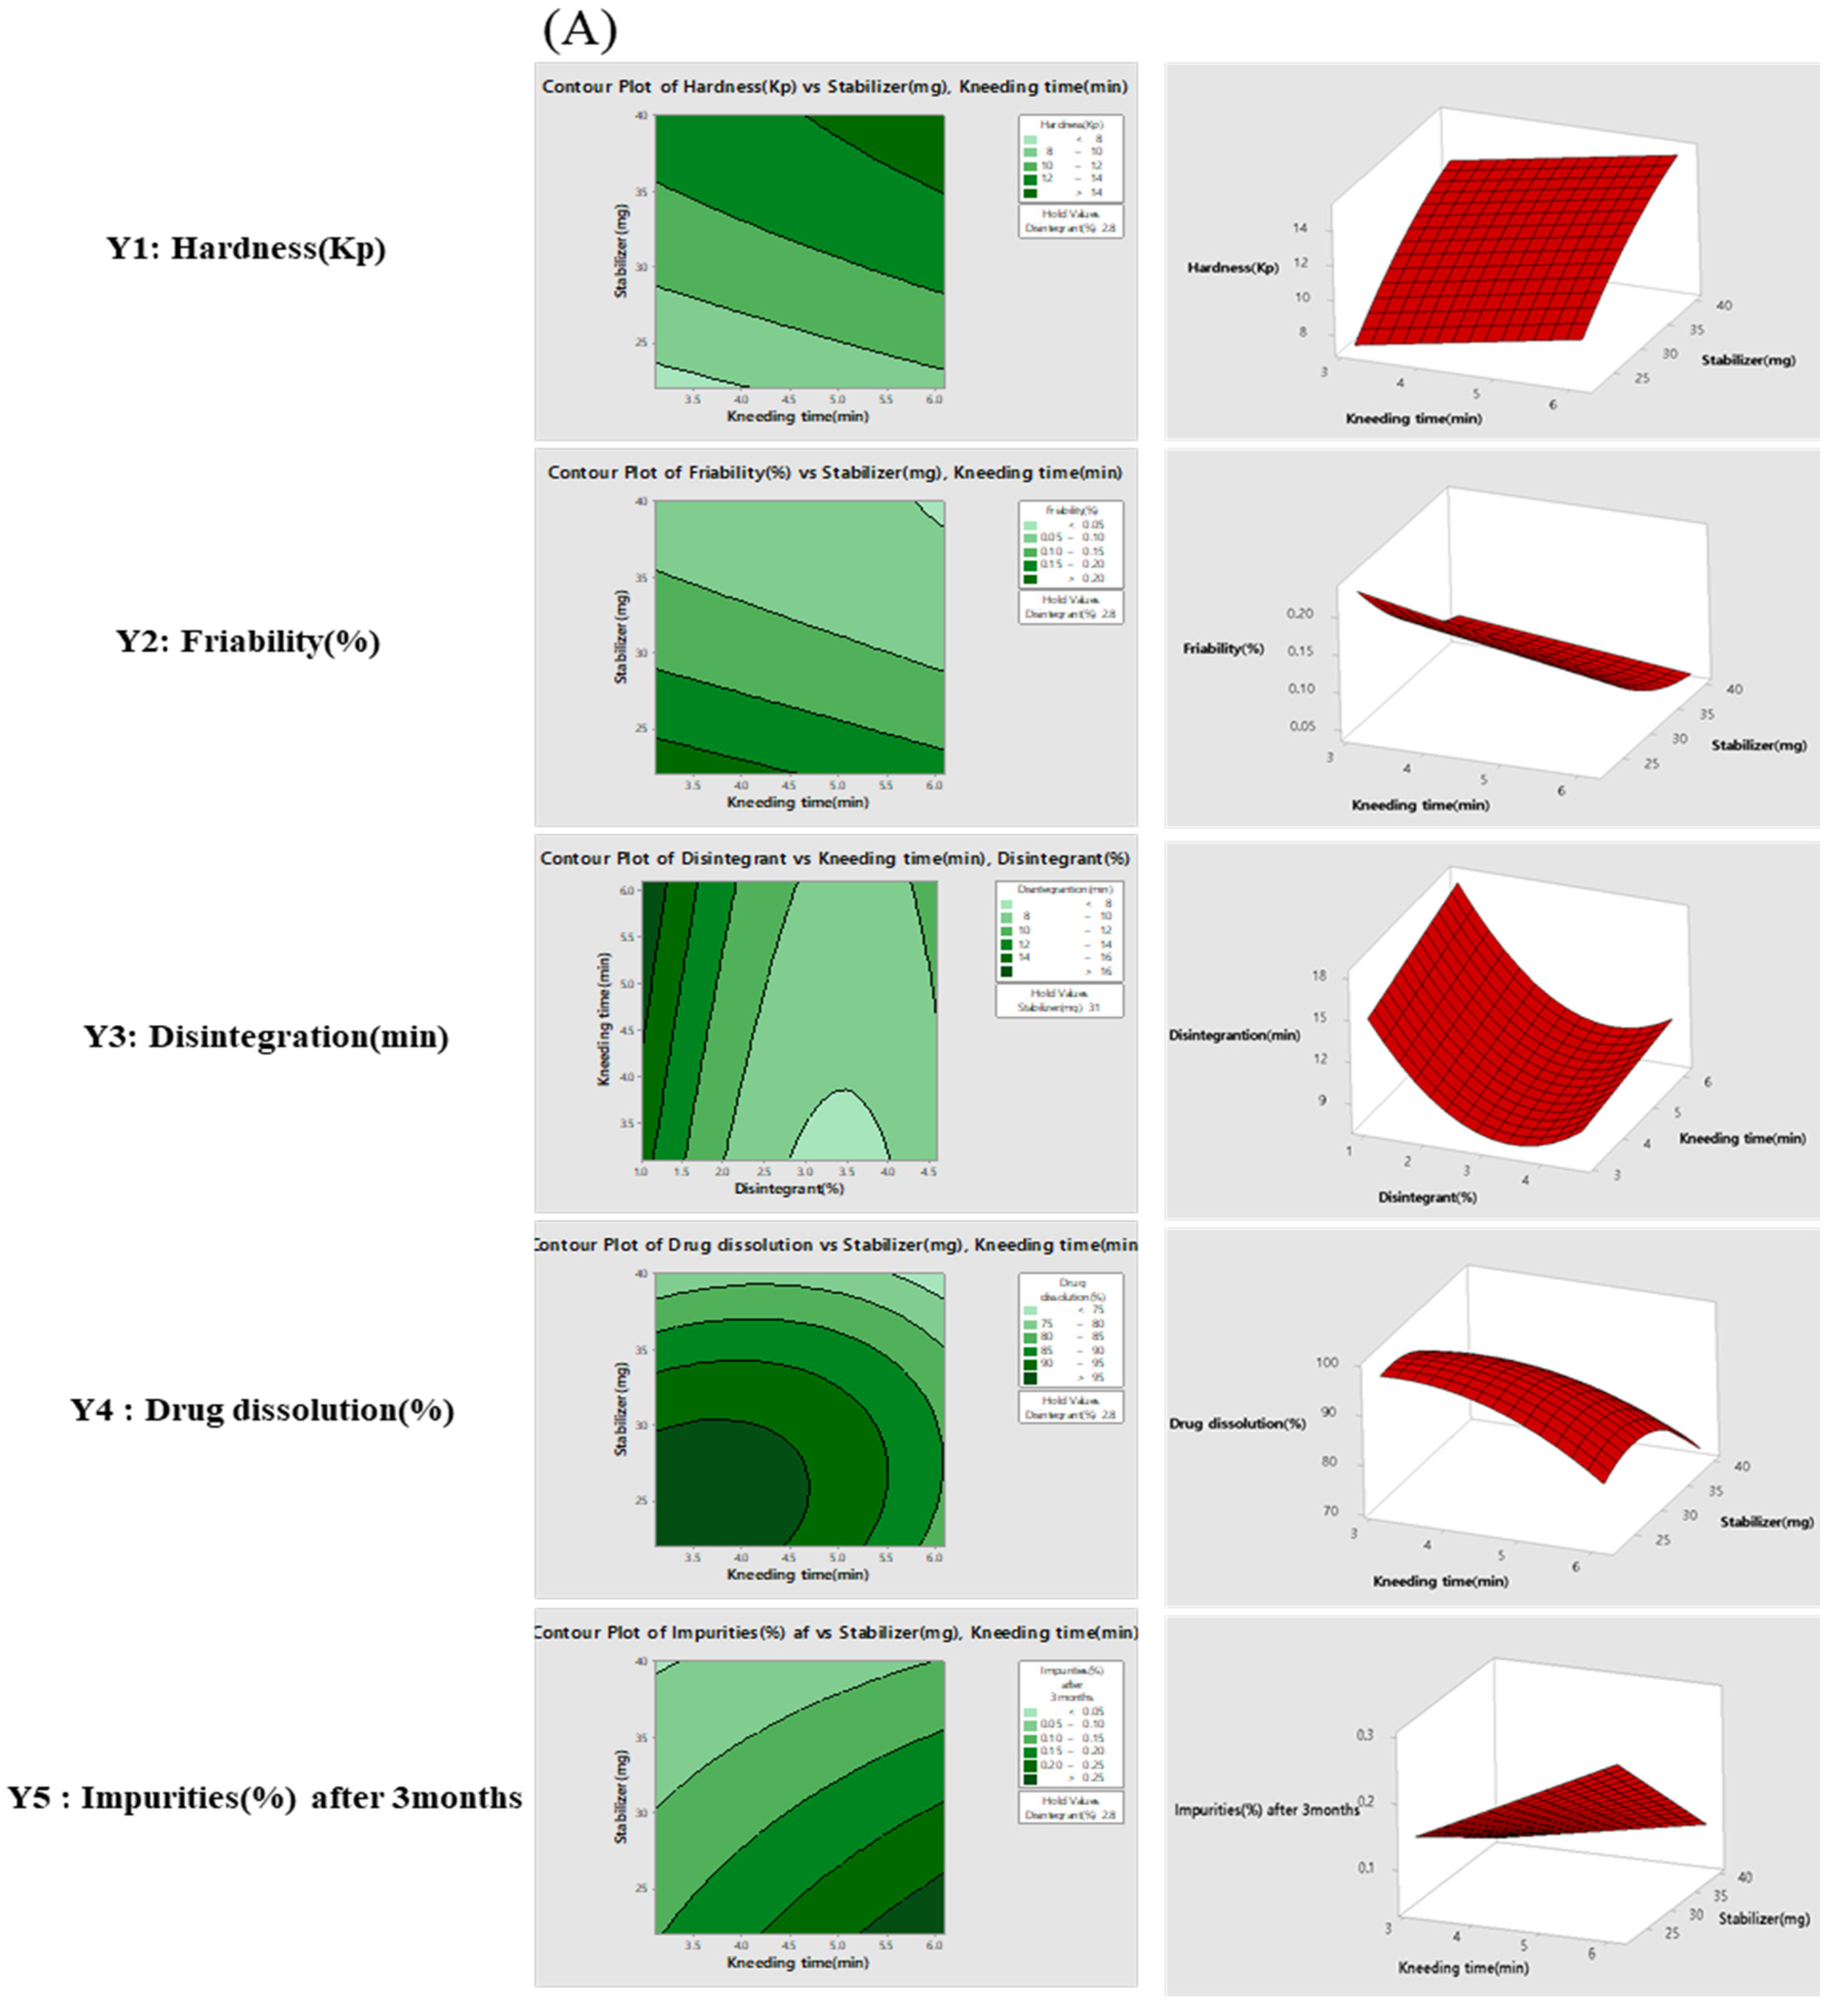
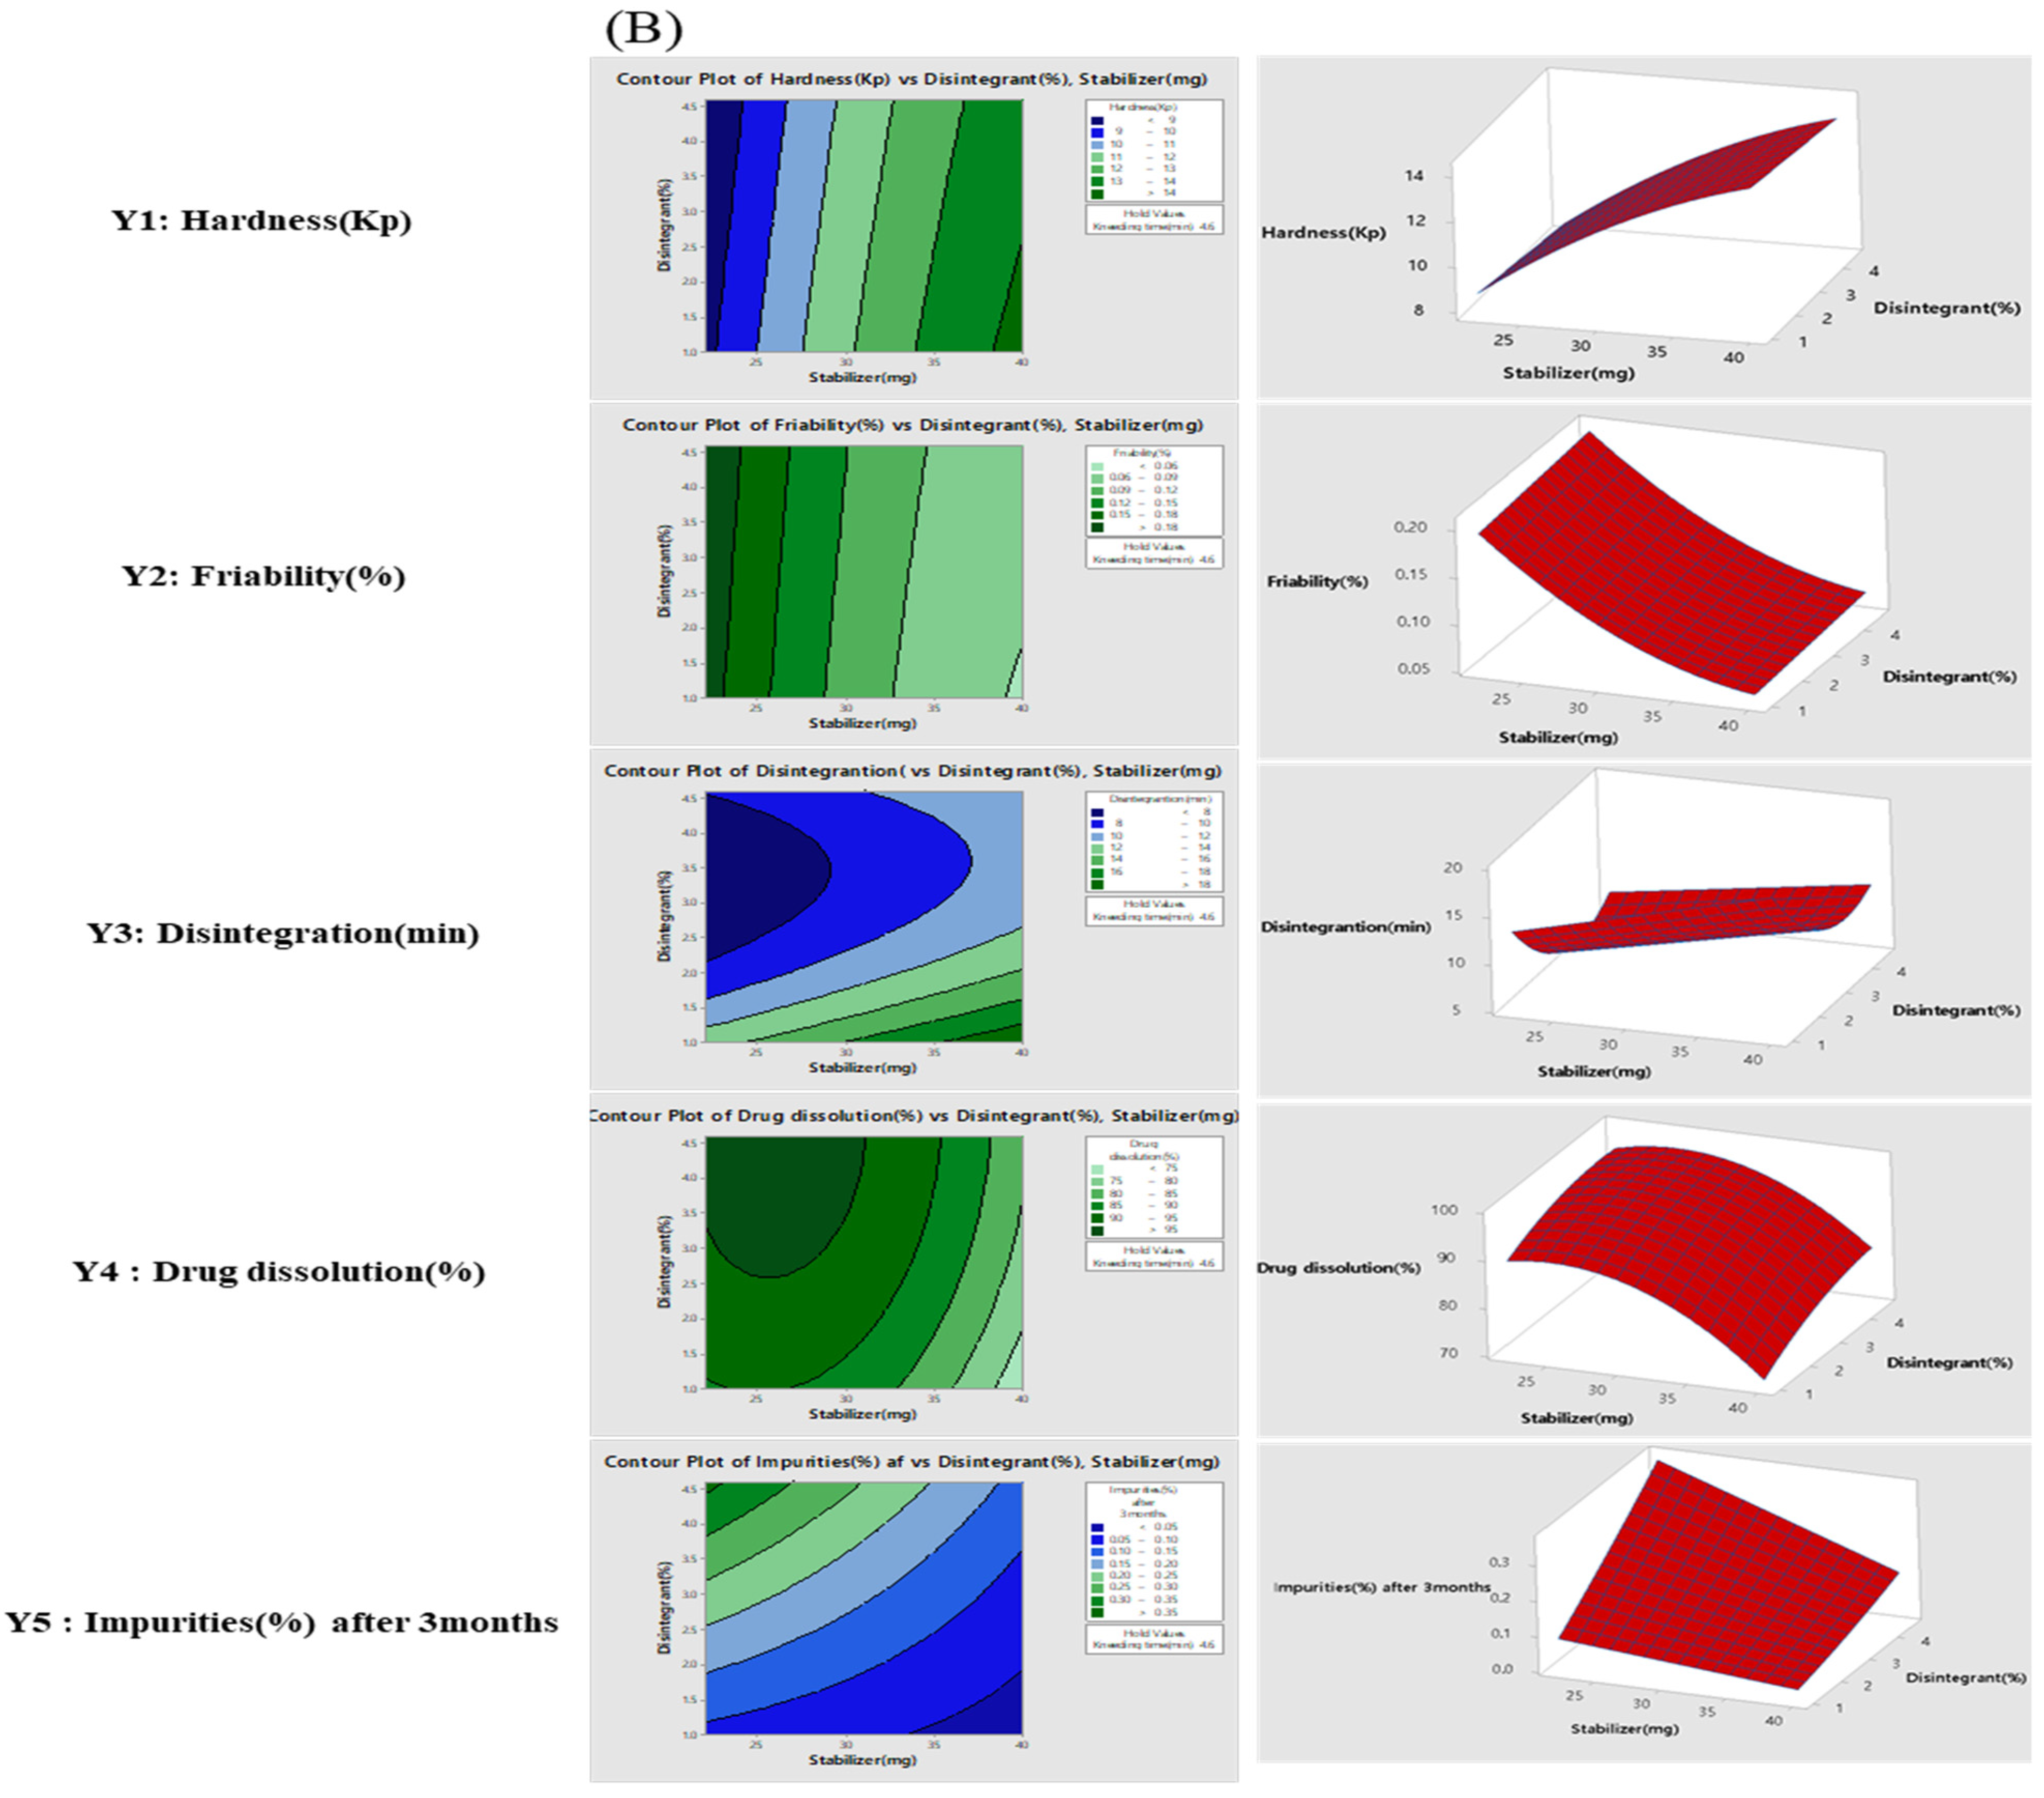
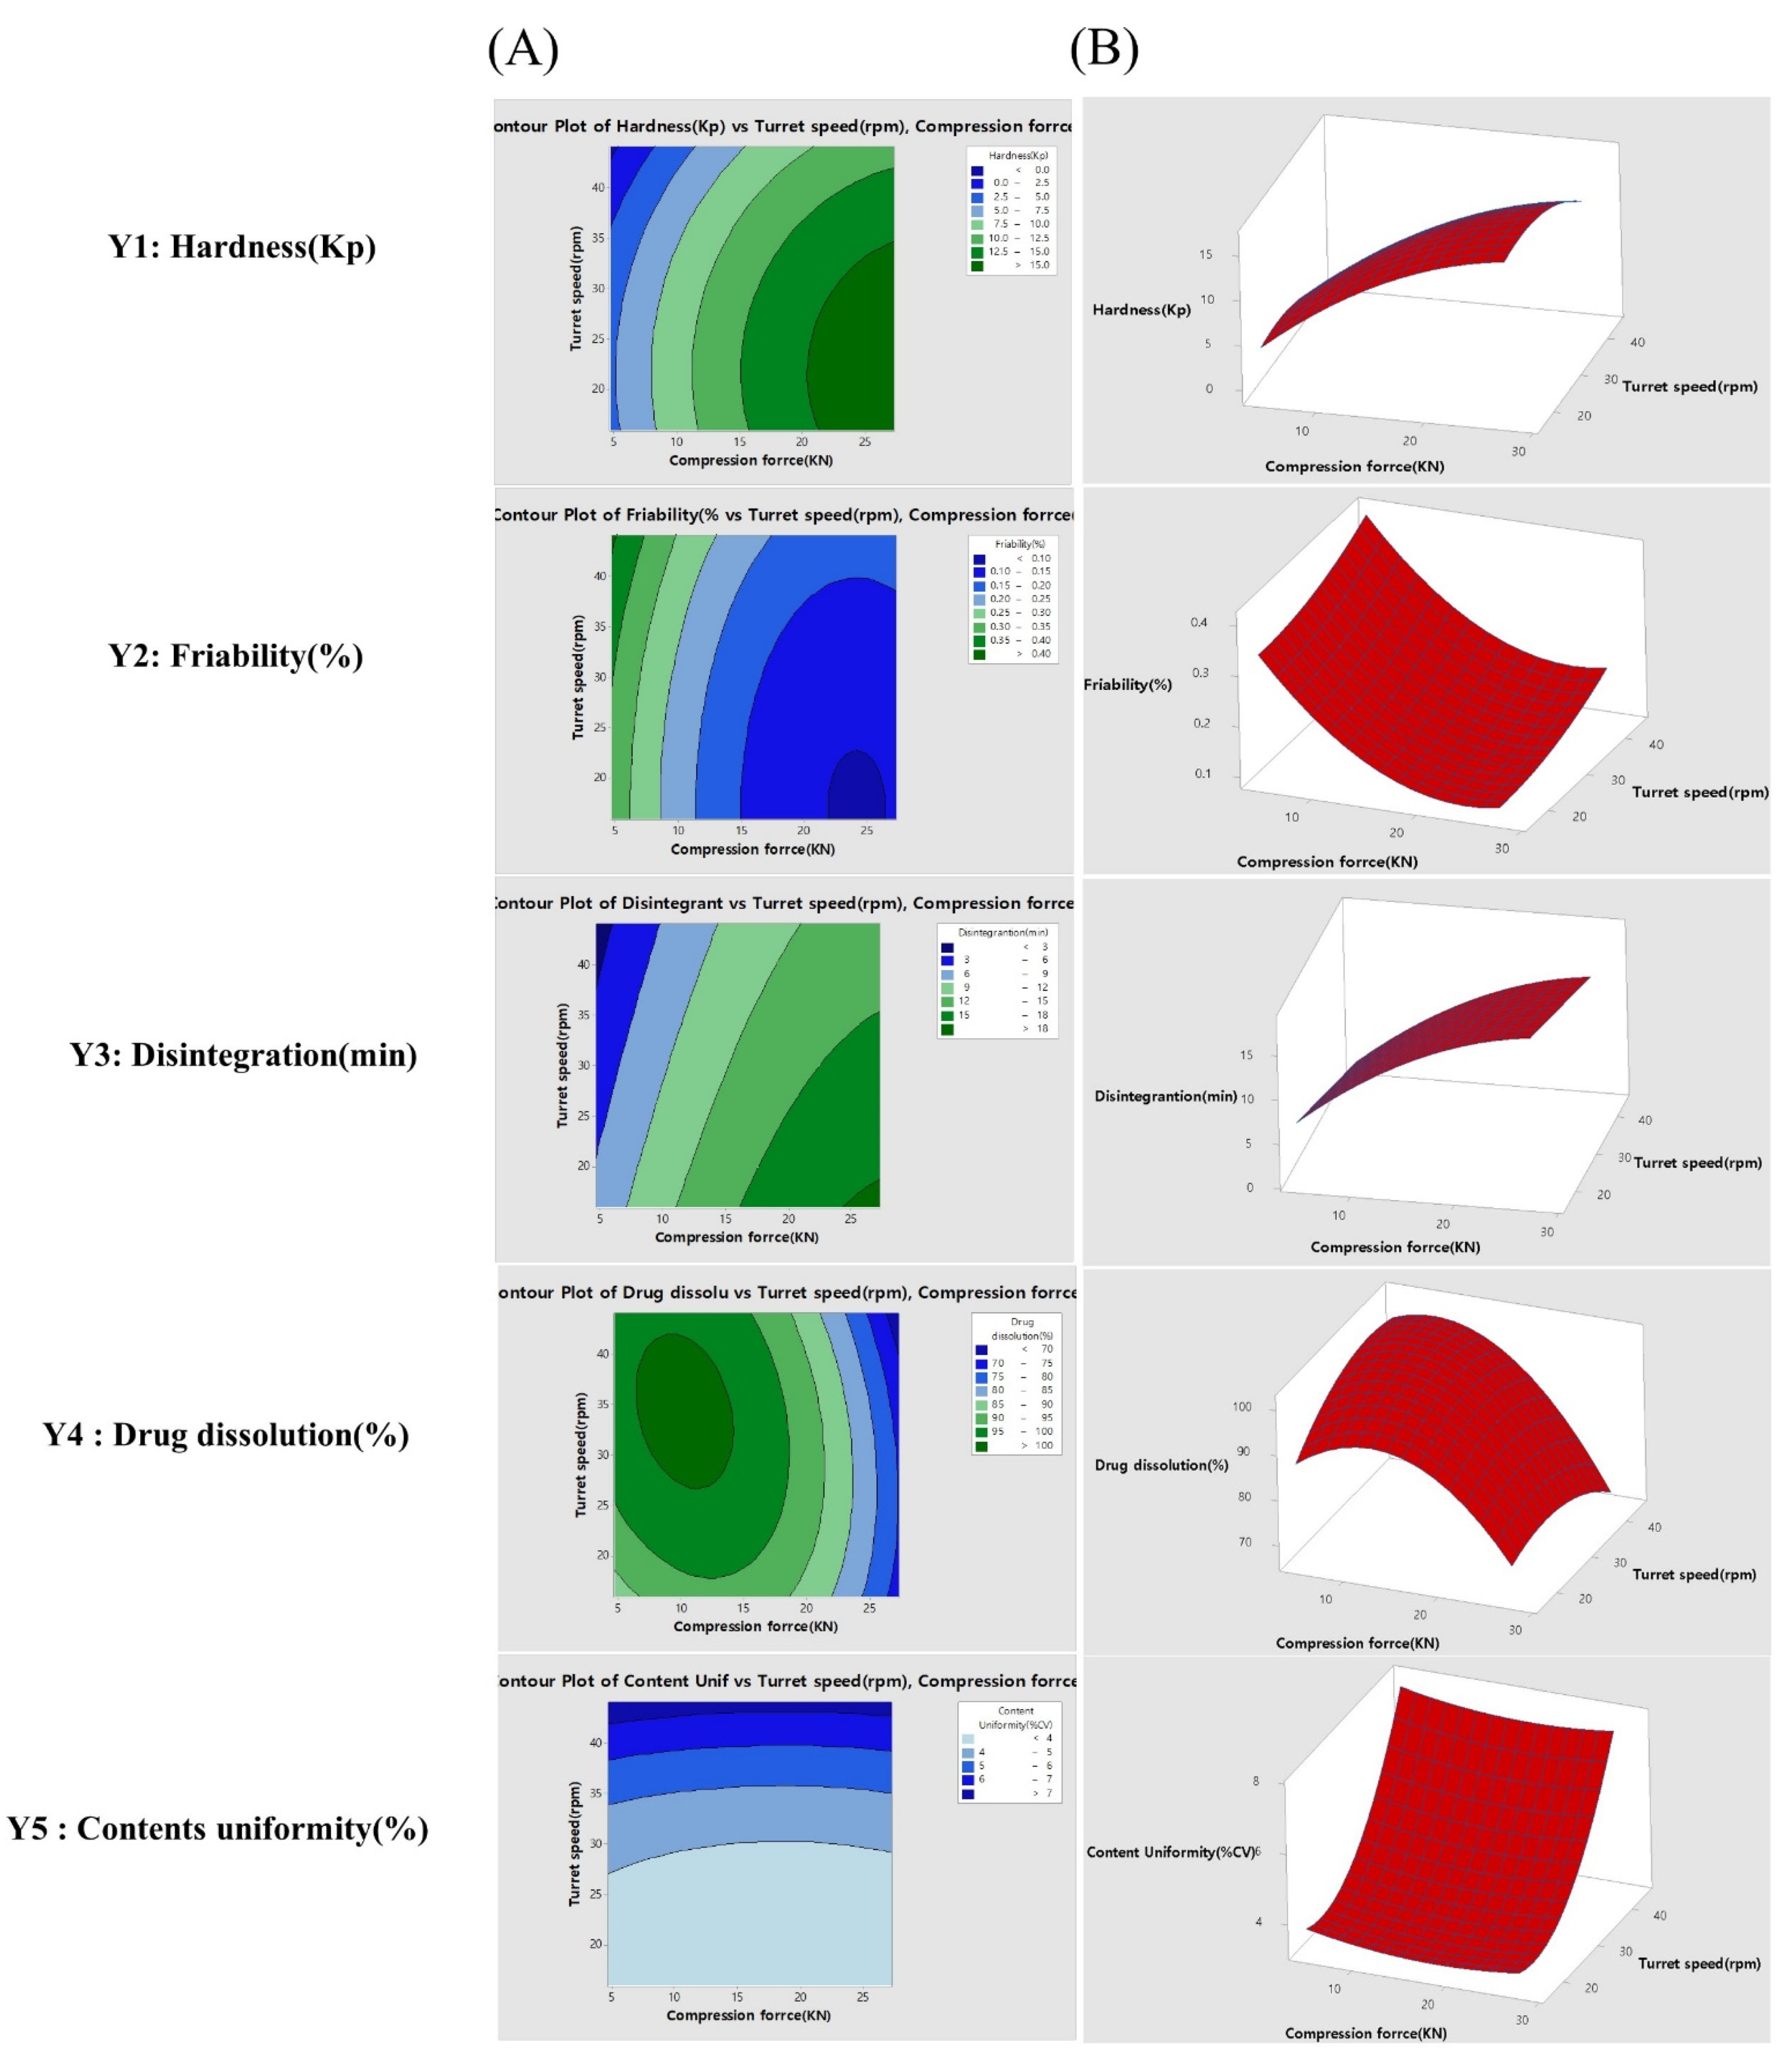
3.3. Experimental Design and Fitted Models
3.4. Development of Design Space
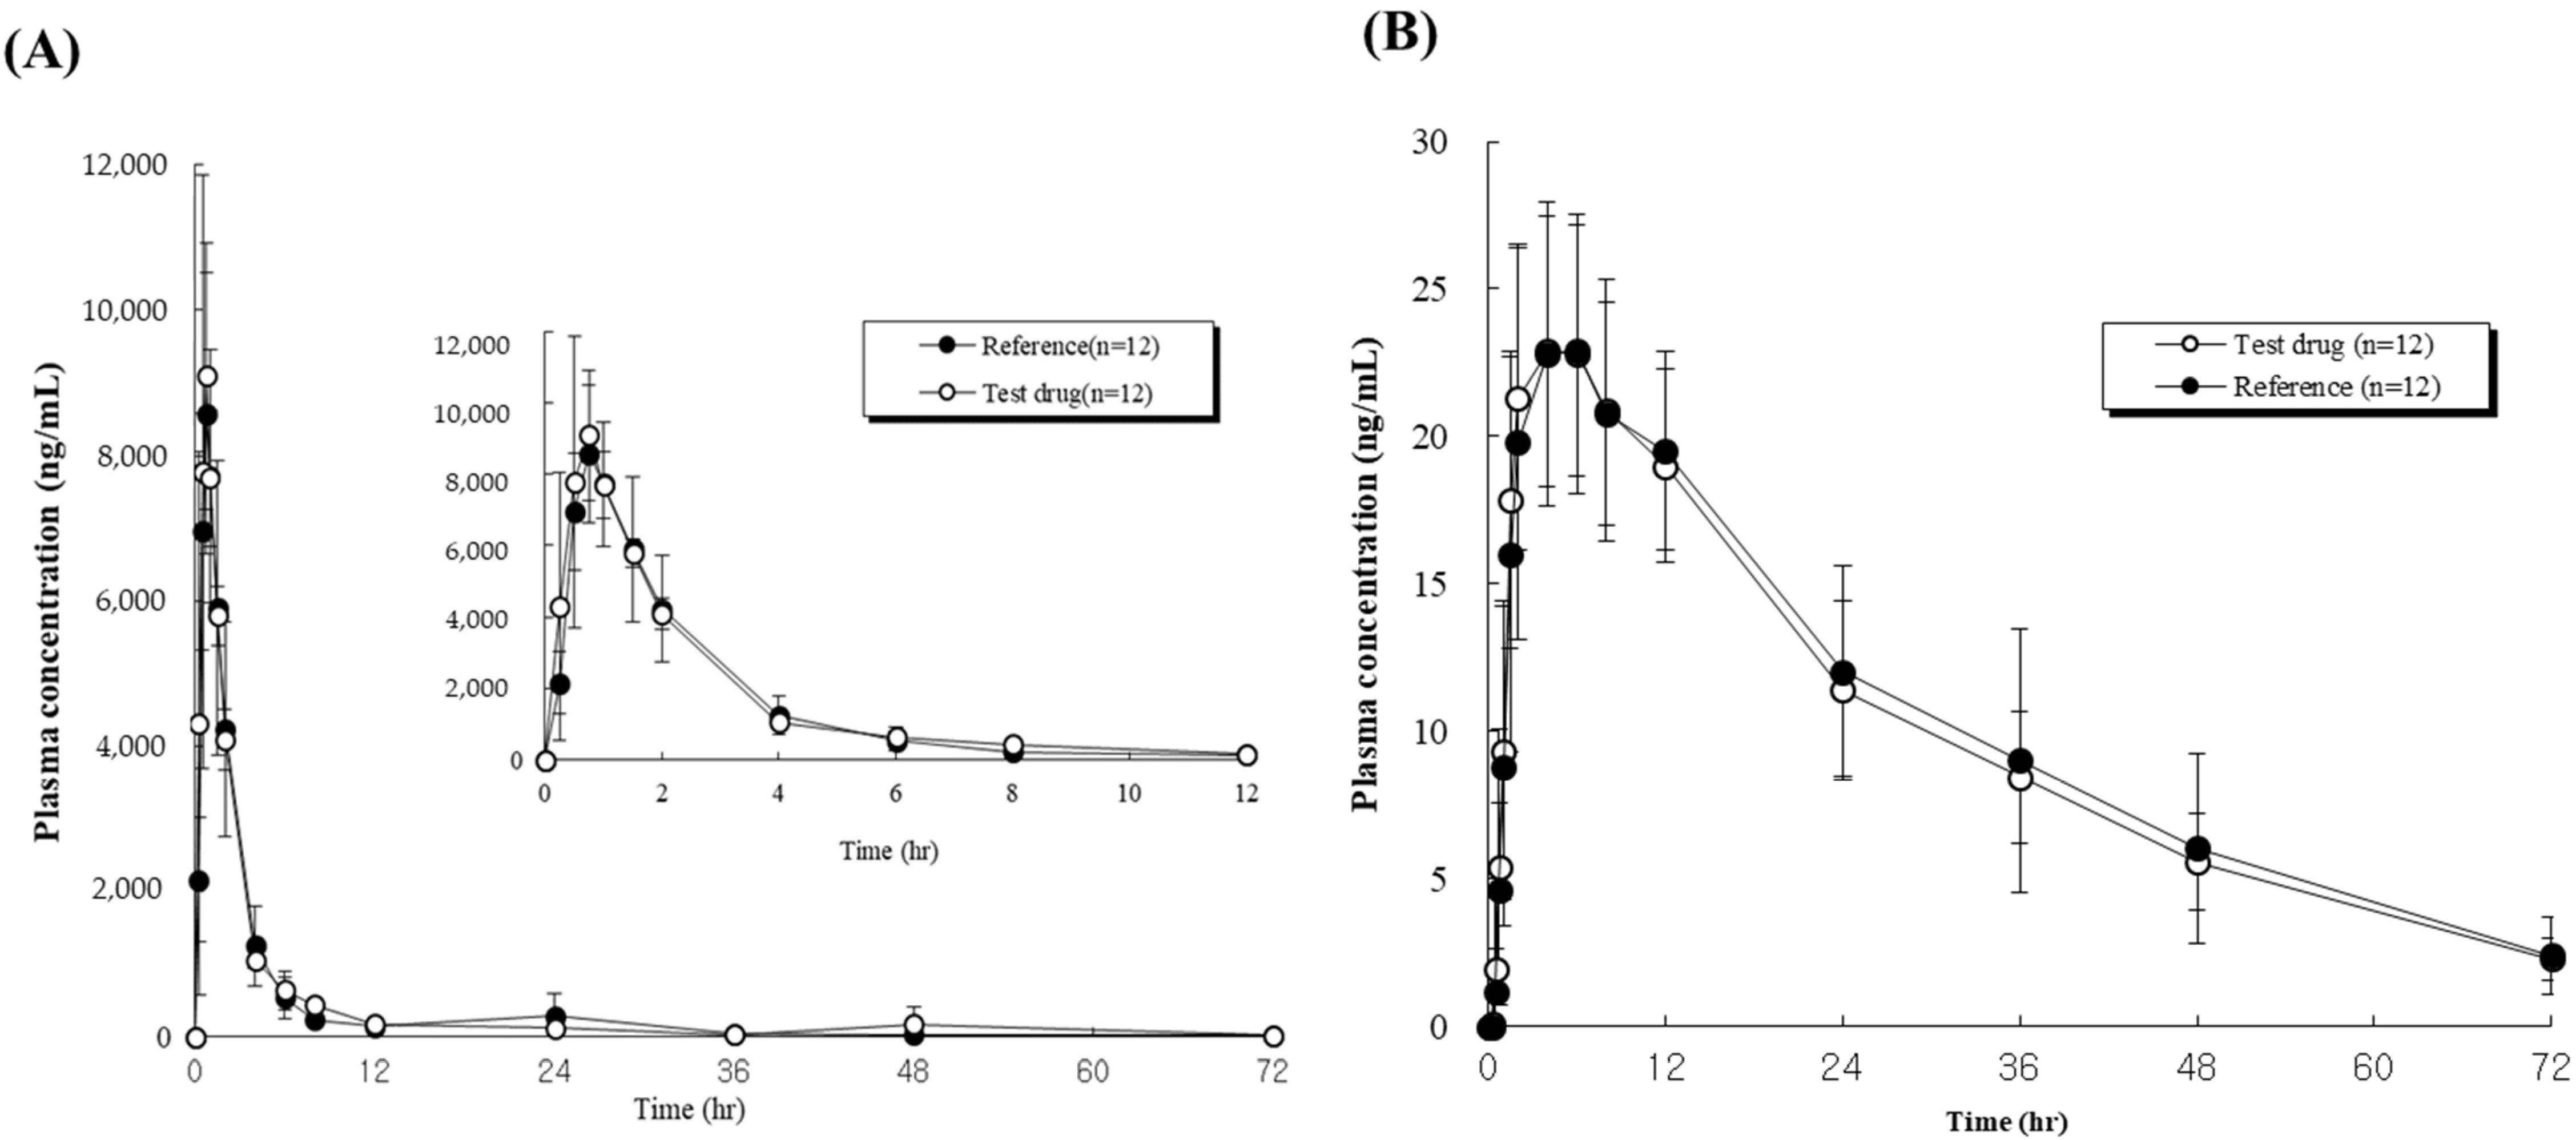
3.5. Pharmacokinetics
4. Conclusions
Author Contributions
Funding
Institutional Review Board Statement
Informed Consent Statement
Data Availability Statement
Acknowledgments
Conflicts of Interest
References
- Billecke, S.S.; Marcovitz, P.A. Long-term safety and efficacy of telmisartan/amlodipine single pill combination in the treatment of hypertension. Vasc. Health Risk Manag. 2013, 9, 95–104. [Google Scholar] [CrossRef] [PubMed] [Green Version]
- Littlejohn, T.W.; Majul, C.R.; Olvera, R.; Seeber, M.; Kobe, M.; Guthrie, R.; Oigman, W.; Of, O. Original Research: Telmisartan plus Amlodipine in Patients with Moderate or Severe Hypertension: Results from a Subgroup Analysis of a Randomized, Placebo-Controlled, Parallel-Group, 4 × 4 Factorial Study. Postgrad. Med. 2009, 121, 5–14. [Google Scholar] [CrossRef] [PubMed]
- Pitt, B.; Konstam, M.A. Overview of angiotensin II-receptor antagonists. Am. J. Cardiol. 1998, 82, 47S–49S. [Google Scholar] [CrossRef]
- Sekar, V.; Chellan, V.R. Immediate Release Tablets of Telmisartan Using Superdisintegrant-Formulation, Evaluation and Stability Studies. Chem. Pharm. Bull. 2008, 56, 575–577. [Google Scholar] [CrossRef] [PubMed] [Green Version]
- Neldam, S.; Edwards, C. Telmisartan Plus HCTZ vs. Amlodipine Plus HCTZ in Older Patients With Systolic Hypertension: Results From a Large Ambulatory Blood Pressure Monitoring Study. Am. J. Geriatr. Cardiol. 2006, 15, 151–160. [Google Scholar] [CrossRef] [PubMed]
- Giri, B.; Kwon, J.; Vo, A.; Bhagurkar, A.; Bandari, S.; Kim, D. Hot-Melt Extruded Amorphous Solid Dispersion for Solubility, Stability, and Bioavailability Enhancement of Telmisartan. Pharmaceuticals 2021, 14, 73. [Google Scholar] [CrossRef] [PubMed]
- Park, J.; Cho, W.; Cha, K.-H.; Ahn, J.; Han, K.; Hwang, S.-J. Solubilization of the poorly water soluble drug, telmisartan, using supercritical anti-solvent (SAS) process. Int. J. Pharm. 2013, 441, 50–55. [Google Scholar] [CrossRef]
- Gaur, P.K.; Mishra, S.; Prabhakaran, P.; Bhardwaj, S.; Puri, D.; Kumar, S.S.; Dubey, J.; Verma, A.; Verma, N.; Kumar, G.P.; et al. Prospectives and Potentials of Bilayer Technology: A Novel Approach. J. Pharm. Sci. Pharmacol. 2015, 2, 148–161. [Google Scholar] [CrossRef]
- Aggarwal, S.; Syan, N.; Mathur, P. Bi-layer tablet technology—opening new ways in drug delivery systems: An overview. Int. J. Res. Pharm. Biomed. Sci. 2013, 4, 8–16. [Google Scholar]
- Oh, G.-H.; Park, J.-H.; Shin, H.-W.; Kim, J.-E.; Park, Y.-J. Quality-by-design approach for the development of telmisartan potassium tablets. Drug Dev. Ind. Pharm. 2017, 44, 837–848. [Google Scholar] [CrossRef]
- ICH Guideline, ICH Harmonization for Better Health. Available online: https://database.ich.org/sites/default/files/Q8_R2_Guideline.pdf (accessed on 8 August 2021).
- Visser, J.C.; Willem, M.C.; Wouter, L.J.; Breitkreutz, J.; Henderik, W.; Herman, J.W. Quality by design approach for optimizing the formulation and physical properties of extempo-raneously prepared orodispersible films. Int. J. Pharm. 2015, 485, 70–76. [Google Scholar] [CrossRef] [PubMed]
- Juran, J.M. Juran on Quality by Design: The New Steps for Planning Quality into Goods and Services; Simon and Schuster: New York, NY, USA, 1992. [Google Scholar]
- Rathore, A.S.; Winkle, H. Quality by design for biopharmaceuticals. Nat. Biotechnol. 2009, 27, 26–34. [Google Scholar] [CrossRef] [PubMed]
- Rahman, Z.; Zidan, A.S.; Habib, M.J.; Khan, M. Understanding the quality of protein loaded PLGA nanoparticles variability by Plackett–Burman design. Int. J. Pharm. 2010, 389, 186–194. [Google Scholar] [CrossRef] [Green Version]
- Salazar, J.; Heinzerling, O.; Müller, R.H. Process optimization of a novel production method for nanosuspensions using design of experi-ments (DoE). Int. J. Pharm. 2011, 420, 395–403. [Google Scholar] [CrossRef]
- Wu, H.; White, M.; Khan, M.A. Quality-by-Design (QbD): An integrated process analytical technology (PAT) approach for a dynamic pharmaceutical co-precipitation process characterization and process design space devel-opment. Int. J. Pharm. 2011, 405, 63–78. [Google Scholar] [CrossRef]
- Lawrence, X.Y. Pharmaceutical quality by design: Product and process development, understanding, and control. Pharm. Res. 2008, 25, 781–791. [Google Scholar]
- Lee, S.-H.; Kim, J.-E. Quality by Design Applied Development of Immediate-Release Rabeprazole Sodium Dry-Coated Tablet. Pharmaceutics 2021, 13, 259. [Google Scholar] [CrossRef]
- Kaljević, O.; Djuriš, J.; Djurić, Z.; Ibrić, S. Application of failure mode and effects analysis in quality by design approach for formulation of carvedilol compression coated tablets. J. Drug Deliv. Sci. Technol. 2016, 32, 56–63. [Google Scholar] [CrossRef]
- Kim, J.-E.; Park, Y.-J. Paclitaxel-loaded hyaluronan solid nanoemulsions for enhanced treatment efficacy in ovarian cancer. Int. J. Nanomed. 2017, 12, 645–658. [Google Scholar] [CrossRef] [Green Version]
- Kim, J.-E.; Park, Y.-J. High paclitaxel-loaded and tumor cell-targeting hyaluronan-coated nanoemulsions. Colloids Surfaces B Biointerfaces 2017, 150, 362–372. [Google Scholar] [CrossRef]
- Kim, J.-E.; Park, Y.-J. Improved Antitumor Efficacy of Hyaluronic Acid-Complexed Paclitaxel Nanoemulsions in Treating Non-Small Cell Lung Cancer. Biomol. Ther. 2017, 25, 411–416. [Google Scholar] [CrossRef] [PubMed] [Green Version]
- Kim, J.-E.; Oh, G.-H.; Jang, G.-H.; Kim, Y.-M.; Park, Y.-J. Transformer-ethosomes with palmitoyl pentapeptide for improved transdermal delivery. J. Drug Deliv. Sci. Technol. 2019, 52, 460–467. [Google Scholar] [CrossRef]
- Shin, H.-W.; Kim, J.-E.; Park, Y.-J. Nanoporous silica entrapped lipid-drug complexes for the solubilization and absorption enhancement of poorly soluble drugs. Pharmaceutics 2021, 13, 63. [Google Scholar] [CrossRef] [PubMed]
- Lee, J.; Kim, J.-E. Application of Open Source Based DoE R Program for the Development of QbD. Yakhak Hoeji 2019, 63, 274–281. [Google Scholar] [CrossRef]
- Oh, G.-H.; Kim, J.-E.; Park, Y.-J. Development of stabilized tenofovir disoproxil tablet: Degradation profile, stabilization, and bioequivalence in beagle dogs. Drug Dev. Ind. Pharm. 2018, 44, 757–766. [Google Scholar] [CrossRef] [PubMed]
- Kim, J.E.; Park, M.Y.; Kim, S.H. Simple determination and quantification of tofacitinib, a JAK inhibitor, in rat plasma, urine and tissue homogenates by HPLC and its application to a pharmacokinetic study. J. Pharm. Investig. 2020, 50, 603–612. [Google Scholar] [CrossRef]
- Seok, S.H.; Ha, J.M.; Kim, T.H.; Kim, G.W.; Kim, B.H. Effect of gastric residence time on the oral absorption of rebamipide sustained-release tablets in beagle dogs. J. Pharm. Investig. 2021, 51, 759–766. [Google Scholar] [CrossRef]


| (A) | |||||||
| Functions | MAs (No color) CMAs (Color) | Failure Mode | Effect on CQAs as justification of failure mode | P | S | D | RPN |
| Telmisartan potassium | Salt form/PSD/solubility/dissolution | polymorphism/Higher PSD | Drug solubility and dissolution may be affected. Thus, bioavailability and efficacy may be compromised. | 3 | 4 | 1 | 12 |
| Amlodipine besylate | PSD/solubility/dissolution | Higher PSD | Drug solubility and dissolution may be affected. Thus, bioavailability and efficacy may be compromised. | 3 | 4 | 1 | 12 |
| Stabilizer | Amount of stabilizer | Higher than optimum | While maintaining high stability of tablet, produces hard granules yielding tablets with longer disintegration and dissolution times. Thus, bioavailability and efficacy may be compromised. | 4 | 4 | 3 | 48 |
| Lower than optimum | While maintaining low stability of tablet, formation of loose and soft granules may produce friable tablets that dissolve immediately. Thus, bioavailability and efficacy may be compromised. | 4 | 4 | 3 | 48 | ||
| Diluent | PSD | Uneven | Flow properties of the blend and content uniformity may be affected in dry mixing process. Thus, quality/safety may be compromised. | 3 | 3 | 2 | 18 |
| Moisture content | High | Impurity profile may be affected. Thus, safety may be compromised. | 3 | 3 | 2 | 18 | |
| Binding solution | Volume of binding solution | Higher than optimum | Produces hard granules yielding tablets with longer disintegration and dissolution times. Thus, bioavailability and efficacy may be compromised. | 4 | 4 | 2 | 32 |
| Lower than optimum | Formation of loose and soft granules may produce friable tablets that dissolve immediately. Thus, bioavailability and efficacy may be compromised. | 4 | 4 | 2 | 32 | ||
| Disintegrant | Amount of disintegrant agent | Higher than optimum | Desired dissolution of reference tablet could not be achieved because it showed a high dissolution pattern. Thus, bioavailability and efficacy may be compromised. | 4 | 4 | 3 | 48 |
| Lower than optimum | Desired dissolution of reference tablet could not be achieved because it showed a high dissolution pattern. Thus, bioavailability and efficacy may be compromised. | 4 | 4 | 3 | 48 | ||
| Glidant | Concentration of glidant | Lower than optimum | Flow of granules/powder from hopper to die may be affected due to reduced friction between particles. Therefore, content uniformity and product quality may be compromised. | 3 | 3 | 2 | 18 |
| Lubricant | Concentration of lubricant | Lower than optimum | Tablet granules/powder may stick to the surfaces of punches/tools, and picking may be observed. Thus, product quality may be compromised. | 3 | 3 | 2 | 18 |
| Higher than optimum | Hydrophobic lubricant may coat drug particle surfaces, thereby retarding dissolution. Thus, efficacy may be compromised. | 3 | 3 | 3 | 27 | ||
| (B) | |||||||
| Unit processing | PPs (No color) CPPs (Color) | Failure Mode | Effect on CQAs as justification of failure mode | P | S | D | RPN |
| Screening | Delumping or Sifting | Larger than optimum sieve size | Un-plain particle size distribution could cause content non-uniformity. Weight variation, assay, and content uniformity may be affected. Thus, safety and quality may be compromised. | 2 | 3 | 2 | 12 |
| Blending | Speed and time of dry mixing | Lower mixing speed and shorter time | Weight variation, assay, and content uniformity may be affected. Thus, safety and quality may be compromised. | 2 | 3 | 2 | 12 |
| Granulation | Impeller speed and time | Higher mixing speed and longer time | Produces large granules that form agglomerates or lumps. Appearance, assay, content uniformity, and dissolution profile of tablets may be affected. Bioavailability and efficacy may be compromised. | 4 | 4 | 2 | 32 |
| Chopper speed and time | Lower mixing speed and shorter time | Produces large granules that form agglomerates or lumps. Appearance, assay, content uniformity, and dissolution profile of tablets may be affected. Bioavailability and efficacy may be compromised. | 4 | 4 | 2 | 32 | |
| Kneading time for granulation | Longer than optimum time | Produces large granules that form agglomerates or lumps. Appearance, assay, content uniformity, and dissolution profile of tablets may be affected. Bioavailability and efficacy may be compromised. | 4 | 4 | 4 | 64 | |
| Drying | Inlet temperature | Lower than optimum temperature | Physical appearance and powder quality may be affected. Both sticking and picking may be observed. Thus, product quality and tablet compression may be compromised. | 3 | 3 | 2 | 18 |
| Higher product temperature | Degradation and impurity profile may be affected. Thus, safety may be comprised. | 3 | 4 | 2 | 24 | ||
| Blending and lubrication | Blending speed and time | Higher than optimum speed and longer time | Dissolution time may be increase. Thus, efficacy may be compromised. | 3 | 2 | 2 | 12 |
| Tablet Compression | Speed of turret and feeder | Higher than optimum speed | Appearance, weight variation, assay, and content uniformity may be affected. Thus, quality, safety, and efficacy may be compromised. | 4 | 4 | 3 | 48 |
| Compression force (Pre-compression and main compression force) | Higher than optimum force | Friability, appearance, disintegration, dissolution, and hardness of tablets may be affected. Thus, quality, bioavailability and efficacy may be compromised. | 4 | 4 | 3 | 48 | |
| Film coating | Product temperature | Higher than optimum temperature | Impurity level and degradation profile may be affected. Thus, appearance of product, stability and safety may be compromised. | 3 | 3 | 3 | 27 |
| (A) | ||||||||
| CMAs affecting CQAs | Telmisartan potassium | Amlodipine besylate | Stabilizer | Diluent | Binding solution | Disintegrant | Glidant | Lubricant |
| Appearance | Low | Low | Low | Low | Low | Medium | Low | Medium |
| Assay | Low | Low | Low | Low | Low | Low | Low | Low |
| Uniformity | Low | Low | Low | Medium | Low | Low | Low | Low |
| Impurities | Medium | Medium | High | Low | Low | High | Low | Low |
| Dissolution | Medium | Low | High | Low | Medium | High | Medium | Medium |
| (B) | ||||||||
| CPPs affecting CQAs | Screening | Blending | Granulation | Drying | Blending and lubrication | Tablet compression | Film coating | |
| Appearance | Low | Low | Medium | Low | Low | Medium | Low | |
| Assay | Medium | Low | Medium | Low | Low | Medium | Low | |
| Uniformity | Medium | Medium | Medium | Low | Low | Medium | Low | |
| Impurities | Low | Low | High | Medium | Low | Low | Medium | |
| Dissolution | Low | Low | High | Low | Medium | High | Low | |
| (A) | ||||||||
| Critical material attributes | Critical process parameters | Critical quality attributes | ||||||
| Run | X1 | X2 | X3 | Y1 | Y2 | Y3 | Y4 | Y5 |
| Stabilizer (mg) | Disintegrant (%) | Kneading time (min) | Hardness (Kp) | Friability (%) | Disintegration (min) | Drug dissolution (%) | Impurities (%) after 3 months | |
| 1 | 22 | 1 | 3.1 | 7.6 | 0.230 | 12.2 | 93 ± 3.4 | 0.052 |
| 2 | 40 | 1 | 3.1 | 13.4 | 0.077 | 17.8 | 70 ± 5.2 | 0.017 |
| 3 | 22 | 4.6 | 3.1 | 7.5 | 0.230 | 7.8 | 97 ± 1.9 | 0.249 |
| 4 | 40 | 4.6 | 3.1 | 12.2 | 0.086 | 11.1 | 78 ± 2.9 | 0.081 |
| 5 | 22 | 1 | 6.1 | 8.9 | 0.163 | 14.4 | 77 ± 5.0 | 0.123 |
| 6 | 40 | 1 | 6.1 | 15.4 | 0.048 | 21.1 | 65 ± 4.7 | 0.037 |
| 7 | 22 | 4.6 | 6.1 | 9.4 | 0.173 | 8.9 | 83 ± 3.8 | 0.475 |
| 8 | 40 | 4.6 | 6.1 | 14.9 | 0.048 | 12.2 | 75 ± 4.4 | 0.178 |
| 9 | 22 | 2.8 | 4.6 | 8.4 | 0.202 | 5.6 | 96 ± 1.2 | 0.220 |
| 10 | 40 | 2.8 | 4.6 | 13.8 | 0.058 | 12.2 | 77 ± 2.4 | 0.077 |
| 11 | 31 | 1 | 4.6 | 12.9 | 0.086 | 16.7 | 86 ± 3.2 | 0.062 |
| 12 | 31 | 4.6 | 4.6 | 10.8 | 0.125 | 10.0 | 97 ± 1.3 | 0.261 |
| 13 | 31 | 2.8 | 3.1 | 10.2 | 0.134 | 7.8 | 94 ± 3.2 | 0.099 |
| 14 | 31 | 2.8 | 6.1 | 13.2 | 0.086 | 11.1 | 84 ± 4.2 | 0.195 |
| 15 | 31 | 2.8 | 4.6 | 12.4 | 0.106 | 8.9 | 92 ± 1.3 | 0.149 |
| 16 | 31 | 2.8 | 4.6 | 12.1 | 0.106 | 7.8 | 92 ± 3.2 | 0.149 |
| 17 | 31 | 2.8 | 4.6 | 11.3 | 0.115 | 8.9 | 94 ± 2.5 | 0.145 |
| 18 | 31 | 2.8 | 4.6 | 12.1 | 0.106 | 8.9 | 93 ± 2.6 | 0.147 |
| 19 | 31 | 2.8 | 4.6 | 11.4 | 0.115 | 10.0 | 92 ± 1.3 | 0.147 |
| 20 | 31 | 2.8 | 4.6 | 11.9 | 0.096 | 10.0 | 94 ± 2.0 | 0.146 |
| (B) | ||||||||
| Critical process parameters | Critical quality attributes | |||||||
| Run | X1 | X2 | Y1 | Y2 | Y3 | Y4 | Y5 | |
| Compression force (KN) | Turret speed (rpm) | Hardness (Kp) | Friability (%) | Disintegration (min) | Drug dissolution (%) | Content Uniformity (%CV) | ||
| 1 | 8 | 20 | 7.5 | 0.25 | 11 | 94.5 ± 1.4 | 3.51 | |
| 2 | 24 | 20 | 15 | 0.12 | 16 | 82.5 ± 3.0 | 3.56 | |
| 3 | 8 | 40 | 5.4 | 0.3 | 7 | 98.5 ± 1.1 | 6.46 | |
| 4 | 24 | 40 | 13.2 | 0.14 | 13.7 | 78.5 ± 5.2 | 6.20 | |
| 5 | 4.686 | 30 | 3 | 0.37 | 2 | 98.5 ± 1.4 | 4.27 | |
| 6 | 27.314 | 30 | 16.5 | 0.11 | 17 | 75.5 ± 4.4 | 3.95 | |
| 7 | 16 | 15.858 | 13.5 | 0.13 | 15 | 92.5 ± 1.0 | 3.28 | |
| 8 | 16 | 44.142 | 6.53 | 0.23 | 9.3 | 96.5 ± 0.9 | 7.21 | |
| 9 | 16 | 30 | 12.2 | 0.16 | 12.2 | 98.5 ± 1.2 | 4.01 | |
| 10 | 16 | 30 | 12.3 | 0.16 | 11.8 | 98.5 ± 1.3 | 4.14 | |
| 11 | 16 | 30 | 12.5 | 0.15 | 12.5 | 98.2 ± 1.5 | 3.79 | |
| 12 | 16 | 30 | 12.4 | 0.15 | 12.5 | 97.9 ± 1.0 | 3.89 | |
| 13 | 16 | 30 | 11.9 | 0.16 | 12.1 | 98.5 ± 1.2 | 4.08 | |
| Telmisartan | Reference Drug 1 | Test Drug 2 | Point Estimate | 90% CI 3 |
|---|---|---|---|---|
| Mean ± SD | ||||
| Tmax 4 (h) | 0.67 ± 0.14 | 0.67 ± 0.14 | - | - |
| Cmax 5 (ng/mL) | 8925.2 ± 1474.7 | 9486.4 ± 1495.3 | 0.9408 | 0.9004–1.0895 |
| AUC(last) 6 (ng∙h−1∙mL−1) | 25,527.5 ± 3808.5 | 27,386.2 ± 5269.5 | 0.9321 | 0.8963–1.0952 |
| AUC(inf) 6 (ng∙h−1∙mL−1) | 26,021.7 ± 3513.6 | 28,263.1 ± 5933.2 | 0.9206 | - |
| T1/2 7(h) | 19.6 ± 14.5 | 24.5 ± 24.2 | - | - |
| Amlodipine | Reference Drug 1 | Test Drug 2 | Point Estimate | 90% CI 3 |
|---|---|---|---|---|
| Mean ± SD | ||||
| Tmax 4 (h) | 4.83 ± 1.34 | 4.33 ± 1.44 | - | - |
| Cmax 5 (ng/mL) | 23.88 ± 4.58 | 23.55 ± 5.06 | 0.9813 | 0.9163–1.0510 |
| AUC(last) 6 (ng∙h−1∙mL−1) | 737.7 ± 198.04 | 712.9 ± 154.65 | 0.9770 | 0.9334–1.0226 |
| AUC(inf) 6 (ng∙h−1∙mL−1) | 807.3 ± 225.72 | 778.6 ± 170.03 | 0.9644 | - |
| T1/2 7(h) | 19.5 ± 3.94 | 19.5 ± 3.45 | - | - |
Publisher’s Note: MDPI stays neutral with regard to jurisdictional claims in published maps and institutional affiliations. |
© 2022 by the authors. Licensee MDPI, Basel, Switzerland. This article is an open access article distributed under the terms and conditions of the Creative Commons Attribution (CC BY) license (https://creativecommons.org/licenses/by/4.0/).
Share and Cite
Kim, J.-E.; Park, Y.-J. QbD Consideration for Developing a Double-Layered Tablet into a Single-Layered Tablet with Telmisartan and Amlodipine. Pharmaceutics 2022, 14, 377. https://doi.org/10.3390/pharmaceutics14020377
Kim J-E, Park Y-J. QbD Consideration for Developing a Double-Layered Tablet into a Single-Layered Tablet with Telmisartan and Amlodipine. Pharmaceutics. 2022; 14(2):377. https://doi.org/10.3390/pharmaceutics14020377
Chicago/Turabian StyleKim, Joo-Eun, and Young-Joon Park. 2022. "QbD Consideration for Developing a Double-Layered Tablet into a Single-Layered Tablet with Telmisartan and Amlodipine" Pharmaceutics 14, no. 2: 377. https://doi.org/10.3390/pharmaceutics14020377