
Validation of a Rapid and Easy-to-Apply Method to Simultaneously Quantify Co-Loaded Dexamethasone and Melatonin PLGA Microspheres by HPLC-UV: Encapsulation Efficiency and In Vitro Release

 , , , , and
Abstract
:1. Introduction
2. Materials and Methods
2.1. Chemicals
2.2. Equipment
2.3. Chromatographic Conditions
2.4. Elaboration of PLGA Microspheres
2.5. Test Sample Preparation
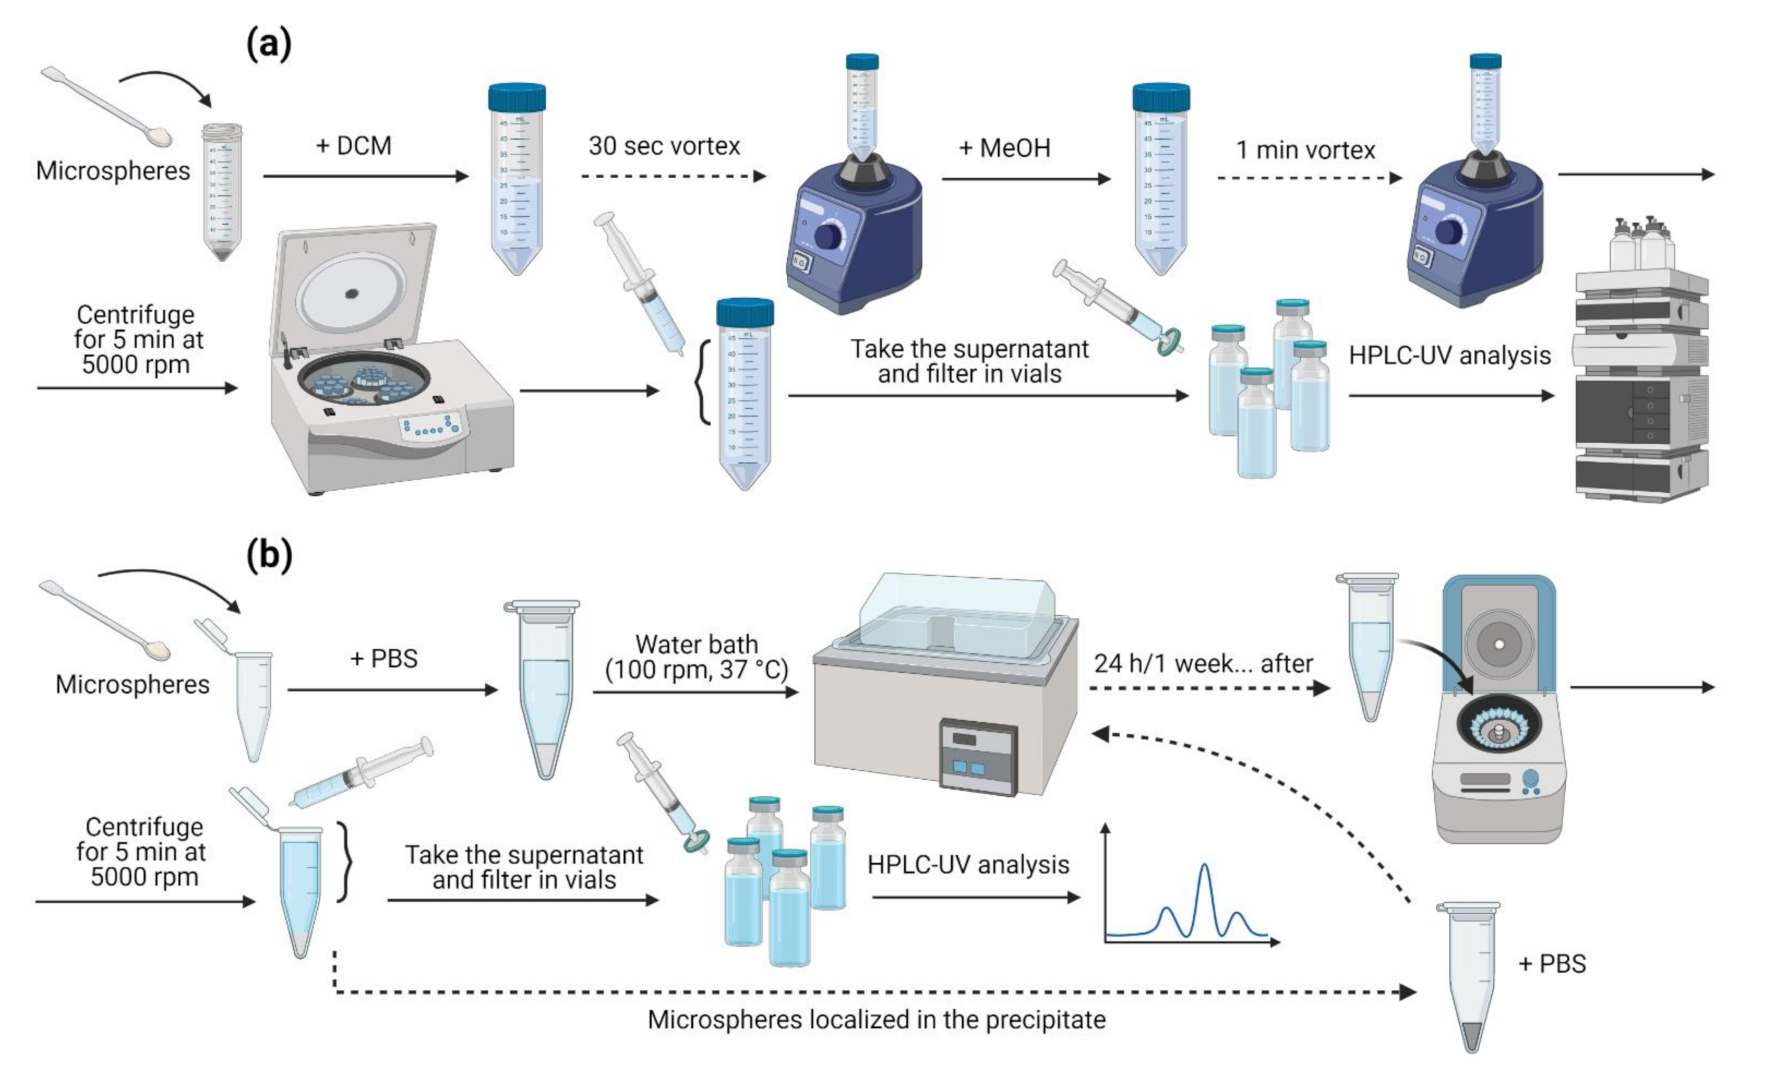
2.5.1. Encapsulation Efficiency Assay
2.5.2. In Vitro Release Assay
2.6. Standard Solutions Preparation
2.6.1. Encapsulation Efficiency Assay
2.6.2. In Vitro Release Assay
2.7. Validation Study
2.7.1. System Suitability Testing
2.7.2. Specificity
2.7.3. Linearity
2.7.4. Precision
2.7.5. Accuracy
2.7.6. Sensitivity
2.7.7. Robustness
2.8. Statistical Analysis
3. Results and Discussion
3.1. Validation Procedure
3.1.1. System Suitability Testing
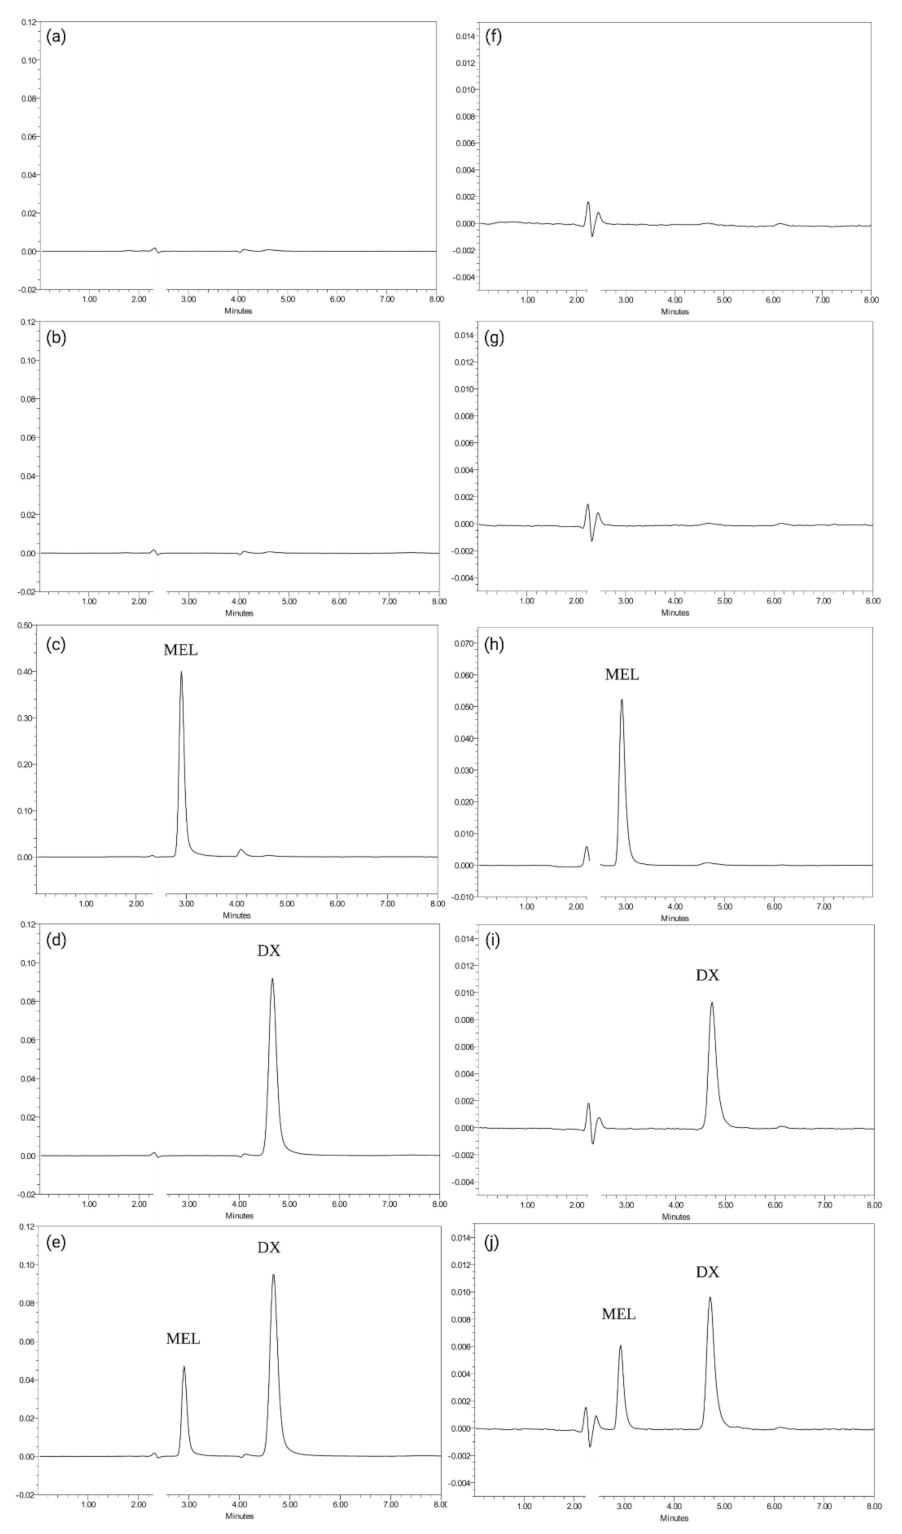
3.1.2. Specificity
3.1.3. Linearity
3.1.4. Precision
3.1.5. Accuracy
3.1.6. Sensitivity
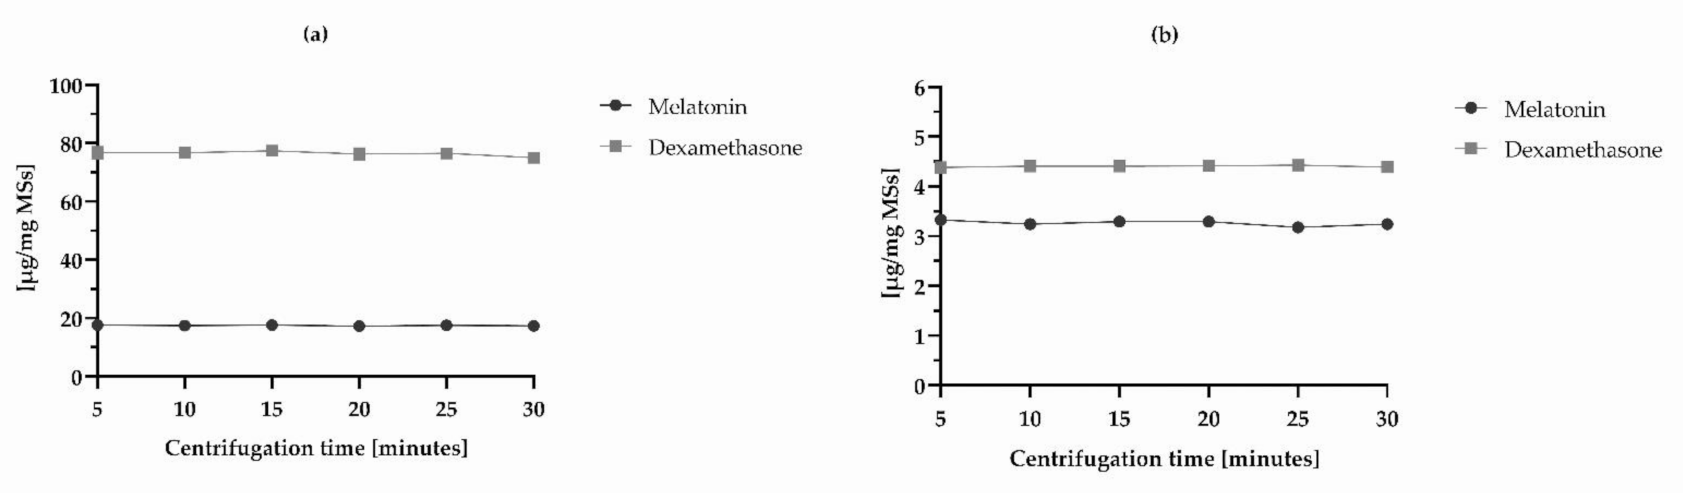
3.1.7. Robustness
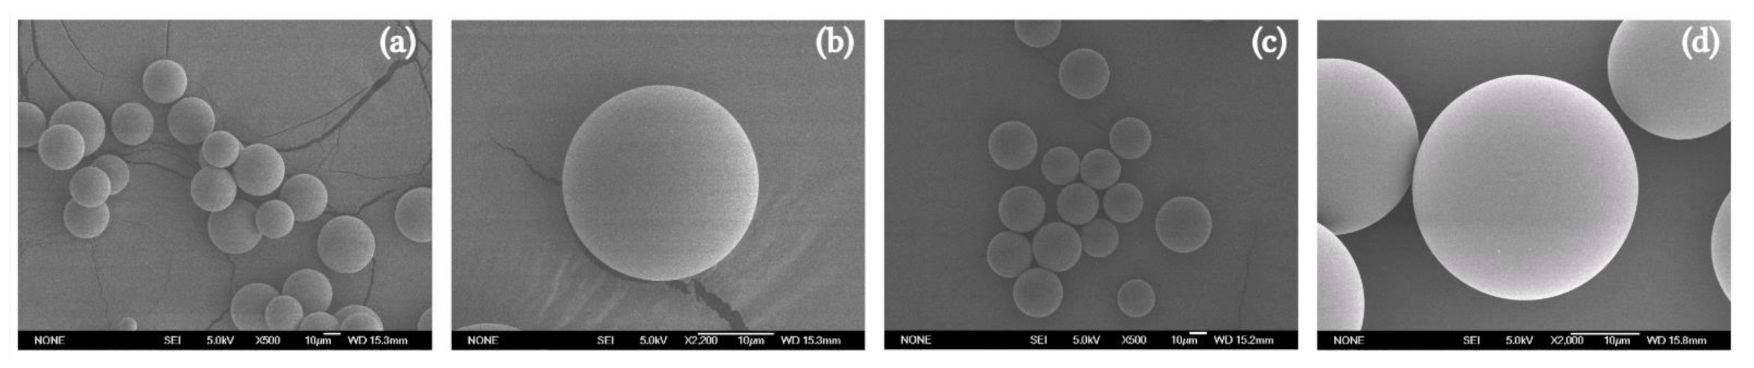
3.2. Methods Applicability
4. Conclusions
Supplementary Materials
Author Contributions
Funding
Institutional Review Board Statement
Informed Consent Statement
Acknowledgments
Conflicts of Interest
Abbreviations
| HPLC-UV | high performance liquid chromatography with ultraviolet detection |
| UV | ultraviolet |
| PLGA | poly(D,L-lactic-co-glycolic) acid |
| DX | dexamethasone |
| MEL | melatonin |
| MSs | microspheres |
| DX-MEL-MSs | dexamethasone and melatonin co-loaded PLGA microspheres |
| RGC | retinal ganglion cells |
| IOP | intraocular pressure |
| LC/MS | liquid chromatography tandem mass spectrometry |
| MeOH | methanol |
| DCM | dichloromethane |
| PVA | polyvinyl alcohol |
| blank-MSs | unloaded microspheres |
| EE | encapsulation efficiency assay |
| SD | standard deviation |
| PBS | phosphate buffer solution |
| IVR | in vitro release assay |
| SS | stock standard solution |
| SS-EE | stock standard solution for encapsulation efficiency assay |
| SS-IVR | stock standard solution for in vitro release assay |
| WS | working solution |
| WS-EE | working solution for encapsulation efficiency assay |
| WS-IVR | working solution for in vitro release assay |
| ICH | International Conference on Harmonization |
| FDA | Food and Drug Administration |
| RSD | relative standard deviation |
| LOD | limit of detection |
| LOQ | limit of quantification |
| tR | retention time |
| tW | peak width |
| Rs | resolution between peaks |
| IR | injection repeatability |
| T | tailing factor |
| N | theoretical plate number |
| pS | peak symmetry |
| SEM | scanning electron microscopy |
References
- Tian, K.; Shibata-Germanos, S.; Pahlitzsch, M.; Cordeiro, M.F. Current perspective of neuroprotection and glaucoma. Clin. Ophthalmol. 2015, 9, 2109–2118. [Google Scholar] [CrossRef] [Green Version]
- Guymer, C.; Wood, J.P.M.; Chidlow, G.; Casson, R.J. Neuroprotection in glaucoma: Recent advances and clinical translation. Clin. Exp. Ophthalmol. 2019, 47, 88–105. [Google Scholar] [CrossRef] [PubMed]
- Schmidl, D.; Schmetterer, L.; Garhöfer, G.; Popa-Cherecheanu, A. Pharmacotherapy of Glaucoma. J. Ocul. Pharmacol. Ther. 2015, 31, 63–77. [Google Scholar] [CrossRef] [PubMed] [Green Version]
- Cohen, L.P.; Pasquale, L.R. Clinical characteristics and current treatment of glaucoma. Cold Spring Harb. Perspect. Med. 2014, 4, a017236. [Google Scholar] [CrossRef] [PubMed] [Green Version]
- Tsai, J.C. Innovative IOP-Independent Neuroprotection and Neuroregeneration Strategies in the Pipeline for Glaucoma. J. Ophthalmol. 2020, 2020, 9329310. [Google Scholar] [CrossRef] [Green Version]
- Sheikh, S.; Haque, E.; Mir, S.S. Neurodegenerative Diseases: Multifactorial Conformational Diseases and Their Therapeutic Interventions. J. Neurodegener. Dis. 2013, 2013, 563481. [Google Scholar] [CrossRef] [Green Version]
- Schmidt, K.-G.; Bergert, H.; Funk, R. Neurodegenerative Diseases of the Retina and Potential for Protection and Recovery. Curr. Neuropharmacol. 2008, 6, 164–178. [Google Scholar] [CrossRef] [Green Version]
- Tezel, G. Oxidative stress in glaucomatous neurodegeneration: Mechanisms and consequences. Prog. Retin. Eye Res. 2006, 25, 490–513. [Google Scholar] [CrossRef] [Green Version]
- Cuenca, N.; Fernández-Sánchez, L.; Campello, L.; Maneu, V.; De la Villa, P.; Lax, P.; Pinilla, I. Cellular responses following retinal injuries and therapeutic approaches for neurodegenerative diseases. Prog. Retin. Eye Res. 2014, 43, 17–75. [Google Scholar] [CrossRef]
- Wiechmann, A.F.; Sherry, D.M. Role of Melatonin and its Receptors in the Vertebrate Retina. In International Review of Cell and Molecular Biology; Elsevier: Amsterdam, The Netherlands, 2013; Volume 300, pp. 211–242. ISBN 9780124052109. [Google Scholar]
- Peyrot, F.; Ducrocq, C. Potential role of tryptophan derivatives in stress responses characterized by the generation of reactive oxygen and nitrogen species. J. Pineal Res. 2008, 45, 235–246. [Google Scholar] [CrossRef]
- Poeggeler, B.; Saarela, S.; Reiter, R.J.; Tan, D.-X.; Chen, L.-D.; Manchester, L.C.; Barlow-Walden, L.R. Melatonin—A Highly Potent Endogenous Radical Scavenger and Electron Donor: New Aspects of the Oxidation Chemistry of this Indole Accessed in vitro. Ann. N. Y. Acad. Sci. 1994, 738, 419–420. [Google Scholar] [CrossRef] [PubMed]
- Belforte, N.A.; Moreno, M.C.; De Zavalía, N.; Sande, P.H.; Chianelli, M.S.; Keller Sarmiento, M.I.; Rosenstein, R.E. Melatonin: A novel neuroprotectant for the treatment of glaucoma. J. Pineal Res. 2010, 48, 353–364. [Google Scholar] [CrossRef] [PubMed]
- Siu, A.W.; Maldonado, M.; Sanchez-Hidalgo, M.; Tan, D.X.; Reiter, R.J. Protective effects of melatonin in experimental free radical-related ocular diseases. J. Pineal Res. 2006, 40, 101–109. [Google Scholar] [CrossRef]
- Agorastos, A.; Huber, C.G. The role of melatonin in glaucoma: Implications concerning pathophysiological relevance and therapeutic potential. J. Pineal Res. 2011, 50, 1–7. [Google Scholar] [CrossRef] [PubMed]
- Samples, J.R.; Krause, G.; Lewy, A.J. Effect of melatonin on intraocular pressure. Curr. Eye Res. 1988, 7, 649–653. [Google Scholar] [CrossRef]
- Pintor, J.; Martin, L.; Pelaez, T.; Hoyle, C.H.V.; Peral, A. Involvement of melatonin MT3 receptors in the regulation of intraocular pressure in rabbits. Eur. J. Pharmacol. 2001, 416, 251–254. [Google Scholar] [CrossRef]
- Saraiya, N.V.; Goldstein, D.A. Dexamethasone for ocular inflammation. Expert Opin. Pharmacother. 2011, 12, 1127–1131. [Google Scholar] [CrossRef]
- Arranz-Romera, A.; Davis, B.M.; Bravo-Osuna, I.; Esteban-Pérez, S.; Molina-Martínez, I.T.; Shamsher, E.; Ravindran, N.; Guo, L.; Cordeiro, M.F.; Herrero-Vanrell, R. Simultaneous co-delivery of neuroprotective drugs from multi-loaded PLGA microspheres for the treatment of glaucoma. J. Control. Release 2019, 297, 26–38. [Google Scholar] [CrossRef]
- Barbosa-Alfaro, D.; Andrés-Guerrero, V.; Fernandez-Bueno, I.; García-Gutiérrez, M.T.; Gil-Alegre, E.; Molina-Martínez, I.T.; Pastor-Jimeno, J.C.; Herrero-Vanrell, R.; Bravo-Osuna, I. Dexamethasone plga microspheres for sub-tenon administration: Influence of sterilization and tolerance studies. Pharmaceutics 2021, 13, 228. [Google Scholar] [CrossRef]
- García-Caballero, C.; Lieppman, B.; Arranz-Romera, A.; Molina-Martínez, I.T.; Bravo-Osuna, I.; Young, M.; Baranov, P.; Herrero-Vanrell, R. Photoreceptor preservation induced by intravitreal controlled delivery of gdnf and gdnf/melatonin in rhodopsin knockout mice. Mol. Vis. 2018, 24, 733–745. [Google Scholar]
- Bravo-Osuna, I.; Andrés-Guerrero, V.; Arranz-Romera, A.; Esteban-Pérez, S.; Molina-Martínez, I.T.; Herrero-Vanrell, R. Microspheres as intraocular therapeutic tools in chronic diseases of the optic nerve and retina. Adv. Drug Deliv. Rev. 2018, 126, 127–144. [Google Scholar] [CrossRef] [PubMed]
- Pan, X.; Liu, X.; Zhuang, X.; Liu, Y.; Li, S. Co-delivery of dexamethasone and melatonin by drugs laden PLGA nanoparticles for the treatment of glaucoma. J. Drug Deliv. Sci. Technol. 2020, 60, 102086. [Google Scholar] [CrossRef]
- Fuster, J.; Negro, S.; Salama, A.; Fernández-Carballido, A.; Marcianes, P.; Boeva, L.; Barcia, E. HPLC-UV method development and validation for the quantification of ropinirole in new PLGA multiparticulate systems: Microspheres and nanoparticles. Int. J. Pharm. 2015, 491, 310–317. [Google Scholar] [CrossRef] [PubMed]
- Martín-Sabroso, C.; Tavares-Fernandes, D.F.; Espada-García, J.I.; Torres-Suárez, A.I. Validation protocol of analytical procedures for quantification of drugs in polymeric systems for parenteral administration: Dexamethasone phosphate disodium microparticles. Int. J. Pharm. 2013, 458, 188–196. [Google Scholar] [CrossRef]
- Gil-Alegre, M.E.; Barone, M.L.; Torres-Suárez, A.I. Extraction and determination by liquid chromatography and spectrophotometry of naloxone in microparticles for drug-addiction treatment. J. Sep. Sci. 2005, 28, 2086–2093. [Google Scholar] [CrossRef]
- Zolnik, B.S.; Burgess, D.J. Evaluation of in vivo-in vitro release of dexamethasone from PLGA microspheres. J. Control. Release 2008, 127, 137–145. [Google Scholar] [CrossRef] [PubMed]
- Binson, G.; Venisse, N.; Bacle, A.; Beuzit, K.; Dupuis, A. Preparation and Physico-Chemical Stability of Dexamethasone Oral Suspension. Pharm. Technol. Hosp. Pharm. 2017, 2, 193–201. [Google Scholar] [CrossRef] [Green Version]
- Lin, J.; Zhang, C.; Gao, Y.; Zhao, X.; Li, X. A Validated HPLC Method for Determining Melatonin in Capsule Dosage Form. Spat. DD-Peer Rev. J. Complement. Med. Drug Discov. 2012, 2, 147–151. [Google Scholar] [CrossRef]
- Ansari, M.; Kh, R.; Yasa, N.; Vardasbi, S.; Naimi, S.M.; Nowrouzi, A. Measurement of melatonin in alcoholic and hot water extracts of Tanacetum parthenium, Tripleurospermum disciforme and Viola odorata. DARU J. Pharm. Sci. 2010, 18, 173–178. [Google Scholar]
- Arslan Azizoğlu, G.; Azizoğlu, E.; Tuncay Tanriverdi, S.; Özer, Ö. A validated HPLC method for simultaneous estimation of melatonin and Octyl Methoxycinnamate in combined pharmaceutical applications. Marmara Pharm. J. 2017, 21, 921–930. [Google Scholar] [CrossRef] [Green Version]
- Duarah, S.; Sharma, M.; Wen, J. Rapid and simultaneous determination of dexamethasone and dexamethasone sodium phosphate using HPLC-UV: Application in microneedle-assisted skin permeation and deposition studies. J. Chromatogr. B Anal. Technol. Biomed. Life Sci. 2021, 1170, 122609. [Google Scholar] [CrossRef] [PubMed]
- Arranz-Romera, A.; Esteban-Pérez, S.; Molina-Martínez, I.T.; Bravo-Osuna, I.; Herrero-Vanrell, R. Co-delivery of glial cell–derived neurotrophic factor (GDNF) and tauroursodeoxycholic acid (TUDCA) from PLGA microspheres: Potential combination therapy for retinal diseases. Drug Deliv. Transl. Res. 2021, 11, 566–580. [Google Scholar] [CrossRef] [PubMed]
- Fu, X.; Ping, Q.; Gao, Y. Effects of formulation factors on encapsulation efficiency and release behaviour in vitro of huperzine A-PLGA microspheres. J. Microencapsul. 2005, 22, 57–66. [Google Scholar] [CrossRef] [PubMed]
- International Conference for Harmonisation (ICH). Q2(R1) Validation of Analytical Procedures: Text and Methodology. ICH Harmon. Tripart. Guidel. 2005, 62. [Google Scholar] [CrossRef]
- Food and Drug Administration (FDA). Validation of Chromatographic Methods; FDA: Silver Spring, MD, USA, 1994. [Google Scholar]
- Shabir, G.A. Validation of high-performance liquid chromatography methods for pharmaceutical analysis. J. Chromatogr. A 2003, 987, 57–66. [Google Scholar] [CrossRef]
- Long, G.L.; Winefordner, J.D. Limit of Detection: A Closer Look at the IUPAC Definition. Anal. Chem. 1983, 55, 13. [Google Scholar] [CrossRef]
- Ramirez, L.; Pastoriza, P.; Herrero-Vanrell, R. Biodegradable poly(DL-lactic-co-clycolic acid) microspheres containing tetracaine hydrochloride. In-vitro release profile. J. Microencapsul. 1999, 16, 105–115. [Google Scholar] [CrossRef]
- Food and Drug Administration (FDA). Methods, Method Verification and Validation; FDA: Silver Spring, MD, USA, 2020; Volume II. [Google Scholar]
- Tellinghuisen, J. Calibration: Detection, Quantification, and Confidence Limits Are (Almost) Exact When the Data Variance Function Is Known. Anal. Chem. 2019, 91, 8715–8722. [Google Scholar] [CrossRef] [Green Version]
- Fernández-Sánchez, L.; Bravo-Osuna, I.; Lax, P.; Arranz-Romera, A.; Maneu, V.; Esteban-Párez, S.; Pinilla, I.; Del Mar Puebla-González, M.; Herrero-Vanrell, R.; Cuenca, N. Controlled delivery of tauroursodeoxycholic acid from biodegradable microspheres slows retinal degeneration. PLoS ONE 2017, 12, e0177998. [Google Scholar] [CrossRef]
- Park, C.W.; Lee, H.J.; Oh, D.W.; Kang, J.H.; Han, C.S.; Kim, D.W. Preparation and in vitro/in vivo evaluation of PLGA microspheres containing norquetiapine for long-acting injection. Drug Des. Devel. Ther. 2018, 12, 711–719. [Google Scholar] [CrossRef] [Green Version]


| Procedure A (for EE Determination) | Procedure B (for IVR Quantitation) | |||
|---|---|---|---|---|
| 50 µg mL−1 | 10 µg mL−1 | |||
| MEL | DX | MEL | DX | |
| tR | 2.91 (0.24) | 4.69 (0.24) | 2.94 (0.13) | 4.73 (0.11) |
| tW | 0.65 (1.04) | 0.63 (2.80) | 0.59 (1.54) | 0.73 (1.92) |
| Rs | 3.42 (0.16) | 4.39 (0.98) | ||
| IR | 0.11 | 0.21 | 0.42 | 0.45 |
| T | 1.21 (0.15) | 1.20 (0.38) | 1.46 (2.09) | 1.34 (1.30) |
| N | 3309.12 (1.96) | 5029.93 (1.00) | 4531.83 (2.49) | 5732.29 (2.75) |
| Procedure A | Procedure B | |||
|---|---|---|---|---|
| MEL | DX | MEL | DX | |
| Slope | 64,272.9 | 22,435.8 | 62,259.9 | 21,169.4 |
| Standard error slope | 185.52 | 80.76 | 202.99 | 82.05 |
| Intercept | −6243.69 | 3504.68 | −3275.71 | 916.62 |
| Standard error intercept (σ) | 4878.03 | 2123.61 | 2046.99 | 827.37 |
| t-Statistic slope (p) | 346.46 (0.000) * | 277.80 (0.000) * | 306.71 (0.000) * | 258.01 (0.000) * |
| t-Statistic intercept (p) | −1.28 (0.2134) | 1.65 (0.113) | −1.60 (0.124) | 1.11 (0.280) |
| Correlation coefficient (R) | 0.9999 | 0.9999 | 0.9999 | 0.9998 |
| “Χ2” Bartlett’s test (p) | 11.89 (0.064) | 4.96 (0.549) | 6.54 (0.365) | 9.87 (0.130) |
| ANOVA F-test for regression (p) | 120,032.96 (0.000) * | 77,170.01 (0.000) * | 94,070.56 (0.000) * | 66,571.46 (0.000) * |
| Procedure A | Procedure B | ||||||||||||
|---|---|---|---|---|---|---|---|---|---|---|---|---|---|
| Conc | MEL | DX | Conc | MEL | DX | ||||||||
| Day 1 | Day 2 | Day 3 | Day 1 | Day 2 | Day 3 | Day 1 | Day 2 | Day 3 | Day 1 | Day 2 | Day 3 | ||
| 5 | 100.78 | 99.79 | 101.70 | 101.73 | 100.67 | 102.44 | 2.5 | 100.90 | 99.11 | 100.11 | 101.63 | 101.24 | 98.46 |
| 100.82 | 99.52 | 101.79 | 101.96 | 102.57 | 101.32 | 101.00 | 98.82 | 99.75 | 100.88 | 101.16 | 97.26 | ||
| 100.32 | 100.86 | 99.09 | 98.49 | 100.86 | 102.37 | 99.95 | 101.52 | 98.89 | 99.02 | 99.90 | 99.17 | ||
| 100.12 | 100.18 | 99.99 | 98.79 | 100.98 | 102.33 | 100.17 | 101.37 | 98.82 | 98.14 | 100.20 | 99.50 | ||
| 99.83 | 100.58 | 98.07 | 102.08 | 99.35 | 99.11 | 98.80 | 99.04 | 100.74 | 100.13 | 97.47 | 101.25 | ||
| 99.52 | 100.31 | 97.87 | 101.88 | 99.10 | 99.54 | 98.45 | 98.67 | 100.57 | 99.41 | 97.26 | 101.94 | ||
| 20 | 98.87 | 100.27 | 98.28 | 98.54 | 100.03 | 98.53 | 7.5 | 100.00 | 100.86 | 99.97 | 100.26 | 101.89 | 100.06 |
| 98.57 | 100.32 | 98.57 | 98.68 | 99.95 | 98.71 | 100.10 | 101.00 | 99.83 | 100.17 | 101.75 | 100.18 | ||
| 101.57 | 101.30 | 101.63 | 101.36 | 101.61 | 101.11 | 98.49 | 99.75 | 98.25 | 98.16 | 99.86 | 98.28 | ||
| 101.70 | 100.75 | 101.10 | 101.70 | 101.80 | 101.09 | 98.37 | 99.79 | 98.41 | 98.38 | 99.78 | 98.38 | ||
| 100.44 | 99.06 | 100.62 | 100.37 | 99.15 | 100.47 | 101.31 | 98.29 | 101.00 | 101.58 | 98.38 | 102.00 | ||
| 100.15 | 98.90 | 100.01 | 100.59 | 99.22 | 100.16 | 100.95 | 98.22 | 101.11 | 101.95 | 99.25 | 101.69 | ||
| 40 | 100.58 | 98.12 | 100.64 | 101.33 | 99.87 | 101.92 | 15 | 100.80 | 99.47 | 101.05 | 99.87 | 100.04 | 101.05 |
| 100.65 | 98.46 | 101.06 | 101.27 | 99.70 | 101.88 | 100.60 | 99.65 | 100.37 | 99.77 | 100.92 | 101.30 | ||
| 100.69 | 100.91 | 100.85 | 100.99 | 100.60 | 100.50 | 98.29 | 101.26 | 100.90 | 101.62 | 101.27 | 99.22 | ||
| 100.72 | 101.08 | 100.95 | 101.44 | 100.90 | 100.31 | 98.25 | 101.37 | 100.80 | 101.71 | 101.68 | 99.13 | ||
| 98.49 | 101.19 | 98.68 | 99.59 | 101.77 | 98.36 | 101.27 | 100.92 | 99.43 | 98.82 | 99.99 | 100.02 | ||
| 98.67 | 101.28 | 99.00 | 99.65 | 101.82 | 98.50 | 101.33 | 101.08 | 99.30 | 97.85 | 99.23 | 100.01 | ||
| Procedure A | Procedure B | |||
|---|---|---|---|---|
| MEL | DX | MEL | DX | |
| Average (recovery percentages) | 100.10 | 100.54 | 99.97 | 99.99 |
| RSD (%) repeatability | 1.11 | 1.26 | 1.10 | 1.38 |
| RSD (%) intermediate precision | 1.09 | 1.24 | 1.08 | 1.36 |
| “W” Levene’s test (p) | 2.58 (0.085) | 0.98 (0.381) | 1.35 (0.269) | 0.05 (0.950) |
| ANOVA F-test inter-day (p) | 0.12 (0.889) | 0.03 (0.971) | 0.02 (0.983) | 0.05 (0.955) |
| Procedure A | Procedure B | |||
|---|---|---|---|---|
| MEL | DX | MEL | DX | |
| Average (recovery percentages) | 100.10 | 100.54 | 99.97 | 99.99 |
| RSD (recovery percentages, %) | 1.09 | 1.24 | 1.08 | 1.36 |
| Confidence interval recovery percentages | 99.80–100.40 | 100.20–100.88 | 99.68–100.27 | 99.62–100.36 |
| “W” Levene’s test (p) | 1.02 (0.369) | 1.36 (0.265) | 0.16 (0.852) | 1.10 (0.341) |
| ANOVA F-test inter-day (p) | 0.01 (0.987) | 1.44 (0.248) | 1.63 (0.206) | 0.78 (0.465) |
| MEL | DX | |||||||
|---|---|---|---|---|---|---|---|---|
| Day | Conc | Average | SD | RSD (%) | Conc | Average | SD | RSD (%) |
| 1 | 0.34 | 0.35 | 0.03 | 8.09 | 0.39 | 0.40 | 0.02 | 5.77 |
| 0.32 | 0.37 | |||||||
| 0.33 | 0.42 | |||||||
| 0.34 | 0.43 | |||||||
| 0.40 | 0.39 | |||||||
| 0.35 | 0.42 | |||||||
| 2 | 0.38 | 0.35 | 0.03 | 9.07 | 0.40 | 0.41 | 0.02 | 5.19 |
| 0.33 | 0.42 | |||||||
| 0.37 | 0.39 | |||||||
| 0.39 | 0.43 | |||||||
| 0.32 | 0.44 | |||||||
| 0.32 | 0.39 | |||||||
| 3 | 0.33 | 0.34 | 0.01 | 3.66 | 0.39 | 0.41 | 0.02 | 4.62 |
| 0.35 | 0.42 | |||||||
| 0.33 | 0.41 | |||||||
| 0.35 | 0.43 | |||||||
| 0.32 | 0.38 | |||||||
| 0.33 | 0.40 | |||||||
| Average | 0.34 | 0.41 | ||||||
| SD | 0.03 | 0.02 | ||||||
| RSD (%) | 7.41 | 5.22 | ||||||
| Parameter | Mobile Phase (% MeOH) | Column Oven Temperature (°C) | Detection Wavelength (nm) | ||||||||
|---|---|---|---|---|---|---|---|---|---|---|---|
| Value | 68 | 70 | 72 | 43 | 45 | 47 | 220.7 238.5 | 222.7 240.5 | 224.7 242.5 | ||
| Procedure A | MEL | Average (recovery%) | 99.44 | 100.54 | 101.47 | 98.99 | 100.84 | 101.63 | 98.40 | 100.10 | 99.18 |
| RSD (recovery%) | 0.26 | 0.44 | 0.35 | 0.55 | 0.73 | 0.63 | 0.31 | 0.42 | 0.54 | ||
| tR (RSD%) | 2.97 (0.21) | 2.89 (0.21) | 2.82 (0.19) | 2.91 (0.18) | 2.89 (0.17) | 2.87 (0.23) | 2.86 (0.21) | 2.88 (0.16) | 2.88 (0.16) | ||
| pS (RSD%) | 1.34 (1.11) | 1.31 (1.44) | 1.33 (1.27) | 1.32 (0.48) | 1.34 (1.54) | 1.32 (0.70) | 1.33 (1.09) | 1.35 (0.96) | 1.33 (0.68) | ||
| DX | Average (recovery%) | 99.36 | 100.53 | 101.06 | 98.66 | 100.90 | 101.74 | 99.74 | 100.10 | 99.14 | |
| RSD (recovery%) | 0.58 | 1.01 | 0.41 | 0.98 | 0.82 | 0.89 | 0.88 | 1.01 | 0.95 | ||
| tR (RSD%) | 5.16 (0.15) | 4.68 (0.13) | 4.28 (0.10) | 4.78 (0.09) | 4.68 (0.14) | 4.58 (0.15) | 4.66 (0.09) | 4.67 (0.13) | 4.66 (0.13) | ||
| pS (RSD%) | 1.38 (0.73) | 1.35 (0.69) | 1.39 (1.43) | 1.32 (0.37) | 1.37 (0.98) | 1.38 (0.42) | 1.37 (0.87) | 1.39 (0.75) | 1.37 (0.57) | ||
| Procedure B | MEL | Average (recovery%) | 98.13 | 100.42 | 99.13 | 98.76 | 99.78 | 101.14 | 98.90 | 100.34 | 98.53 |
| RSD (recovery%) | 0.77 | 0.79 | 0.67 | 0.48 | 0.53 | 0.55 | 0.60 | 0.35 | 0.32 | ||
| tR (RSD%) | 3.01 (0.24) | 2.94 (0.22) | 2.87 (0.24) | 2.96 (0.22) | 2.94 (0.15) | 2.92 (0.21) | 2.92 (0.24) | 2.92 (0.23) | 2.92 (0.23) | ||
| pS (RSD%) | 1.40 (1.90) | 1.43 (1.75) | 1.70 (1.86) | 1.49 (1.81) | 1.44 (1.78) | 1.52 (1.40) | 1.58 (1.71) | 1.52 (1.91) | 1.60 (1.77) | ||
| DX | Average (recovery%) | 99.56 | 100.74 | 98.85 | 98.87 | 99.56 | 101.56 | 98.32 | 99.94 | 98.86 | |
| RSD (recovery%) | 0.63 | 0.86 | 1.18 | 0.83 | 0.95 | 0.32 | 0.54 | 0.41 | 0.58 | ||
| tR (RSD%) | 5.21 (0.16) | 4.75 (0.15) | 4.34 (0.17) | 4.85 (0.14) | 4.75 (0.06) | 4.64 (0.14) | 4.72 (0.18) | 4.72 (0.18) | 4.72 (0.18) | ||
| pS (RSD%) | 1.40 (1.77) | 1.43 (1.73) | 1.62 (1.05) | 1.51 (1.98) | 1.41 (1.82) | 1.46 (1.76) | 1.54 (1.63) | 1.54 (1.60) | 1.56 (1.57) | ||
| Injection Volume | |||||
|---|---|---|---|---|---|
| 5 µL | 10 µL | 15 µL | |||
| Procedure A | MEL | tR (RSD%) | 2.90 (0.17) | 2.91 (0.24) | 2.90 (0.10) |
| pS (RSD%) | 1.26 (0.51) | 1.21 (0.15) | 1.15 (0.17) | ||
| Area responses (mean ± RSD%) | 1,615,543.83 ± 0.11 | 3,225,811.17 ± 0.11 | 4,836,931.33 ± 0.11 | ||
| p-value intercept (ANOVA) | 0.072 | ||||
| p-value slope (ANOVA) | <0.001 | ||||
| Correlation coefficient (R) | >0.999 | ||||
| DX | tR (RSD%) | 4.68 (0.11) | 4.69 (0.24) | 4.67 (0.08) | |
| pS (RSD%) | 1.23 (0.19) | 1.20 (0.38) | 1.21 (0.36) | ||
| Area responses (mean ± RSD%) | 558,907.50 ± 0.13 | 1,121,940.50 ± 0.21 | 1,678,211.33 ± 0.11 | ||
| p-value intercept (ANOVA) | 0.942 | ||||
| p-value slope (ANOVA) | 0.002 | ||||
| Correlation coefficient (R) | >0.999 | ||||
| Procedure B | MEL | tR (RSD%) | 2.94 (0.31) | 2.94 (0.13) | 2.96 (0.14) |
| pS (RSD%) | 1.31 (1.80) | 1.46 (1.89) | 1.40 (1.72) | ||
| Area responses (mean ± RSD%) | 309,225.00 ± 0.17 | 623,427.333 ± 0.41 | 927,817.00 ± 0.42 | ||
| p-value intercept (ANOVA) | 0.846 | ||||
| p-value slope (ANOVA) | 0.006 | ||||
| Correlation coefficient (R) | >0.999 | ||||
| DX | tR (RSD%) | 4.72 (0.20) | 4.73 (0.11) | 4.75 (0.15) | |
| pS (RSD%) | 1.21 (1.21) | 1.34 (1.30) | 1.34 (1.83) | ||
| Area responses (mean ± RSD%) | 106,708.67 ± 0.44 | 211,243.50 ± 0.44 | 314,313.67 ± 0.29 | ||
| p-value intercept (ANOVA) | 0.180 | ||||
| p-value slope (ANOVA) | 0.003 | ||||
| Correlation coefficient (R) | >0.999 | ||||
| Procedure A | Procedure B | |||
|---|---|---|---|---|
| Conc | MEL | DX | MEL | DX |
| Average ± SD (n = 4) 5 min | 17.59 ± 0.18 | 76.69 ± 2.10 | 3.33 ± 0.07 | 4.38 ± 0.10 |
| Average ± SD (n = 4) 10 min | 17.47 ± 0.30 | 76.69 ± 1.39 | 3.21 ± 0.11 | 4.41 ± 0.10 |
| Average ± SD (n = 4) 15 min | 17.62 ± 0.39 | 77.34 ± 1.89 | 3.29 ± 0.09 | 4.41 ± 0.11 |
| Average ± SD (n = 4) 20 min | 17.30 ± 0.44 | 76.30 ± 2.06 | 3.29 ± 0.08 | 4.41 ± 0.11 |
| Average ± SD (n = 4) 25 min | 17.52 ± 0.41 | 76.52 ± 1.51 | 3.18 ± 0.07 | 4.43 ± 0.09 |
| Average ± SD (n = 4) 30 min | 17.36 ± 0.50 | 75.08 ± 1.29 | 3.24 ± 0.06 | 4.38 ± 0.11 |
| ANOVA F-test inter-group (p) | 0.43 (0.822) | 0.74 (0.603) | 1.08 (0.405) | 0.11 (0.988) |
| SD (all measurements) | 0.36 | 1.69 | 0.09 | 0.09 |
| RSD (all measurements) (%) | 2.06 | 2.21 | 2.65 | 2.09 |
Publisher’s Note: MDPI stays neutral with regard to jurisdictional claims in published maps and institutional affiliations. |
© 2022 by the authors. Licensee MDPI, Basel, Switzerland. This article is an open access article distributed under the terms and conditions of the Creative Commons Attribution (CC BY) license (https://creativecommons.org/licenses/by/4.0/).
Share and Cite
Brugnera, M.; Vicario-de-la-Torre, M.; Andrés-Guerrero, V.; Bravo-Osuna, I.; Molina-Martínez, I.T.; Herrero-Vanrell, R. Validation of a Rapid and Easy-to-Apply Method to Simultaneously Quantify Co-Loaded Dexamethasone and Melatonin PLGA Microspheres by HPLC-UV: Encapsulation Efficiency and In Vitro Release. Pharmaceutics 2022, 14, 288. https://doi.org/10.3390/pharmaceutics14020288
Brugnera M, Vicario-de-la-Torre M, Andrés-Guerrero V, Bravo-Osuna I, Molina-Martínez IT, Herrero-Vanrell R. Validation of a Rapid and Easy-to-Apply Method to Simultaneously Quantify Co-Loaded Dexamethasone and Melatonin PLGA Microspheres by HPLC-UV: Encapsulation Efficiency and In Vitro Release. Pharmaceutics. 2022; 14(2):288. https://doi.org/10.3390/pharmaceutics14020288
Chicago/Turabian StyleBrugnera, Marco, Marta Vicario-de-la-Torre, Vanessa Andrés-Guerrero, Irene Bravo-Osuna, Irene Teresa Molina-Martínez, and Rocío Herrero-Vanrell. 2022. "Validation of a Rapid and Easy-to-Apply Method to Simultaneously Quantify Co-Loaded Dexamethasone and Melatonin PLGA Microspheres by HPLC-UV: Encapsulation Efficiency and In Vitro Release" Pharmaceutics 14, no. 2: 288. https://doi.org/10.3390/pharmaceutics14020288