
Mesoporous Silica Promotes Osteogenesis of Human Adipose-Derived Stem Cells Identified by a High-Throughput Microfluidic Chip Assay
 and
and 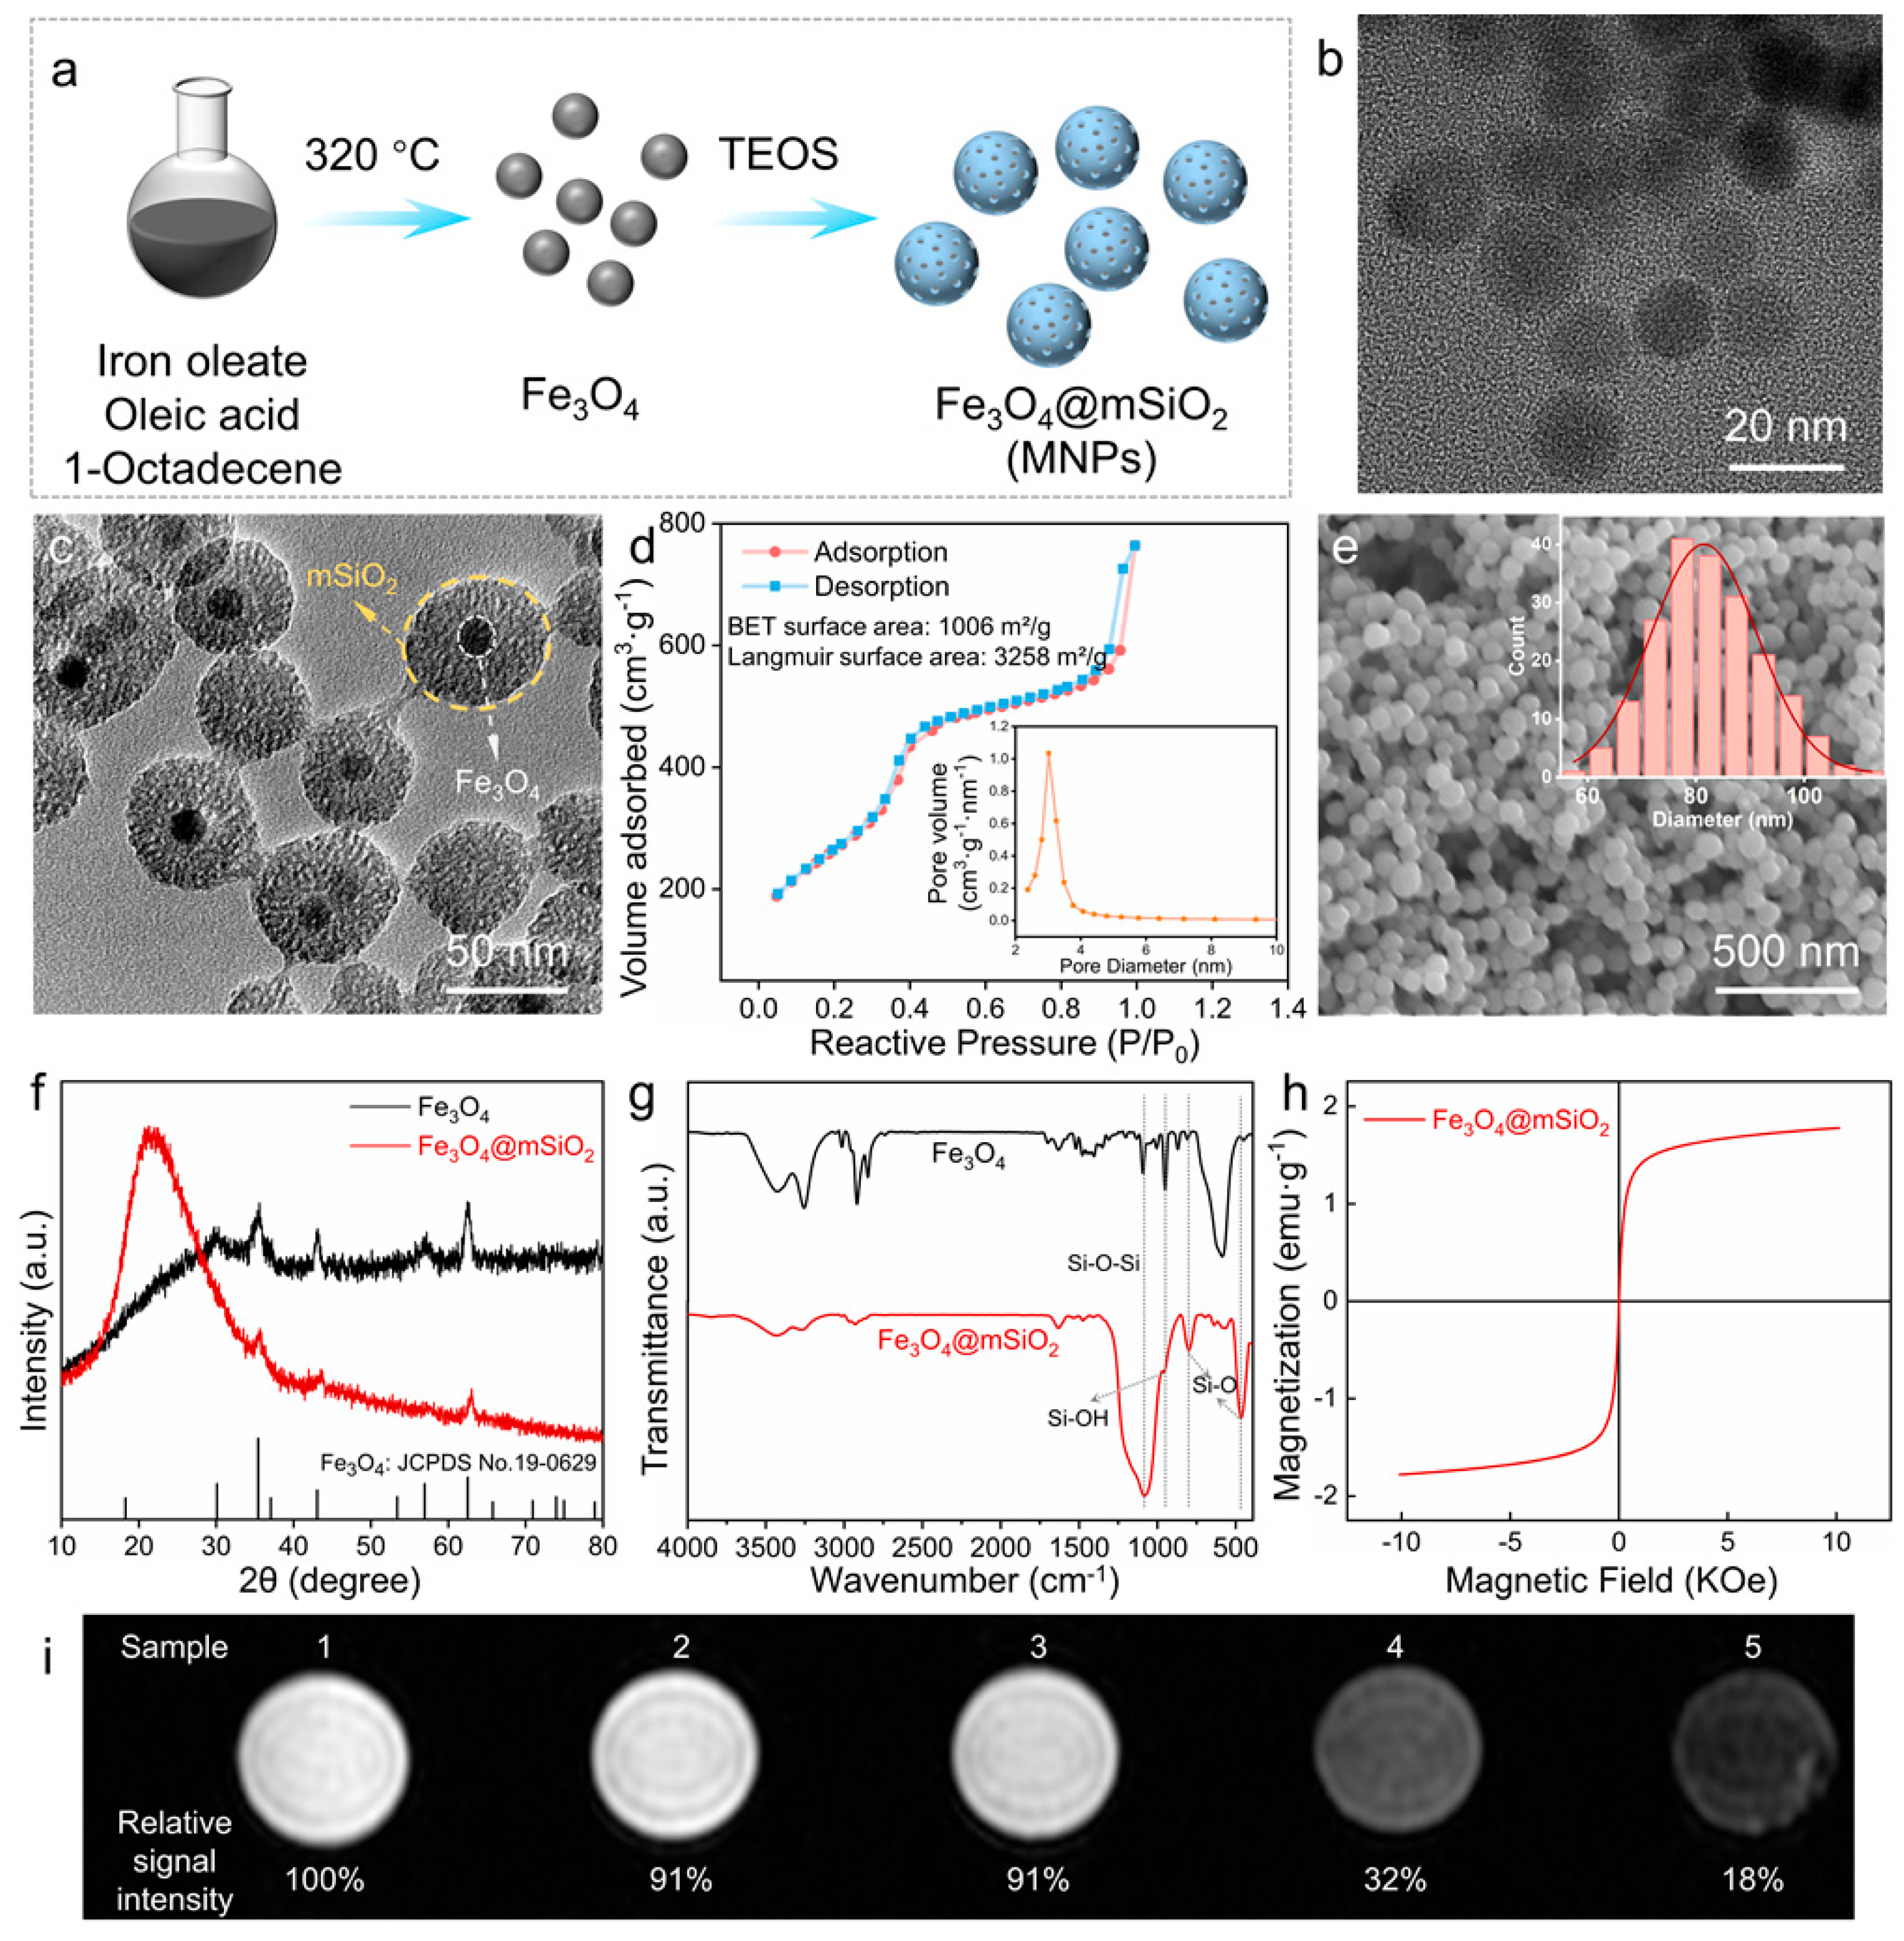
Abstract
:1. Introduction
2. Materials and Methods
2.1. Materials and Regents
2.2. Synthesis of Fe3O4 Nanoparticles
2.3. Synthesis of Fe3O4@mSiO2 Nanoparticles
2.4. Cell Culture and Differentiation
2.5. Live/dead Cellular Staining
2.6. CCK-8 Assay
2.7. Cytoskeleton Staining
2.8. Colocalization of Lysosomes and MNPs
2.9. RT–qPCR Analysis
2.10. Immunofluorescence Staining
2.11. Identifications of Alkaline Phosphatase (ALP)
2.12. Alizarin Red S Staining
2.13. Fabrication of PDMS Chips
2.14. The Array of Antibody Barcodes
2.15. Secretory Protein Detection
2.16. Statistical Analysis
3. Results and Discussion
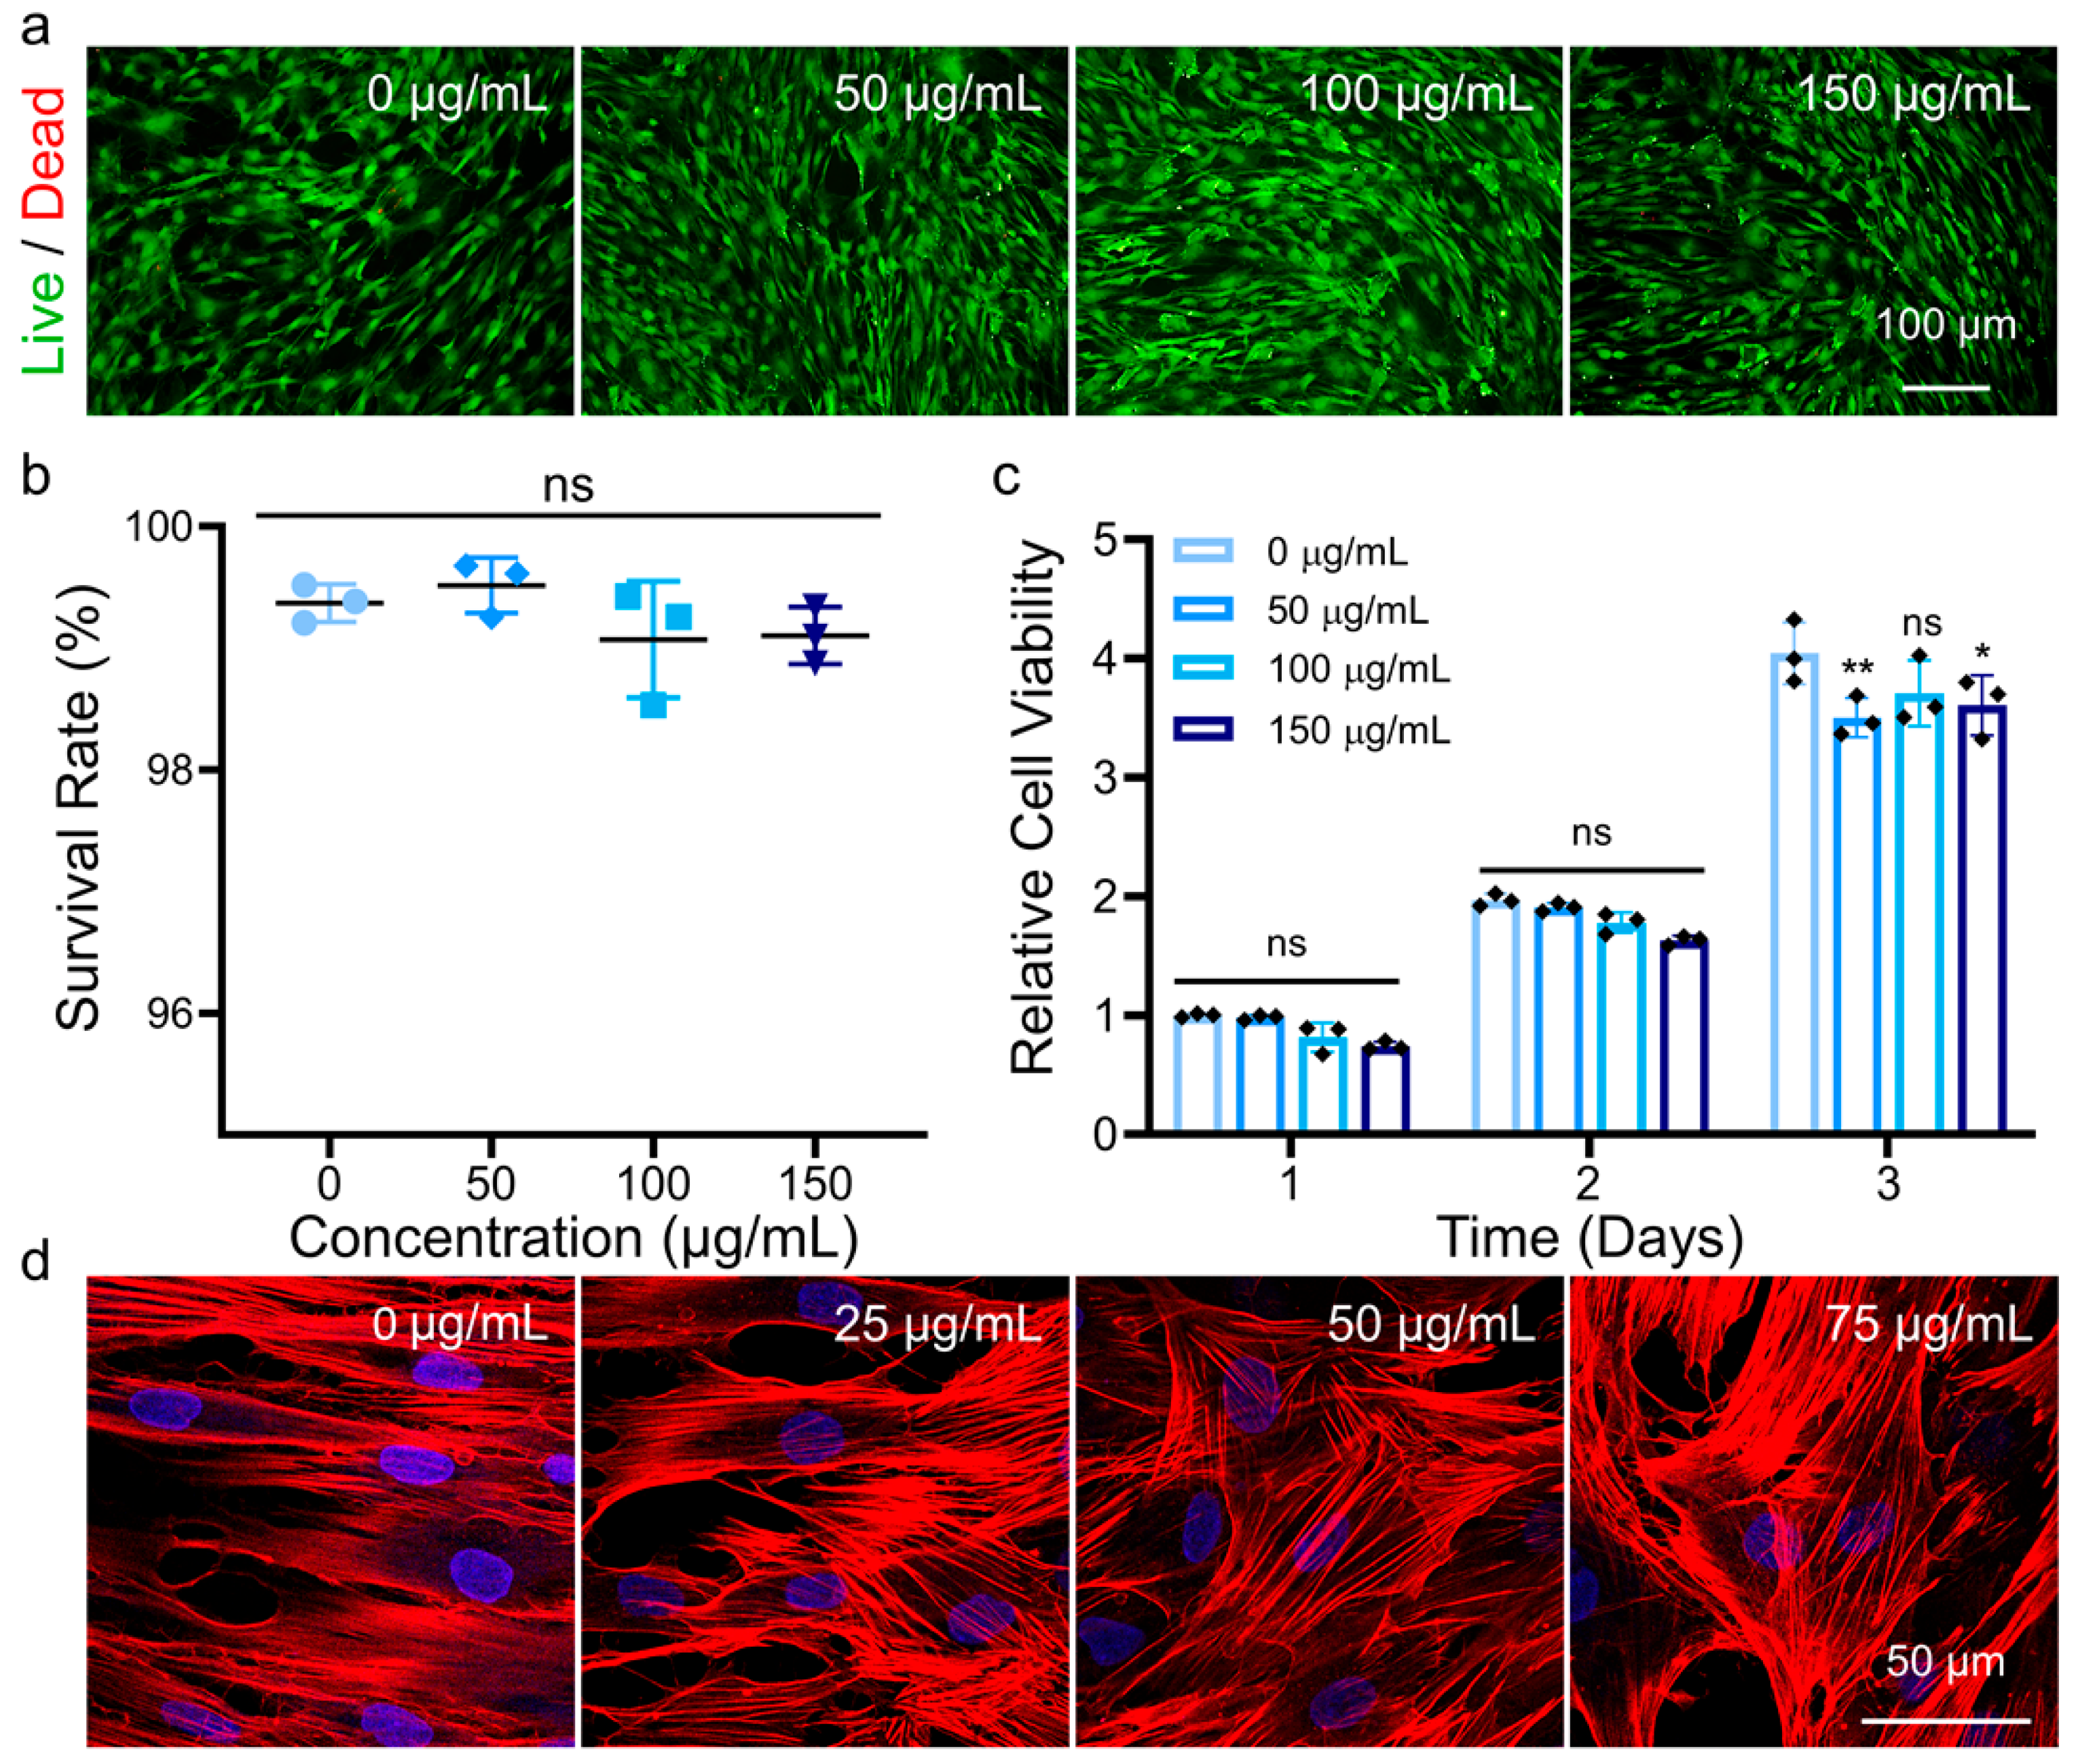
3.1. Characterization of MNPs and Their Cytocompatibility in hADSCs
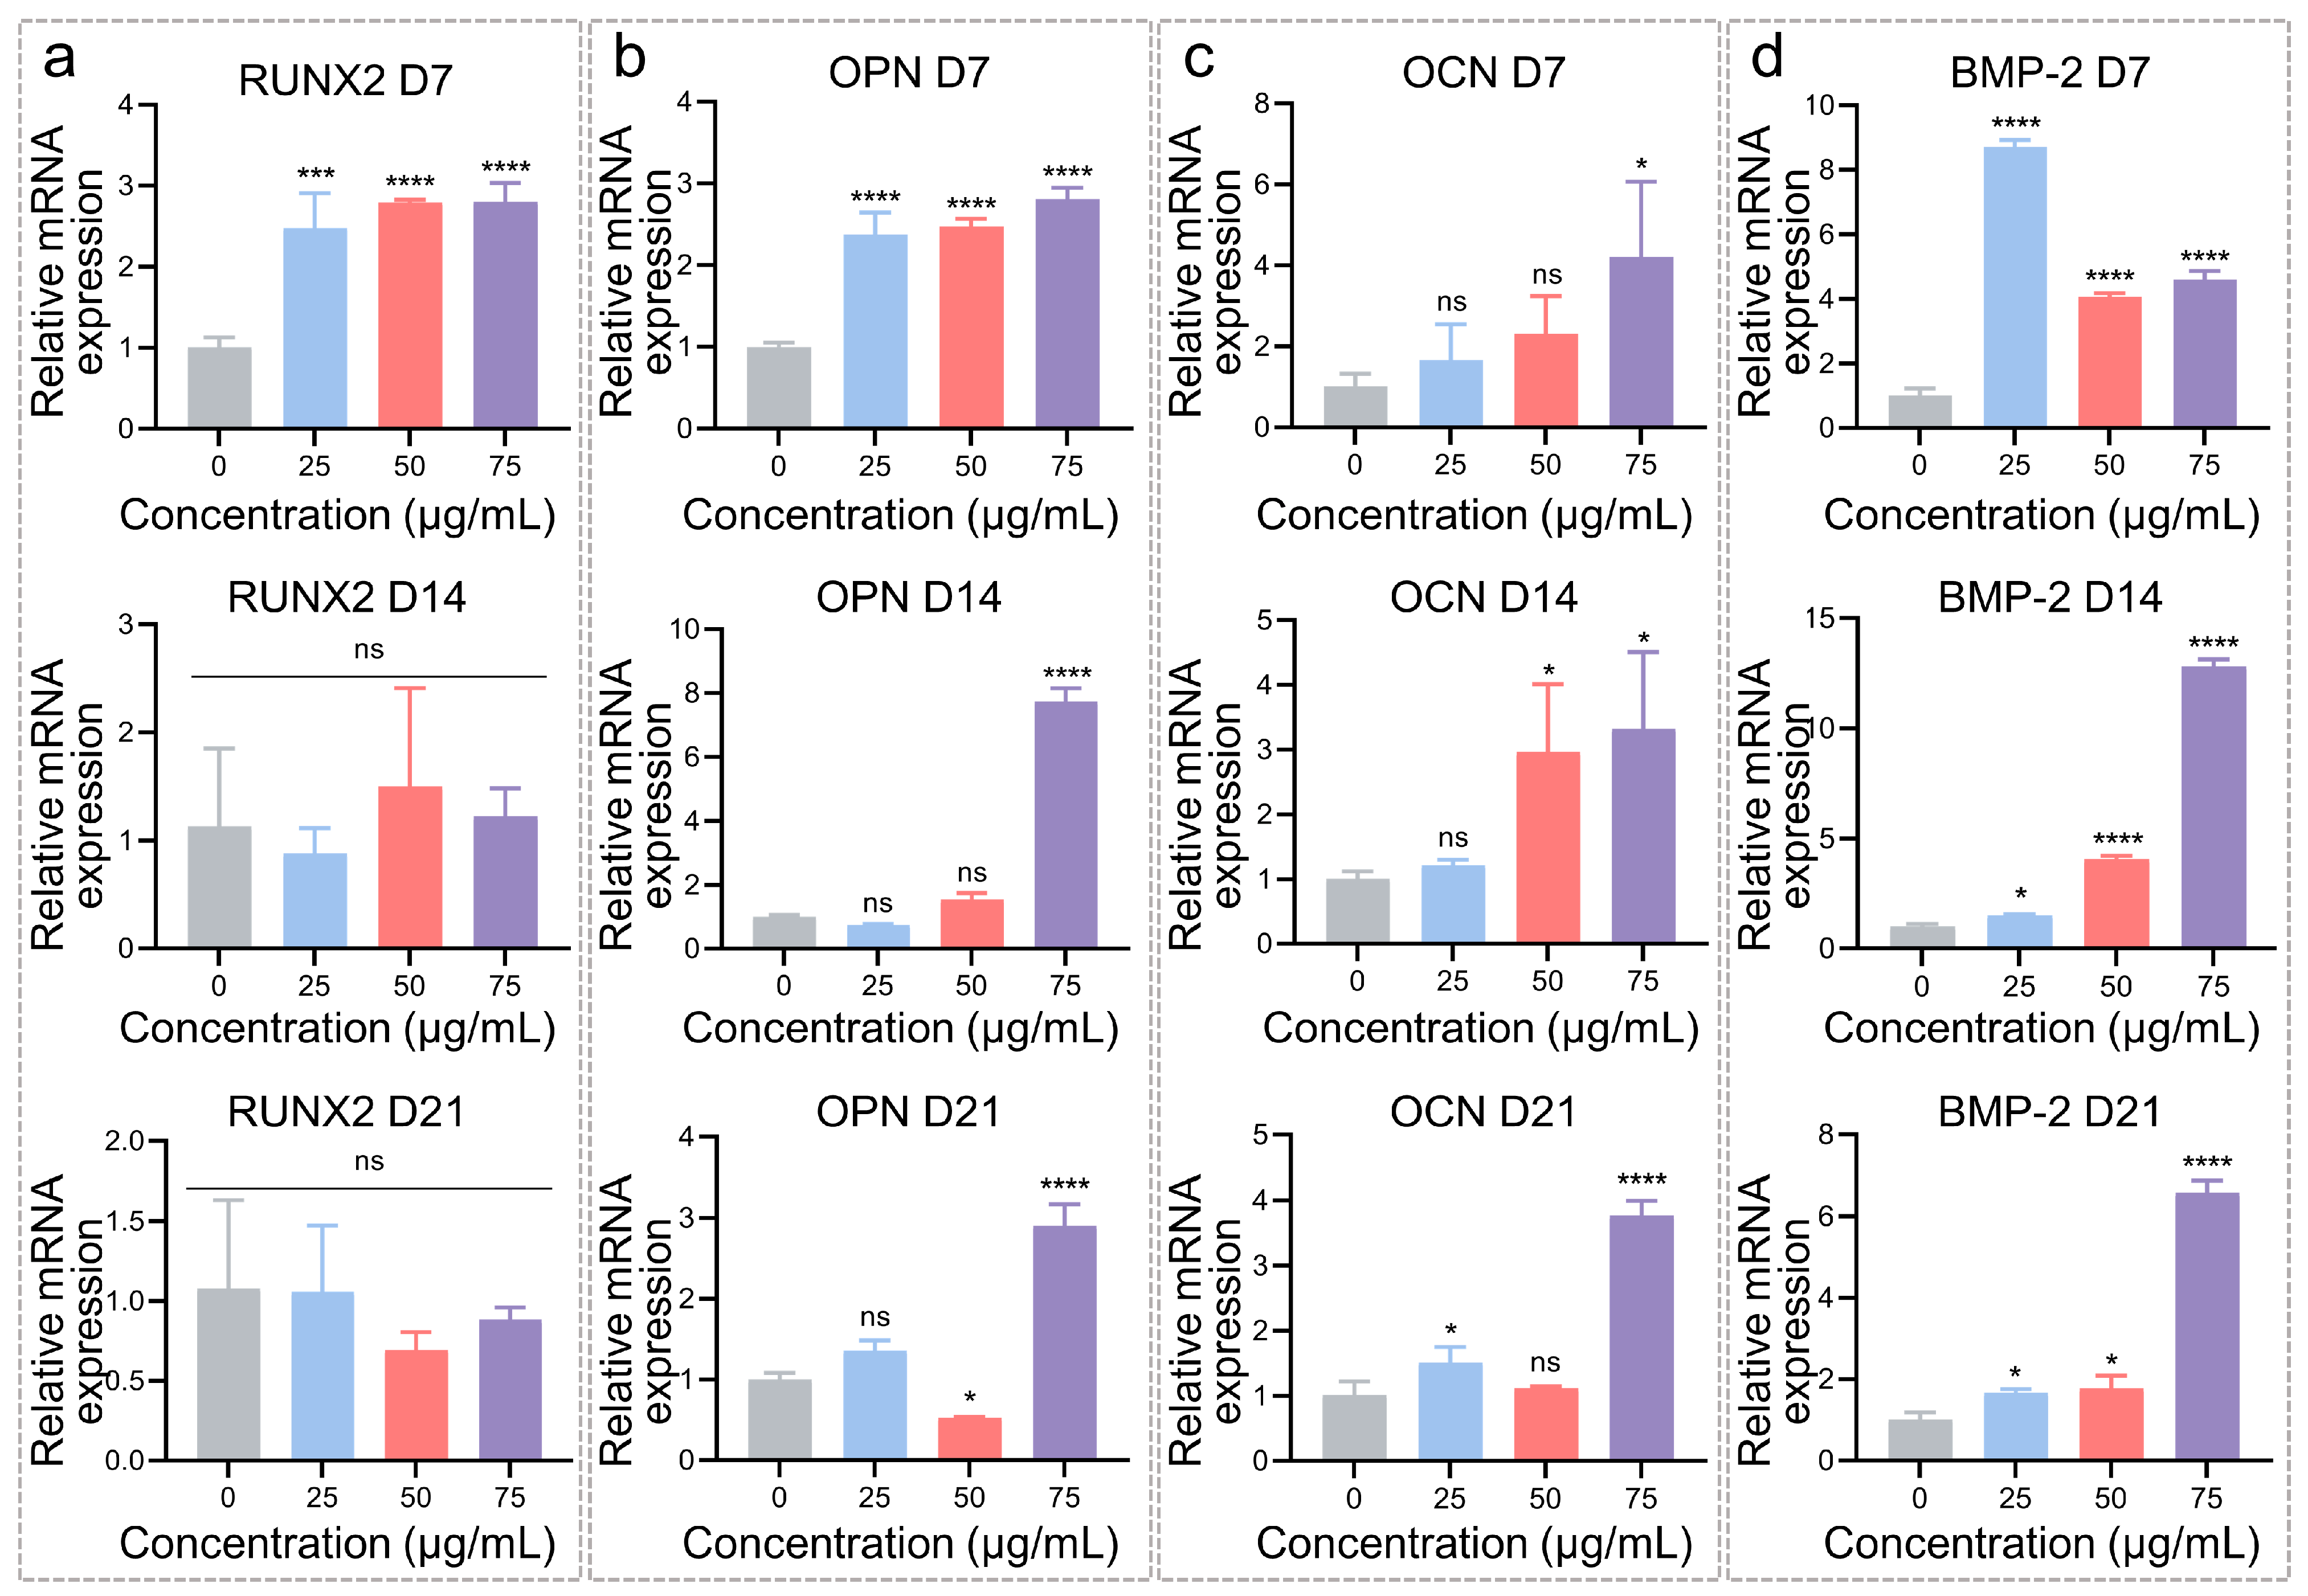
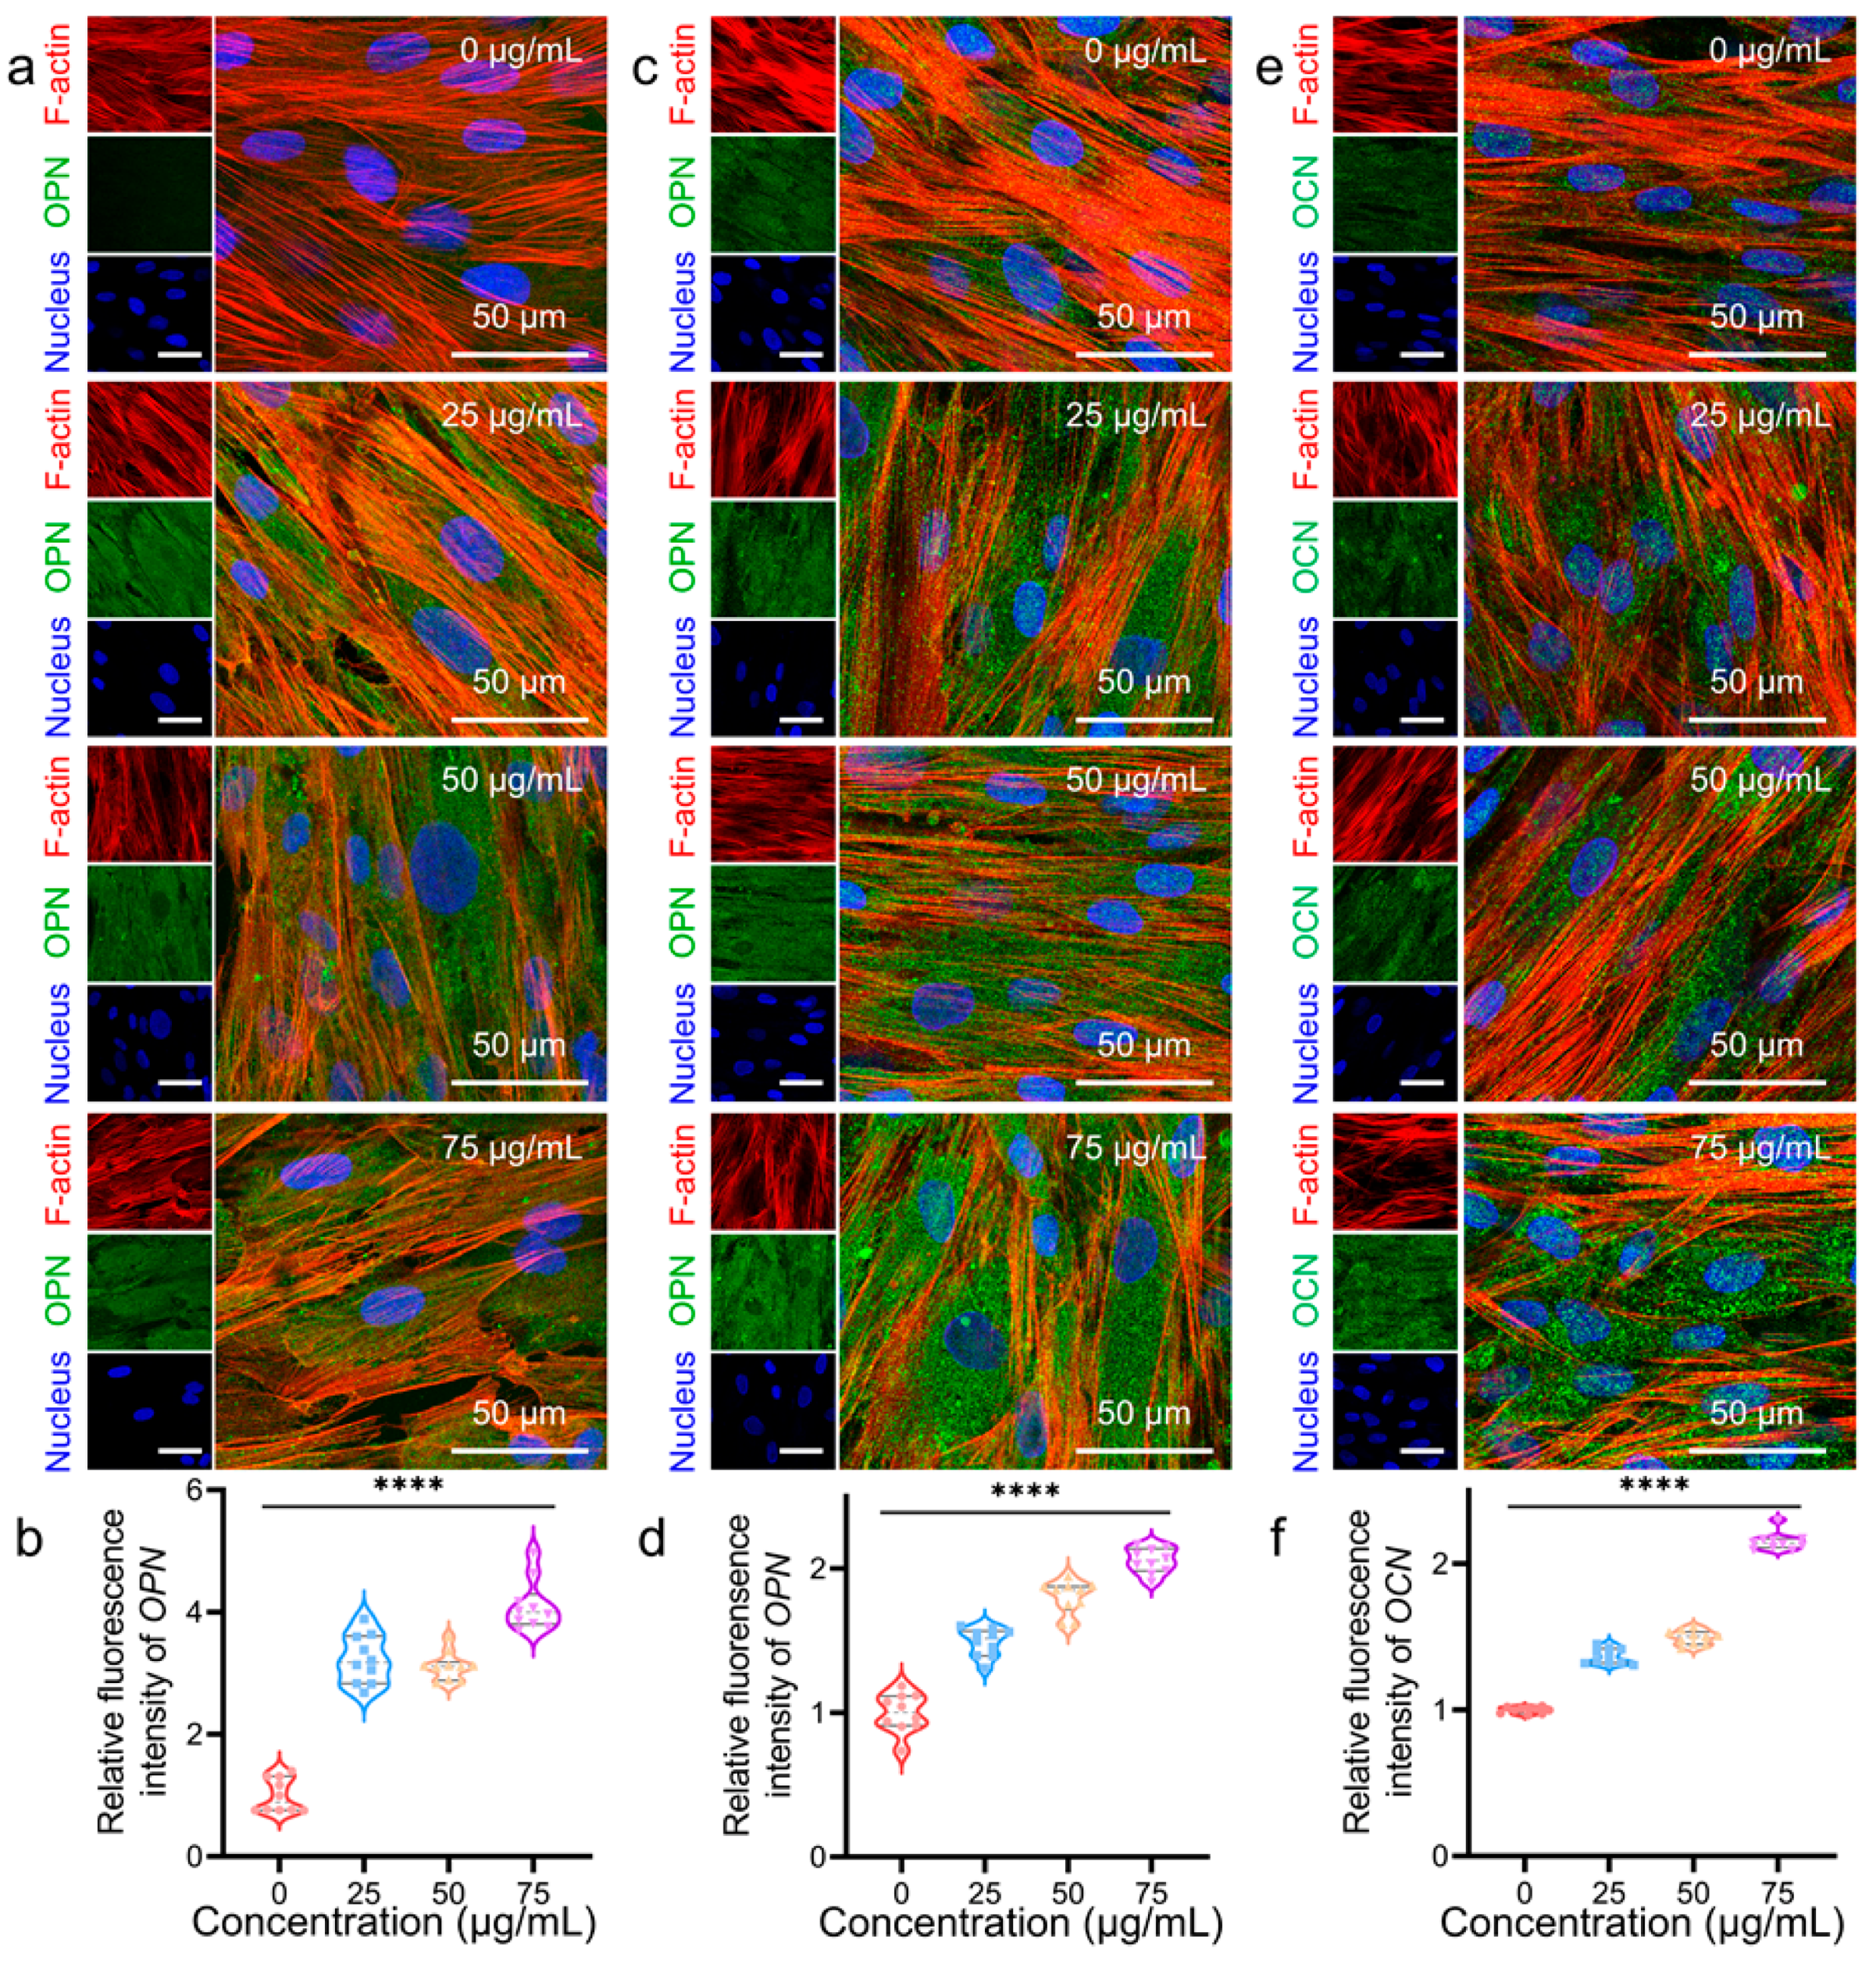
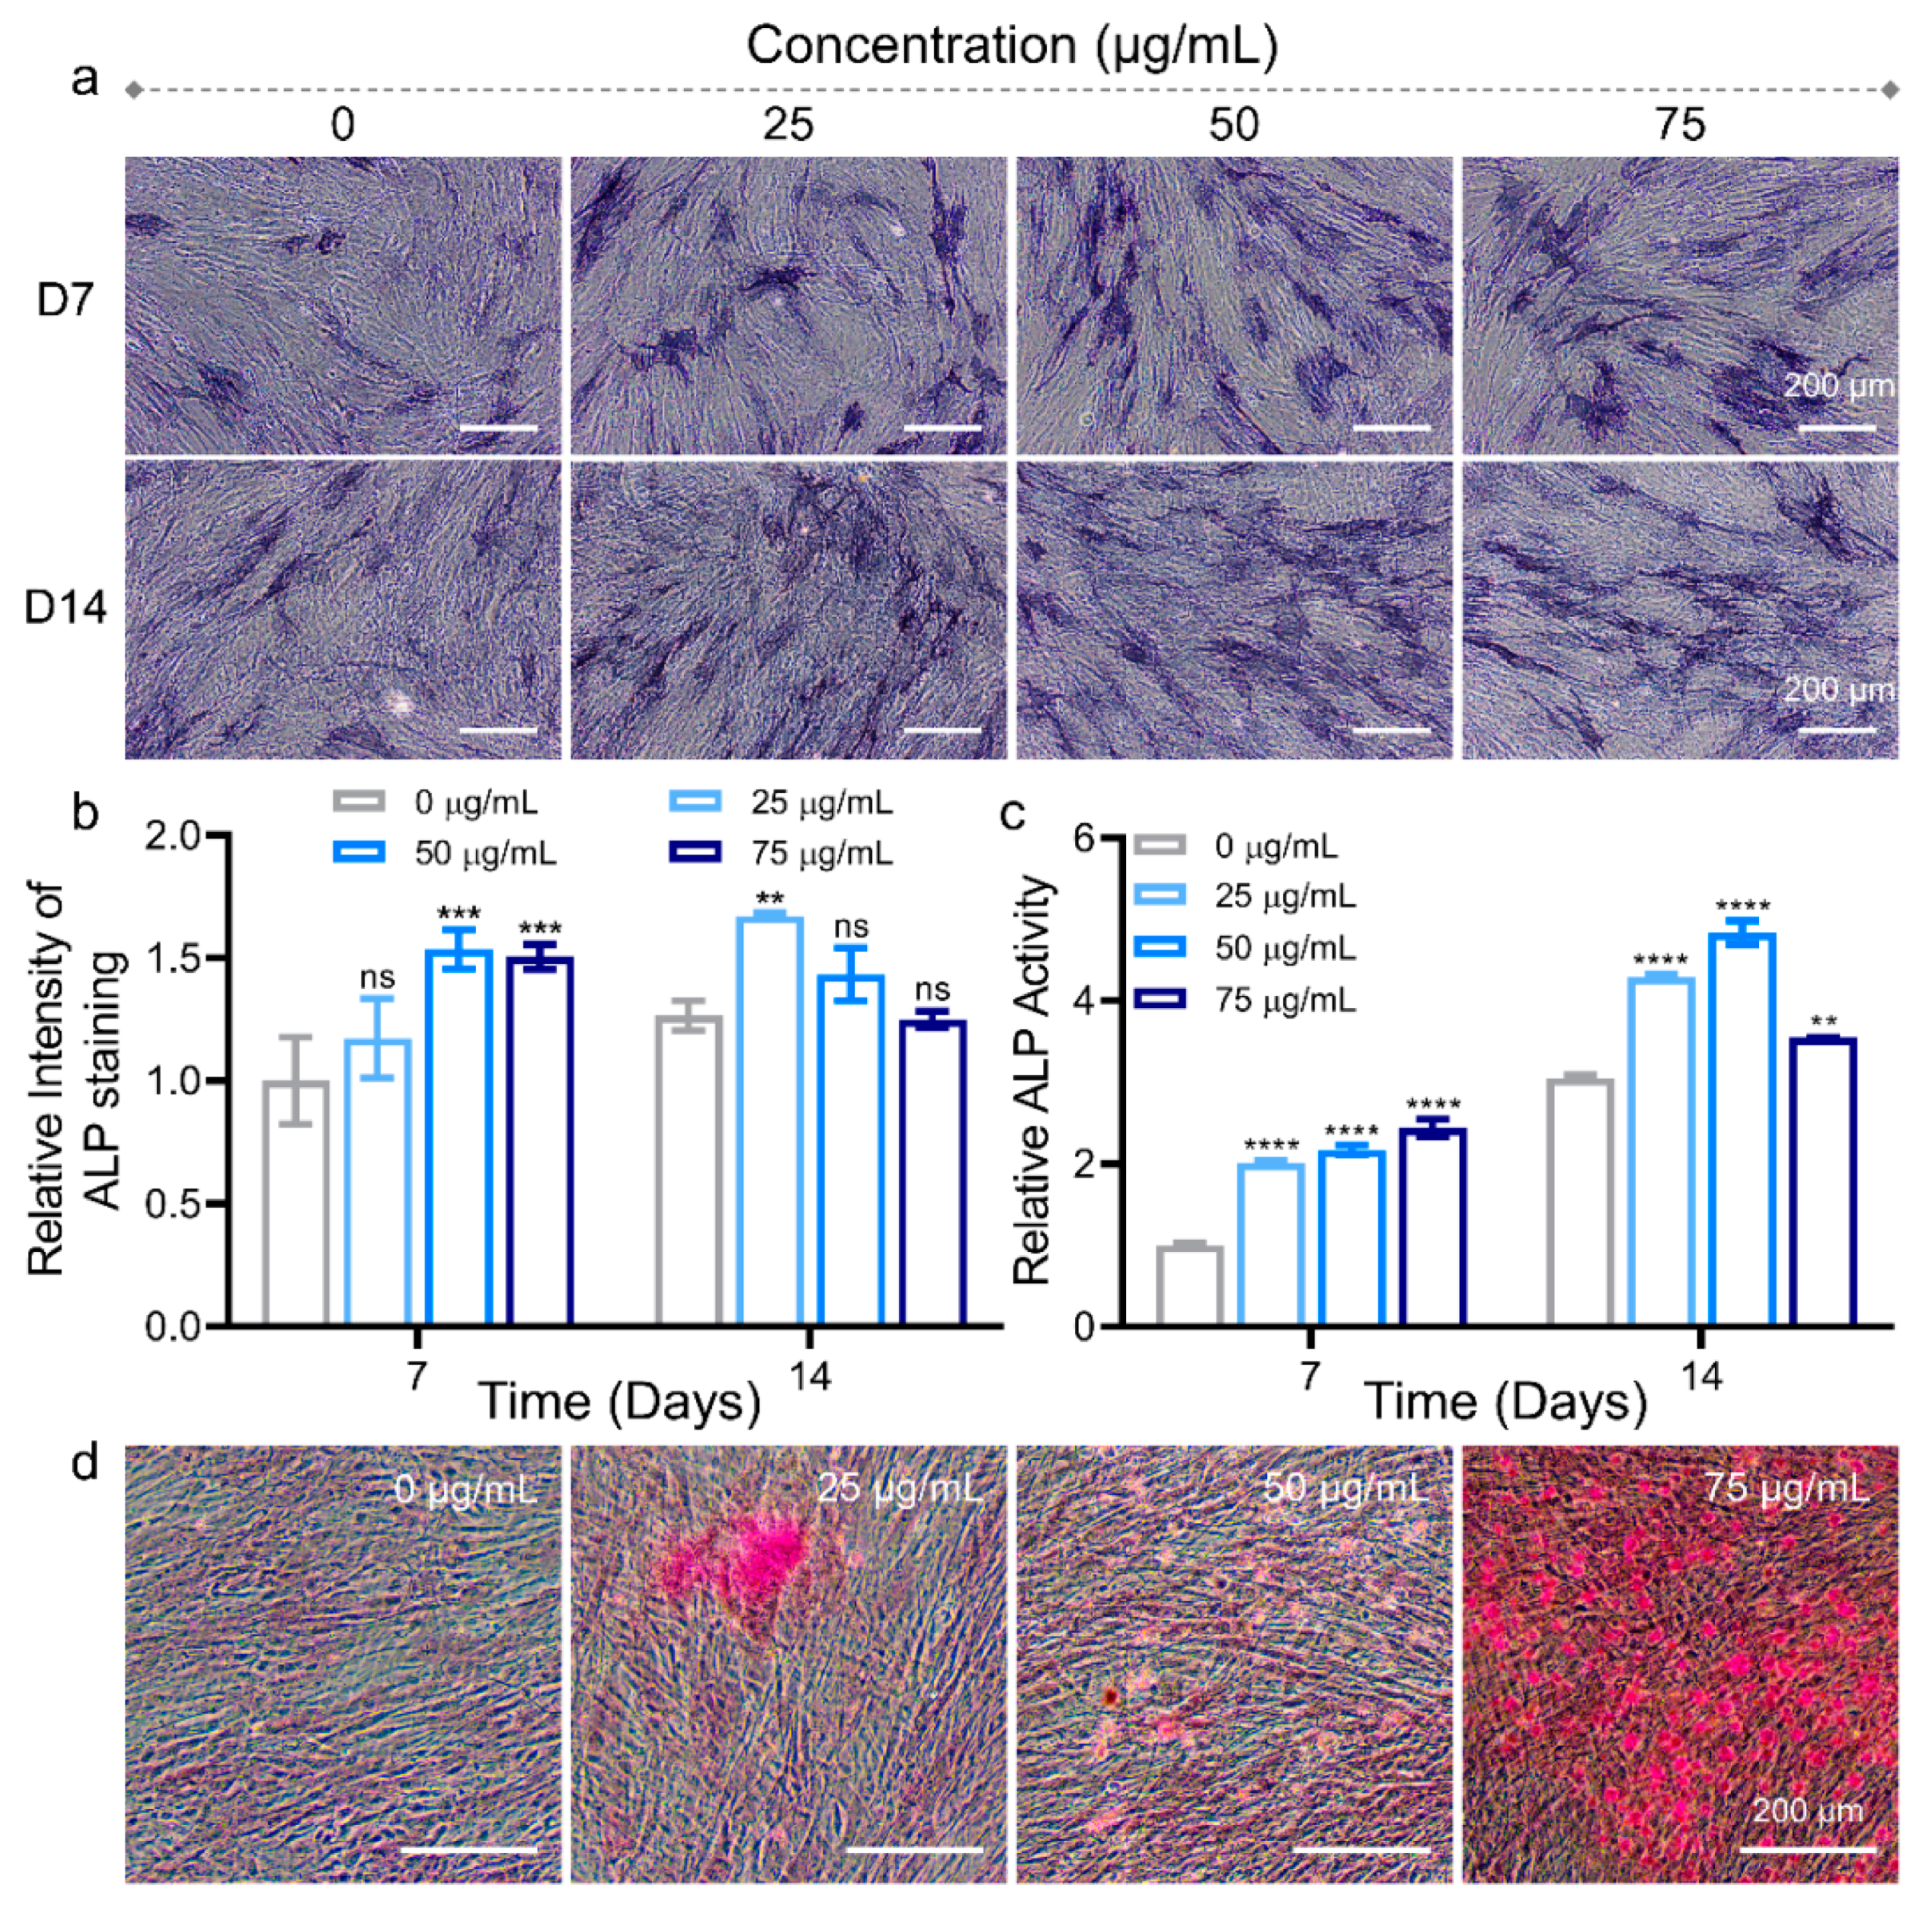
3.2. Osteogenic Differentiation Regulation of hADSCs with MNPs
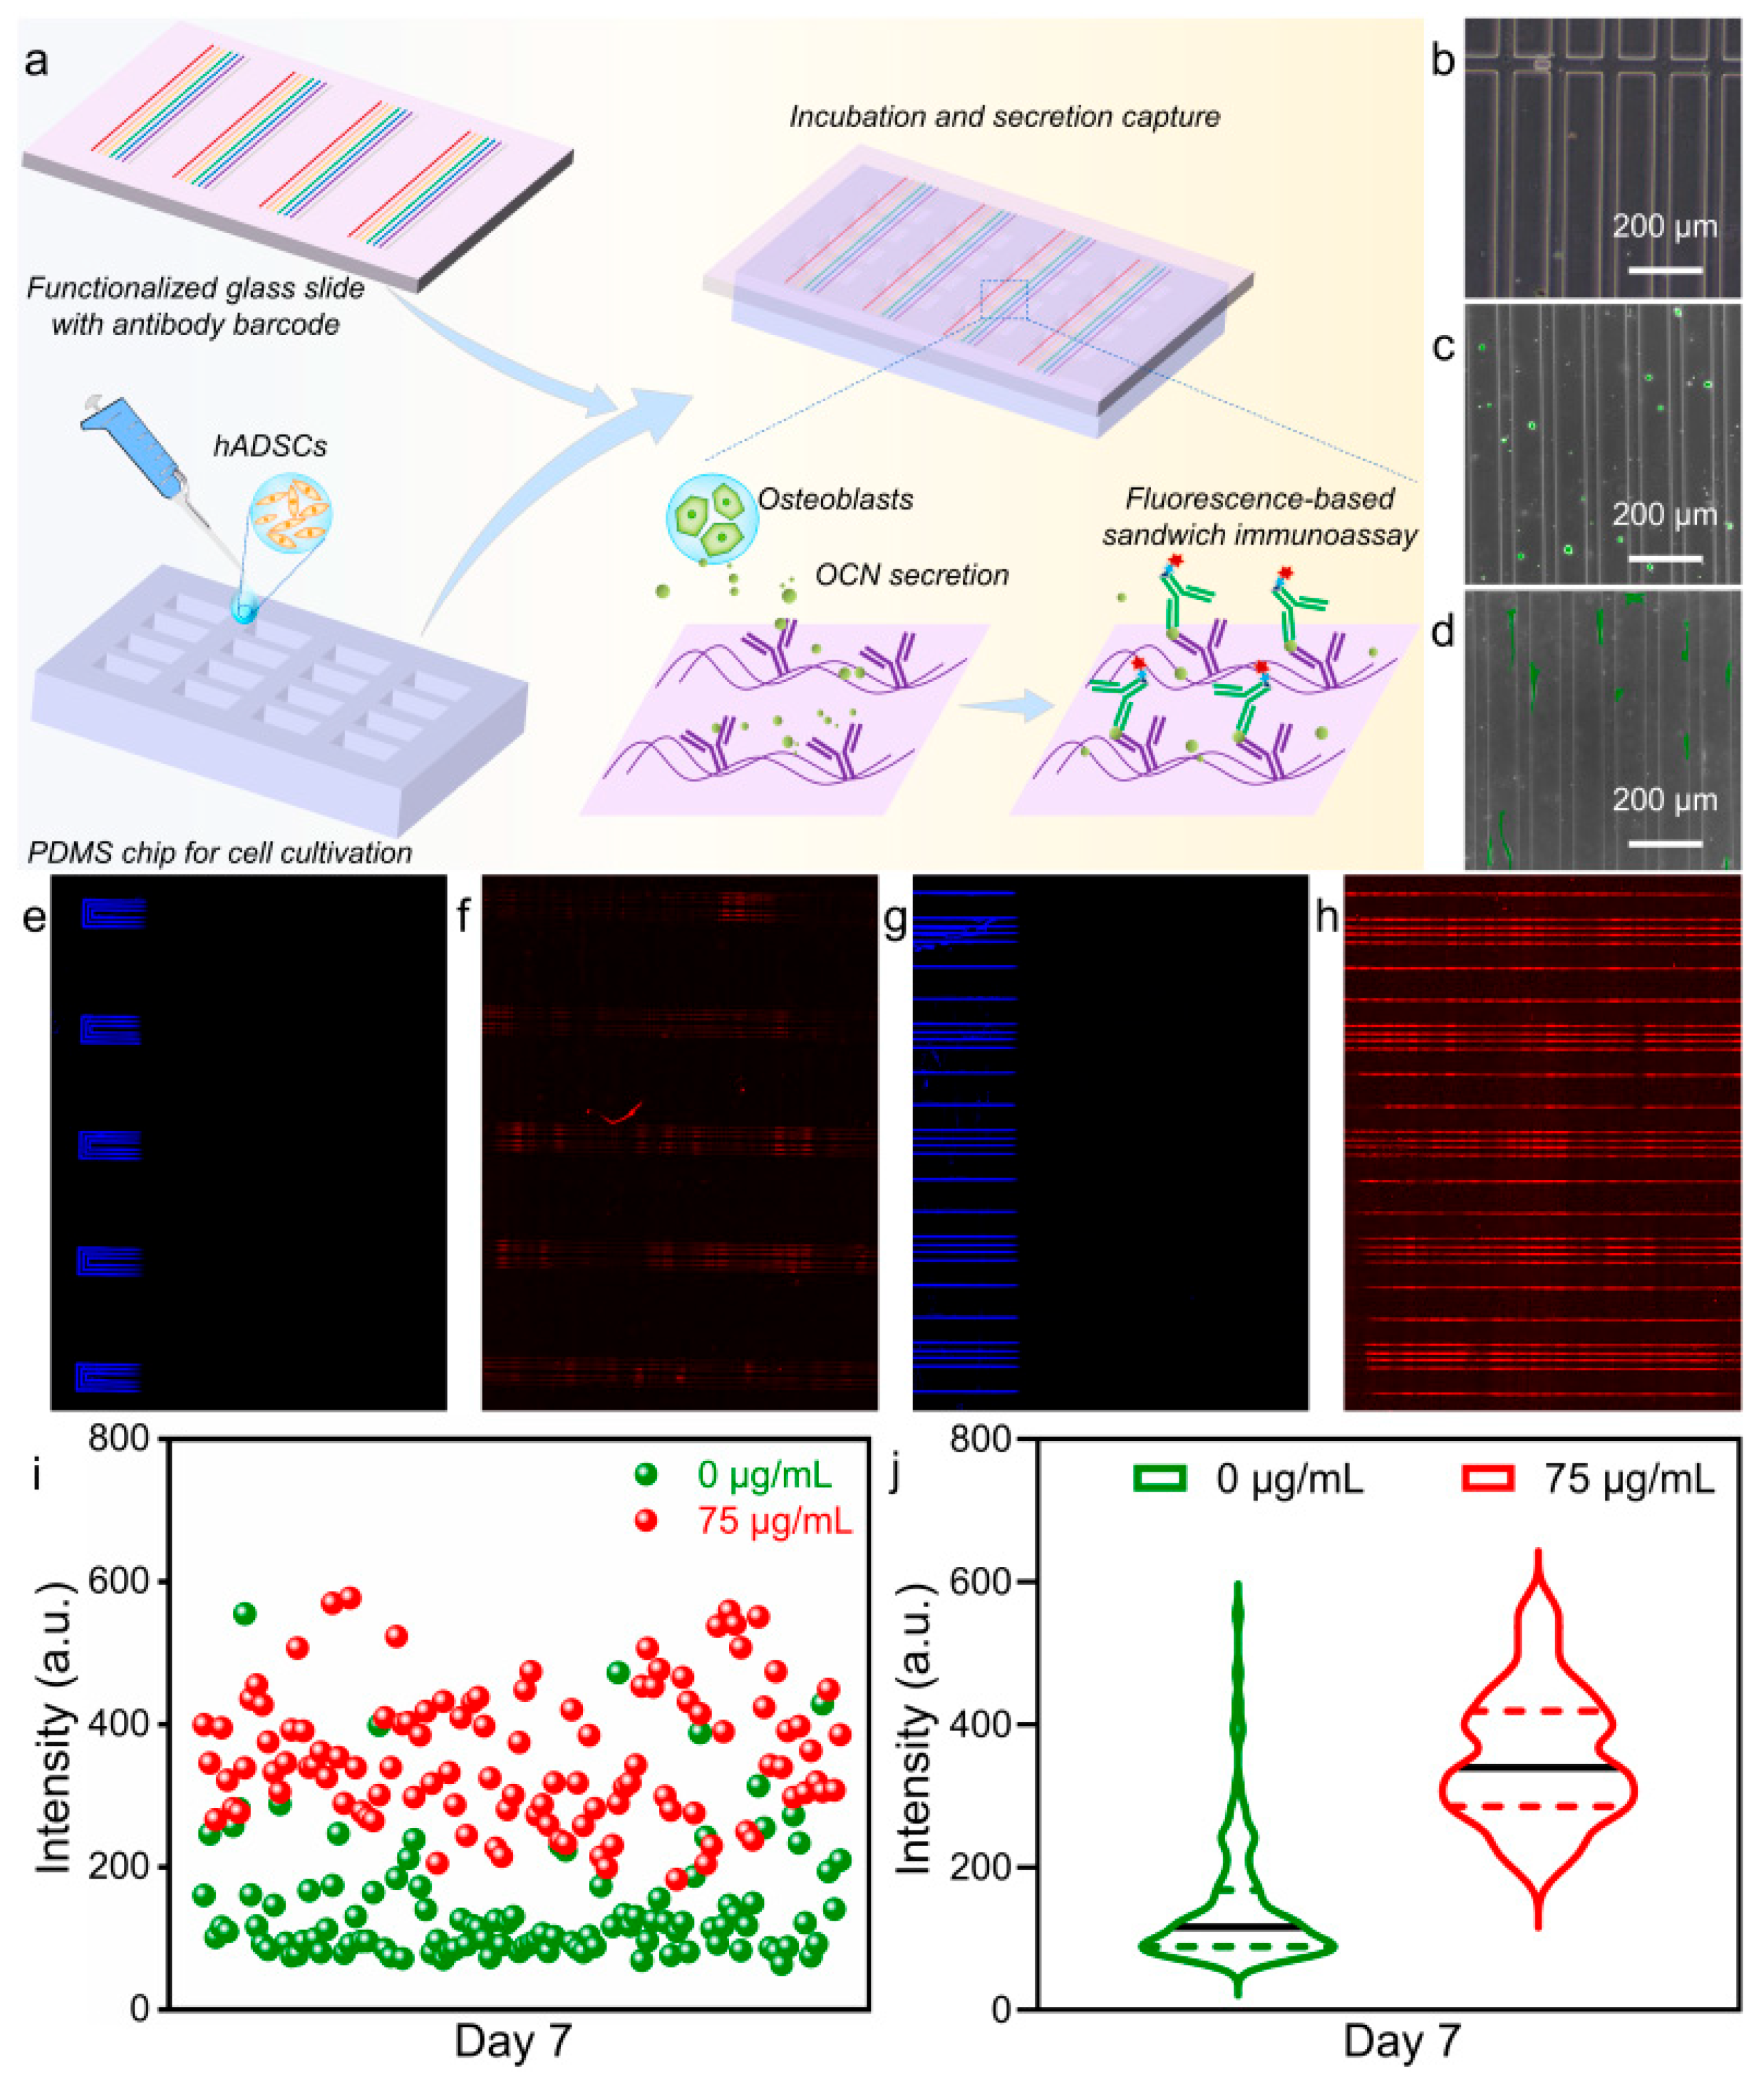
3.3. Microfluidic Detection of MNPs Effects on Osteogenic Differentiation of hADSCs
4. Conclusions
Supplementary Materials
Author Contributions
Funding
Institutional Review Board Statement
Informed Consent Statement
Data Availability Statement
Acknowledgments
Conflicts of Interest
References
- Zhang, X.; Koo, S.; Kim, J.H.; Huang, X.; Kong, N.; Zhang, L.; Zhou, J.; Xue, J.; Harris, M.B.; Tao, W.; et al. Nanoscale materials-based platforms for the treatment of bone-related diseases. Matter 2021, 4, 2727–2764. [Google Scholar]
- Koons, G.L.; Diba, M.; Mikos, A.G. Materials design for bone-tissue engineering. Nat. Rev. Mater. 2020, 5, 584–603. [Google Scholar] [CrossRef]
- Wan, X.; Liu, Z.; Li, L. Manipulation of Stem Cells Fates: The Master and Multifaceted Roles of Biophysical Cues of Biomaterials. Adv. Funct. Mater. 2021, 31, 2010626. [Google Scholar]
- Salhotra, A.; Shah, H.N.; Levi, B.; Longaker, M.T. Mechanisms of bone development and repair. Nat. Rev. Mol. Cell Biol. 2020, 21, 696–711. [Google Scholar] [CrossRef]
- Mendez-Ferrer, S.; Michurina, T.V.; Ferraro, F.; Mazloom, A.R.; Macarthur, B.D.; Lira, S.A.; Scadden, D.T.; Ma’ayan, A.; Enikolopov, G.N.; Frenette, P.S. Mesenchymal and haematopoietic stem cells form a unique bone marrow niche. Nature 2010, 466, 829–834. [Google Scholar] [PubMed] [Green Version]
- Schneider, S.; Unger, M.; van Griensven, M.; Balmayor, E.R. Adipose-derived mesenchymal stem cells from liposuction and resected fat are feasible sources for regenerative medicine. Eur. J. Med. Res. 2017, 22, 17. [Google Scholar] [CrossRef] [Green Version]
- Li, N.; Gao, J.; Mi, L.; Zhang, G.; Zhang, L.; Zhang, N.; Huo, R.; Hu, J.; Xu, K. Synovial membrane mesenchymal stem cells: Past life, current situation, and application in bone and joint diseases. Stem. Cell Res. Ther. 2020, 11, 381. [Google Scholar] [CrossRef]
- Testa, S.; Riera, C.S.; Fornetti, E.; Riccio, F.; Fuoco, C.; Bernardini, S.; Baldi, J.; Costantini, M.; Foddai, M.L.; Cannata, S.; et al. Skeletal Muscle-Derived Human Mesenchymal Stem Cells: Influence of Different Culture Conditions on Proliferative and Myogenic Capabilities. Front. Physiol. 2020, 11, 553198. [Google Scholar]
- Orbay, H.; Tobita, M.; Mizuno, H. Mesenchymal stem cells isolated from adipose and other tissues: Basic biological properties and clinical applications. Stem. Cells Int. 2012, 2012, 461718. [Google Scholar] [CrossRef] [Green Version]
- Feng, Z.; Su, X.; Wang, T.; Guo, S. Identification of Biomarkers That Modulate Osteogenic Differentiation in Mesenchymal Stem Cells Related to Inflammation and Immunity: A Bioinformatics-Based Comprehensive Study. Pharmaceuticals 2022, 15, 1094. [Google Scholar] [CrossRef]
- Mitxitorena, I.; Infante, A.; Gener, B.; Rodríguez, C.I. Suitability and limitations of mesenchymal stem cells to elucidate human bone illness. World J. Stem. Cells 2019, 26, 578–593. [Google Scholar] [CrossRef]
- Locke, M.; Windsor, J.; Dunbar, P.R. Human adipose-derived stem cells: Isolation, characterization and applications in surgery. ANZ J. Surg. 2009, 79, 235–244. [Google Scholar]
- Huang, Q.; Zou, Y.; Arno, M.C.; Chen, S.; Wang, T.; Gao, J.; Dove, A.P.; Du, J. Hydrogel scaffolds for differentiation of adipose-derived stem cells. Chem. Soc. Rev. 2017, 46, 6255–6275. [Google Scholar] [CrossRef]
- Mazzoni, E.; D’Agostino, A.; Iaquinta, M.R.; Bononi, I.; Trevisiol, L.; Rotondo, J.C.; Patergnani, S.; Giorgi, C.; Gunson, M.J.; Arnett, G.W.; et al. Hydroxylapatite-collagen hybrid scaffold induces human adipose-derived mesenchymal stem cells to osteogenic differentiation in vitro and bone regrowth in patients. Stem. Cells Transl. Med. 2020, 9, 377–388. [Google Scholar]
- Du, Z.; Feng, X.; Cao, G.; She, Z.; Tan, R.; Aifantis, K.E.; Zhang, R.; Li, X. The effect of carbon nanotubes on osteogenic functions of adipose-derived mesenchymal stem cells in vitro and bone formation in vivo compared with that of nano-hydroxyapatite and the possible mechanism. Bioact. Mater. 2021, 6, 333–345. [Google Scholar]
- Roopavath, U.K.; Soni, R.; Mahanta, U.; Deshpande, A.S.; Rath, S.N. 3D printable SiO2 nanoparticle ink for patient specific bone regeneration. RSC Adv. 2019, 9, 23832–23842. [Google Scholar] [CrossRef]
- Yu, M.; Du, Y.; Han, Y.; Lei, B. Biomimetic Elastomeric Bioactive Siloxane-Based Hybrid Nanofibrous Scaffolds with miRNA Activation: A Joint Physico-Chemical-Biological Strategy for Promoting Bone Regeneration. Adv. Funct. Mater. 2019, 30, 1906013. [Google Scholar] [CrossRef]
- Xia, H.; Dong, L.; Hao, M.; Wei, Y.; Duan, J.; Chen, X.; Yu, L.; Li, H.; Sang, Y.; Liu, H. Osteogenic Property Regulation of Stem Cells by a Hydroxyapatite 3D-Hybrid Scaffold With Cancellous Bone Structure. Front. Chem. 2021, 9, 798299. [Google Scholar] [CrossRef]
- Hao, M.; He, J.; Wang, C.; Wang, C.; Ma, B.; Zhang, S.; Duan, J.; Liu, F.; Zhang, Y.; Han, L.; et al. Effect of Hydroxyapatite Nanorods on the Fate of Human Adipose-Derived Stem Cells Assessed In Situ at the Single Cell Level with a High-Throughput, Real-Time Microfluidic Chip. Small 2019, 15, e1905001. [Google Scholar] [CrossRef]
- Zhao, H.; Wang, W.; Liu, F.; Kong, Y.; Chen, X.; Wang, L.; Ma, W.; Liu, C.; Sang, Y.; Wang, X.; et al. Electrochemical Insertion of Zinc Ions into Self-Organized Titanium Dioxide Nanotube Arrays to Achieve Strong Osseointegration with Titanium Implants. Adv. Mater. Interfaces 2022, 9, 2200312. [Google Scholar] [CrossRef]
- Tan, X.; Wu, J.; Wang, R.; Wang, C.; Sun, Y.; Wang, Z.; Ye, L. PgC3Mg metal-organic cages functionalized hydrogels with enhanced bioactive and ROS scavenging capabilities for accelerated bone regeneration. J. Mater. Chem. B 2022, 10, 5375–5387. [Google Scholar] [PubMed]
- Wang, S.J.; Jiang, D.; Zhang, Z.Z.; Chen, Y.R.; Yang, Z.D.; Zhang, J.Y.; Shi, J.; Wang, X.; Yu, J.K. Biomimetic Nanosilica-Collagen Scaffolds for In Situ Bone Regeneration: Toward a Cell-Free, One-Step Surgery. Adv. Mater. 2019, 31, e1904341. [Google Scholar] [CrossRef] [PubMed]
- Zhang, R.; He, Y.; Tao, B.; Wu, J.; Hu, X.; Li, X.; Xia, Z.; Cai, K. Multifunctional silicon calcium phosphate composite scaffolds promote stem cell recruitment and bone regeneration. J. Mater. Chem. B 2022, 10, 5218–5230. [Google Scholar] [PubMed]
- Chen, L.; Deng, C.; Li, J.; Yao, Q.; Chang, J.; Wang, L.; Wu, C. 3D printing of a lithium-calcium-silicate crystal bioscaffold with dual bioactivities for osteochondral interface reconstruction. Biomaterials 2019, 196, 138–150. [Google Scholar] [CrossRef] [PubMed]
- Cheng, Y.; Cheng, G.; Xie, C.; Yin, C.; Dong, X.; Li, Z.; Zhou, X.; Wang, Q.; Deng, H.; Li, Z. Biomimetic Silk Fibroin Hydrogels Strengthened by Silica Nanoparticles Distributed Nanofibers Facilitate Bone Repair. Adv. Healthc. Mater. 2021, 10, e2001646. [Google Scholar]
- Li, Z.; Xiang, S.; Lin, Z.; Li, E.N.; Yagi, H.; Cao, G.; Yocum, L.; Li, L.; Hao, T.; Bruce, K.K.; et al. Graphene oxide-functionalized nanocomposites promote osteogenesis of human mesenchymal stem cells via enhancement of BMP-SMAD1/5 signaling pathway. Biomaterials 2021, 277, 121082. [Google Scholar] [CrossRef]
- Slowing, I.I.; Trewyn, B.G.; Giri, S.; Lin, V.S.Y. Mesoporous Silica Nanoparticles for Drug Delivery and Biosensing Applications. Adv. Funct. Mater. 2007, 17, 1225–1236. [Google Scholar] [CrossRef]
- Vallet-Regi, M.; Schuth, F.; Lozano, D.; Colilla, M.; Manzano, M. Engineering mesoporous silica nanoparticles for drug delivery: Where are we after two decades? Chem. Soc. Rev. 2022, 51, 5365–5451. [Google Scholar] [CrossRef]
- Hao, M.; Xia, H.; Duan, J.; Zhou, H.; Zhang, G.; Li, D.; Chen, X.; Wang, W.; Sang, Y.; Feng, S.; et al. A Living Material Constructed from Stem Cells for Tumor-Tropic Oncotherapy with Real-Time Imaging. Adv. Funct. Mater. 2022, 32, 2201013. [Google Scholar] [CrossRef]
- Zhang, S.; Ma, B.; Liu, F.; Duan, J.; Wang, S.; Qiu, J.; Li, D.; Sang, Y.; Liu, C.; Liu, D.; et al. Polylactic Acid Nanopillar Array-Driven Osteogenic Differentiation of Human Adipose-Derived Stem Cells Determined by Pillar Diameter. Nano Lett. 2018, 18, 2243–2253. [Google Scholar] [CrossRef]
- Chen, Z.; Chen, J.J.; Fan, R. Single-Cell Protein Secretion Detection and Profiling. Annu. Rev. Anal Chem. 2019, 12, 431–449. [Google Scholar]
- Li, B.; Chen, X.; Qiu, W.; Zhao, R.; Duan, J.; Zhang, S.; Pan, Z.; Zhao, S.; Guo, Q.; Qi, Y.; et al. Synchronous Disintegration of Ferroptosis Defense Axis via Engineered Exosome-Conjugated Magnetic Nanoparticles for Glioblastoma Therapy. Adv. Sci. 2022, 9, e2105451. [Google Scholar] [CrossRef]
- Park, J.; An, K.; Hwang, Y.; Park, J.G.; Noh, H.J.; Kim, J.Y.; Park, J.H.; Hwang, N.M.; Hyeon, T. Ultra-large-scale syntheses of monodisperse nanocrystals. Nat. Mater. 2004, 3, 891–895. [Google Scholar]
- Kadzik, R.S.; Homa, K.E.; Kovar, D.R. F-Actin Cytoskeleton Network Self-Organization Through Competition and Cooperation. Annu. Rev. Cell Dev. Biol. 2020, 36, 35–60. [Google Scholar] [CrossRef]
- Liu, L.; Li, Y.; Peng, H.; Liu, R.; Ji, W.; Shi, Z.; Shen, J.; Ma, G.; Zhang, X. Targeted exosome coating gene-chem nanocomplex as “nanoscavenger” for clearing α-synuclein and immune activation of Parkinson’s disease. Sci. Adv. 2020, 6, eaba3967. [Google Scholar] [CrossRef]
- Singh, A.; Gill, G.; Kaur, H.; Amhmed, M.; Jakhu, H. Role of osteopontin in bone remodeling and orthodontic tooth movement: A review. Prog. Orthod. 2018, 19, 18. [Google Scholar] [CrossRef]
- Neve, A.; Corrado, A.; Cantatore, F.P. Osteocalcin: Skeletal and extra-skeletal effects. J. Cell Physiol. 2013, 228, 1149–1153. [Google Scholar] [CrossRef]
- Vimalraj, S. Alkaline phosphatase: Structure, expression and its function in bone mineralization. Gene 2020, 754, 144855. [Google Scholar] [CrossRef]
- Hosseinpour, S.; Gomez-Cerezo, M.N.; Cao, Y.; Lei, C.; Dai, H.; Walsh, L.J.; Ivanovski, S.; Xu, C. A Comparative Study of Mesoporous Silica and Mesoporous Bioactive Glass Nanoparticles as Non-Viral MicroRNA Vectors for Osteogenesis. Pharmaceutics 2022, 14, 2302. [Google Scholar]
- Meesuk, L.; Suwanprateeb, J.; Thammarakcharoen, F.; Tantrawatpan, C.; Kheolamai, P.; Palang, I.; Tantikanlayaporn, D.; Manochantr, S. Osteogenic differentiation and proliferation potentials of human bone marrow and umbilical cord-derived mesenchymal stem cells on the 3D-printed hydroxyapatite scaffolds. Sci. Rep. 2022, 12, 19509. [Google Scholar]
- Sreeja, S.; Muraleedharan, C.V.; Varma, P.R.H.; Sailaja, G.S. Surface-transformed osteoinductive polyethylene terephthalate scaffold as a dual system for bone tissue regeneration with localized antibiotic delivery. Mater. Sci. Eng. C Mater. Biol. Appl. 2020, 109, 110491. [Google Scholar] [CrossRef] [PubMed]
- Rutkovskiy, A.; Stenslokken, K.O.; Vaage, I.J. Osteoblast Differentiation at a Glance. Med. Sci. Monit. Basic Res. 2016, 22, 95–106. [Google Scholar] [CrossRef] [PubMed] [Green Version]
- Calderon, P.d.S.; Rocha, F.R.G.; Xia, X.; Camargo, S.E.A.; Pascoal, A.L.d.B.; Chiu, C.-W.; Ren, F.; Ghivizzani, S.; Esquivel-Upshaw, J.F. Effect of Silicon Carbide Coating on Osteoblast Mineralization of Anodized Titanium Surfaces. J. Funct. Biomater. 2022, 13, 247. [Google Scholar] [CrossRef] [PubMed]


Publisher’s Note: MDPI stays neutral with regard to jurisdictional claims in published maps and institutional affiliations. |
© 2022 by the authors. Licensee MDPI, Basel, Switzerland. This article is an open access article distributed under the terms and conditions of the Creative Commons Attribution (CC BY) license (https://creativecommons.org/licenses/by/4.0/).
Share and Cite
Chen, X.; Wang, C.; Hao, M.; Zhao, H.; Xia, H.; Yu, L.; Li, D.; Qiu, J.; Li, H.; Han, L.; et al. Mesoporous Silica Promotes Osteogenesis of Human Adipose-Derived Stem Cells Identified by a High-Throughput Microfluidic Chip Assay. Pharmaceutics 2022, 14, 2730. https://doi.org/10.3390/pharmaceutics14122730
Chen X, Wang C, Hao M, Zhao H, Xia H, Yu L, Li D, Qiu J, Li H, Han L, et al. Mesoporous Silica Promotes Osteogenesis of Human Adipose-Derived Stem Cells Identified by a High-Throughput Microfluidic Chip Assay. Pharmaceutics. 2022; 14(12):2730. https://doi.org/10.3390/pharmaceutics14122730
Chicago/Turabian StyleChen, Xin, Chao Wang, Min Hao, Hang Zhao, He Xia, Liyang Yu, Dong Li, Jichuan Qiu, Haijun Li, Lin Han, and et al. 2022. "Mesoporous Silica Promotes Osteogenesis of Human Adipose-Derived Stem Cells Identified by a High-Throughput Microfluidic Chip Assay" Pharmaceutics 14, no. 12: 2730. https://doi.org/10.3390/pharmaceutics14122730