
Determination of the Pharmacokinetics and Pharmacodynamics of Isoniazid, Rifampicin, Pyrazinamide and Ethambutol in a Cross-Over Cynomolgus Macaque Model of Mycobacterium tuberculosis Infection
 , , , ,
Abstract
:1. Introduction
2. Materials and Methods
2.1. Experimental Animals
2.2. Animal Study Designs
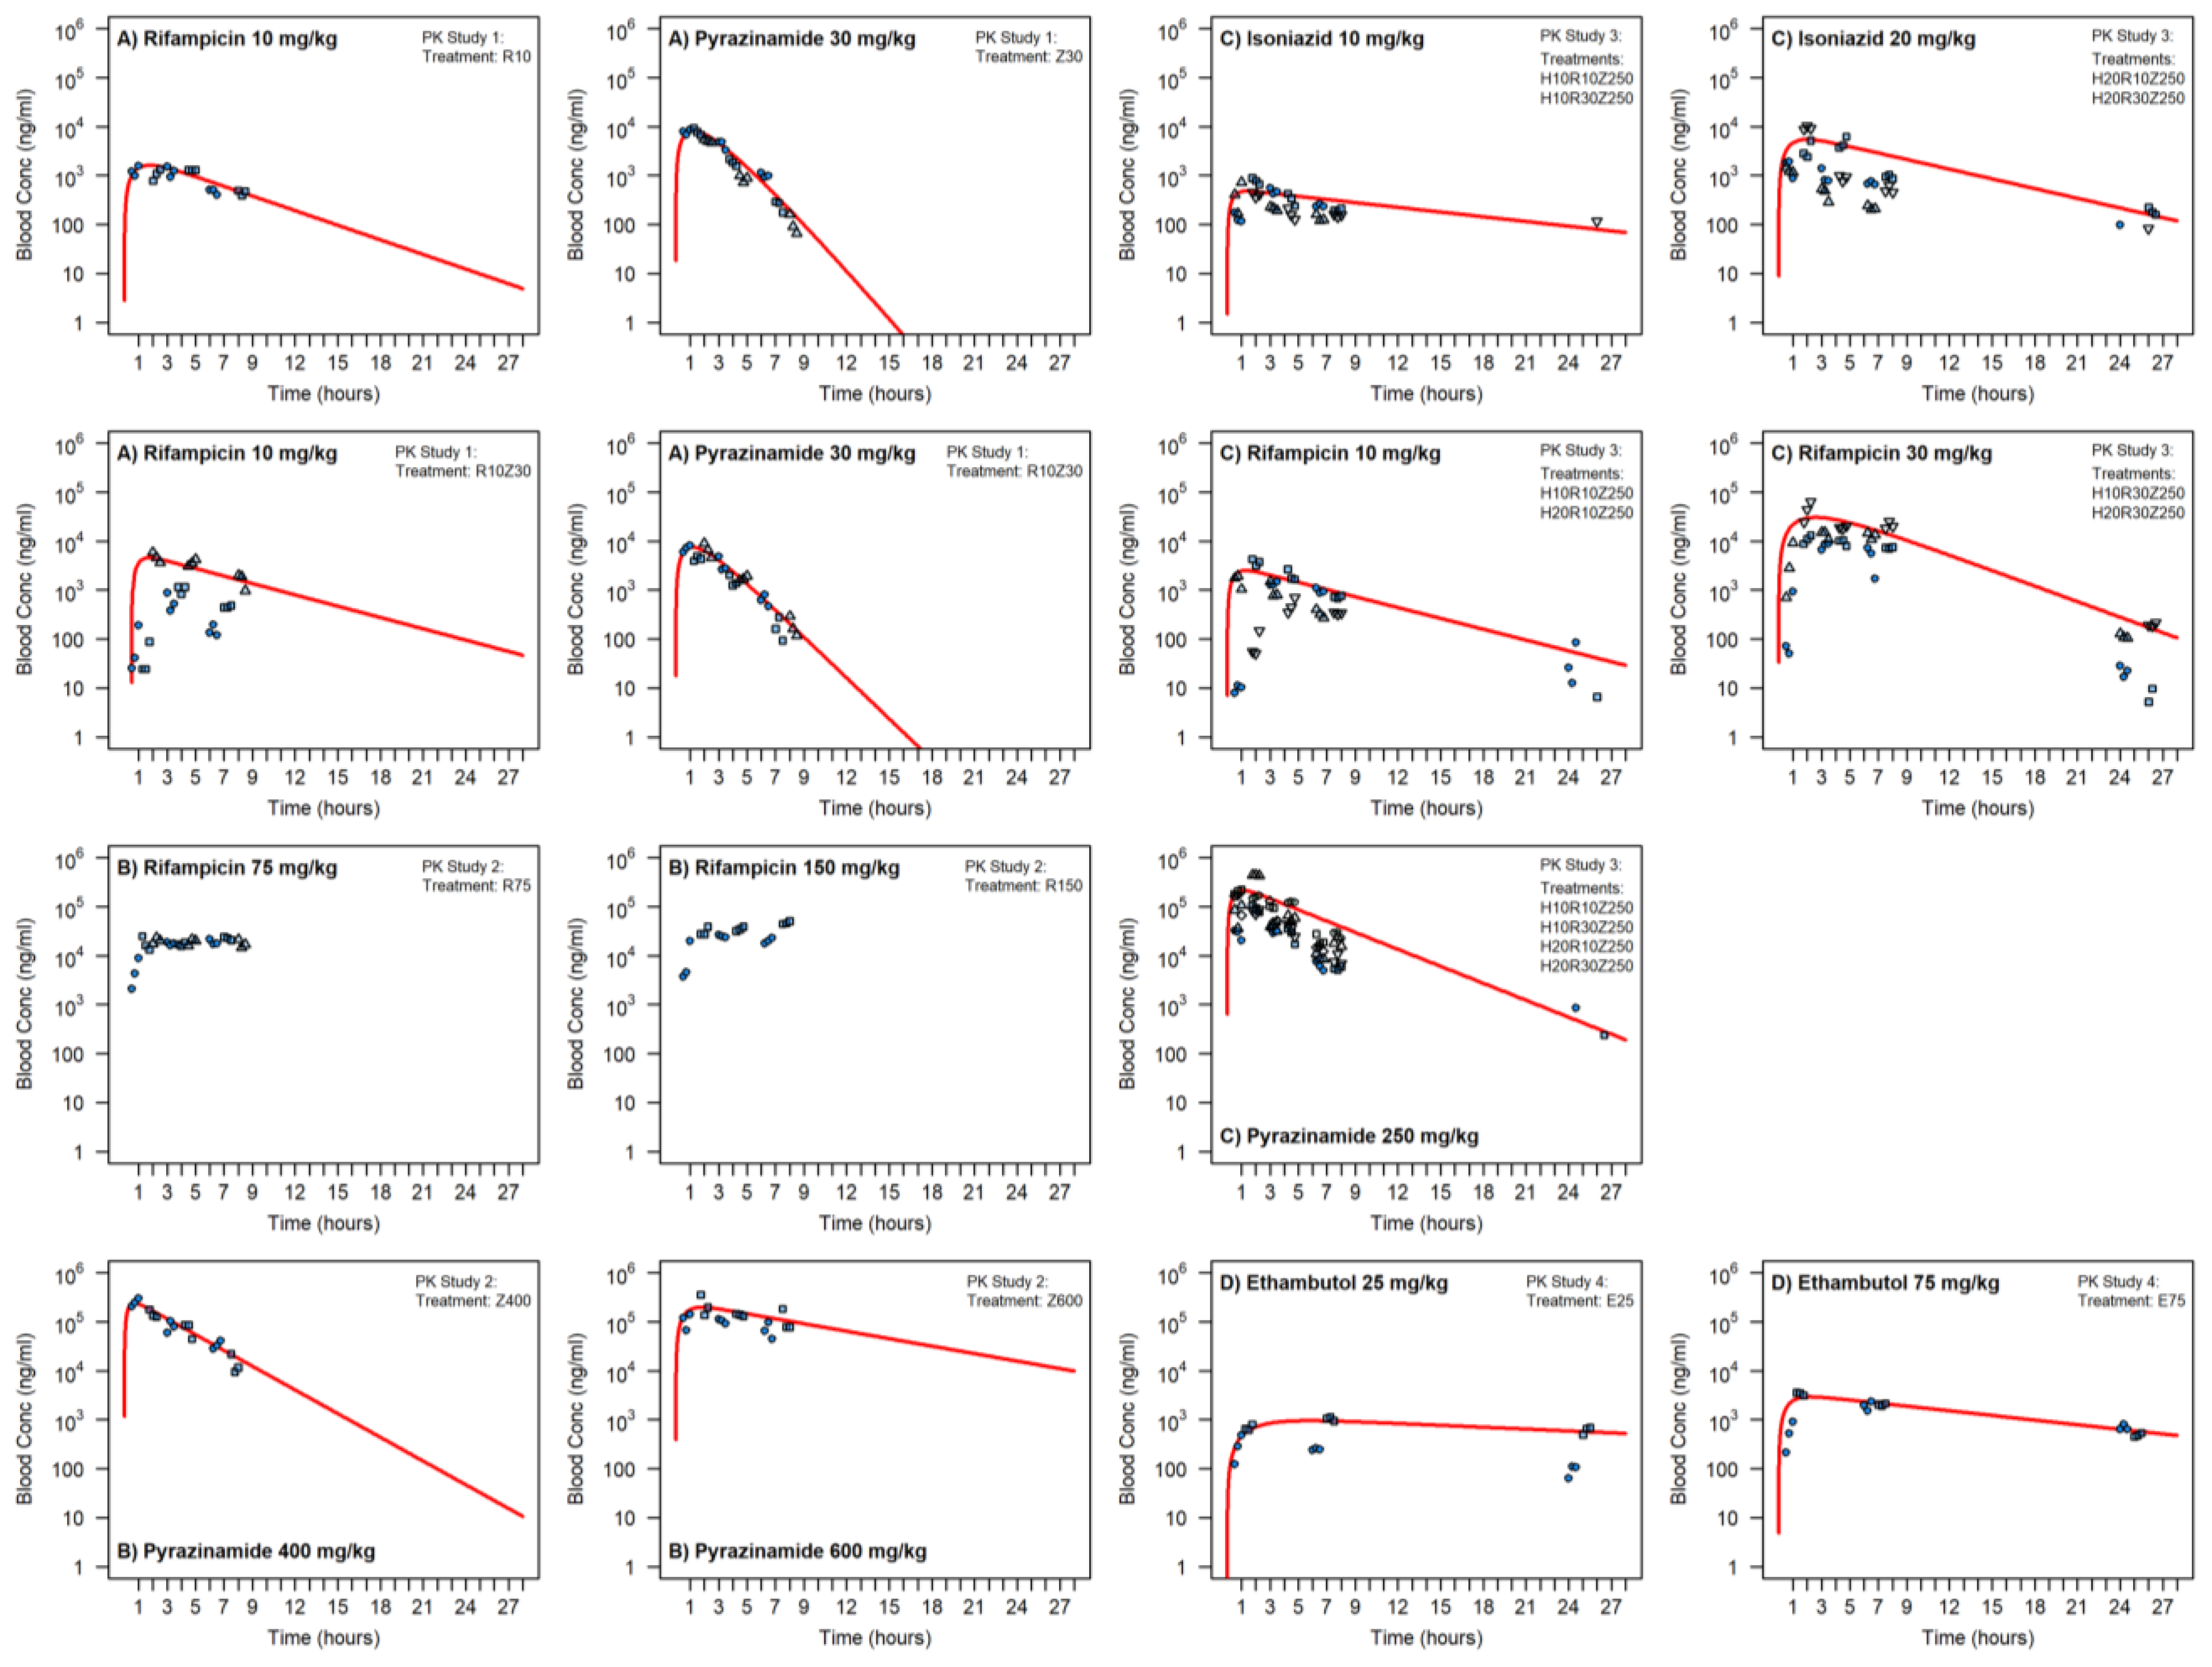
Satellite Pharmacokinetic Studies
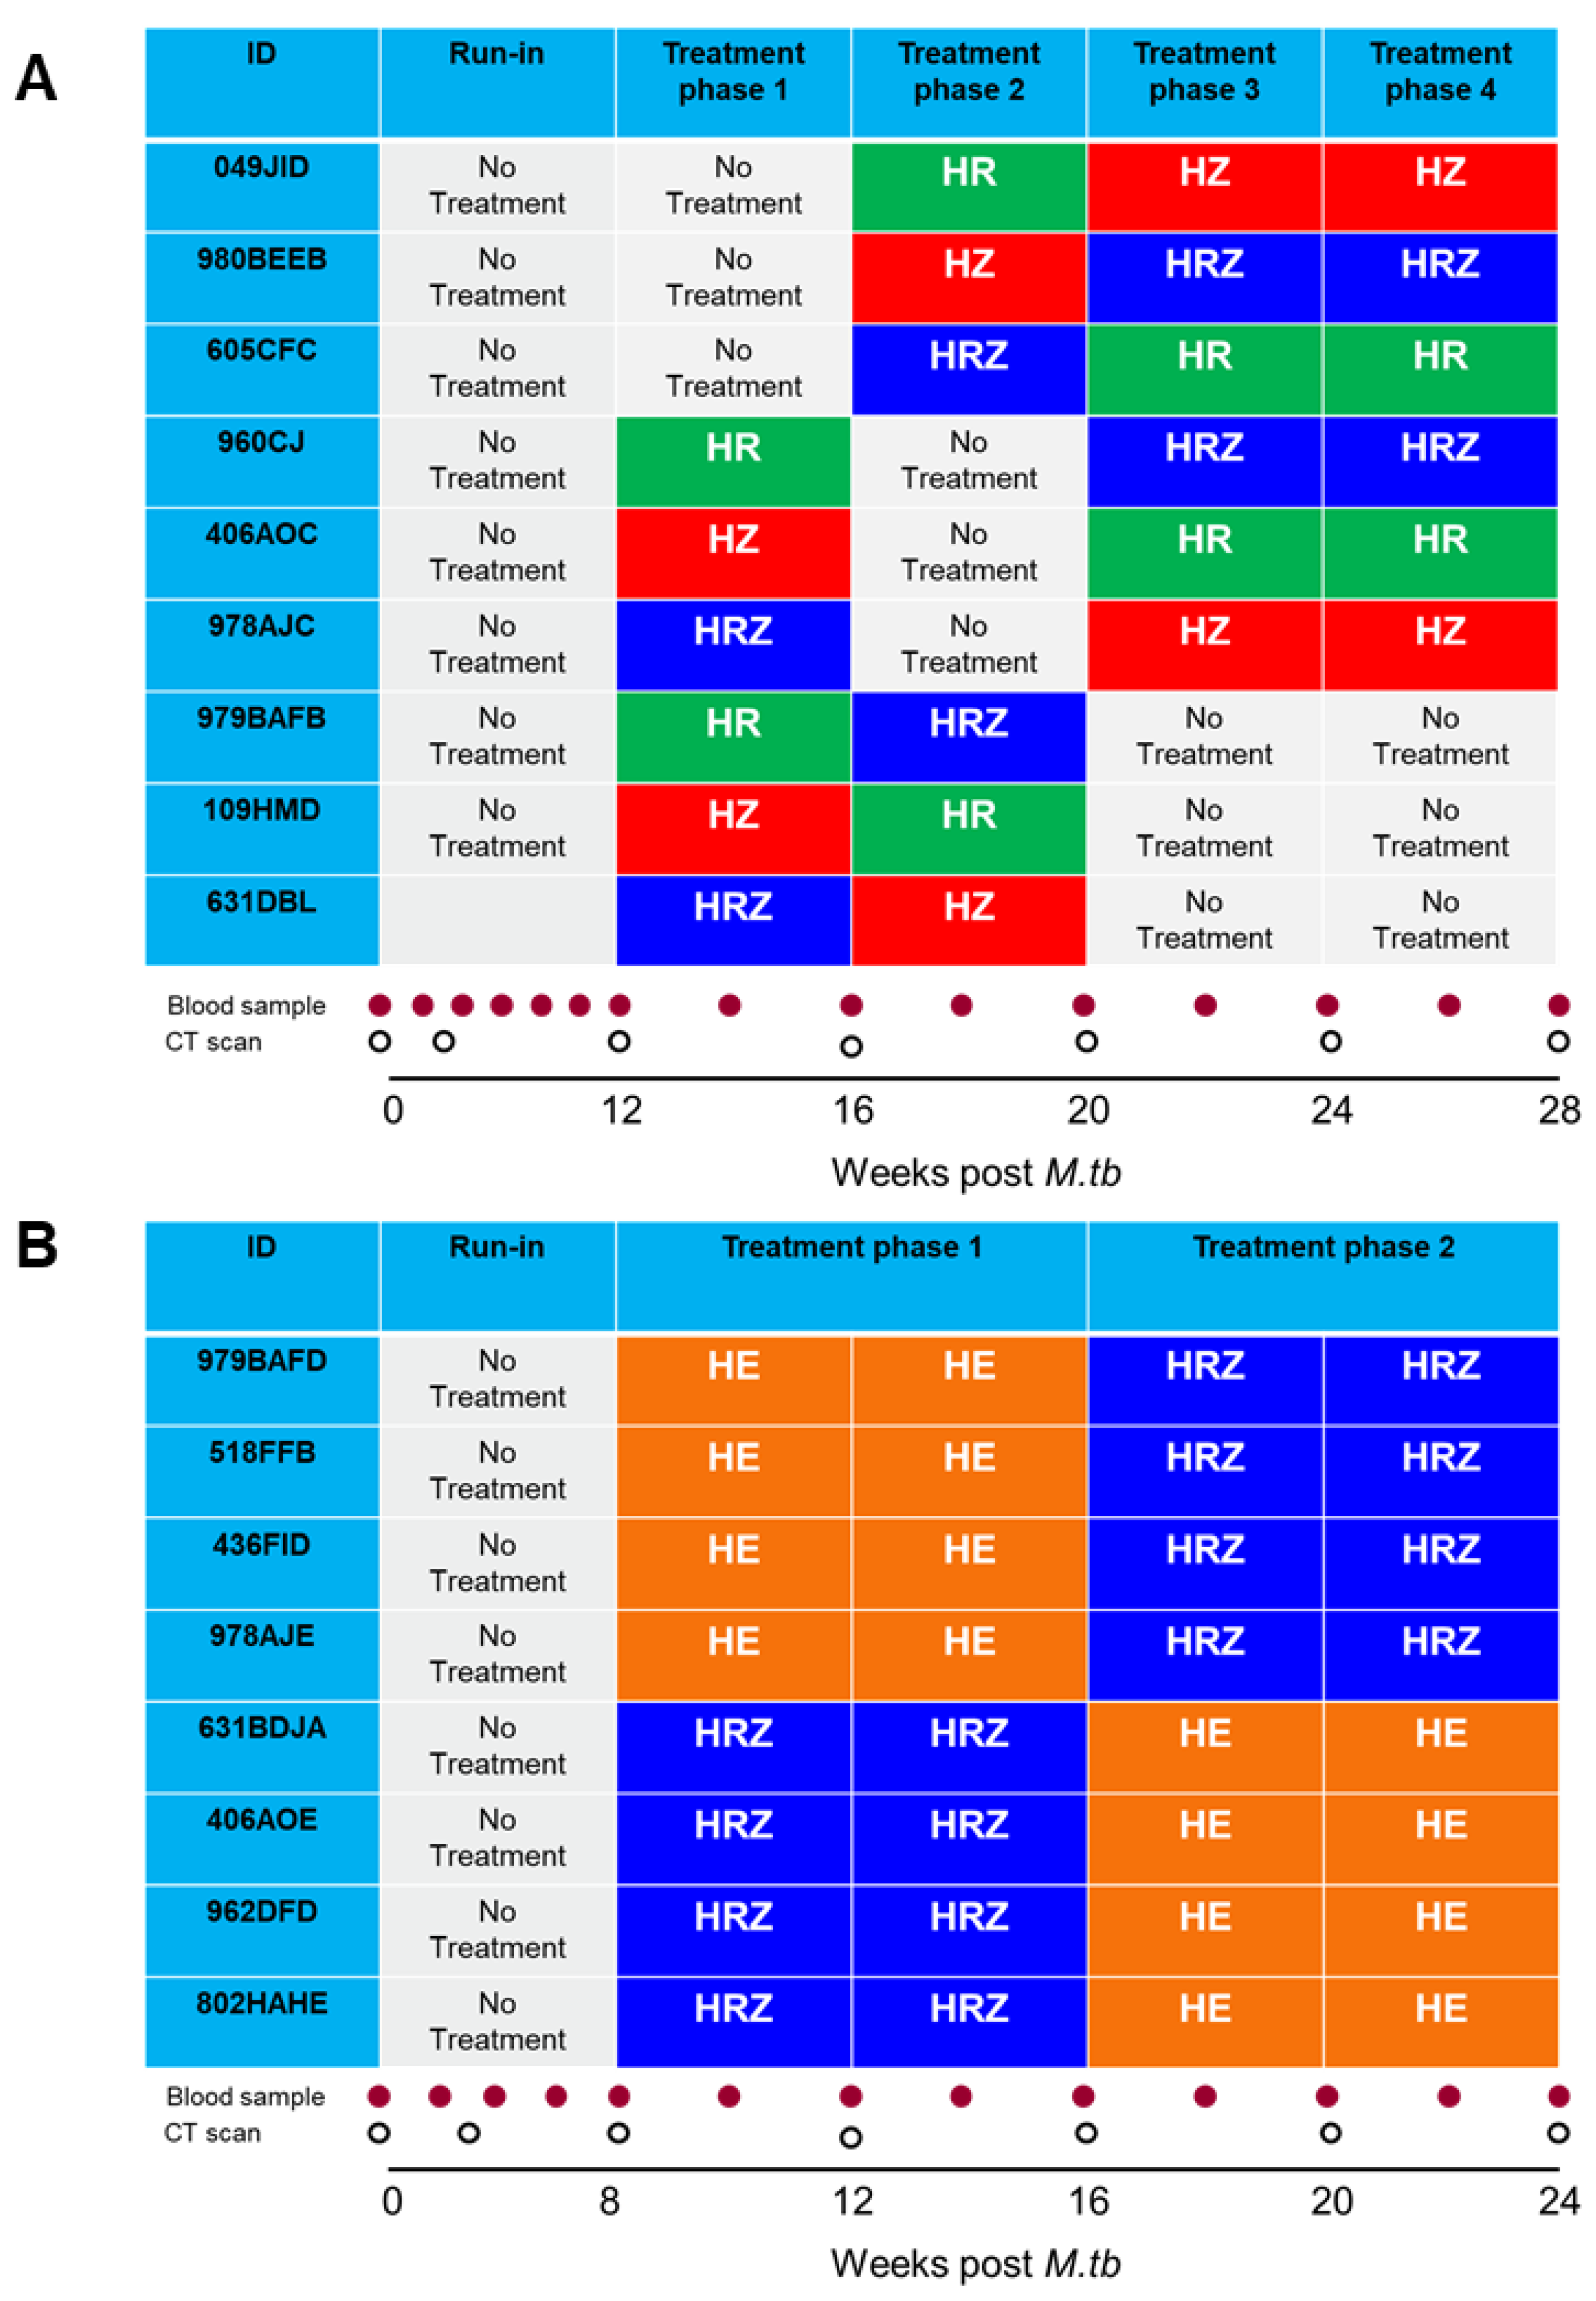
2.3. Drug Treatment Study 1: Pigeon Balanced Cross-Over Design with Extra Period Design
2.4. PK/PD Study 2—Two Period AB/BA Design
2.5. M. tb Challenge Strains
2.6. Aerosol Exposure to M. tb
2.7. Clinical Assessment
2.8. Preparation and Administration of Test SUBSTANCES
2.9. Collection of Blood Samples for PK Analysis during Treatment Phase
2.10. Samples Processing and LC-MS/MS Methods
2.11. PK Analysis
2.12. Computed Tomography (CT) Imaging
2.13. Necropsy
2.14. Histopathological Examination
2.15. Bacteriology
2.16. Peripheral Blood Mononuclear Cells (PBMC) Preparation
2.17. Interferon-Gamma (IFN-γ) ELISPOT
2.18. Statistical Analysis
3. Results
3.1. Satellite Pharmacokinetic Studies
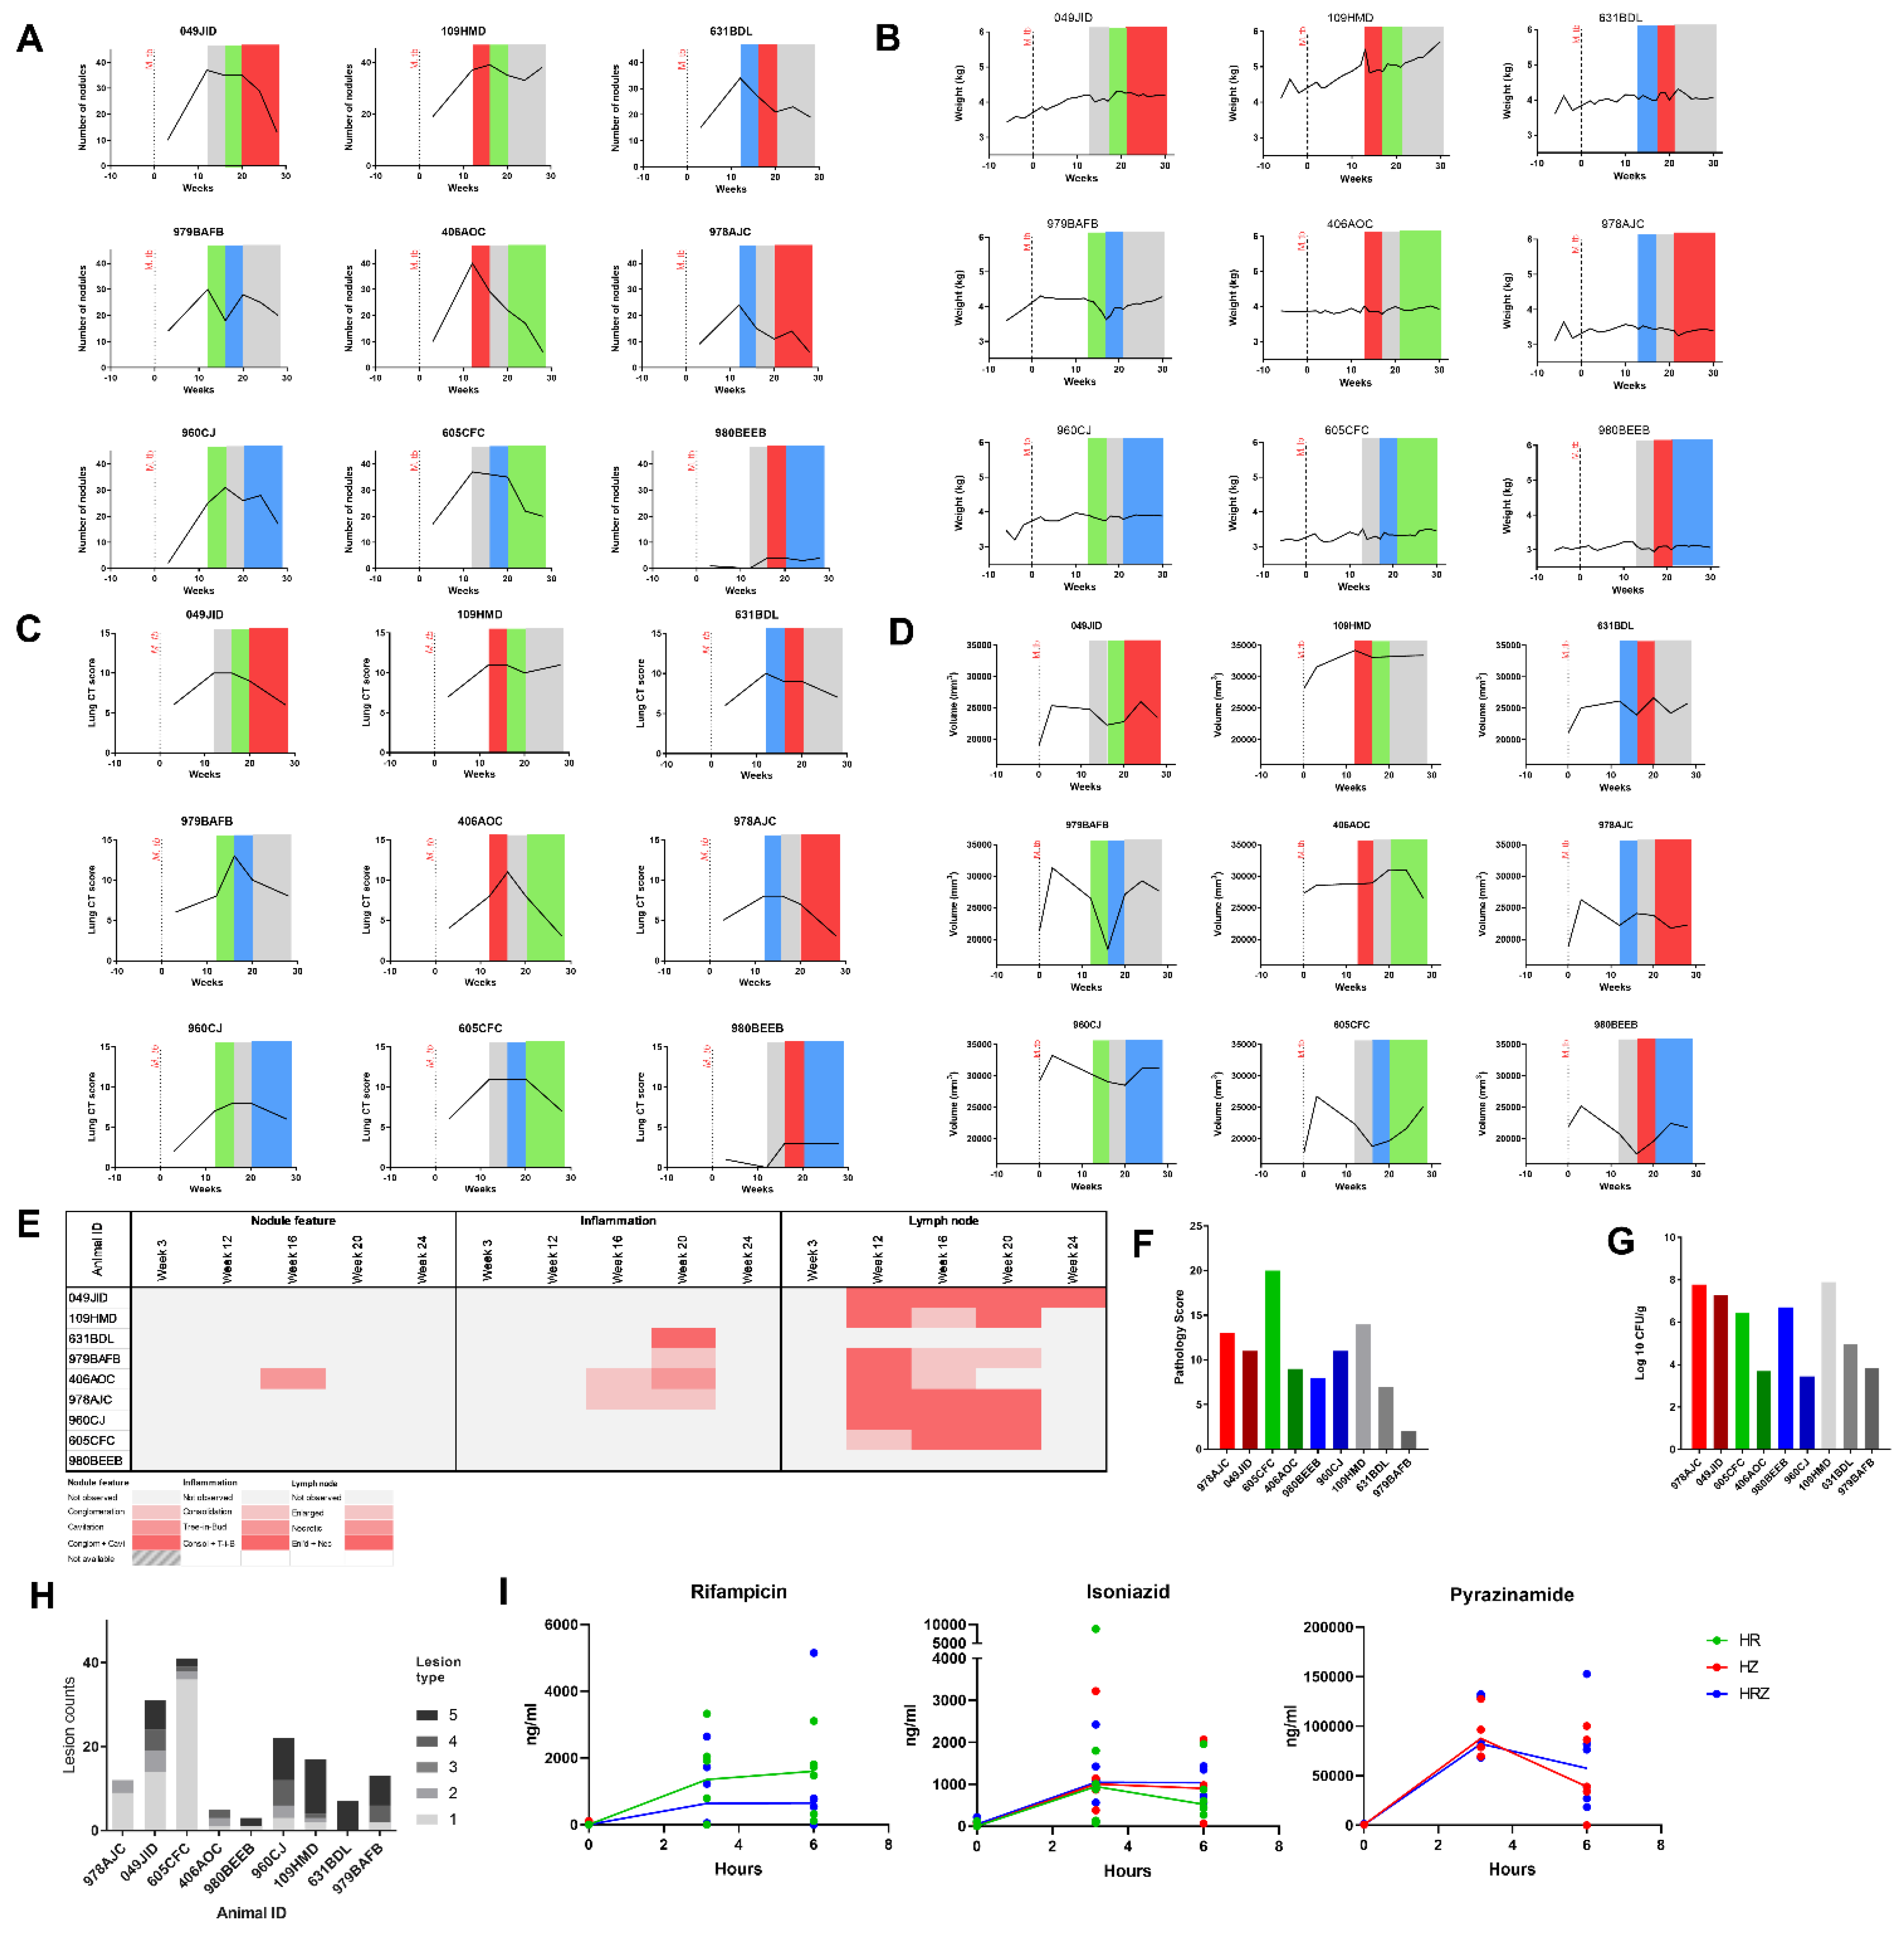
3.2. PK/PD Study 1: Pigeon Balanced Cross over Design with Extra Period Design
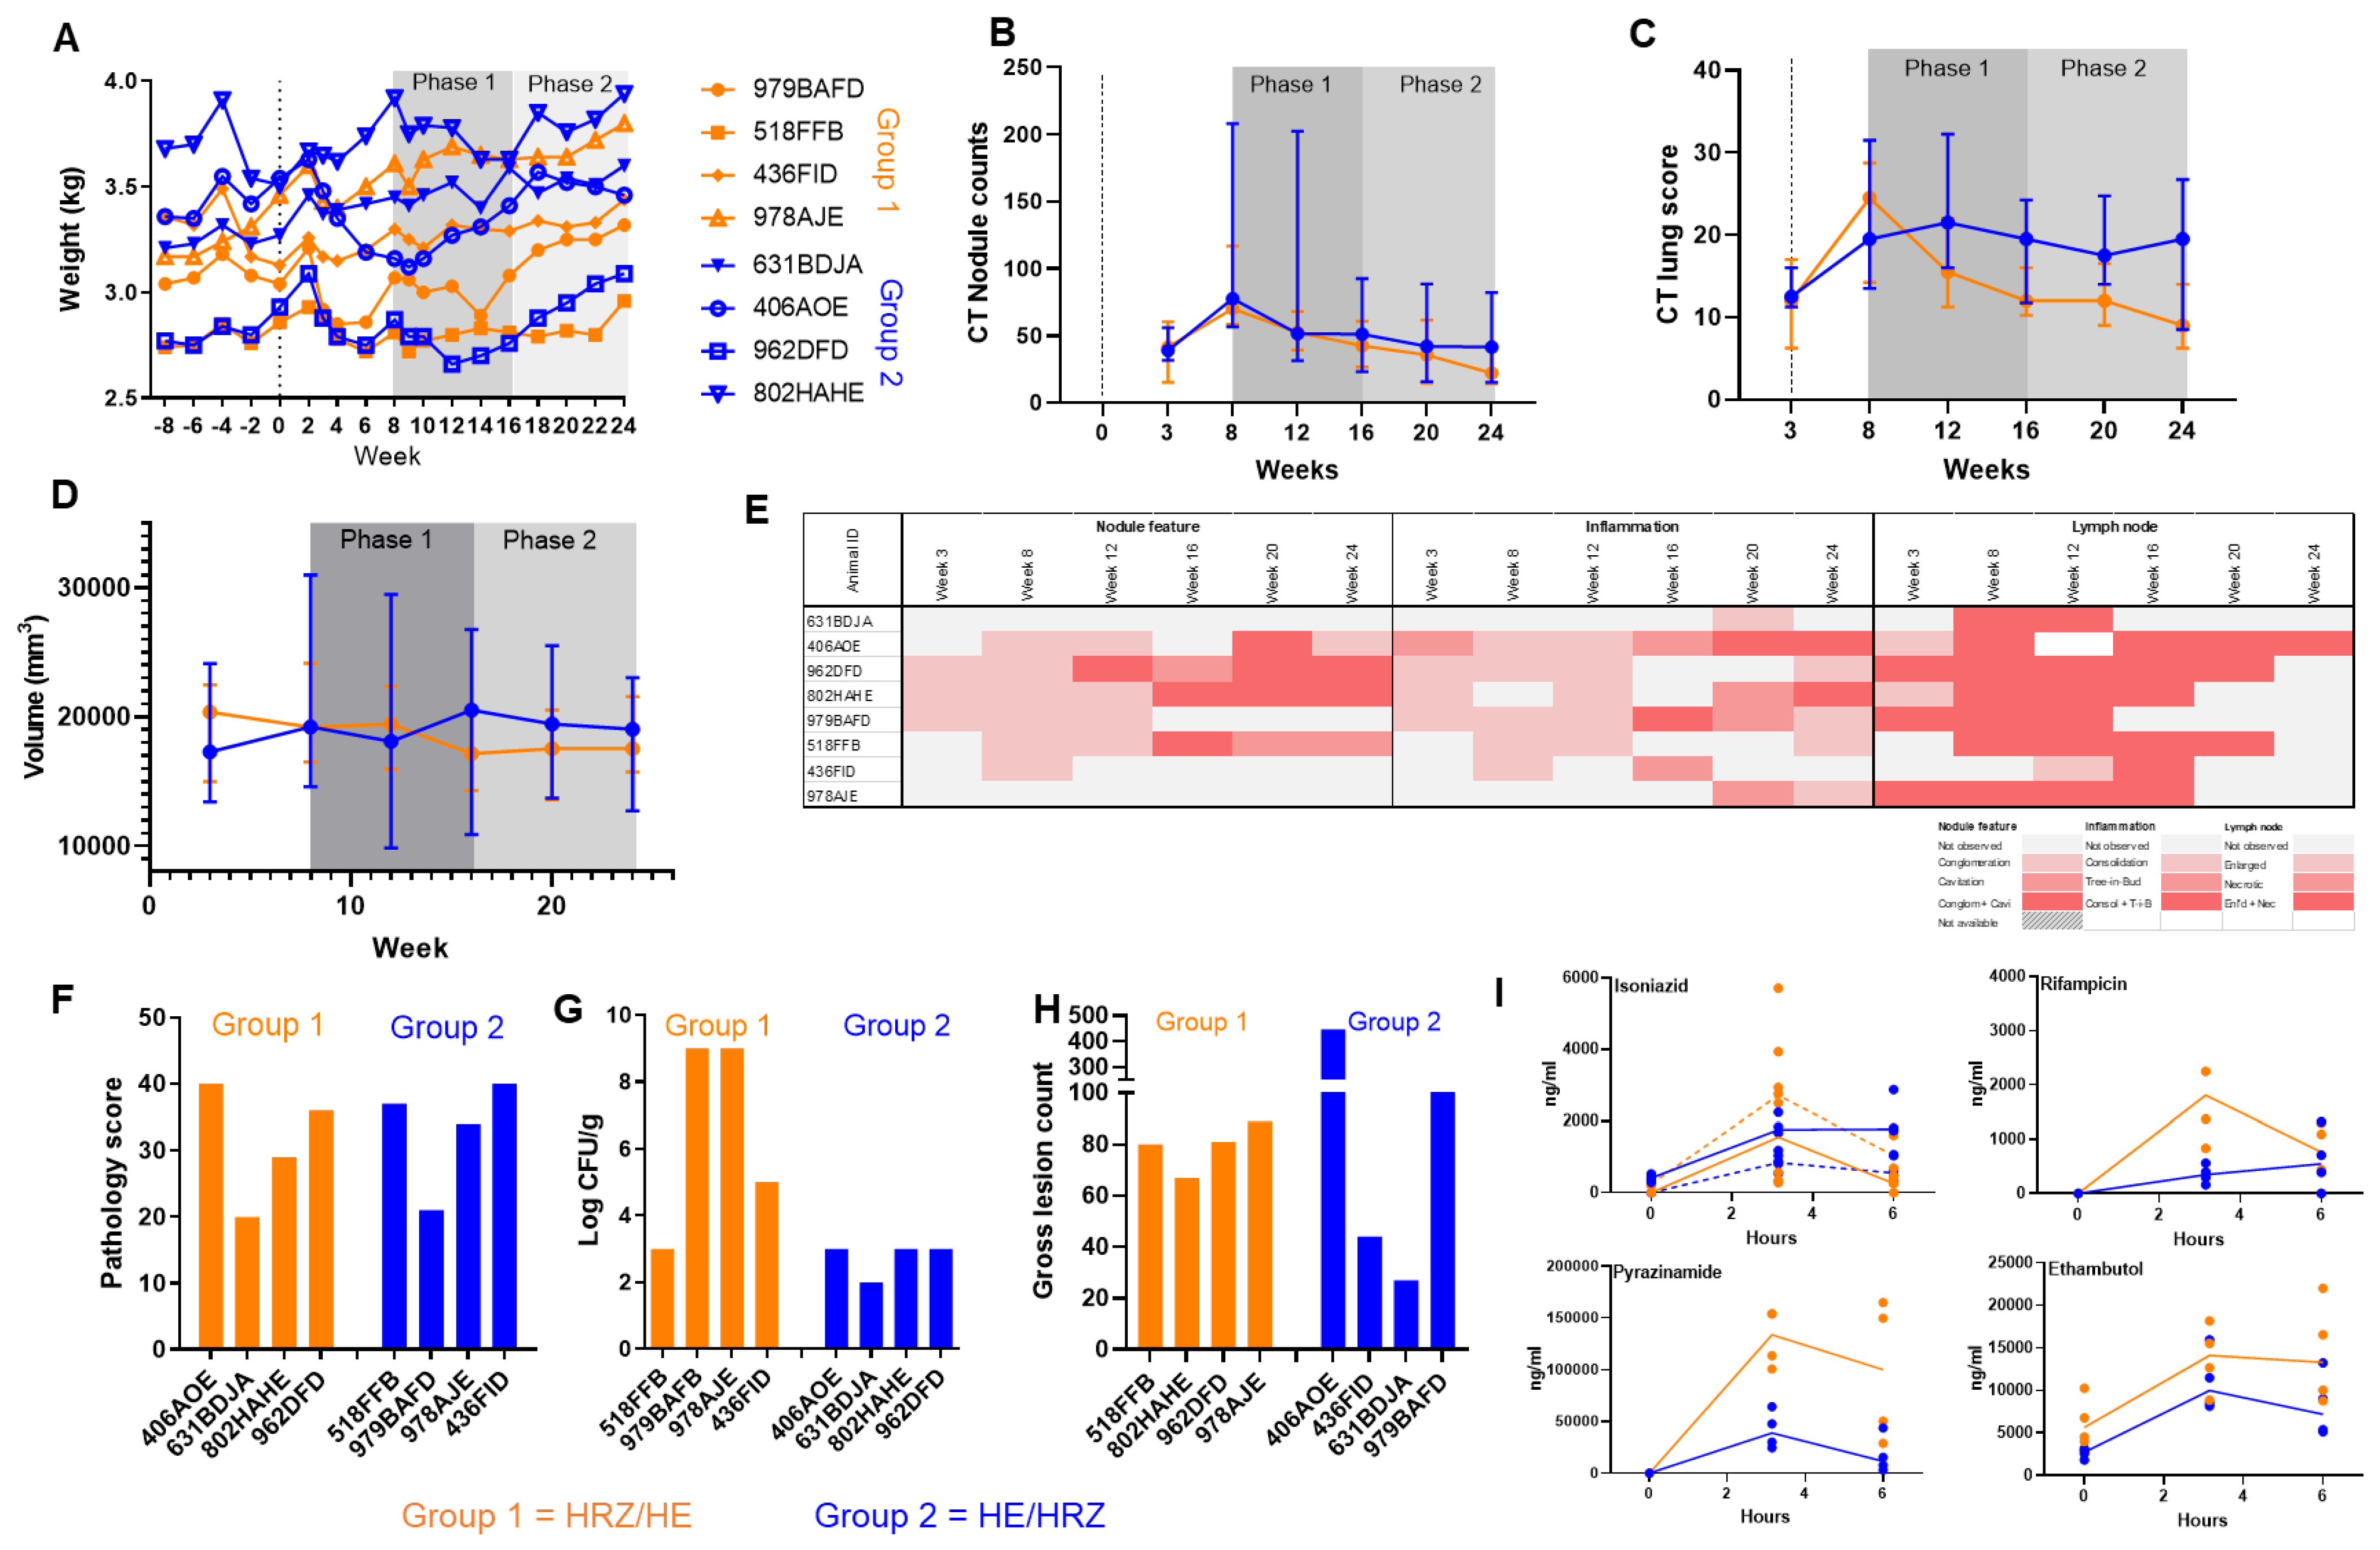
3.2.1. Treatment Effect Analysis
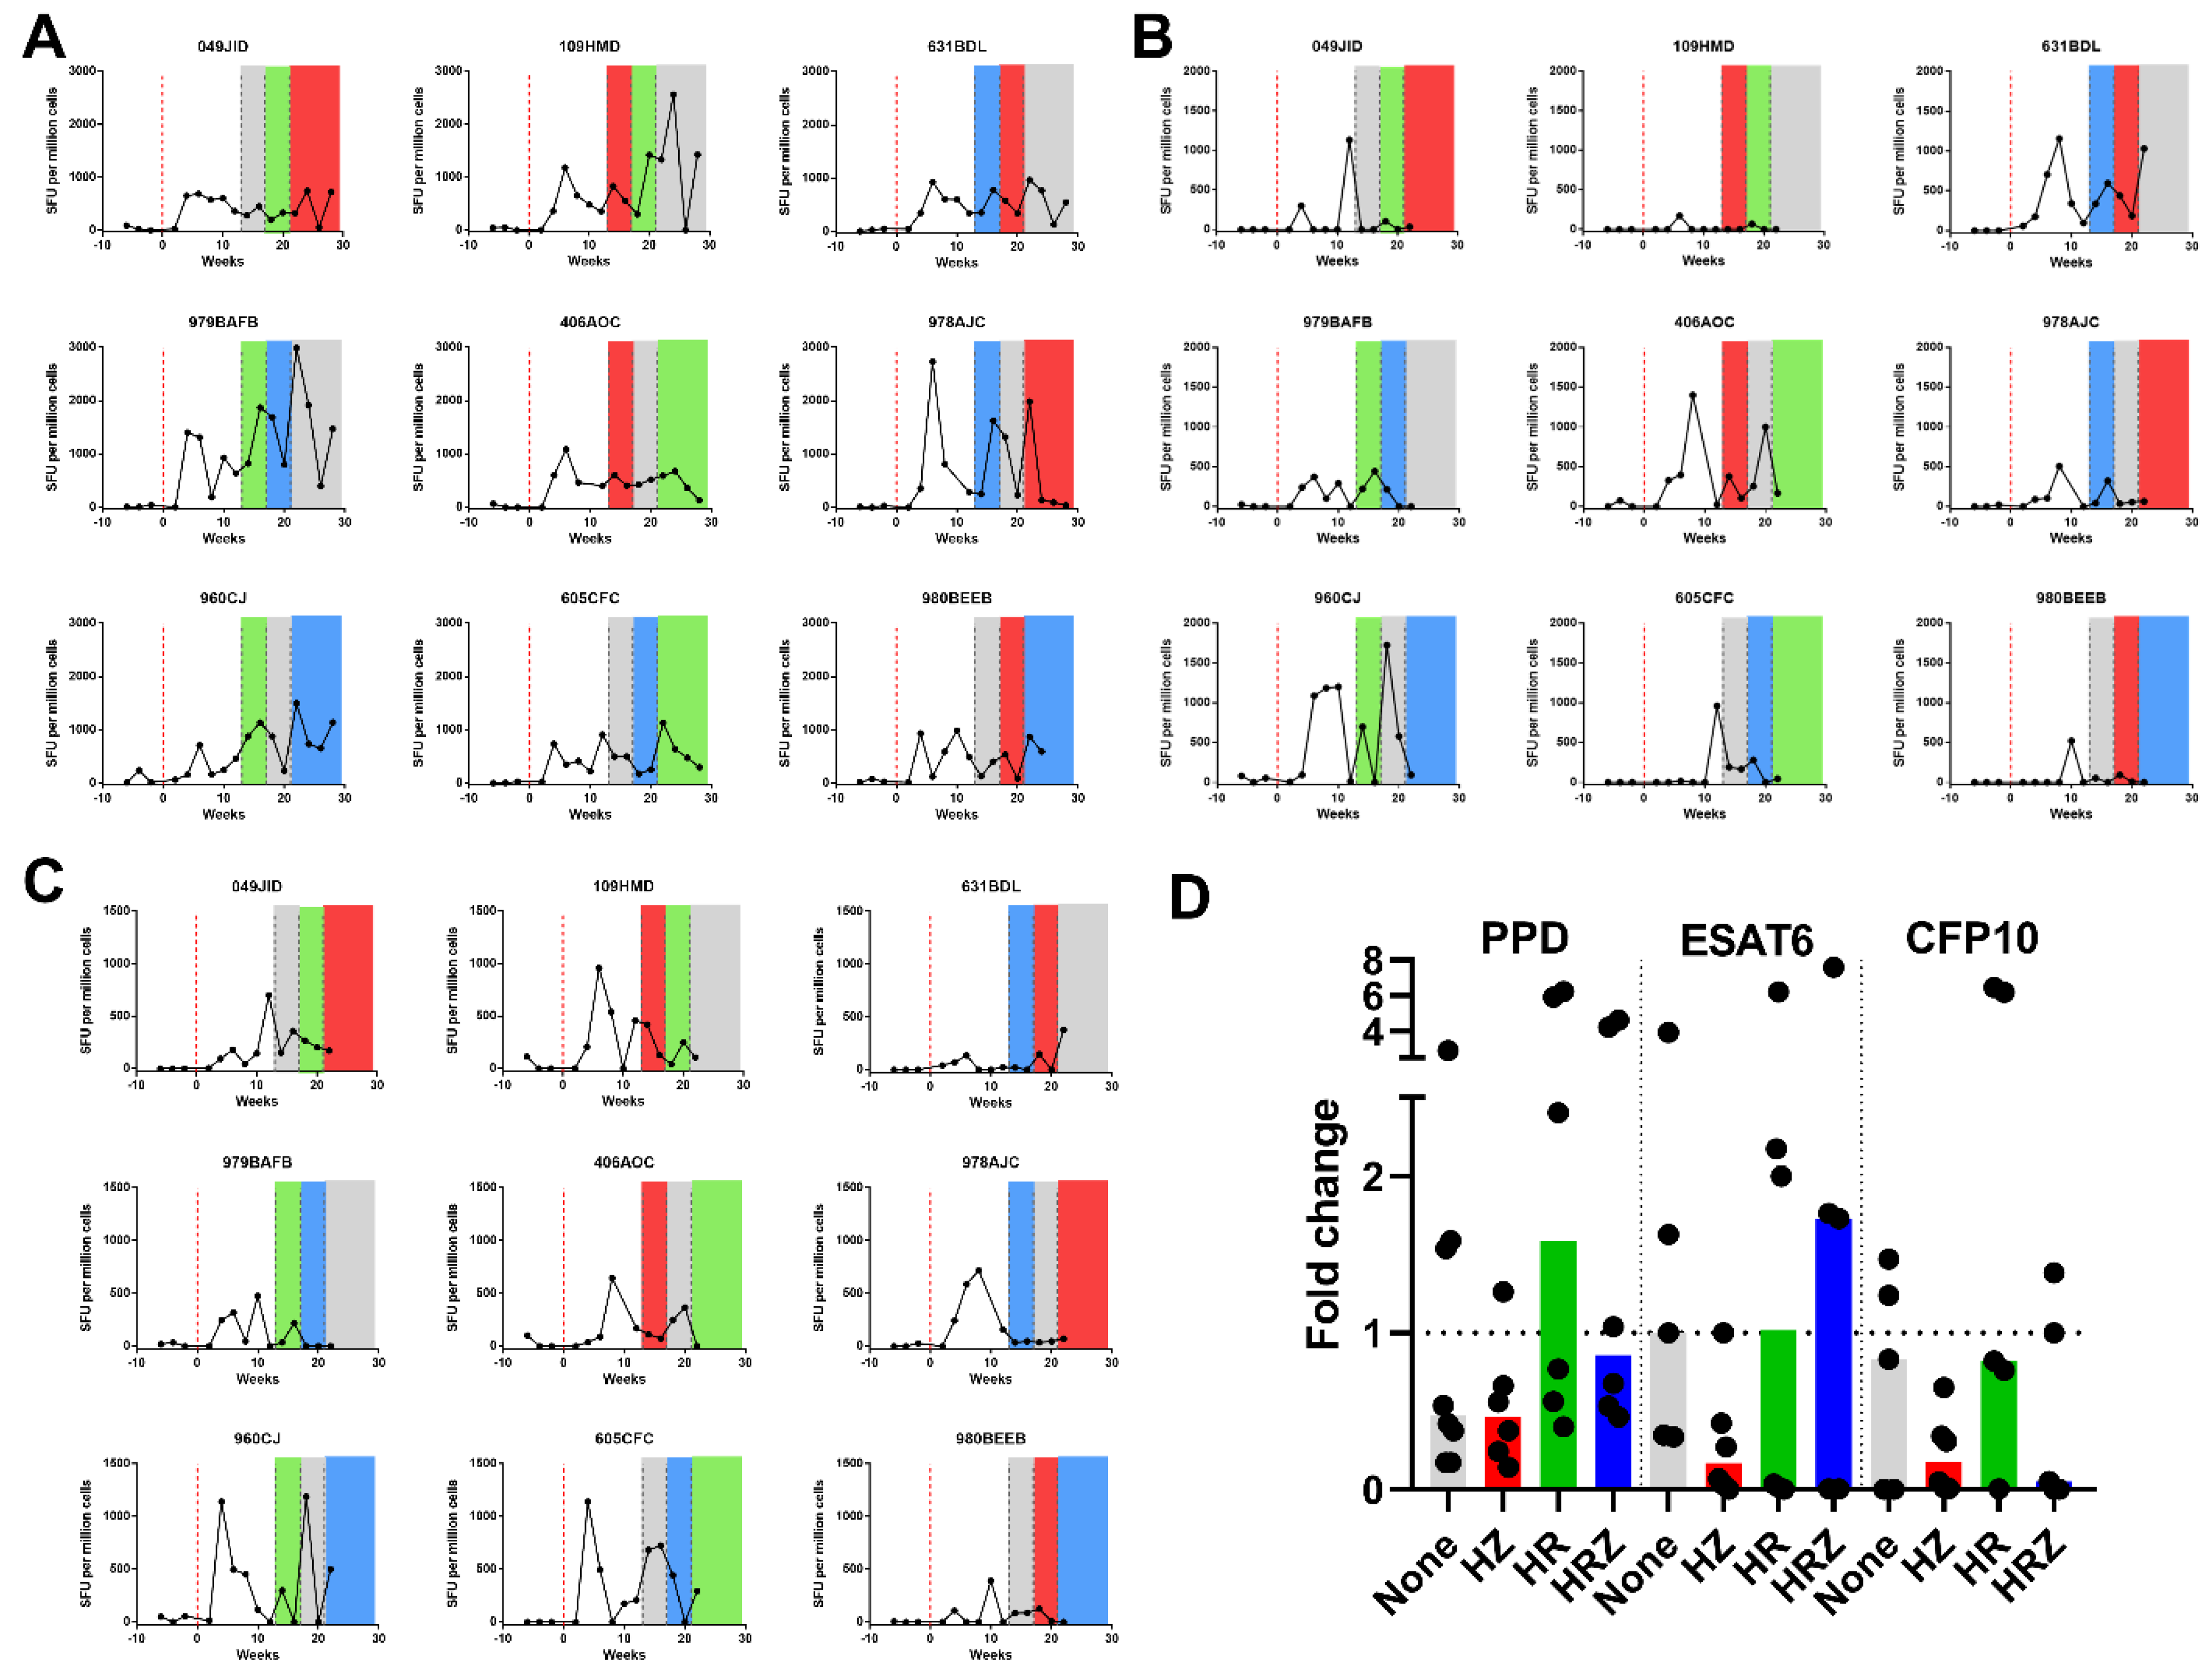
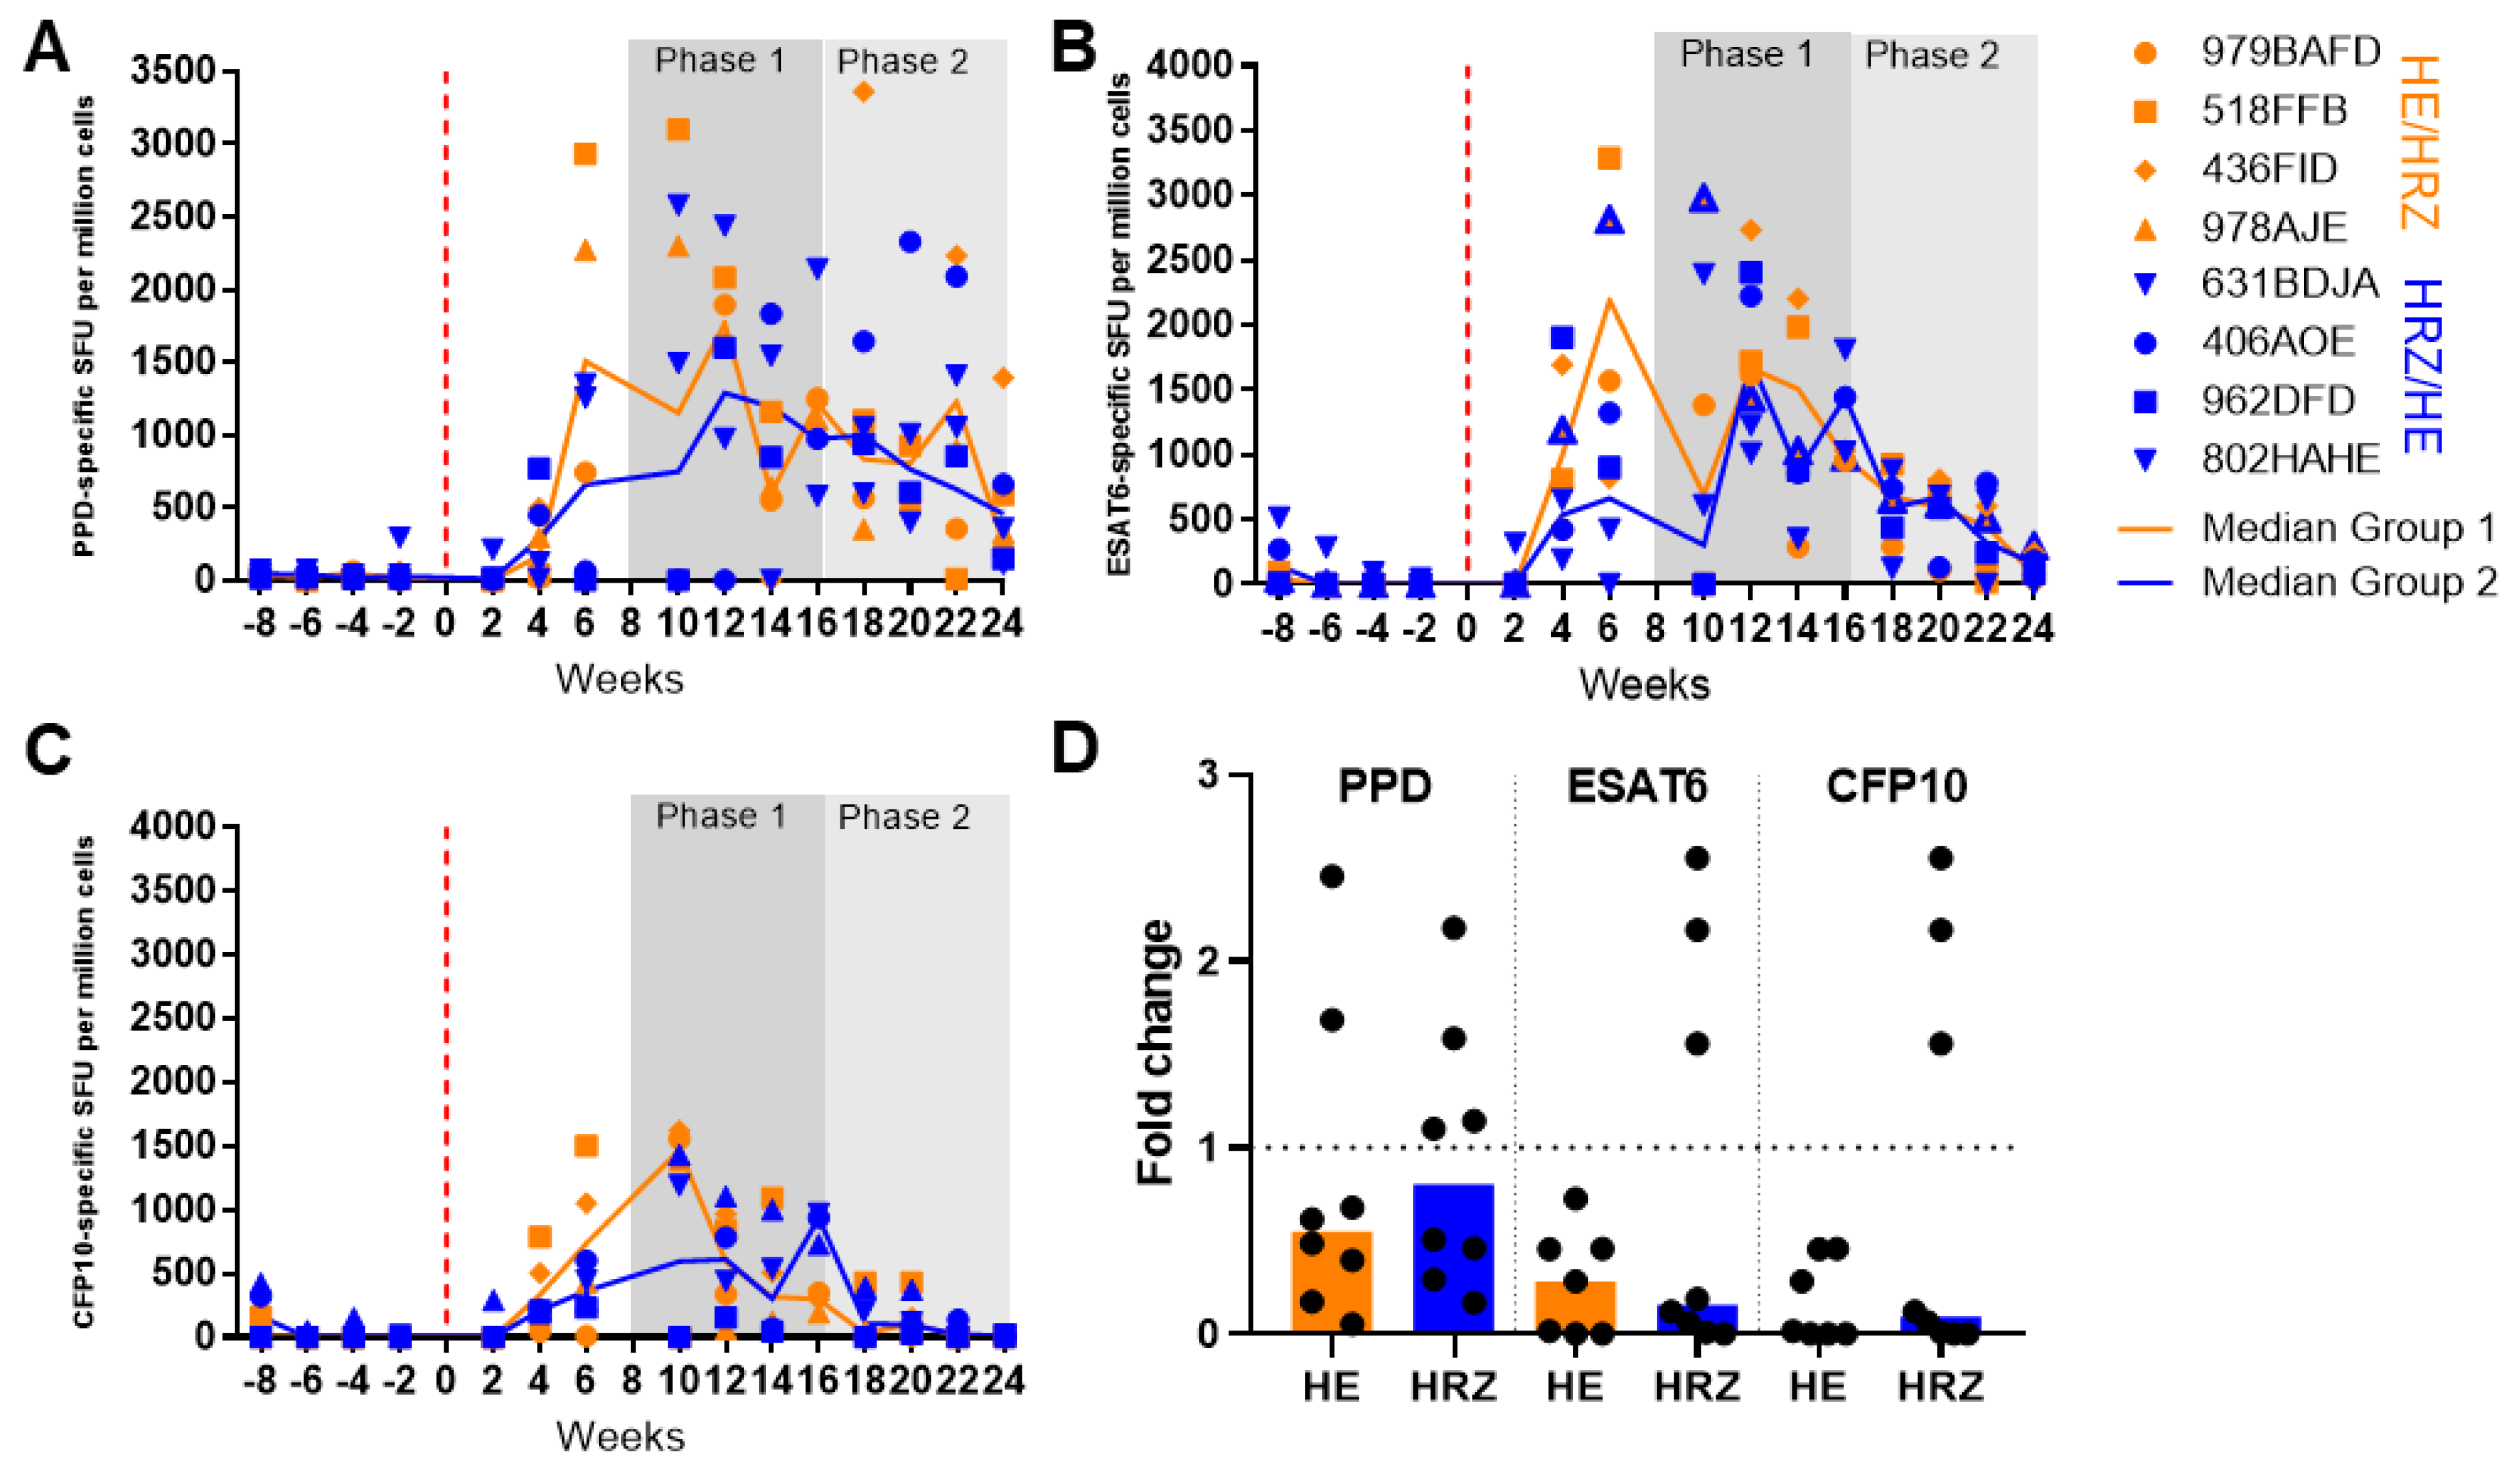
3.2.2. Immune Response during Infection and Treatment
3.2.3. PK/PD Study 2: Two Period AB/BA Design
3.2.4. Treatment Effect Analysis
3.2.5. Immune Response during Infection and Treatment
4. Discussion
5. Conclusions
Supplementary Materials
Author Contributions
Funding
Institutional Review Board Statement
Informed Consent Statement
Data Availability Statement
Acknowledgments
Conflicts of Interest
References
- Global Tuberculosis Report 2021. 2021. Available online: https://www.who.int/publications/i/item/9789240037021 (accessed on 24 November 2022).
- Lenaerts, A.J.; DeGroote, M.A.; Orme, I.M. Preclinical testing of new drugs for tuberculosis: Current challenges. Trends Microbiol. 2008, 16, 48–54. [Google Scholar] [CrossRef] [PubMed]
- Capuano, S.V.; Croix, D.A.; Pawar, S.; Zinovik, A.; Myers, A.; Lin, P.L.; Bissel, S.; Fuhrman, C.; Klein, E.; Flynn, J.L. Experimental Mycobacterium tuberculosis infection of cynomolgus macaques closely resembles the various manifestations of human M. tuberculosis infection. Infect. Immun. 2003, 71, 5831–5844. Available online: http://www.ncbi.nlm.nih.gov/pubmed/14500505 (accessed on 11 April 2017). [CrossRef] [PubMed] [Green Version]
- Lin, P.L.; Coleman, T.; Carney, J.P.J.; Lopresti, B.J.; Tomko, J.; Fillmore, D.; Dartois, V.; Scanga, C.; Frye, L.J.; Janssen, C.; et al. Radiologic responses in cynomolgous macaques for assessing tuberculosis chemotherapy regimens. Antimicrob. Agents Chemother. 2013, 57, 4237–4244. Available online: http://www.pubmedcentral.nih.gov/articlerender.fcgi?artid=3754323&tool=pmcentrez&rendertype=abstract (accessed on 20 January 2015). [CrossRef] [Green Version]
- Flynn, J.L.; Capuano, S.V.; Croix, D.; Pawar, S.; Myers, A.; Zinovik, A.; Klein, E. Non-human primates: A model for tuberculosis research. Tuberculosis 2003, 83, 116–118. Available online: http://www.ncbi.nlm.nih.gov/pubmed/12758200 (accessed on 4 February 2015). [CrossRef]
- Via, L.E.; Weiner, D.M.; Schimel, D.; Lin, P.L.; Dayao, E.; Tankersley, S.L.; Cai, Y.; Coleman, M.T.; Tomko, J.; Paripati, P.; et al. Differential Virulence and Disease Progression following Mycobacterium tuberculosis Complex Infection of the Common Marmoset (Callithrix jacchus). Infect. Immun. 2013, 81, 2909–2919. Available online: http://www.ncbi.nlm.nih.gov/pubmed/23716617 (accessed on 16 November 2018). [CrossRef] [PubMed] [Green Version]
- Wolf, R.; Gibson, S.; Watson, E.; Baskin, G. Multidrug chemotherapy of Tuberculolsis in Rhesus monkeys. Lab. Anim. Sci. 1988, 38, 27–33. [Google Scholar]
- Nell, A.S.; D’Lom, E.; Bouic, P.; Sabaté, M.; Bosser, R.; Picas, J.; Amat, M.; Churchyard, G.; Cardona, P.J. Safety, tolerability, and immunogenicity of the novel antituberculous vaccine RUTI: Randomized, placebo-controlled phase II clinical trial in patients with latent tuberculosis infection. PLoS ONE 2014, 9, e89612. Available online: http://journals.plos.org/plosone/article?id=10.1371/journal.pone.0089612 (accessed on 21 January 2015). [CrossRef]
- Cardona, P.-J. RUTI: A new chance to shorten the treatment of latent tuberculosis infection. Tuberculosis 2006, 86, 273–289. Available online: http://www.sciencedirect.com/science/article/pii/S1472979206000436 (accessed on 10 July 2014). [CrossRef]
- Meier, T.; Eulenbruch, H.-P.; Wrighton-Smith, P.; Enders, G.; Regnath, T. Sensitivity of a new commercial enzyme-linked immunospot assay (T SPOT-TB) for diagnosis of tuberculosis in clinical practice. Eur. J. Clin. Microbiol. Infect. Dis. 2005, 24, 529–536. Available online: http://www.ncbi.nlm.nih.gov/pubmed/16133410 (accessed on 5 January 2017). [CrossRef]
- Minhinnick, A.; Satti, I.; Harris, S.; Wilkie, M.; Sheehan, S.; Stockdale, L.; Thomas, Z.R.M.; Lopez-Ramon, R.; Poulton, I.; Lawrie, A.; et al. A first-in-human phase 1 trial to evaluate the safety and immunogenicity of the candidate tuberculosis vaccine MVA85A-IMX313, administered to BCG-vaccinated adults. Vaccine 2016, 34, 1412–1421. Available online: http://www.sciencedirect.com/science/article/pii/S0264410X16001250 (accessed on 11 January 2017). [CrossRef] [Green Version]
- White, A.D.; Sibley, L.; Sarfas, C.; Morrison, A.; Gullick, J.; Clark, S.; Gleeson, F.; McIntyre, A.; Arlehamn, C.L.; Sette, A.; et al. OPEN MTBVAC vaccination protects rhesus macaques against aerosol challenge with M. tuberculosis and induces immune signatures analogous to those observed in clinical studies. npj Vaccines 2021, 6, 4. [Google Scholar] [CrossRef] [PubMed]
- Mitchell, J.L.; Mee, E.T.; Almond, N.M.; Cutler, K.; Rose, N.J. Characterisation of MHC haplotypes in a breeding colony of Indonesian cynomolgus macaques reveals a high level of diversity. Immunogenetics 2012, 64, 123–129. Available online: https://link.springer.com/article/10.1007/s00251-011-0567-z (accessed on 17 November 2022). [CrossRef] [PubMed]
- Pigeon, J.G.; Raghavarao, D. Crossover designs for comparing treatments with a control. Biometrika 1987, 74, 321–328. Available online: https://academic.oup.com/biomet/article/74/2/321/239493 (accessed on 3 September 2021). [CrossRef]
- James, B.W.; Williams, A.; Marsh, P.D. The physiology and pathogenicity of Mycobacterium tuberculosis grown under controlled conditions in a defined medium. J. Appl. Microbiol. 2000, 88, 669–677. Available online: https://pubmed.ncbi.nlm.nih.gov/10792526/ (accessed on 7 May 2021). [CrossRef] [PubMed]
- Clark, S.O.; Hall, Y.; Kelly, D.L.F.; Hatch, G.J.; Williams, A. Survival of Mycobacterium tuberculosis during experimental aerosolization and implications for aerosol challenge models. J. Appl. Microbiol. 2011, 111, 350–359. Available online: http://www.ncbi.nlm.nih.gov/pubmed/21651681 (accessed on 24 July 2015). [CrossRef] [PubMed]
- Sharpe, S.; White, A.; Gleeson, F.; McIntyre, A.; Smyth, D.; Clark, S.; Sarfas, C.; Laddy, D.; Rayner, E.; Hall, G.; et al. Ultra low dose aerosol challenge with Mycobacterium tuberculosis leads to divergent outcomes in rhesus and cynomolgus macaques. Tuberculosis 2016, 96, 1–12. Available online: https://pubmed.ncbi.nlm.nih.gov/26786648/ (accessed on 27 November 2020). [CrossRef] [PubMed] [Green Version]
- Sharpe, S.A.; McShane, H.; Dennis, M.J.; Basaraba, R.J.; Gleeson, F.; Hall, G.; McIntyre, A.; Gooch, K.; Clark, S.; Beveridge, N.E.R.; et al. Establishment of an aerosol challenge model of tuberculosis in rhesus macaques and an evaluation of endpoints for vaccine testing. Clin. Vaccine Immunol. 2010, 17, 1170–1182. [Google Scholar] [CrossRef] [Green Version]
- Druett, H.A. A mobile form of the Henderson apparatus. J. Hyg. 1969, 67, 437–448. Available online: http://www.pubmedcentral.nih.gov/articlerender.fcgi?artid=2130736&tool=pmcentrez&rendertype=abstract (accessed on 5 August 2015). [CrossRef] [Green Version]
- Sharpe, S.A.; White, A.D.; Sibley, L.; Gleeson, F.; Hall, G.A.; Basaraba, R.J.; McIntyre, A.; Clark, S.O.; Gooch, K.; Marsh, P.D.; et al. An aerosol challenge model of tuberculosis in Mauritian cynomolgus macaques. PLoS ONE 2017, 12, e0171906. [Google Scholar] [CrossRef]
- R: The R Project for Statistical Computing. Available online: https://www.r-project.org/ (accessed on 18 October 2022).
- Borchers, H.W. Practical Numerical Math Functions [R Package Pracma Version 2.4.2]. 2022. Available online: https://cran.r-project.org/package=pracma (accessed on 18 October 2022).
- Sharpe, S.A.; Smyth, D.; McIntyre, A.; Gleeson, F.; Dennis, M.J. Refinement and reduction through application of a quantitative score system for estimation of TB-induced disease burden using computed tomography. Lab Anim. 2018, 52, 599–610. [Google Scholar] [CrossRef]
- Rayner, E.L.; Pearson, G.R.; Hall, G.A.; Basaraba, R.J.; Gleeson, F.; McIntyre, A.; Clark, S.; Williams, A.; Dennis, M.J.; Sharpe, S.A. Early Lesions Following Aerosol Infection of Rhesus Macaques (Macaca mulatta) with Mycobacterium tuberculosis Strain H37RV. J. Comp. Pathol. 2013, 149, 475–485. [Google Scholar] [CrossRef] [PubMed]
- Kleiveland, C.; Kleiveland, C. Peripheral blood mononuclear cells. In The Impact of Food Bioactives on Health: In Vitro and Ex Vivo Models; Springer International Publishing: Berlin/Heidelberg, Germany, 2015; pp. 161–167. Available online: https://link.springer.com/chapter/10.1007/978-3-319-16104-4_15 (accessed on 17 November 2020).
- Sharpe, S.; White, A.; Sarfas, C.; Sibley, L.; Gleeson, F.; McIntyre, A.; Basaraba, R.; Clark, S.; Hall, G.; Rayner, E.; et al. Alternative BCG delivery strategies improve protection against Mycobacterium tuberculosis in non-human primates: Protection associated with mycobacterial antigen-specific CD4 effector memory T-cell populations. Tuberculosis 2016, 101, 174–190. Available online: http://www.tuberculosisjournal.com/article/S1472979216301986/fulltext (accessed on 26 October 2016). [CrossRef] [PubMed] [Green Version]
- Gormus, B.J.; Blanchard, J.L.; Alvarez, X.H.; Didier, P.J. Evidence for a rhesus monkey model of asymptomatic tuberculosis. J. Med. Primatol. 2004, 33, 134–145. Available online: https://onlinelibrary.wiley.com/doi/full/10.1111/j.1600-0684.2004.00062.x (accessed on 10 September 2021). [CrossRef] [PubMed]
- Sibley, L.; Dennis, M.; Sarfas, C.; White, A.; Clark, S.; Gleeson, F.; McIntyre, A.; Rayner, E.; Pearson, G.; Williams, A.; et al. Route of delivery to the airway influences the distribution of pulmonary disease but not the outcome of Mycobacterium tuberculosis infection in rhesus macaques. Tuberculosis 2016, 96, 141–149. [Google Scholar] [CrossRef] [Green Version]
- White, A.D.; Sibley, L.; Gullick, J.; Sarfas, C.; Clark, S.; Fagrouch, Z.; Verschoor, E.; Salguero, F.J.; Dennis, M.; Sharpe, S. TB and SIV Coinfection; A Model for Evaluating Vaccine Strategies against TB Reactivation in Asian Origin Cynomolgus Macaques: A Pilot Study Using BCG Vaccination. Vaccines 2021, 9, 945. Available online: https://www.mdpi.com/2076-393X/9/9/945 (accessed on 31 August 2021). [CrossRef]
- Vordermeier, H.M.; Chambers, M.A.; Cockle, P.J.; Whelan, A.O.; Simmons, J.; Hewinson, R.G. Correlation of ESAT-6-specific gamma interferon production with pathology in cattle following Mycobacterium bovis BCG vaccination against experimental bovine tuberculosis. Infect. Immun. 2002, 70, 3026–3032. Available online: https://pmc/articles/PMC128013/ (accessed on 25 March 2021). [CrossRef] [Green Version]
- Clifford, V.; He, Y.; Zufferey, C.; Connell, T.; Curtis, N. Interferon gamma release assays for monitoring the response to treatment for tuberculosis: A systematic review. Tuberculosis 2015, 95, 639–650. Available online: https://pubmed.ncbi.nlm.nih.gov/26515270/ (accessed on 3 September 2021). [CrossRef]
- Tousif, S.; Singh, D.K.; Ahmad, S.; Moodley, P.; Bhattacharyya, M.; Van Kaer, L.; Das, G. Isoniazid induces apoptosis of activated CD4+ T cells: Implications for post-therapy tuberculosis reactivation and reinfection. J. Biol. Chem. 2014, 289, 30190–30195. Available online: http://www.jbc.org/content/289/44/30190.full (accessed on 5 January 2015). [CrossRef]


| Study | Treatment Dose (mg/Kg) | Drug Form | Subject Number | Sample Collection Time in Minutes Relative to Dosing | ||||||||||||
|---|---|---|---|---|---|---|---|---|---|---|---|---|---|---|---|---|
| Pre | 1st Sampling Period | 2nd Sampling Period | 3rd Sampling Period | 4th Sampling Period | ||||||||||||
| R 10 | S | 1 | 00:00 | 00:30 | 00:45 | 01:00 | 03:00 | 03:15 | 03:30 | 06:00 | 06:15 | 06:30 | nd | nd | nd | |
| 2 | 00:00 | 01:15 | 01:30 | 01:45 | 03:45 | 04:00 | 04:15 | 07:00 | 07:15 | 07:30 | nd | nd | nd | |||
| 3 | 00:00 | 02:00 | 02:15 | 02:30 | 04:30 | 04:45 | 05:00 | 08:00 | 08:15 | 08:30 | nd | nd | nd | |||
| 1 | Z 30 | S | 4 | 00:00 | 00:30 | 00:45 | 01:00 | 03:00 | 03:15 | 03:30 | 06:00 | 06:15 | 06:30 | nd | nd | nd |
| 5 | 00:00 | 01:15 | 01:30 | 01:45 | 03:45 | 04:00 | 04:15 | 07:00 | 07:15 | 07:30 | nd | nd | nd | |||
| 6 | 00:00 | 02:00 | 02:15 | 02:30 | 04:30 | 04:45 | 05:00 | 08:00 | 08:15 | 08:30 | nd | nd | nd | |||
| R 10, Z 30 | S | 7 | 00:00 | 00:30 | 00:45 | 01:00 | 03:00 | 03:15 | 03:30 | 06:00 | 06:15 | 06:30 | nd | nd | nd | |
| 8 | 00:00 | 01:15 | 01:30 | 01:45 | 03:45 | 04:00 | 04:15 | 07:00 | 07:15 | 07:30 | nd | nd | nd | |||
| 9 | 00:00 | 02:00 | 02:15 | 02:30 | 04:30 | 04:45 | 05:00 | 08:00 | 08:15 | 08:30 | nd | nd | nd | |||
| R 75 | D | 10 | 00:00 | 00:30 | 00:45 | 01:00 | 03:00 | 03:15 | 03:30 | 06:00 | 06:15 | 06:30 | nd | nd | nd | |
| 11 | 00:00 | 01:15 | 01:30 | 01:45 | 03:45 | 04:00 | 04:15 | 07:00 | 07:15 | 07:30 | nd | nd | nd | |||
| 12 | 00:00 | 02:00 | 02:15 | 02:30 | 04:30 | 04:45 | 05:00 | 08:00 | 08:15 | 08:30 | nd | nd | nd | |||
| R 150 | D | 13 | 00:00 | 00:30 | 00:45 | 01:00 | 03:00 | 03:15 | 03:30 | 06:15 | 06:30 | 06:45 | nd | nd | nd | |
| 14 | 00:00 | 01:45 | 02:00 | 02:15 | 04:15 | 04:30 | 04:45 | 07:30 | 07:45 | 08:00 | nd | nd | nd | |||
| 2 | Z 400 | D | 15 | 00:00 | 00:30 | 00:45 | 01:00 | 03:00 | 03:15 | 03:30 | 06:15 | 06:30 | 06:45 | nd | nd | nd |
| 16 | 00:00 | 01:45 | 02:00 | 02:15 | 04:15 | 04:30 | 04:45 | 07:30 | 07:45 | 08:00 | nd | nd | nd | |||
| Z 600 | D | 17 | 00:00 | 00:30 | 00:45 | 01:00 | 03:00 | 03:15 | 03:30 | 06:15 | 06:30 | 06:45 | nd | nd | nd | |
| 18 | 00:00 | 01:45 | 02:00 | 02:15 | 04:15 | 04:30 | 04:45 | 07:30 | 07:45 | 08:00 | nd | nd | nd | |||
| H 10; R 10, Z 250 | D | 19 | 00:00 | 00:30 | 00:45 | 01:00 | 03:00 | 03:15 | 03:30 | 06:15 | 06:30 | 06:45 | 24:00 | 24:15 | 24:30 | |
| 20 | 00:00 | 01:45 | 02:00 | 02:15 | 04:15 | 04:30 | 04:45 | 07:30 | 07:45 | 08:00 | 26:00 | 26:15 | 26:30 | |||
| 3 | H 10; R 30, Z 250 | D | 21 | 00:00 | 00:30 | 00:45 | 01:00 | 03:00 | 03:15 | 03:30 | 06:15 | 06:30 | 06:45 | 24:00 | 24:15 | 24:30 |
| 22 | 00:00 | 01:45 | 02:00 | 02:15 | 04:15 | 04:30 | 04:45 | 07:30 | 07:45 | 08:00 | 26:00 | 26:15 | 26:30 | |||
| H 20; R 10, Z 250 | D | 23 | 00:00 | 00:30 | 00:45 | 01:00 | 03:00 | 03:15 | 03:30 | 06:15 | 06:30 | 06:45 | 24:00 | 24:15 | 24:30 | |
| 24 | 00:00 | 01:45 | 02:00 | 02:15 | 04:15 | 04:30 | 04:45 | 07:30 | 07:45 | 08:00 | 26:00 | 26:15 | 26:30 | |||
| H 20; R 30, Z 250 | D | 25 | 00:00 | 00:30 | 00:45 | 01:00 | 03:00 | 03:15 | 03:30 | 06:15 | 06:30 | 06:45 | 24:00 | 24:15 | 24:30 | |
| 26 | 00:00 | 01:45 | 02:00 | 02:15 | 04:15 | 04:30 | 04:45 | 07:30 | 07:45 | 08:00 | 26:00 | 26:15 | 26:30 | |||
| E 25 | D | 27 | 00:00 | 00.30 | 00.45 | 01.00 | 06:00 | 06:15 | 06:30 | 24:00 | 24:15 | 24:30 | nd | nd | nd | |
| 28 | 00:00 | 01:15 | 01:30 | 01:45 | 07:00 | 07:15 | 07:30 | 25:00 | 25:15 | 25:30 | nd | nd | nd | |||
| 4 | E 75 | D | 29 | 00:00 | 00.30 | 00.45 | 01.00 | 06:00 | 06:15 | 06:30 | 24:00 | 24:15 | 24:30 | nd | nd | nd |
| 30 | 00:00 | 01:15 | 01:30 | 01:45 | 07:00 | 07:15 | 07:30 | 25:00 | 25:15 | 25:30 | nd | nd | nd | |||
| Model | AIC Of ANOVA Model Fit | ||
|---|---|---|---|
| Nodule Count | Weight | Vol_Disease | |
| 1. Base | 276.5 | 67.5 | 744.1 |
| 2. ID_effect | 245.2 | −46.4 | 722.9 |
| 3. Period_effect | 227.9 | −49.8 | 715.3 |
| 4. Treatment_effect | 225.1 | −54.2 | 716.5 |
| 5. Treatment_period_int_effect | 216.3 | −57.4 | 692.1 |
| 6. Baseline_effect | 226.6 | −54.4 | 716.4 |
| (A) | |||
| Test | p-Value F-Test of Model Comparison | ||
| Nodule Count | Weight | Vol_Disease | |
| 2 vs. 1: ID_effect | 0.000 | 0.000 | 0.000 |
| 3 vs. 2: Period_effect | 0.001 | 0.093 | 0.026 |
| 4 vs. 3: Treatment effect | 0.153 | 0.103 | 0.416 |
| 5 vs. 4: Treatment_period_int_effect | 0.261 | 0.446 | 0.040 |
| 6 vs. 4: Baseline effect | 0.615 | 0.270 | 0.281 |
| (B) | |||
| Model | AIC of ANOVA Model Fit | ||
|---|---|---|---|
| Nodule Count | Weight | Vol_Disease | |
| 1. base | 33.18 | 7.78 | −54.06 |
| 2. period | 28.83 | −0.783 | −52.097 |
| 3. period + treatment | 29.49 | 1.216 | −51.719 |
| 4. treatment period interaction | 30.995 | 2.795 | −49.722 |
| 5. period + baseline | 30.883 | −11.97 | −60.62 |
| 6. period + baseline + treatment | 31.48 | −9.972 | −60.85 |
| (A) | |||
| Test | F-Test of Model Comparison | ||
| Nodule Count | Weight | Vol_Disease | |
| 2 vs. 1: period | 0.012 | 0.001 | 0.042 |
| 3 vs. 2: period + treatment | 0.247 | 0.973 | 0.203 |
| 4 vs. 2: treatment period interaction | 0.399 | 0.421 | 0.443 |
| 5 vs. 2: period + baseline | 0.97 | 0.0003 | 0.001 |
| 6. vs. 5: period + baseline + treatment | 0.245 | 0.978 | 0.135 |
| (B) | |||
Publisher’s Note: MDPI stays neutral with regard to jurisdictional claims in published maps and institutional affiliations. |
© 2022 by the authors. Licensee MDPI, Basel, Switzerland. This article is an open access article distributed under the terms and conditions of the Creative Commons Attribution (CC BY) license (https://creativecommons.org/licenses/by/4.0/).
Share and Cite
Sibley, L.; White, A.D.; Sarfas, C.; Gullick, J.; Gleeson, F.; Lanni, F.; Clark, S.; Rayner, E.; Ferrer-Bazaga, S.; Ortega-Muro, F.; et al. Determination of the Pharmacokinetics and Pharmacodynamics of Isoniazid, Rifampicin, Pyrazinamide and Ethambutol in a Cross-Over Cynomolgus Macaque Model of Mycobacterium tuberculosis Infection. Pharmaceutics 2022, 14, 2666. https://doi.org/10.3390/pharmaceutics14122666
Sibley L, White AD, Sarfas C, Gullick J, Gleeson F, Lanni F, Clark S, Rayner E, Ferrer-Bazaga S, Ortega-Muro F, et al. Determination of the Pharmacokinetics and Pharmacodynamics of Isoniazid, Rifampicin, Pyrazinamide and Ethambutol in a Cross-Over Cynomolgus Macaque Model of Mycobacterium tuberculosis Infection. Pharmaceutics. 2022; 14(12):2666. https://doi.org/10.3390/pharmaceutics14122666
Chicago/Turabian StyleSibley, Laura, Andrew D. White, Charlotte Sarfas, Jennie Gullick, Fergus Gleeson, Faye Lanni, Simon Clark, Emma Rayner, Santiago Ferrer-Bazaga, Fatima Ortega-Muro, and et al. 2022. "Determination of the Pharmacokinetics and Pharmacodynamics of Isoniazid, Rifampicin, Pyrazinamide and Ethambutol in a Cross-Over Cynomolgus Macaque Model of Mycobacterium tuberculosis Infection" Pharmaceutics 14, no. 12: 2666. https://doi.org/10.3390/pharmaceutics14122666