
Exposure of the Basophilic Cell Line KU812 to Liposomes Reveals Activation Profiles Associated with Potential Anaphylactic Responses Linked to Physico-Chemical Characteristics
 , ,
, ,  and
and 
Abstract
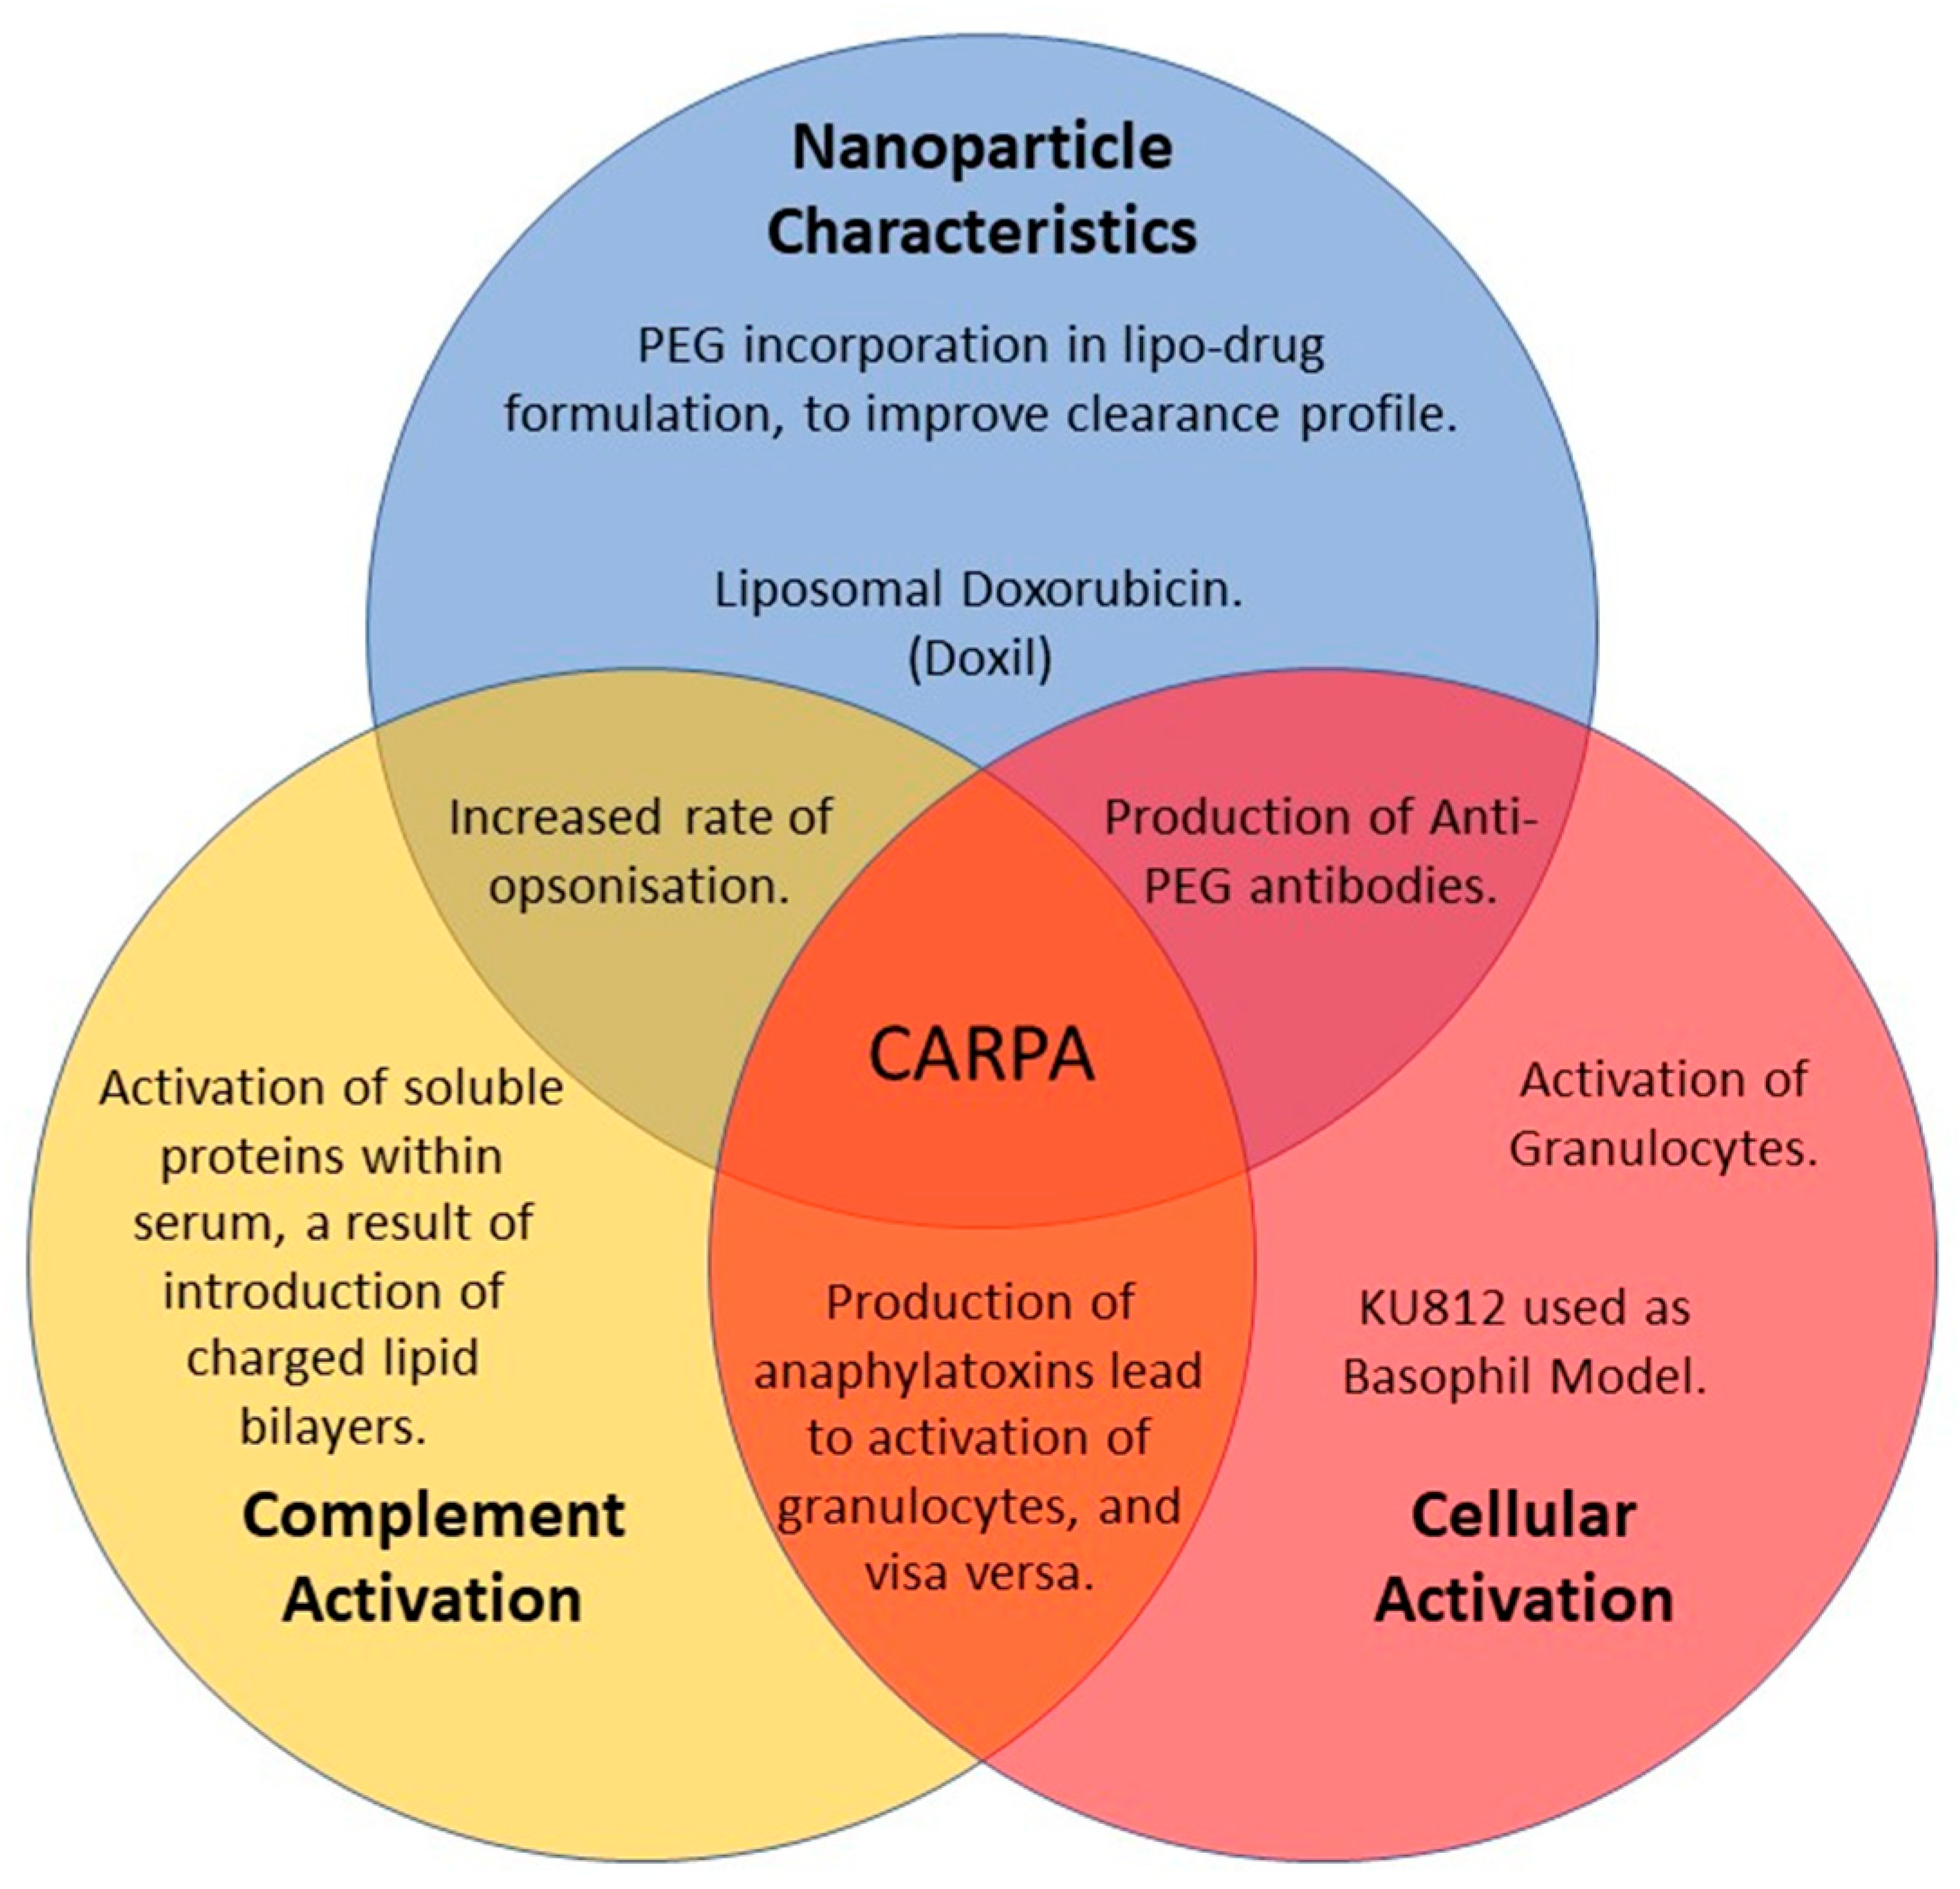
:1. Introduction
2. Materials and Methods
2.1. Materials
2.2. Liposome Production
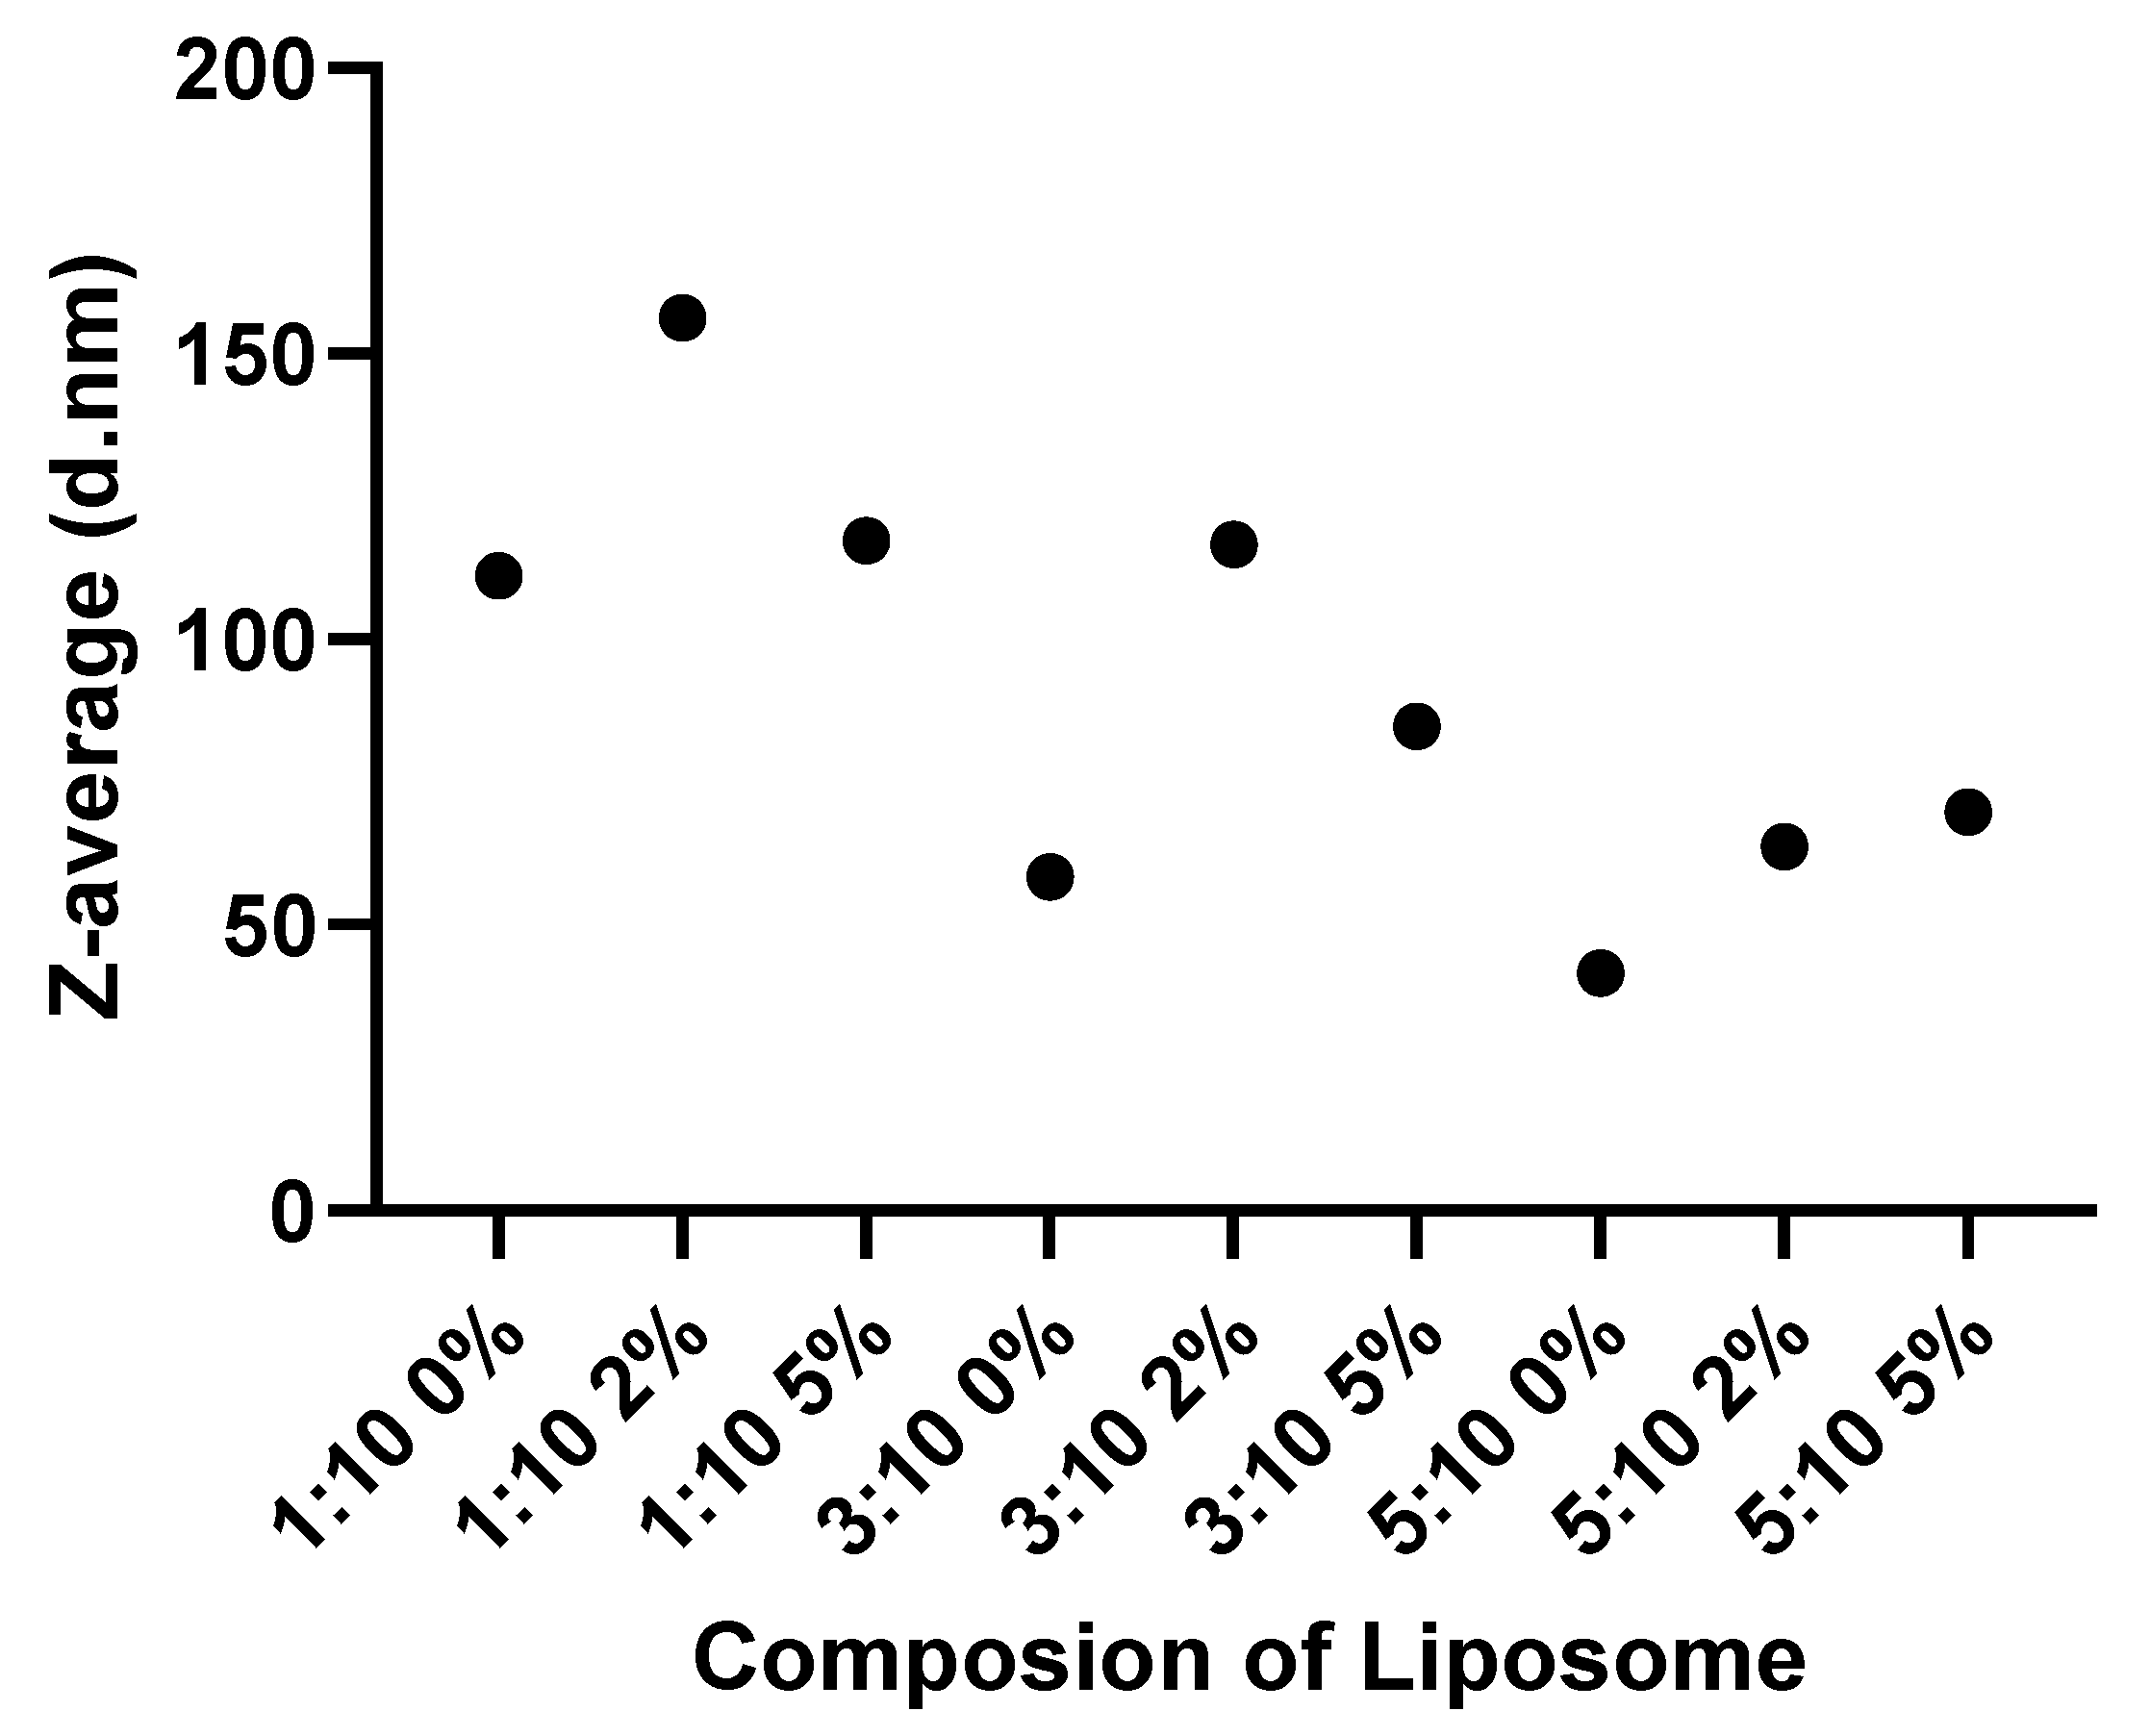
2.3. Size Analysis of Liposomes
2.4. Impact of Anaphylatoxins, and Liposomes, on KU812 Proliferation and Viability via MTT and LDH Assays
2.5. Determination of Basophil Activation in Response to Direct Stimulation
2.6. Statistics
3. Results
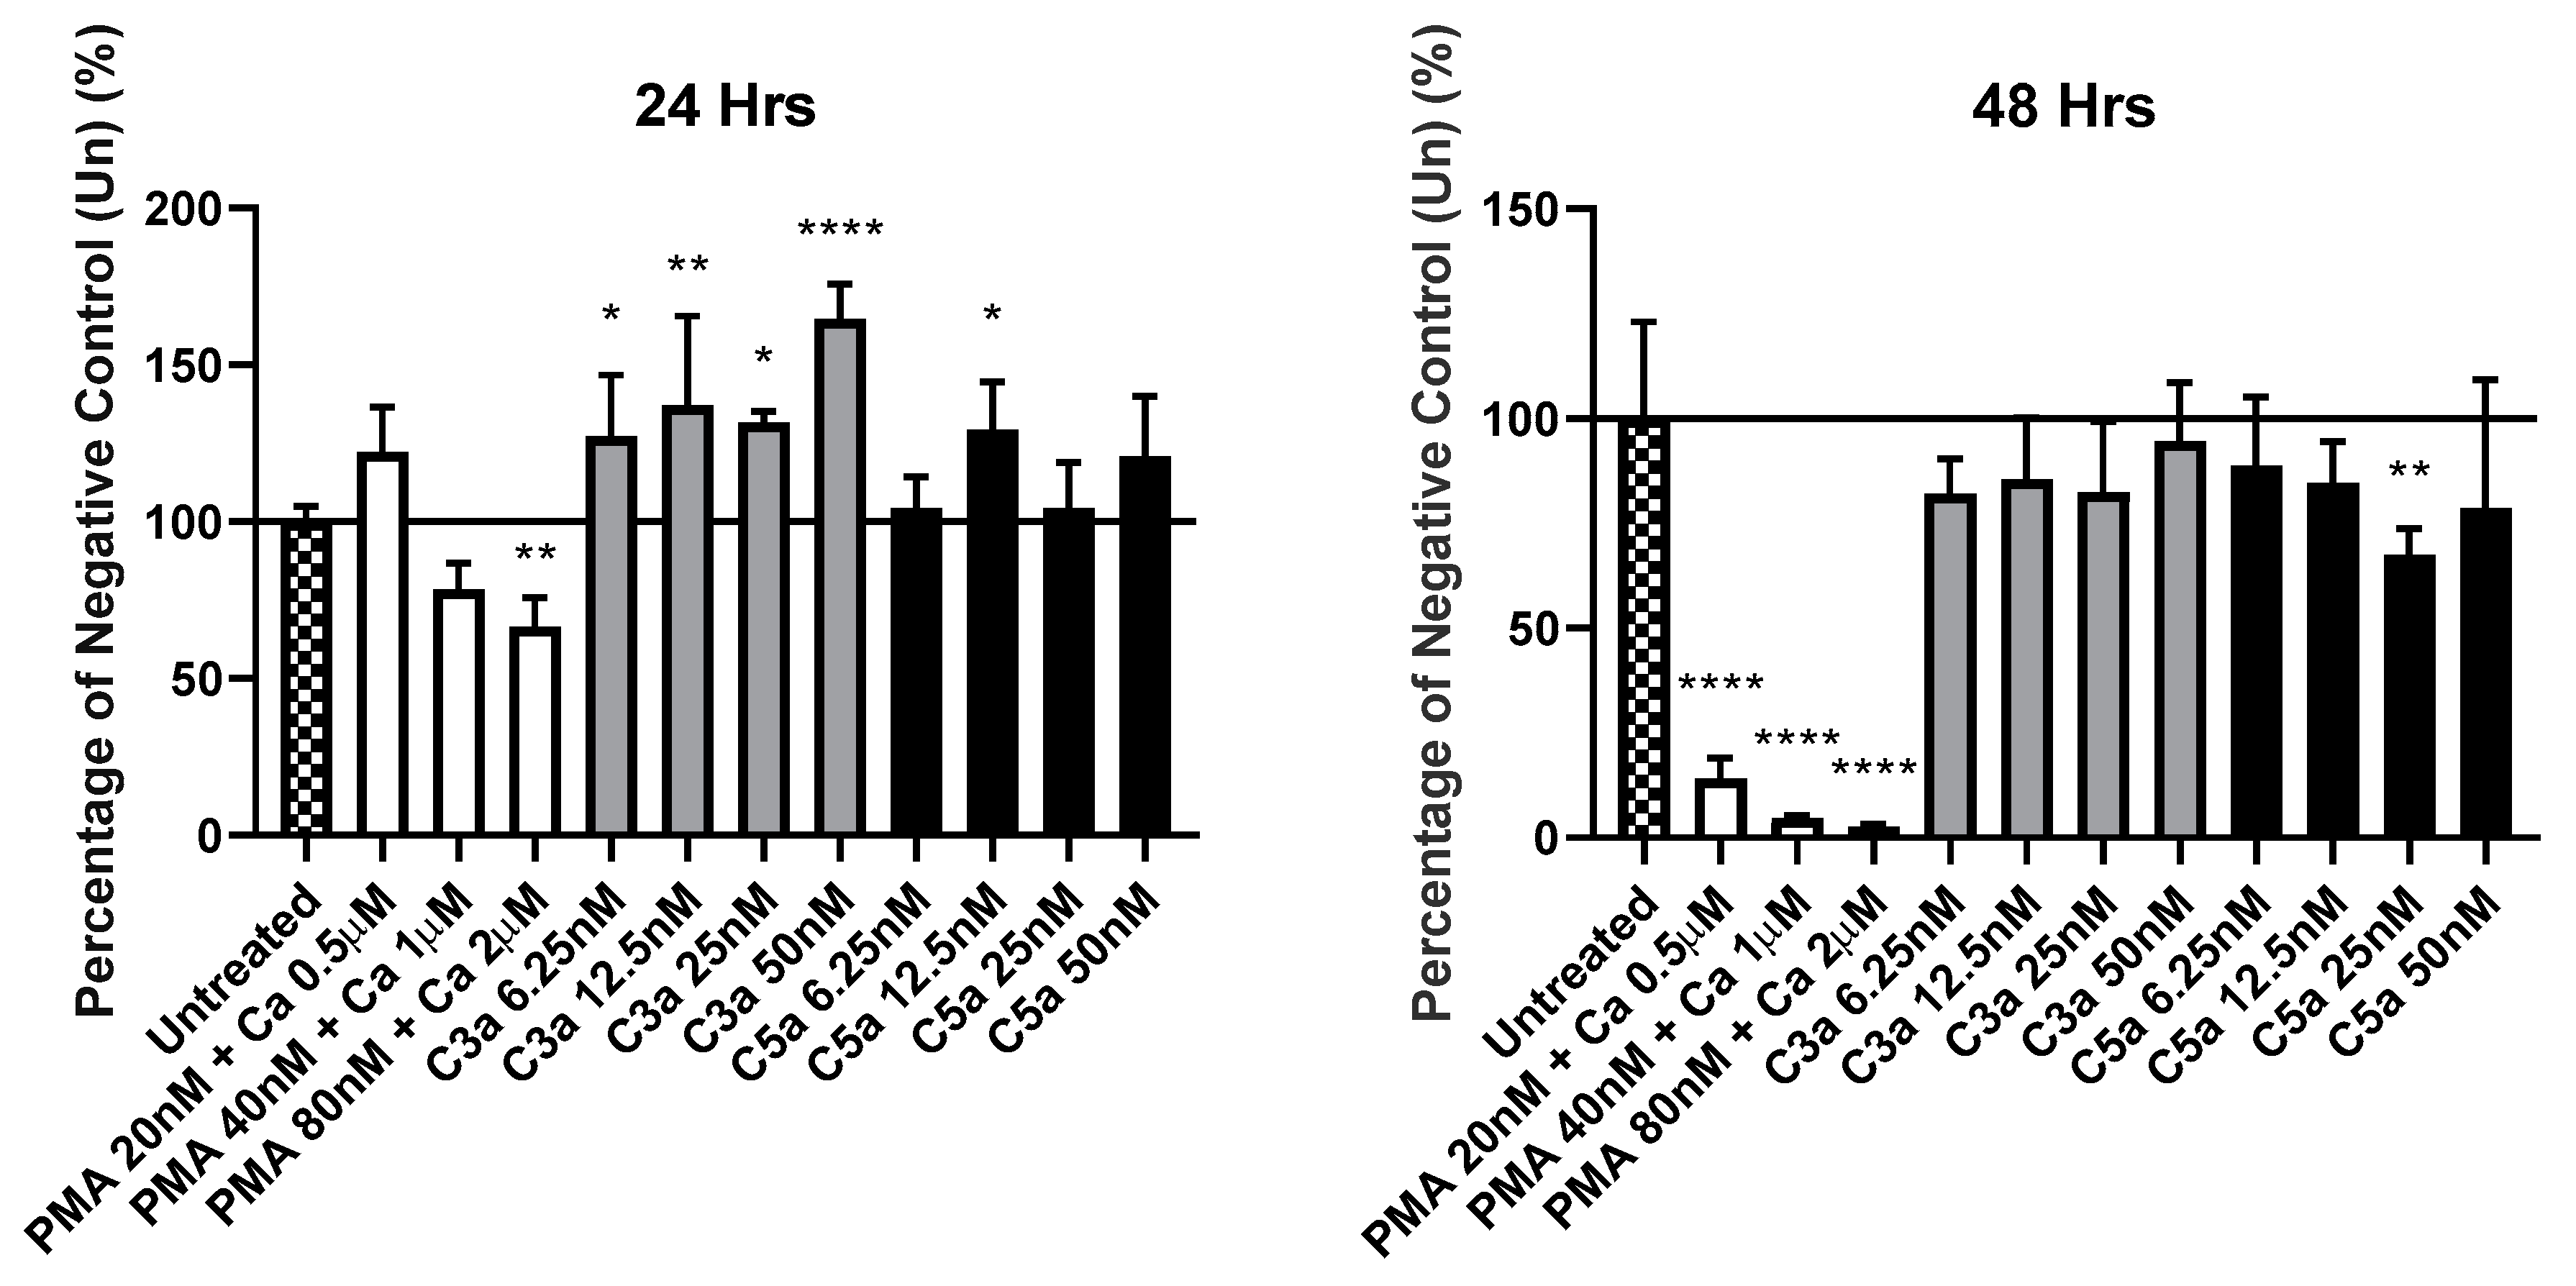
3.1. Exposure of KU812 Cells to Anaphylatoxins Shows No Overt Impact on Proliferation, or Viability
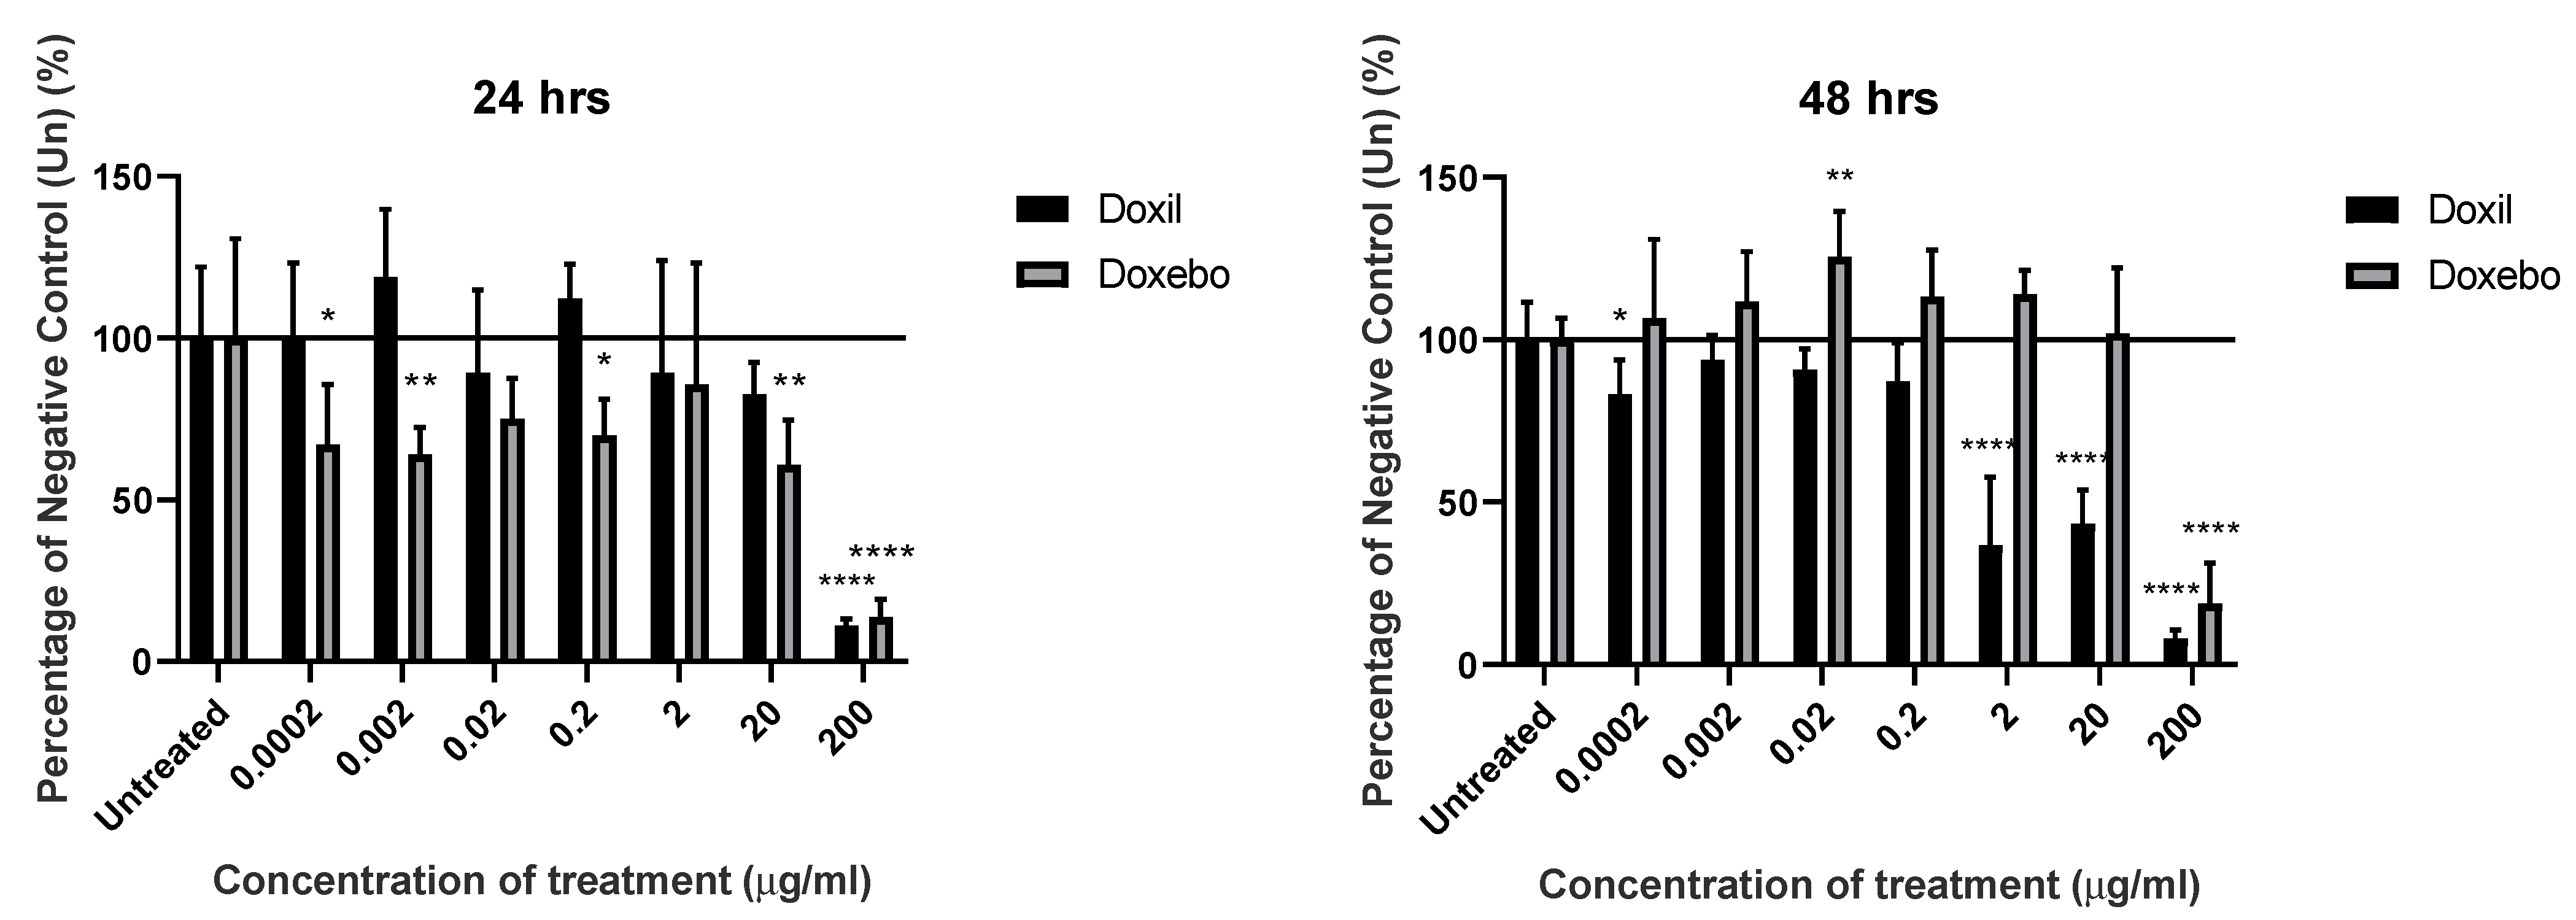
3.2. Impact on KU812 Viability Was Observed with Higher Concentrations of Liposomes
3.3. Cholesterol Content of Liposomes Had Little Effect on the Rate of Cell Death following Treatment
3.4. Incubation of KU812 Cells with Doxil, Doxebo, or Liposome Variants Leads to Varying Levels of Histamine Release
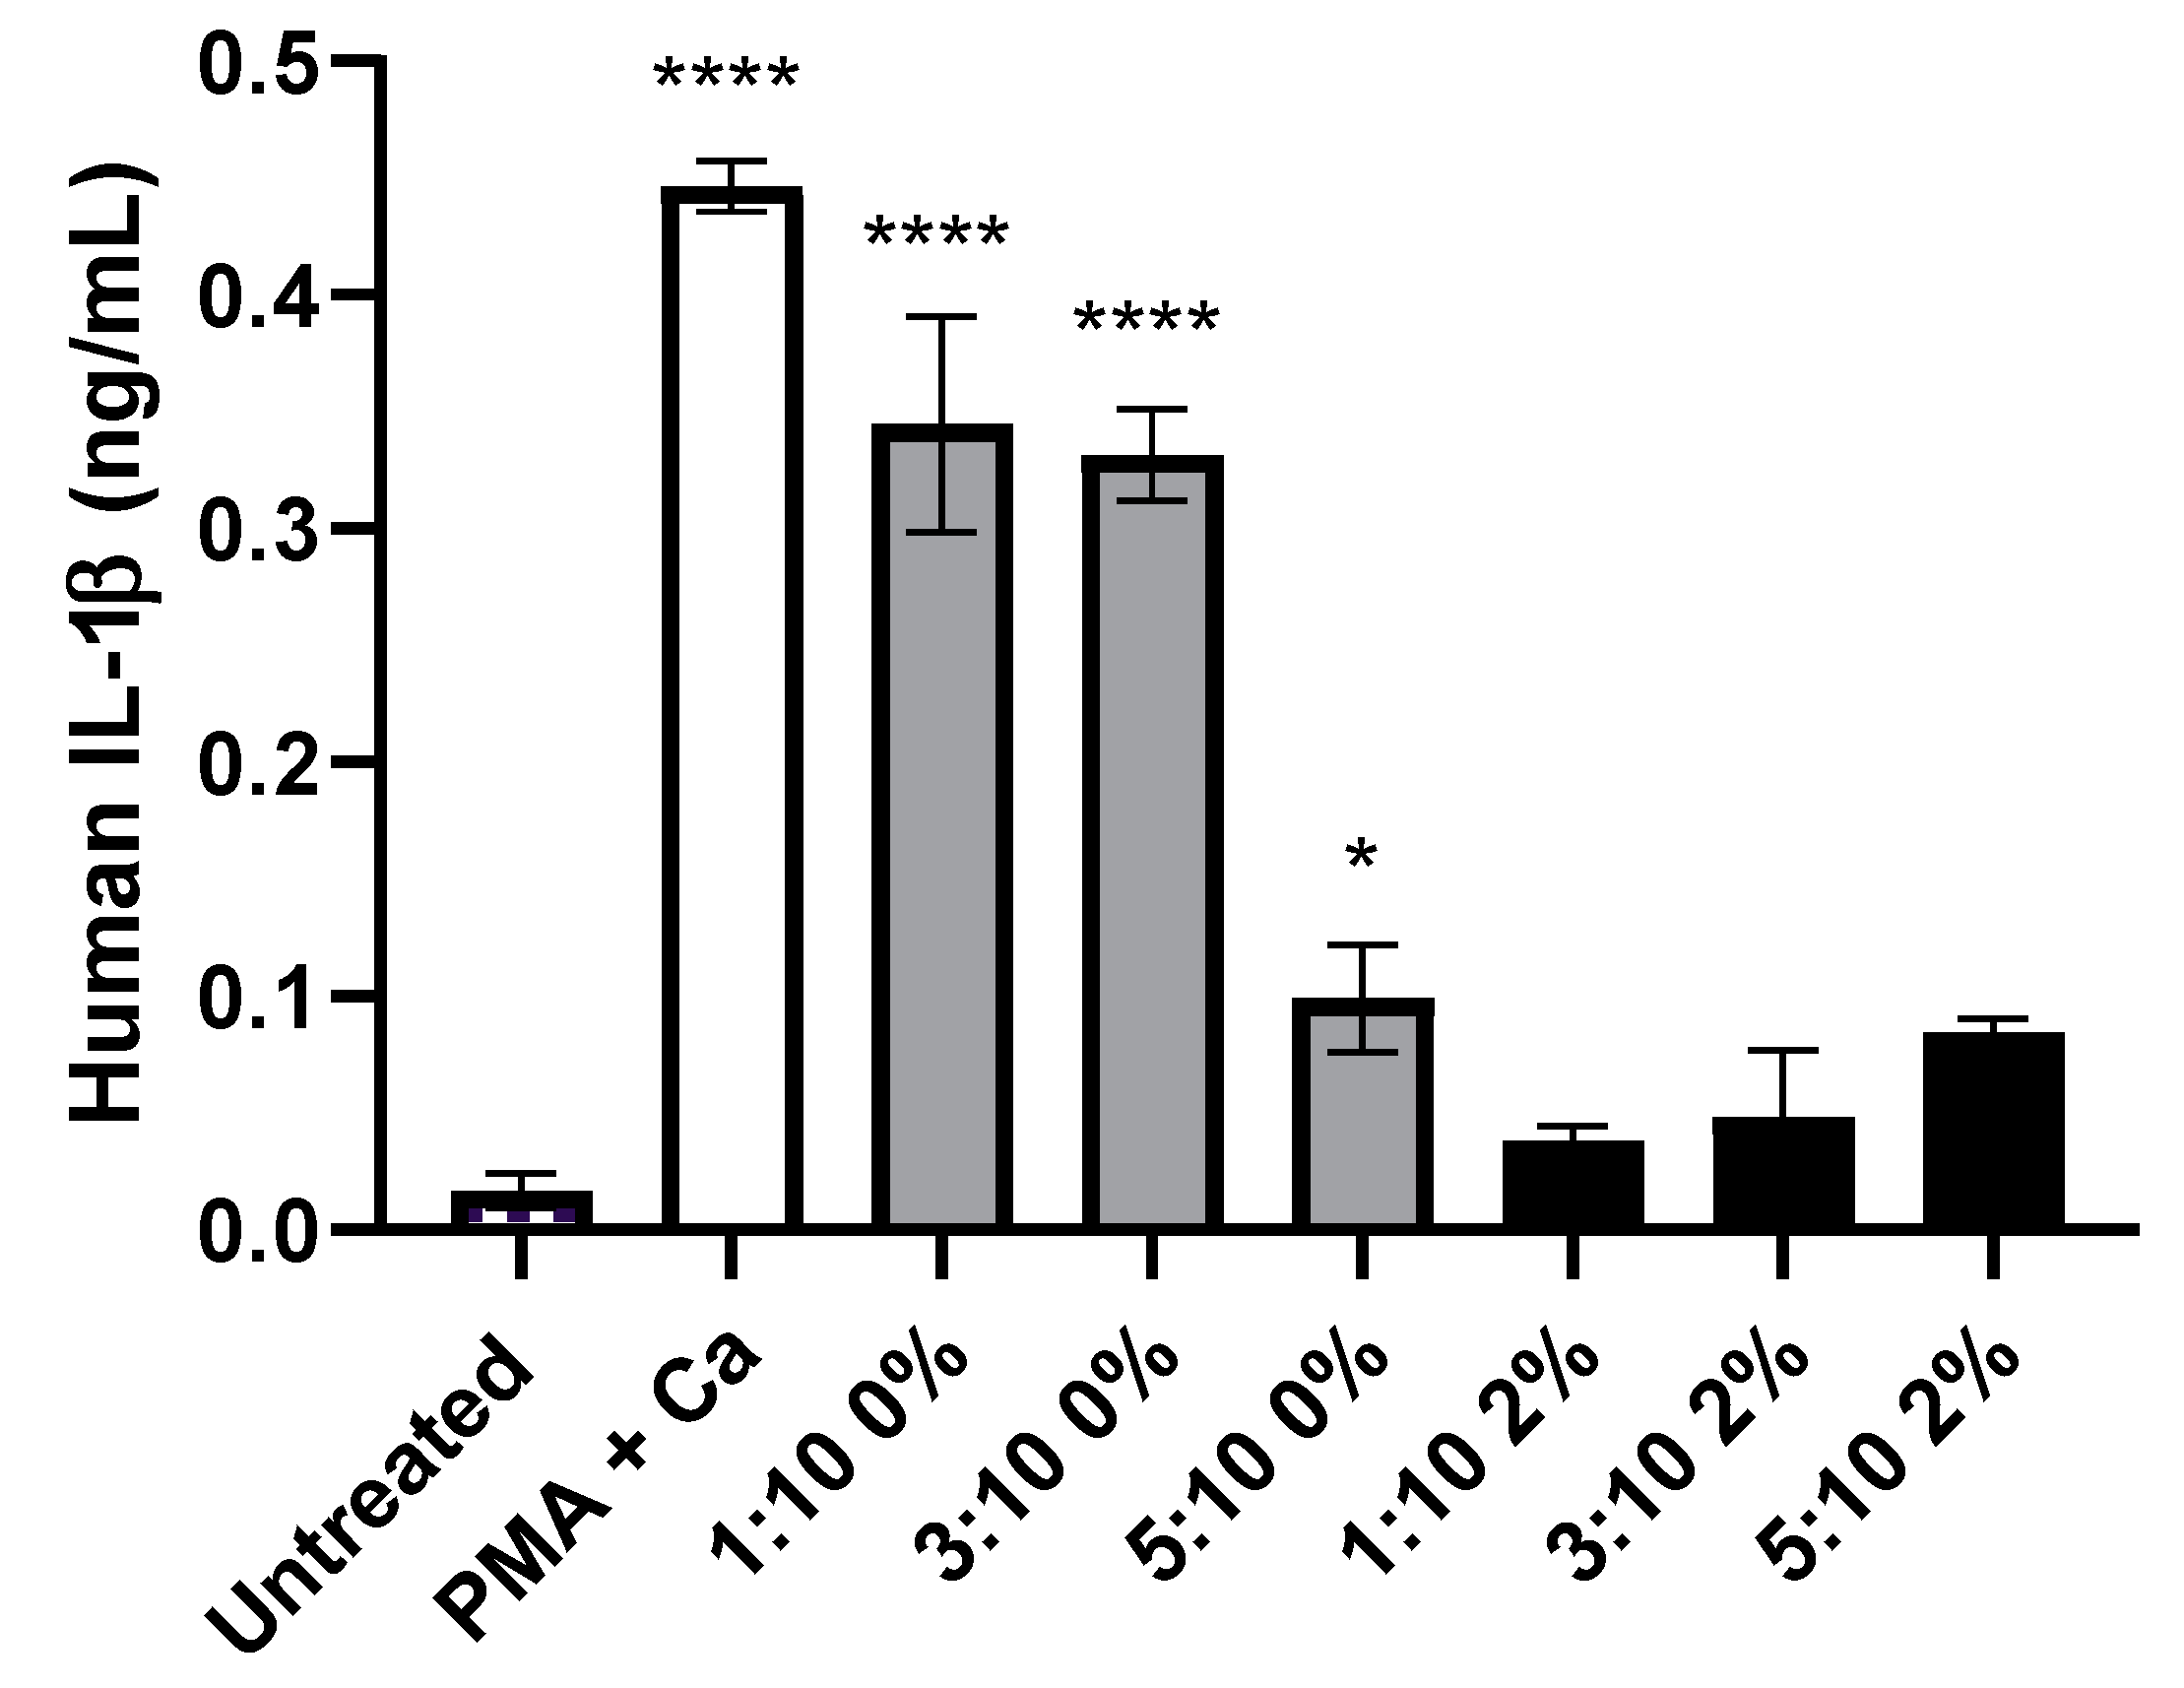
3.5. Liposome Variants without the Addition of PEG Induced Significant IL-1β Release, from KU812 Cells, Than Those with PEG Incorporated
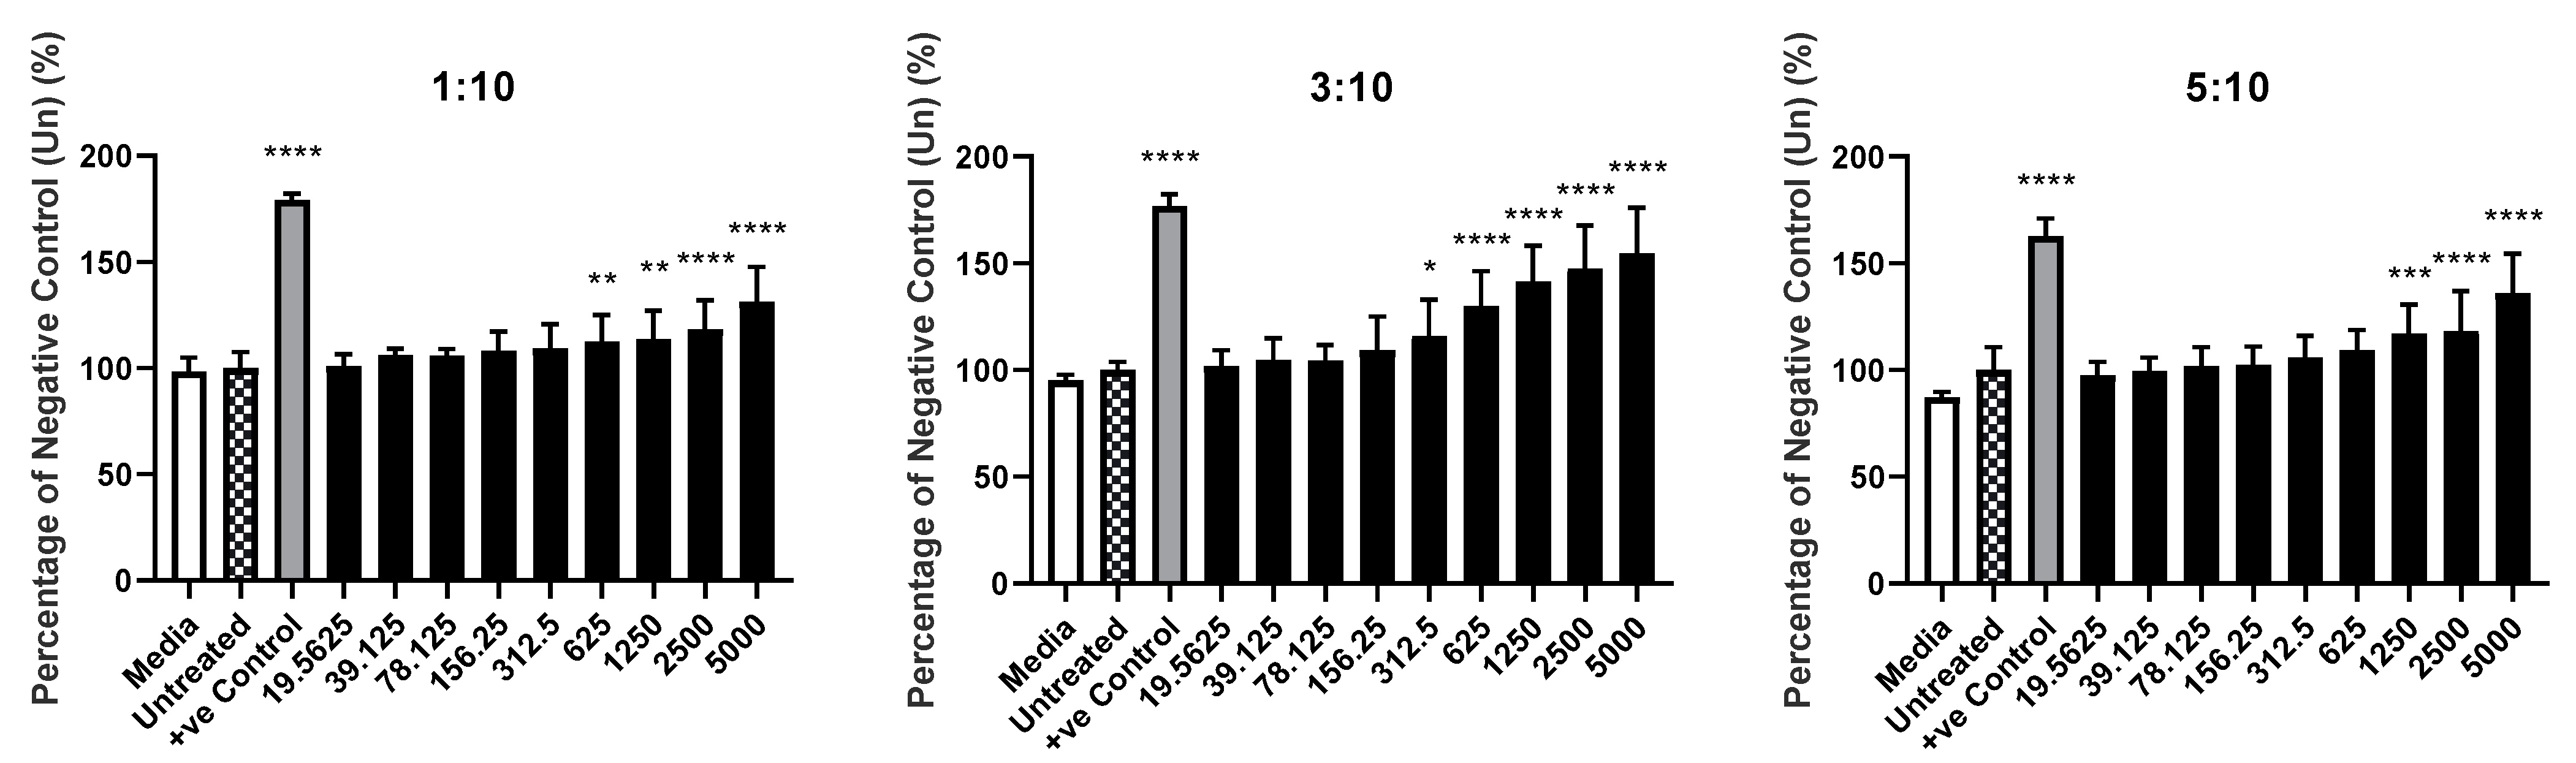
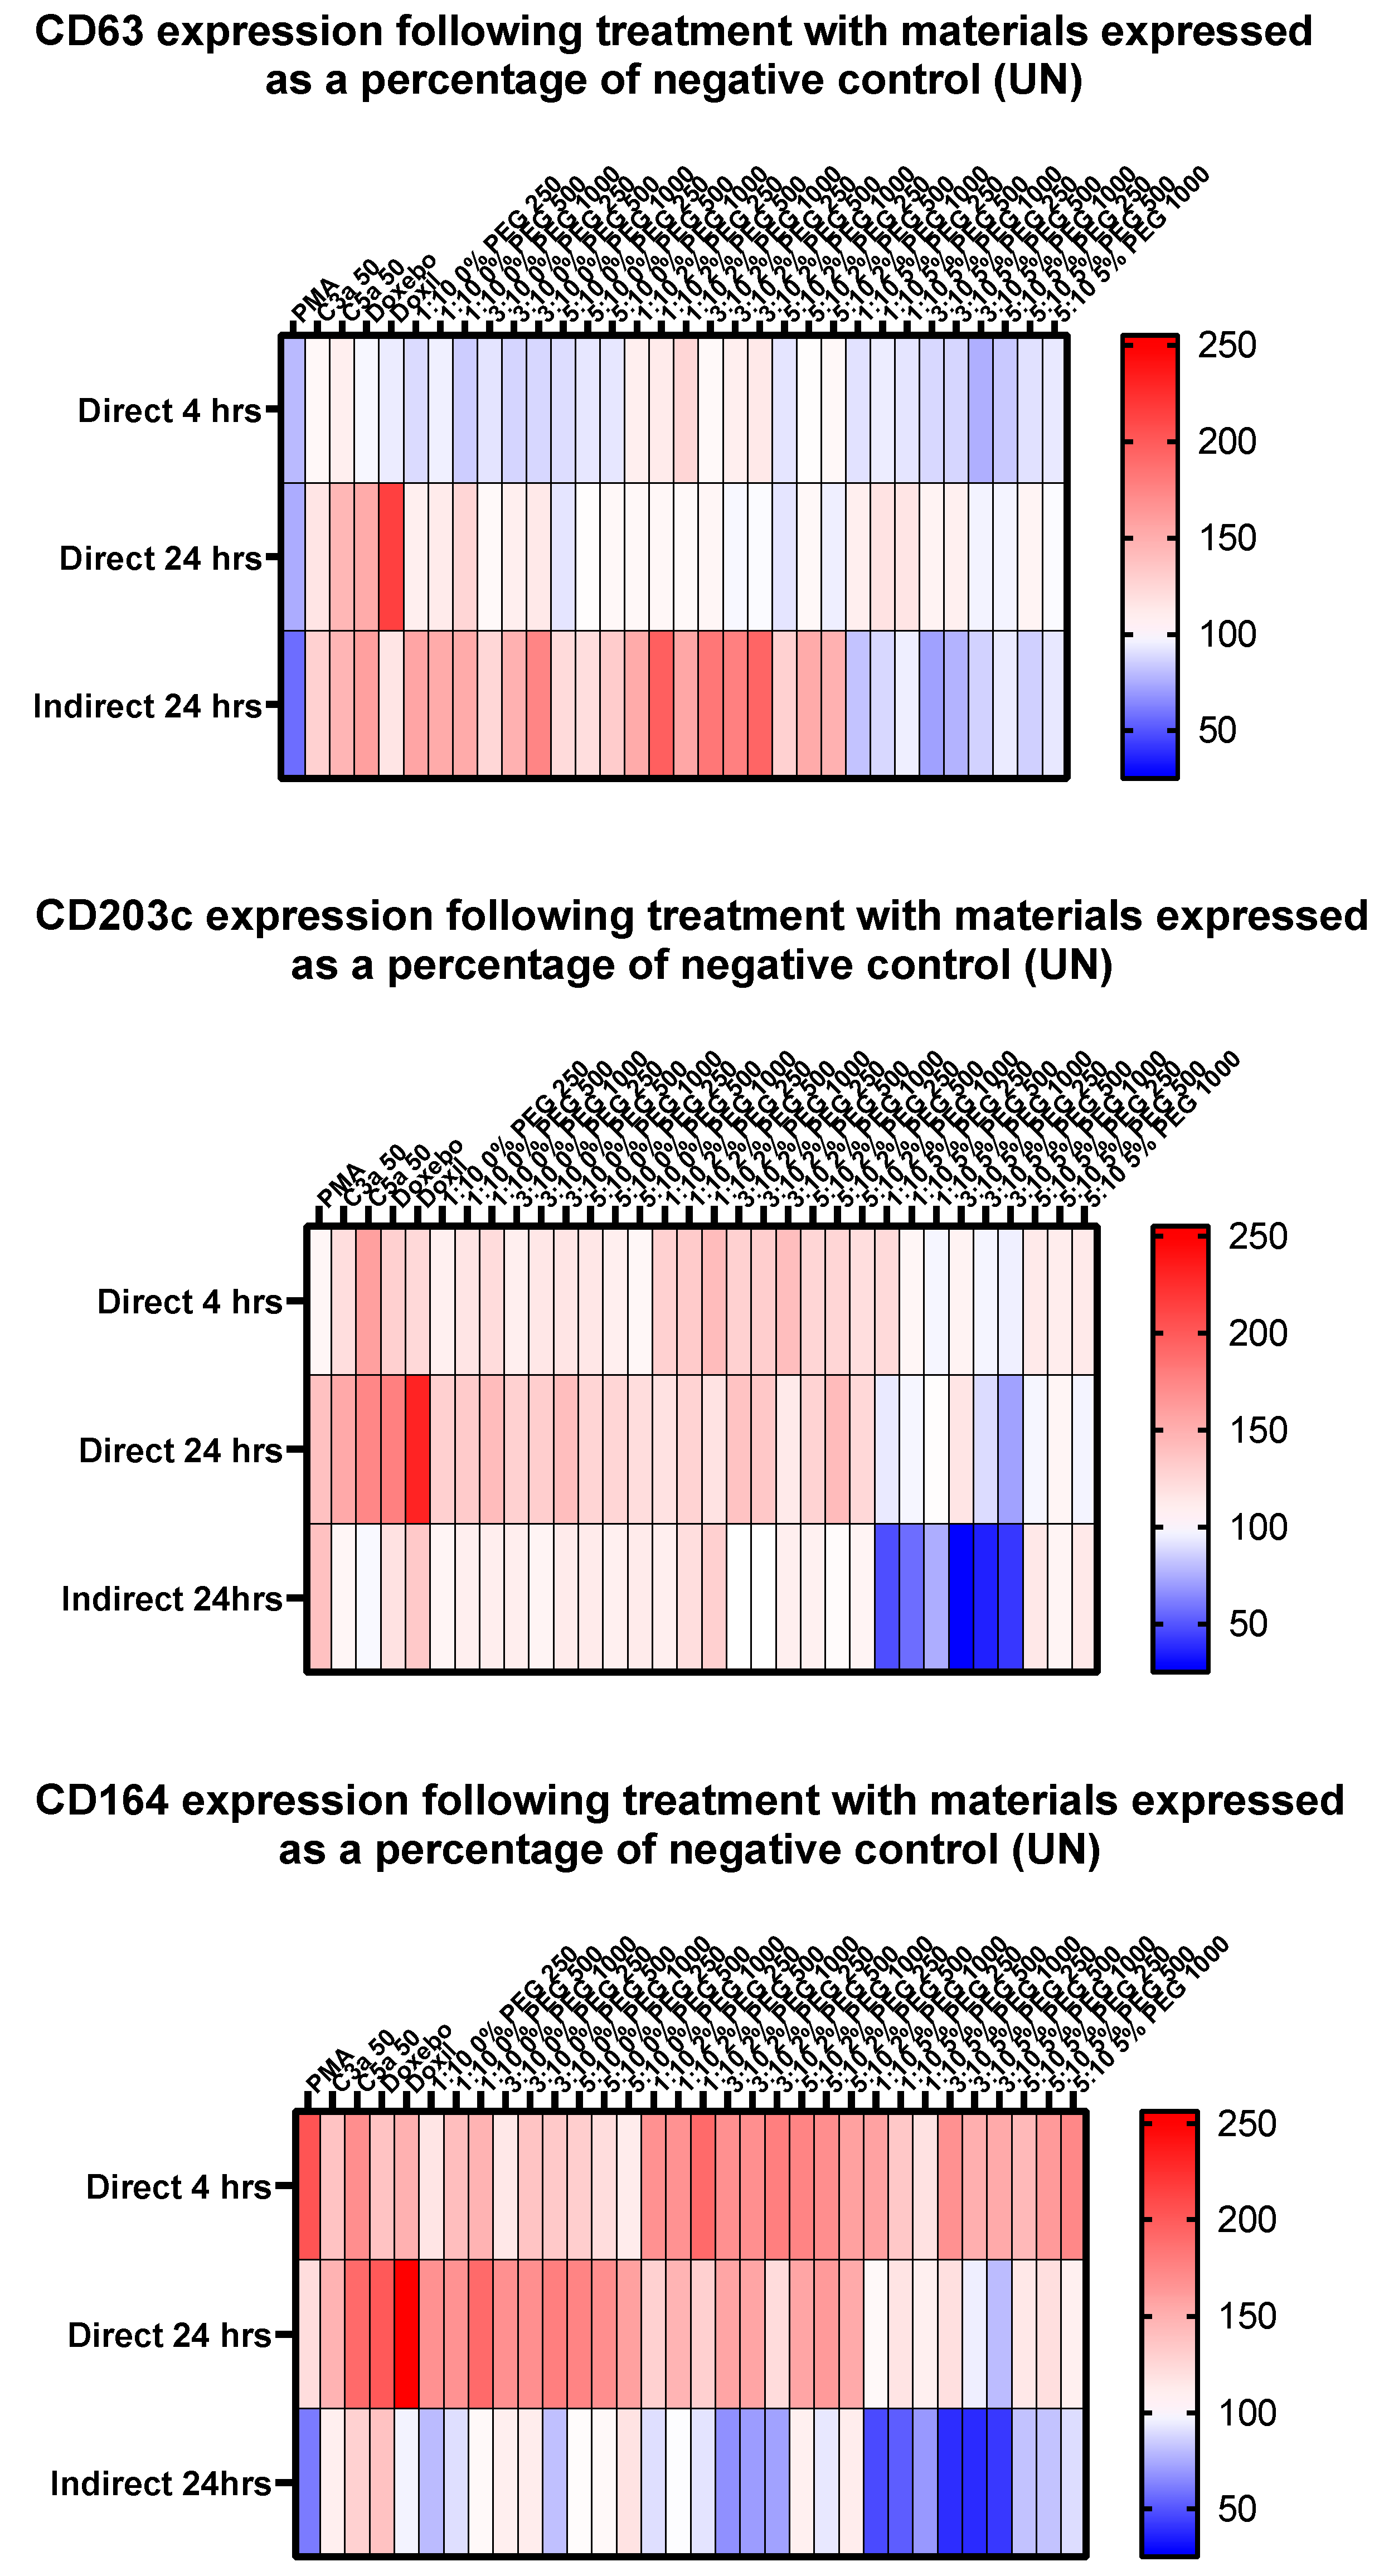
3.6. Distinct Basophil Activation Markers Exhibit Differing Patterns of Expression following Treatment with Liposome Variants
3.7. Association of Liposome Size, with Changes in Basophil Activation Markers
4. Discussion
5. Conclusions
Author Contributions
Funding
Institutional Review Board Statement
Data Availability Statement
Acknowledgments
Conflicts of Interest
Abbreviations
References
- Hoshyar, N.; Gray, S.; Han, H.; Bao, G. The effect of nanoparticle size on in vivo pharmacokinetics and cellular interaction. Nanomedicine 2016, 11, 673–692. [Google Scholar] [CrossRef] [PubMed] [Green Version]
- Bowman, D.M. More than a Decade On: Mapping Today’s Regulatory and Policy Landscapes Following the Publication of Nanoscience and Nanotechnologies: Opportunities and Uncertainties. NanoEthics 2017, 11, 169–186. [Google Scholar] [CrossRef]
- Bozzuto, G.; Molinari, A. Liposomes as nanomedical devices. Int. J. Nanomed. 2015, 10, 975–999. [Google Scholar] [CrossRef] [PubMed] [Green Version]
- Chatin, B.; Mével, M.; Devallière, J.; Dallet, L.; Haudebourg, T.; Peuziat, P.; Colombani, T.; Berchel, M.; Lambert, O.; Edelman, A.; et al. Liposome-based Formulation for Intracellular Delivery of Functional Proteins. Mol. Ther. Nucleic Acids 2015, 4, e244. [Google Scholar] [CrossRef] [PubMed]
- Thorn, C.F.; Oshiro, C.; Marsh, S.; Hernandez-Boussard, T.; McLeod, H.; Klein, T.E.; Altman, R.B. Doxorubicin pathways: Pharmacodynamics and adverse effects. Pharm. Genom. 2011, 21, 440–446. [Google Scholar] [CrossRef] [PubMed]
- Duggan, S.T.; Keating, G.M. Pegylated Liposomal Doxorubicin. Drugs 2011, 71, 2531–2558. [Google Scholar] [CrossRef]
- Batist, G.; Ramakrishnan, G.; Rao, C.S.; Chandrasekharan, A.; Gutheil, J.; Guthrie, T.; Shah, P.; Khojasteh, A.; Nair, M.K.; Hoelzer, K.; et al. Reduced cardiotoxicity and preserved antitumor efficacy of liposome-encapsulated doxorubicin and cyclophosphamide compared with conventional doxorubicin and cyclophosphamide in a randomized, multicenter trial of metastatic breast cancer. J. Clin. Oncol. 2001, 19, 1444–1454. [Google Scholar] [CrossRef]
- O’Brien, M.E.R.; Wigler, N.; Inbar, M.; Rosso, R.; Grischke, E.; Santoro, A.; Catane, R.; Kieback, D.G.; Tomczak, P.; Ackland, S.P.; et al. Reduced cardiotoxicity and comparable efficacy in a phase IIItrial of pegylated liposomal doxorubicin HCl(CAELYX™/Doxil®) versus conventional doxorubicin forfirst-line treatment of metastatic breast cancer. Ann. Oncol. 2004, 15, 440–449. [Google Scholar] [CrossRef]
- Xing, H.; Hwang, K.; Lu, Y. Recent Developments of Liposomes as Nanocarriers for Theranostic Applications. Theranostics 2016, 6, 1336–1352. [Google Scholar] [CrossRef]
- Northfelt, D.W.; Martin, F.J.; Working, P.; Volberding, P.A.; Russell, J.; Newman, M.; Amantea, M.A.; Kaplan, L.D. Doxorubicin encapsulated in liposomes containing surface-bound polyethylene glycol: Pharmacokinetics, tumor localization, and safety in patients with AIDS-related Kaposi’s sarcoma. J. Clin. Pharmacol. 1996, 36, 55–63. [Google Scholar] [CrossRef]
- Ishida, T.; Kirchmeier, M.J.; Moase, E.H.; Zalipsky, S.; Allen, T.M. Targeted delivery and triggered release of liposomal doxorubicin enhances cytotoxicity against human B lymphoma cells. Biochim. Biophys. Acta 2001, 1515, 144–158. [Google Scholar] [CrossRef] [Green Version]
- Ulrich, A.S. Biophysical aspects of using liposomes as delivery vehicles. Biosci. Rep. 2002, 22, 129–150. [Google Scholar] [CrossRef]
- Soundararajan, A.; Bao, A.; Phillips, W.T.; Perez, R., 3rd; Goins, B.A. [(186)Re] Liposomal doxorubicin (Doxil): In vitro stability, pharmacokinetics, imaging and biodistribution in a head and neck squamous cell carcinoma xenograft model. Nucl. Med. Biol. 2009, 36, 515–524. [Google Scholar] [CrossRef] [Green Version]
- Sharma, L.R.; Subedi, A.; Shah, B.K. Anaphylaxis to pegylated liposomal Doxorubicin: A case report. West Indian Med. J. 2014, 63, 376–377. [Google Scholar]
- Kozma, G.T.; Mészáros, T.; Vashegyi, I.; Fülöp, T.; Örfi, E.; Dézsi, L.; Rosivall, L.; Bavli, Y.; Urbanics, R.; Mollnes, T.E.; et al. Pseudo-anaphylaxis to Polyethylene Glycol (PEG)-Coated Liposomes: Roles of Anti-PEG IgM and Complement Activation in a Porcine Model of Human Infusion Reactions. ACS Nano 2019, 13, 9315–9324. [Google Scholar] [CrossRef] [Green Version]
- Chonn, A.; Cullis, P.R.; Devine, D.V. The role of surface charge in the activation of the classical and alternative pathways of complement by liposomes. J. Immunol. 1991, 146, 4234–4241. [Google Scholar]
- Bradley, A.J.; Brooks, D.E.; Norris-Jones, R.; Devine, D.V. C1q binding to liposomes is surface charge dependent and is inhibited by peptides consisting of residues 14-26 of the human C1qA chain in a sequence independent manner. Biochim. Biophys. Acta 1999, 1418, 19–30. [Google Scholar] [CrossRef] [Green Version]
- Moein Moghimi, S.; Hamad, I.; Bünger, R.; Andresen, T.L.; Jørgensen, K.; Christy Hunter, A.; Baranji, L.; Rosivall, L.; Szebeni, J. Activation of the Human Complement System by Cholesterol-Rich and PEGylated Liposomes—Modulation of Cholesterol-Rich Liposome-Mediated Complement Activation by Elevated Serum LDL and HDL Levels. J. Liposome Res. 2006, 16, 167–174. [Google Scholar] [CrossRef]
- Pham, C.T.; Mitchell, L.M.; Huang, J.L.; Lubniewski, C.M.; Schall, O.F.; Killgore, J.K.; Pan, D.; Wickline, S.A.; Lanza, G.M.; Hourcade, D.E. Variable antibody-dependent activation of complement by functionalized phospholipid nanoparticle surfaces. J. Biol. Chem. 2011, 286, 123–130. [Google Scholar] [CrossRef] [Green Version]
- Szeto, G.L.; Lavik, E.B. Materials design at the interface of nanoparticles and innate immunity. J. Mater. Chem. B 2016, 4, 1610–1618. [Google Scholar] [CrossRef] [Green Version]
- Benasutti, H.; Wang, G.; Vu, V.P.; Scheinman, R.; Groman, E.; Saba, L.; Simberg, D. Variability of Complement Response toward Preclinical and Clinical Nanocarriers in the General Population. Bioconjug. Chem. 2017, 28, 2747–2755. [Google Scholar] [CrossRef] [PubMed]
- Dunkelberger, J.R.; Song, W.-C. Complement and its role in innate and adaptive immune responses. Cell Res. 2010, 20, 34–50. [Google Scholar] [CrossRef] [PubMed]
- Jenkin, C.R.; Rowley, D. The role of opsonins in the clearance of living and inert particles by cells of the reticuloendothelial system. J. Exp. Med. 1961, 114, 363–374. [Google Scholar] [CrossRef] [PubMed] [Green Version]
- Mortimer, G.M.; Butcher, N.J.; Musumeci, A.W.; Deng, Z.J.; Martin, D.J.; Minchin, R.F. Cryptic epitopes of albumin determine mononuclear phagocyte system clearance of nanomaterials. ACS Nano 2014, 8, 3357–3366. [Google Scholar] [CrossRef] [PubMed]
- Ebert, R.; Florey, H. The extravascular development of the monocyte observed in vivo. Br. J. Exp. Pathol. 1939, 20, 342. [Google Scholar]
- Dou, H.; Grotepas, C.B.; McMillan, J.M.; Destache, C.; Chaubal, M.; Werling, J.; Kipp, J.; Rabinow, B.; Gendelman, H.E. Macrophage delivery of nanoformulated antiretroviral drug to the brain in a murine model of neuroAIDS. J. Immunol. 2009, 183, 661–669. [Google Scholar] [CrossRef] [Green Version]
- Griffiths, G.; Nyström, B.; Sable, S.B.; Khuller, G.K. Nanobead-based interventions for the treatment and prevention of tuberculosis. Nat. Rev. Microbiol. 2010, 8, 827–834. [Google Scholar] [CrossRef]
- Gupta, S.; Pal, A.; Vyas, S.P. Drug delivery strategies for therapy of visceral leishmaniasis. Expert Opin. Drug Deliv. 2010, 7, 371–402. [Google Scholar] [CrossRef]
- Moghimi, S.; Parhamifar, L.; Ahmadvand, D.; Wibroe, P.; Andresen, T.; Farhangrazi, Z.; Hunter, A. Particulate systems for targeting of macrophages: Basic and therapeutic concepts. J. Innate Immun. 2012, 4, 509–528. [Google Scholar] [CrossRef]
- Harris, J.M.; Martin, N.E.; Modi, M. Pegylation: A novel process for modifying pharmacokinetics. Clin. Pharm. 2001, 40, 539–551. [Google Scholar] [CrossRef]
- Owens, D.E., 3rd; Peppas, N.A. Opsonization, biodistribution, and pharmacokinetics of polymeric nanoparticles. Int. J. Pharm. 2006, 307, 93–102. [Google Scholar] [CrossRef]
- Immordino, M.L.; Dosio, F.; Cattel, L. Stealth liposomes: Review of the basic science, rationale, and clinical applications, existing and potential. Int. J. Nanomed. 2006, 1, 297–315. [Google Scholar]
- Veronese, F.M.; Mero, A. The impact of PEGylation on biological therapies. BioDrugs 2008, 22, 315–329. [Google Scholar] [CrossRef]
- Neun, B.W.; Barenholz, Y.; Szebeni, J.; Dobrovolskaia, M.A. Understanding the Role of Anti-PEG Antibodies in the Complement Activation by Doxil in Vitro. Molecules 2018, 23, 1700. [Google Scholar] [CrossRef]
- Milla, P.; Dosio, F.; Cattel, L. PEGylation of proteins and liposomes: A powerful and flexible strategy to improve the drug delivery. Curr. Drug Metab. 2012, 13, 105–119. [Google Scholar] [CrossRef] [Green Version]
- Mohamed, M.; Abu Lila, A.S.; Shimizu, T.; Alaaeldin, E.; Hussein, A.; Sarhan, H.A.; Szebeni, J.; Ishida, T. PEGylated liposomes: Immunological responses. Sci. Technol. Adv. Mater. 2019, 20, 710–724. [Google Scholar] [CrossRef] [Green Version]
- Szebeni, J.; Fontana, J.L.; Wassef, N.M.; Mongan, P.D.; Morse, D.S.; Dobbins, D.E.; Stahl, G.L.; Bünger, R.; Alving, C.R. Hemodynamic changes induced by liposomes and liposome-encapsulated hemoglobin in pigs: A model for pseudoallergic cardiopulmonary reactions to liposomes. Role of complement and inhibition by soluble CR1 and anti-C5a antibody. Circulation 1999, 99, 2302–2309. [Google Scholar] [CrossRef] [Green Version]
- Szebeni, J. Complement activation-related pseudoallergy: A new class of drug-induced acute immune toxicity. Toxicology 2005, 216, 106–121. [Google Scholar] [CrossRef]
- Szebeni, J.; Fontana, J.; Wassef, N.; Mongan, P.; Morse, D.; Stahl, G.; Bünger, R.; Alving, C. Liposome-induced and complement-mediated cardiopulmonary distress in pigs as a model of pseudo-allergic reactions to liposomal drugs. Mol. Immunol. 1998, 6, 401. [Google Scholar] [CrossRef]
- Szebeni, J. Complement activation-related pseudoallergy caused by liposomes, micellar carriers of intravenous drugs, and radiocontrast agents. Crit. Rev. Ther. Drug Carr. Syst. 2001, 18, 567–606. [Google Scholar] [CrossRef]
- Liptrott, N.J.; Giardiello, M.; McDonald, T.O.; Rannard, S.P.; Owen, A. Assessment of interactions of efavirenz solid drug nanoparticles with human immunological and haematological systems. J. Nanobiotechnol. 2018, 16, 22. [Google Scholar] [CrossRef] [PubMed] [Green Version]
- Szebeni, J. Hypersensitivity reactions to radiocontrast media: The role of complement activation. Curr. Allergy Asthma Rep. 2004, 4, 25–30. [Google Scholar] [CrossRef] [PubMed]
- Karasuyama, H.; Mukai, K.; Tsujimura, Y.; Obata, K. Newly discovered roles for basophils: A neglected minority gains new respect. Nat. Rev. Immunol. 2009, 9, 9–13. [Google Scholar] [CrossRef] [PubMed]
- Sokol, C.L.; Chu, N.Q.; Yu, S.; Nish, S.A.; Laufer, T.M.; Medzhitov, R. Basophils function as antigen-presenting cells for an allergen-induced T helper type 2 response. Nat. Immunol. 2009, 10, 713–720. [Google Scholar] [CrossRef] [PubMed]
- Yoshimoto, T.; Yasuda, K.; Tanaka, H.; Nakahira, M.; Imai, Y.; Fujimori, Y.; Nakanishi, K. Basophils contribute to TH2-IgE responses in vivo via IL-4 production and presentation of peptide–MHC class II complexes to CD4+ T cells. Nat. Immunol. 2009, 10, 706–712. [Google Scholar] [CrossRef]
- Blom, T.; Huang, R.; Aveskogh, M.; Nilsson, K.; Hellman, L. Phenotypic characterization of KU812, a cell line identified as an immature human basophilic leukocyte. Eur. J. Immunol. 1992, 22, 2025–2032. [Google Scholar] [CrossRef]
- Hosoda, M.; Yamaya, M.; Suzuki, T.; Yamada, N.; Kamanaka, M.; Sekizawa, K.; Butterfield, J.H.; Watanabe, T.; Nishimura, H.; Sasaki, H. Effects of rhinovirus infection on histamine and cytokine production by cell lines from human mast cells and basophils. J. Immunol. 2002, 169, 1482–1491. [Google Scholar] [CrossRef] [Green Version]
- Sokol, C.L.; Medzhitov, R. Emerging functions of basophils in protective and allergic immune responses. Mucosal Immunol. 2010, 3, 129–137. [Google Scholar] [CrossRef] [Green Version]
- MacGlashan, D., Jr. Expression of CD203c and CD63 in human basophils: Relationship to differential regulation of piecemeal and anaphylactic degranulation processes. Clin. Exp. Allergy 2010, 40, 1365–1377. [Google Scholar] [CrossRef] [Green Version]
- McGowan, E.C.; Saini, S. Update on the performance and application of basophil activation tests. Curr. Allergy Asthma Rep. 2013, 13, 101–109. [Google Scholar] [CrossRef] [Green Version]
- Netchiporouk, E.; Moreau, L.; Rahme, E.; Maurer, M.; Lejtenyi, D.; Ben-Shoshan, M. Positive CD63 Basophil Activation Tests Are Common in Children with Chronic Spontaneous Urticaria and Linked to High Disease Activity. Int. Arch. Allergy Immunol. 2016, 171, 81–88. [Google Scholar] [CrossRef]
- Hemmings, O.; Kwok, M.; McKendry, R.; Santos, A.F. Basophil Activation Test: Old and New Applications in Allergy. Curr. Allergy Asthma Rep. 2018, 18, 77. [Google Scholar] [CrossRef] [Green Version]
- Clogston, J.D.; Patri, A.K. Zeta potential measurement. Methods Mol. Biol. 2011, 697, 63–70. [Google Scholar]
- Harvie, P.; Wong, F.M.; Bally, M.B. Use of poly(ethylene glycol)-lipid conjugates to regulate the surface attributes and transfection activity of lipid-DNA particles. J. Pharm. Sci. 2000, 89, 652–663. [Google Scholar] [CrossRef]
- Kulkarni, J.A.; Witzigmann, D.; Leung, J.; Tam, Y.Y.C.; Cullis, P.R. On the role of helper lipids in lipid nanoparticle formulations of siRNA. Nanoscale 2019, 11, 21733–21739. [Google Scholar] [CrossRef]
- Liang, X.; Mao, G.; Ng, K.Y. Mechanical properties and stability measurement of cholesterol-containing liposome on mica by atomic force microscopy. J. Colloid Interface Sci. 2004, 278, 53–62. [Google Scholar] [CrossRef]
- Tseng, L.-P.; Liang, H.-J.; Chung, T.-W.; Huang, Y.-Y.; Liu, D.-Z. Liposomes incorporated with cholesterol for drug release triggered by magnetic field. J. Med. Biol. Eng. 2007, 27, 29–34. [Google Scholar]
- Marsh, D. Elastic constants of polymer-grafted lipid membranes. Biophys. J. 2001, 81, 2154–2162. [Google Scholar] [CrossRef] [Green Version]
- Briuglia, M.-L.; Rotella, C.; McFarlane, A.; Lamprou, D.A. Influence of cholesterol on liposome stability and on in vitro drug release. Drug Deliv. Transl. Res. 2015, 5, 231–242. [Google Scholar] [CrossRef] [Green Version]
- Garbuzenko, O.; Barenholz, Y.; Priev, A. Effect of grafted PEG on liposome size and on compressibility and packing of lipid bilayer. Chem. Phys. Lipids 2005, 135, 117–129. [Google Scholar] [CrossRef]
- Borriello, F.; Iannone, R.; Marone, G. Histamine Release from Mast Cells and Basophils. Handb. Exp. Pharmacol. 2017, 241, 121–139. [Google Scholar] [PubMed]
- Yanase, Y.; Matsuo, Y.; Kawaguchi, T.; Ishii, K.; Tanaka, A.; Iwamoto, K.; Takahagi, S.; Hide, M. Activation of Human Peripheral Basophils in Response to High IgE Antibody Concentrations without Antigens. Int. J. Mol. Sci. 2018, 20, 45. [Google Scholar] [CrossRef] [PubMed] [Green Version]
- Zwirner, J.; Götze, O.; Begemann, G.; Kapp, A.; Kirchhoff, K.; Werfel, T. Evaluation of C3a receptor expression on human leucocytes by the use of novel monoclonal antibodies. Immunology 1999, 97, 166–172. [Google Scholar] [CrossRef] [PubMed]
- Kurimoto, Y.; de Weck, A.L.; Dahinden, C.A. Interleukin 3-dependent mediator release in basophils triggered by C5a. J. Exp. Med. 1989, 170, 467–479. [Google Scholar] [CrossRef] [PubMed] [Green Version]
- Bischoff, S.C.; de Weck, A.L.; Dahinden, C.A. Interleukin 3 and granulocyte/macrophage-colony-stimulating factor render human basophils responsive to low concentrations of complement component C3a. Proc. Natl. Acad. Sci. USA 1990, 87, 6813–6817. [Google Scholar] [CrossRef] [PubMed] [Green Version]
- Pecaric-Petkovic, T.; Didichenko, S.A.; Kaempfer, S.; Spiegl, N.; Dahinden, C.A. Human basophils and eosinophils are the direct target leukocytes of the novel IL-1 family member IL-33. Blood 2009, 113, 1526–1534. [Google Scholar] [CrossRef]
- Takeuchi, O.; Akira, S. Pattern recognition receptors and inflammation. Cell 2010, 140, 805–820. [Google Scholar] [CrossRef] [Green Version]
- Lopez-Castejon, G.; Brough, D. Understanding the mechanism of IL-1β secretion. Cytokine Growth Factor Rev. 2011, 22, 189–195. [Google Scholar] [CrossRef]
- Kelley, N.; Jeltema, D.; Duan, Y.; He, Y. The NLRP3 Inflammasome: An Overview of Mechanisms of Activation and Regulation. Int. J. Mol. Sci. 2019, 20, 3328. [Google Scholar] [CrossRef] [Green Version]
- Chen, Y.; Ma, Y.; Feng, J.J.; Wang, Y.H.; Li, T.F.; Nurmi, K.; Eklund, K.K.; Wen, J.G. Histamine H3 Receptor Signaling Regulates the NLRP3 Inflammasome Activation in C2C12 Myocyte During Myogenic Differentiation. Front. Pharmacol. 2021, 12, 599393. [Google Scholar] [CrossRef]
- Tahtinen, S.; Tong, A.-J.; Himmels, P.; Oh, J.; Paler-Martinez, A.; Kim, L.; Wichner, S.; Oei, Y.; McCarron, M.J.; Freund, E.C.; et al. IL-1 and IL-1ra are key regulators of the inflammatory response to RNA vaccines. Nat. Immunol. 2022, 23, 532–542. [Google Scholar] [CrossRef]
- Barg, W.; Medrala, W.; Wolanczyk-Medrala, A. Exercise-induced anaphylaxis: An update on diagnosis and treatment. Curr. Allergy Asthma Rep. 2011, 11, 45–51. [Google Scholar] [CrossRef] [Green Version]
- Wolanczyk-Medrala, A.; Barg, W.; Medrala, W.; Medrala, W. CD164 as a Basophil Activation Marker. Curr. Pharm. Des. 2011, 17, 3786–3796. [Google Scholar] [CrossRef]
- Hennersdorf, F.; Florian, S.; Jakob, A.; Baumgärtner, K.; Sonneck, K.; Nordheim, A.; Biedermann, T.; Valent, P.; Bühring, H.-J. Identification of CD13, CD107a, and CD164 as novel basophil-activation markers and dissection of two response patterns in time kinetics of IgE-dependent upregulation. Cell Res. 2005, 15, 325–335. [Google Scholar] [CrossRef] [Green Version]
- Monneret, G.; Boumiza, R.; Gravel, S.; Cossette, C.; Bienvenu, J.; Rokach, J.; Powell, W.S. Effects of prostaglandin D(2) and 5-lipoxygenase products on the expression of CD203c and CD11b by basophils. J. Pharmacol. Exp. Ther. 2005, 312, 627–634. [Google Scholar] [CrossRef]
- MacGlashan, D., Jr. Marked differences in the signaling requirements for expression of CD203c and CD11b versus CD63 expression and histamine release in human basophils. Int. Arch. Allergy Immunol. 2012, 159, 243–252. [Google Scholar] [CrossRef]
- Santos, A.F.; Alpan, O.; Hoffmann, H.-J. Basophil activation test: Mechanisms and considerations for use in clinical trials and clinical practice. Allergy 2021, 76, 2420–2432. [Google Scholar] [CrossRef]
- Mahmudi-Azer, S.; Downey, G.P.; Moqbel, R. Translocation of the tetraspanin CD63 in association with human eosinophil mediator release. Blood 2002, 99, 4039–4047. [Google Scholar] [CrossRef] [Green Version]
- Galli, S.J. Mast cells and basophils. Curr. Opin. Hematol. 2000, 7, 32–39. [Google Scholar] [CrossRef]
- Varricchi, G.; Raap, U.; Rivellese, F.; Marone, G.; Gibbs, B.F. Human mast cells and basophils-How are they similar how are they different? Immunol. Rev. 2018, 282, 8–34. [Google Scholar] [CrossRef]


| Material | |
|---|---|
| Refractive index | 1.45 |
| Absorption | 0.001 |
| Dispersant | PBS |
| Temperature | 25 °C |
| Viscosity | 1.0200 cP |
| Refractive index | 1.335 |
| Measurement | |
| Angle | 173° Backscatter |
| Number of measurements | 3 |
| Molecule | DoxilTM | Unfilled | Liposome Formulation | ||||||||
|---|---|---|---|---|---|---|---|---|---|---|---|
| 0% PEG | 2% PEG | 5% PEG | |||||||||
| 1:10 | 3:10 | 5:10 | 1:10 | 3:10 | 5:10 | 1:10 | 3:10 | 5:10 | |||
| Mean size d.nm (n = 3) | 120 | 115 | 111.0 | 58.38 | 41.5 | 156.2 | 116.5 | 63.68 | 117.2 | 84.73 | 69.79 |
| Mean z-Potential mV (n = 3) | −0.42 | −0.60 | −0.51 | −0.84 | −0.42 | −0.82 | −0.05 | 1.11 | −2.08 | −1.20 | −2.28 |
Publisher’s Note: MDPI stays neutral with regard to jurisdictional claims in published maps and institutional affiliations. |
© 2022 by the authors. Licensee MDPI, Basel, Switzerland. This article is an open access article distributed under the terms and conditions of the Creative Commons Attribution (CC BY) license (https://creativecommons.org/licenses/by/4.0/).
Share and Cite
Plant-Hately, A.J.; Eryilmaz, B.; David, C.A.W.; Brain, D.E.; Heaton, B.J.; Perrie, Y.; Liptrott, N.J. Exposure of the Basophilic Cell Line KU812 to Liposomes Reveals Activation Profiles Associated with Potential Anaphylactic Responses Linked to Physico-Chemical Characteristics. Pharmaceutics 2022, 14, 2470. https://doi.org/10.3390/pharmaceutics14112470
Plant-Hately AJ, Eryilmaz B, David CAW, Brain DE, Heaton BJ, Perrie Y, Liptrott NJ. Exposure of the Basophilic Cell Line KU812 to Liposomes Reveals Activation Profiles Associated with Potential Anaphylactic Responses Linked to Physico-Chemical Characteristics. Pharmaceutics. 2022; 14(11):2470. https://doi.org/10.3390/pharmaceutics14112470
Chicago/Turabian StylePlant-Hately, Alexander J., Burcu Eryilmaz, Christopher A. W. David, Danielle E. Brain, Bethany J. Heaton, Yvonne Perrie, and Neill J. Liptrott. 2022. "Exposure of the Basophilic Cell Line KU812 to Liposomes Reveals Activation Profiles Associated with Potential Anaphylactic Responses Linked to Physico-Chemical Characteristics" Pharmaceutics 14, no. 11: 2470. https://doi.org/10.3390/pharmaceutics14112470